Embed Size (px)
Citation preview

Eng US
21 October, 2015
Q3 Presentation 2015

Eng US
• This presentation has been prepared by Duni AB (the “Company”) solely for use at this investor presentation and is furnished to you solely for your information and may not be reproduced or redistributed, in whole or in part, to any other person. By attending the meeting where this presentation is made, or by reading the presentation slides, you agree to be bound by the following limitations.
• This presentation is not for presentation or transmission into the United States or to any U.S. person, as that term is defined under Regulation S promulgated under the Securities Act of 1933, as amended.
• This presentation contains various forward-looking statements that reflect management’s current views with respect to future events and financial and operational performance. The words “believe,” “expect,” “anticipate,” “intend,” “may,” “plan,” “estimate,” “should,” “could,” “aim,” “target,” “might,” or, in each case, their negative, or similar expressions identify certain of these forward-looking statements. Others can be identified from the context in which the statements are made. These forward-looking statements involve known and unknown risks, uncertainties and other factors, which are in some cases beyond the Company’s control and may cause actual results or performance to differ materially from those expressed or implied from such forward-looking statements. These risks include but are not limited to the Company’s ability to operate profitably, maintain its competitive position, to promote and improve its reputation and the awareness of the brands in its portfolio, to successfully operate its growth strategy and the impact of changes in pricing policies, political and regulatory developments in the markets in which the Company operates, and other risks.
• The information and opinions contained in this document are provided as at the date of this presentation and are subject to change without notice.
• No representation or warranty (expressed or implied) is made as to, and no reliance should be placed on, the fairness, accuracy or completeness of the information contained herein. Accordingly, none of the Company, or any of its principal shareholders or subsidiary undertakings or any of such person’s officers or employees accepts any liability whatsoever arising directly or indirectly from the use of this document.
10/22/2014 2
Disclaimer

• Historical strong quarter in terms of operating income.
• Regained momentum in organic sales, but still short of financial target of 5%.
• Germany still behind last year, but significant growth in West and South of Europe.
• High delivery performance in spite of restructuring activities in paper mills.
• Cost control contributed to profitability in the quarter.
• High level of capital expenditure, but maintained strong cash-flow.
3
• Net sales SEK 1 043 m (997)
• Operating income SEK 146 m (129)
• Operating margin 14.0% (12.9%)
2015 Q3 Highlights

4
Operating income (LTM) on highest level since IPO
Includes discontinued operations
300
350
400
450
500
550
Market Outlook

Eng US
• HoReCa market long-term growing in line or slightly above GDP. − Higher growth in take-away, catering and fast food restaurants. − Minor growth of 1% (real) for restaurant sector in Germany, but slightly higher for
hotel sector. Improved situation in South Europe derived from increased tourism. • Stable development in real GDP, but still on relatively low growth levels. − Consumer confidence slightly down from levels seen initially in 2015. − Southern Europe stabilized with a relatively strong tourism season in 2015. − Inflation close to zero in Euro area and firm price pressure.
• Despite low inflation and relatively low commodity prices, strong USD continue to put pressure on raw materials.
• Increasing competition in mid and high end segment.
6
Market Outlook

Eng US
Business Areas

Table Top Improved growth rate, but still a slow development in Central Region

2 040
2 179 2 258
1 9002 0002 1002 2002 300
NET SALES, SEK m
2013 2014 LTM 2015
9
• Growth in majority of the markets.
• Especially significant in West and South Europe due to strong tourism season.
• Germany still behind last year, but with some improvement vs. outcome in the first half year.
• Nordic improved from negative trend, market activities in Sweden initiated.
• Napkins with continued positive growth, but table coverings slightly behind last year.
• Low indirect cost for the quarter contributed to improved profit margin.
Table Top S A L E S & O P E R A T I N G M A R G I N 1 )
Q 3 , 2 0 1 5
1) Operating margin adjusted for fair value allocations and amortization of intangible assets identified in connection with business acquisitions and for restructuring costs and market valuation of derivatives.
0%
5%
10%
15%
20%
25%
Q2 2013 Q3 2013 Q4 2013 Q1 2014 Q2 2014 Q3 2014 Q4 2014 Q1 2015 Q2 2015 Q3 2015
OPERATING MARGIN, %

Meal Service Growth clearly above Duni average; leveraging on a fast growing market segment
10

509
555
598
450500550600650
NET SALES, SEK m
2013 2014 LTM 2015
11
• Demand for take-away solutions continues to be strong and growth close to 10% for the quarter.
• In contrast to Business Area Table Top, Germany is the main market for growth; close to 20%.
• Price increases announced to customers in the third quarter to compensate for high raw material cost driven by strong USD. Effect progressively from fourth quarter.
Meal Service S A L E S & O P E R A T I N G M A R G I N 1 )
Q 3 , 2 0 1 5
1) Operating margin adjusted for fair value allocations and amortization of intangible assets identified in connection with business acquisitions and for restructuring costs and market valuation of derivatives.
-4%
-2%
0%
2%
4%
6%
8%
10%
Q2 2013 Q3 2013 Q4 2013 Q1 2014 Q2 2014 Q3 2014 Q4 2014 Q1 2015 Q2 2015 Q3 2015
OPERATING MARGIN, %

Consumer Stable result, but slightly lower sales in Germany

13
• No structural effect from acquisitions in the quarter.
• Growth in Nordic flattening out and sharp competitive environment in Germany.
• High efficiency in production enabled a stable result despite lower sales.
Consumer S A L E S & O P E R A T I N G M A R G I N 1 )
Q 3 , 2 0 1 5
603 889
1 055
0
500
1 000
1 500
NET SALES, SEK m
2013 2014 LTM 2015
1) Operating margin adjusted for fair value allocations and amortization of intangible assets identified in connection with business acquisitions and for restructuring costs and market valuation of derivatives.
-8%
-4%
0%
4%
8%
12%
16%
Q2 2013 Q3 2013 Q4 2013 Q1 2014 Q2 2014 Q3 2014 Q4 2014 Q1 2015 Q2 2015 Q3 2015
OPERATING MARGIN, %

New Markets Growth in almost all regions, except Russia
14
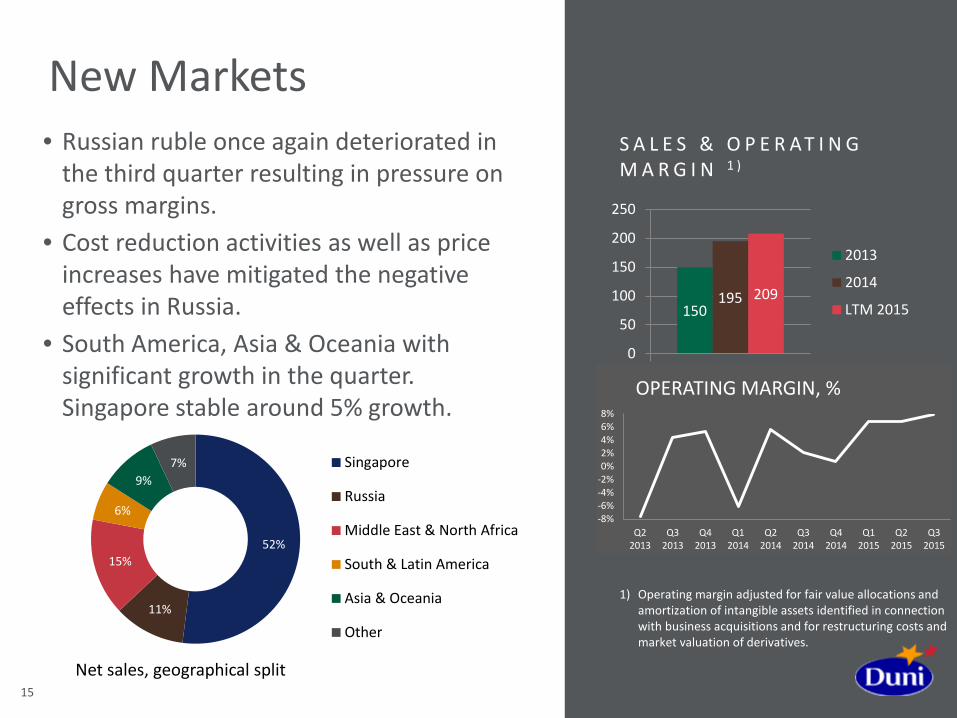
• Russian ruble once again deteriorated in the third quarter resulting in pressure on gross margins.
• Cost reduction activities as well as price increases have mitigated the negative effects in Russia.
• South America, Asia & Oceania with significant growth in the quarter. Singapore stable around 5% growth.
15
New Markets
150 195 209
0
50
100
150
200
250
2013
2014
LTM 2015
S A L E S & O P E R AT I N G M A R G I N 1 )
1) Operating margin adjusted for fair value allocations and amortization of intangible assets identified in connection with business acquisitions and for restructuring costs and market valuation of derivatives.
52%
11%
15%
6%
9% 7% Singapore
Russia
Middle East & North Africa
South & Latin America
Asia & Oceania
Other
Net sales, geographical split
-8%-6%-4%-2%0%2%4%6%8%
Q22013
Q32013
Q42013
Q12014
Q22014
Q32014
Q42014
Q12015
Q22015
Q32015
OPERATING MARGIN, %

Materials & Services
• Hygiene is no longer included in Materials & Services, but reported as discontinued operations below net profit.
• Remaining businesses are mainly external sales of tissue and airlaid plus some external services.
16

Eng US Financials

Eng US
SEK m Continuing operations
Q3 2015 Q3 2014 YTD 2015 YTD 2014 LTM 2014/2015
FY 2014
Net sales 1 043 997 3 030 2 736 4 164 3 870
Gross profit 311 295 883 781 1 235 1 134
Gross margin 29.9% 29.6% 29.1% 28.6% 29.7% 29.3%
Selling expenses -112 -108 -353 -334 -475 -456
Administrative expenses -59 -58 -176 -154 -233 -211
R & D expenses -2 -3 -8 -9 -10 -11
Other operating net 0 -6 -9 -8 -24 -23
EBIT 139 119 337 277 493 433
Adjustments -7 -9 -20 -11 -28 -18
Operating income 1) 146 129 357 288 521 452
Operating margin 14.0% 12.9% 11.8% 10.5% 12.5% 11.7%
Financial net -10 -5 -22 -9 -32 -19
Taxes -31 -30 -78 -71 -120 -113
Net income 99 84 237 197 342 302
Earnings per share 2.10 1.80 5.05 4.19 7.27 6.42
18
Historically strong Q3
1) Operating income adjusted for fair value allocations and amortization of intangible assets identified in connection with business acquisitions and for restructuring costs and market valuation of derivatives.

Eng US
SEK m Q3 2015 Q3 2014 YTD 2015 YTD 2014 LTM 2014/2015
FY 2014
Table Top Net Sales Operating income 1)
Operating margin
578 109
18.9%
545 97
17.8%
1 654 274
16.6%
1 575 247
15.7%
2 258 399
17.7%
2 179 373
17.1%
Meal Service Net Sales Operating income 1) Operating margin
155 10
6.3%
140 8
5.4%
454 25
5.5%
411 14
3.3%
598 31
5.1%
555 19
3.5%
Consumer Net Sales Operating income 1) Operating margin
245 21
8.6%
249 22
8.9%
733 44
6.0%
567 22
4.0%
1 055 76
7.2%
889 54
6.1%
New Markets Net Sales Operating income 1) Operating margin
53 4
7.9%
50 1
2.2%
155 11
7.2%
142 1
0.8%
209 12
5.5%
195 1
0.8%
Materials & Services
Net Sales Operating income 1) Operating margin
11 2
15.8%
13 1
9.3%
34 3
8.8%
42 4
8.8%
45 4
8.2%
52 4
8.2%
Continuing operations
Net Sales Operating income 1) Operating margin
1 043 146
14.0%
997 129
12.9%
3 030 357
11.8%
2 736 288
10.5%
4 164 521
12.5%
3 870 452
11.7%
Discontinued operations
Net Sales Operating income 1) Operating margin
2 0
-7.0%
103 3
2.9%
83 5
6.2%
302 18
5.8%
160 10
6.5%
379 23
6.0%
Duni Total Net Sales Operating income 1) Operating margin
1 045 146
14.0%
1 100 132
12.0%
3 113 362
11.6%
3 037 306
10.1%
4 324 532
12.3%
4 249 475
11.2%
19
Improvements in most Segments
1) Operating income adjusted for fair value allocations and amortization of intangible assets identified in connection with business acquisitions and for restructuring costs and market valuation of derivatives.

Eng US
SEK m Continuing operations
Q3 2015 Q3 2014 YTD 2015 YTD 2014 LTM 2014/2015
FY 2014
EBITDA from continuing operations 1)
177 160 452 375 648 572
Capital expenditure -53 -20 -105 -52 -140 -87
Change in; Inventory -35 -52 -83 -84 -16 -17
Accounts receivable -39 1 -24 -32 -4 -12
Accounts payable -15 13 -3 -21 3 -16
Other operating working capital
49 25 22 50 4 32
Change in working capital -40 -13 -88 -88 -12 -12
Operating cash flow 84 128 258 235 496 472
20
High capex level
1) Operating income adjusted for fair value allocations and amortization of intangible assets identified in connection with business acquisitions and for restructuring costs and market valuation of derivatives.
Cash flow for continuing operations.

Eng US
SEK m September 2015 December 2014 September 2014 Goodwill 1 461 1 463 1 488
Tangible and intangible fixed assets
1 144 1 162 1 088
Net financial assets 1) -42 -1 53
Inventories 571 503 559
Accounts receivable 727 743 758
Accounts payable -311 -341 -342
Other operating assets and liabilities 3)
-449 -448 -453
Net assets 3 100 3 081 3 152
Net debt 867 888 1 061
Equity 2 233 2 193 2 091
Equity and net debt 3 100 3 081 3 152
ROCE 2) 17% 15% 15%
ROCE 2) w/o Goodwill 34% 31% 29%
Net debt / Equity 39% 41% 51%
Net debt / EBITDA 2) 1.34 1.55 1.92
21
Strong financial position
1) Deferred tax assets and liabilities + Income tax receivables and payables. 2) Operating income adjusted for fair value allocations and amortization of intangible assets identified in connection with business
acquisitions and for restructuring costs and market valuation of derivatives. Calculated based on the last twelve months, continuing operations.
3) Including restructuring provision and derivatives.

Eng US
22
Organic growth of 5% over a business cycle Consider acquisitions to reach new markets or to strengthen current market positions
Top line growth – premium focus Improvements in manufacturing, sourcing and logistics
Target at least 40% of net profit
> 5%
> 10%
40+%
Sales growth
Operating margin
Dividend payout ratio
LTM
1.5% at fixed exchange rates,
excluding hygiene business1)
LTM
12.5%
2014
4.50 SEK per share

Thank you!