Embed Size (px)
Citation preview

Q3 & 9M FY2016/17 Financial Results
10 February 2017
1
Agenda
The following presentation contains forward looking statements by the management of Singapore Post Limited (“SingPost”) relating to financial trends for future periods, compared to the results for previous periods.
Some of the statements contained in this presentation that are not historical facts are statements of future expectations with respect to the financial conditions, results of operations and businesses, and related plans
and objectives. Forward looking information is based on management's current views and assumptions including, but not limited to, prevailing economic and market conditions. These statements involve known and
unknown risks and uncertainties that could cause actual results, performance or events to differ materially from those in the statements as originally made. Such statements are not, and should not be construed as a
representation as to future performance of SingPost. In particular, such targets should not be regarded as a forecast or projection of future performance of SingPost. It should be noted that the actual performance of
SingPost may vary significantly from such statements.
“$” means Singapore dollars unless otherwise indicated.
eCommerce-Related Revenues
Segmental Results
Business & Corporate Updates
Q3 & 9M FY2016/17 Financials
Summary & Outlook
Supplementary Information

2
Q3 FY2016/17: Underlying net profit declined 28.5%, due largely to investments in business transformation and decline in domestic letter mail volumes
Q3 FY2016/17 P&L, $M
4 February 2016
Revenue growth due to inclusion of US eCommerce acquisitions
Underlying Net Profit declined 28.5% due to operating losses in the US eCommerce business, costs related to the new Regional eCommerce Logistics Hub, as well as lower domestic letter mail volumes.
Q3 FY16/17 Q3 FY15/16 YoY
% change
Revenue 369.4 316.2 +16.8%
Other income and gains Rental and property-related income
Miscellaneous
9.1
(1.8)
9.3 3.0
(1.4%)
N.M.
Total expenses 337.0 273.3 +23.3%
Operating Profit 37.3 54.6 (31.7%)
Share of associated companies & JVs (0.2) 0.2 N.M.
Net profit attributable to equity holders 31.4 43.5 (27.9%)
Underlying Net Profit 31.4 43.9 (28.5%)
N.M.: Not meaningful

3
Revenue movement
Q3 FY2015/16 vs. Q3 FY2016/17 Revenue performance, $M
Differences in total due to rounding 1. The acquisitions of TradeGlobal and Jagged Peak were completed in November 2015 and March 2016 respectively.
39.2
81.1
+5.6%
+2.9% Growth in International mail revenue driven by higher cross-border eCommerce related deliveries, in particular higher volumes from the Alibaba Group
+106.8%
Inter-segment eliminations
Postal
Logistics
+16.8%
eCommerce
316.2
Q3 FY16/17
369.4
Q3 FY15/16
Led by increased eCommerce Logistics volumes on the network
Inclusion of US acquisitions – TradeGlobal and Jagged Peak1
162.2 171.3
139.3 143.4
(26.3) (24.6)

4
Increased expenses with consolidation of acquisitions and change in business mix
Favourable non-trade related forex translation differences compared to same period last year
Total expenses Q3 FY2016/17 breakdown, $M
Higher headcount post acquisitions
N.M.: Not meaningful Differences in total due to rounding 1. The building obtained Temporary Occupation Permit or TOP in April 2016, and was officially opened on 1 November 2016
Depreciation on Regional eCommerce Logistics Hub1
Q3 FY16/17 Q3 FY15/16 YoY % change
Labour & related 88.4 74.0 +19.4%
Volume-related 196.2 151.9 +29.2%
Traffic & related Outsourcing services and delivery expenses
105.9 90.3
92.3 59.6
+14.7% +51.6%
Admin & others 37.7 33.7 +11.9%
Depreciation & amortisation 12.9 10.2 +26.3%
Selling 3.5 3.2 +11.1%
Finance expense (1.7) 0.4 N.M.
Total expenses 337.0 273.3 +23.3%
Largely due to cost of sales and outsourced services related to TradeGlobal & Jagged Peak respectively
Largely due to higher International mail terminal dues

5
Operating Profit
(6.6%)
(48.9%) Mainly due to unrealised trade-related forex translation differences
(30.2%)
Q3 FY2015/16 vs. Q3 FY2016/17 Operating Profit performance, $M
Postal
-31.7%
Property & Others
Q3 FY16/17 Q3 FY15/16
Largely due to a decline in Domestic mail operating profit in line with lower letter mail volumes
Reflects costs incurred in relation to the Regional eCommerce Logistics Hub, as well as pricing pressures in the eCommerce Logistics space
N.M.: Not meaningful Differences in total due to rounding 1. Details are listed on slide 18
eCommerce
Logistics
N.M. Impacted by higher costs and challenges in the US eCommerce business.1
1.8
(8.4) (1.1)
(1.7)
41.3 38.5
12.7
8.8
37.3
54.6
6
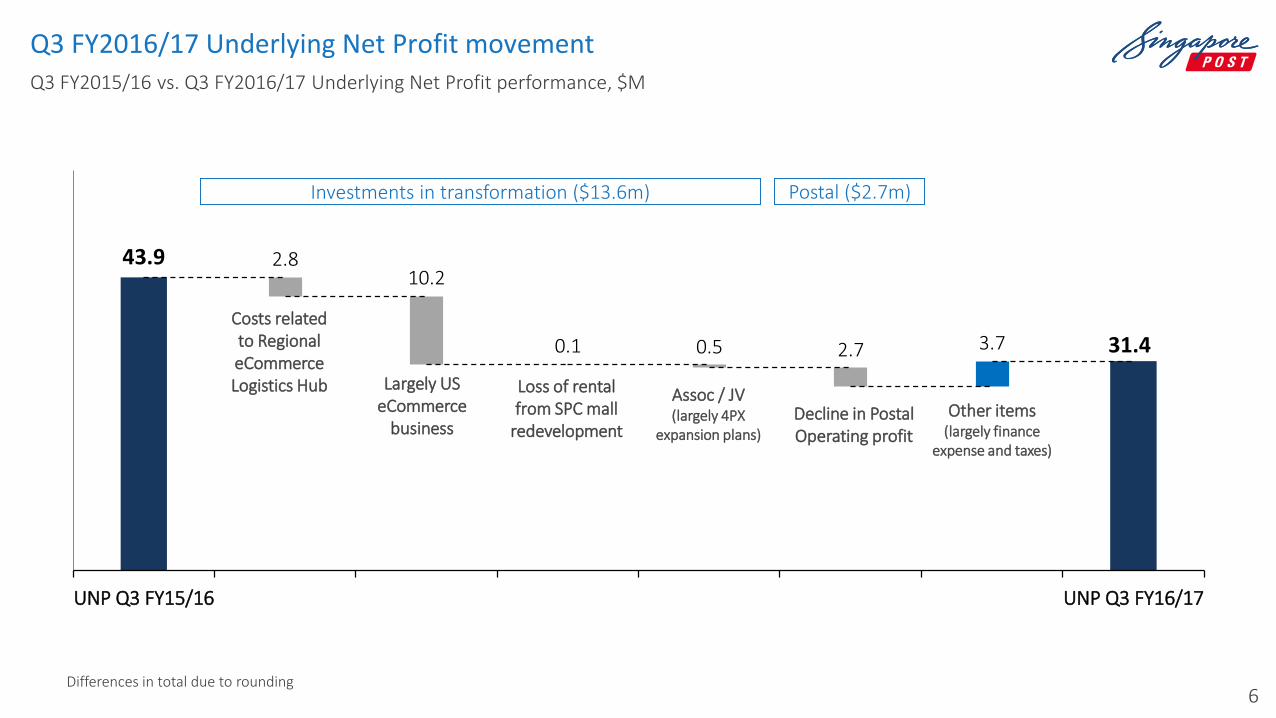
Q3 FY2016/17 Underlying Net Profit movement Q3 FY2015/16 vs. Q3 FY2016/17 Underlying Net Profit performance, $M
43.9
31.4 3.7
2.8 10.2
0.1 0.5 2.7
UNP Q3 FY15/16 eLog Hubrelated costs
eCommerce SPC Mall Assoc / JV Postal All Others UNP Q3 FY16/17
Largely US eCommerce
business
Costs related to Regional eCommerce Logistics Hub
Assoc / JV (largely 4PX
expansion plans)
Investments in transformation ($13.6m) Postal ($2.7m)
Loss of rental from SPC mall
redevelopment
Decline in Postal Operating profit
Other items (largely finance
expense and taxes)
Differences in total due to rounding

7
9M FY2016/17 Profit & Loss Statement
9M FY2016/17 P&L, $M
4 February 2016
9M FY16/17 9M FY15/16 YoY
% change
Revenue 1,024.5 834.0 +22.8%
Other income and gains Rental and property-related income
Miscellaneous
27.8 7.3
29.9 46.2
(7.1%)
(84.1%)
Total expenses 932.8 737.1 +26.6%
Operating Profit 124.8 176.8 (29.4%)
Share of associated companies & JVs 0.7 3.6 (80.5%)
Net profit attributable to equity holders 98.6 143.5 (31.3%)
Underlying Net Profit 94.2 121.8 (22.6%)
Revenue growth driven by the inclusion of US acquisitions
Underlying Net Profit declined 22.6% due to operating losses in the US eCommerce business, costs related to the new Regional eCommerce Logistics Hub, loss of rental income from SPC mall redevelopment, as well as lower domestic letter mail volumes.
Operating Profit and Net Profit declined due largely to one-off gains from divestments last year
8
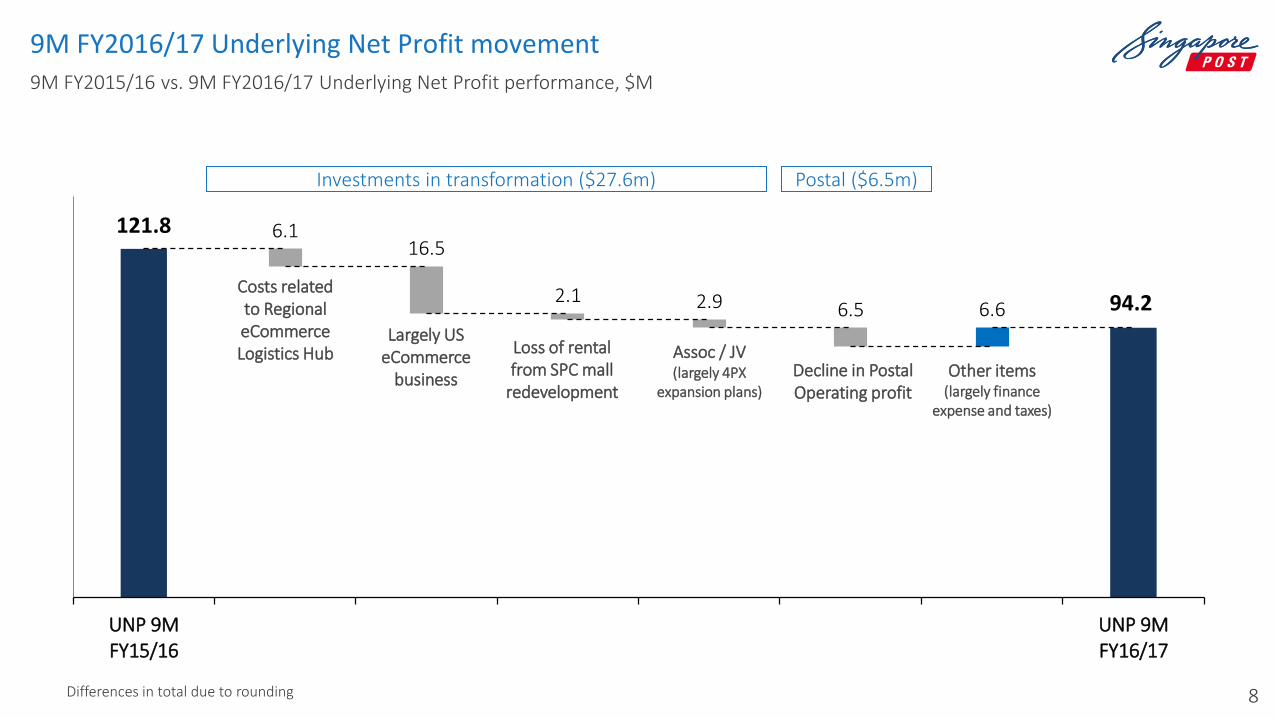
9M FY2016/17 Underlying Net Profit movement 9M FY2015/16 vs. 9M FY2016/17 Underlying Net Profit performance, $M
121.8
94.2 6.6
6.1 16.5
2.1 2.9 6.5
UNP 9MFY15/16
eLog Hubrelated costs
eCommercebusiness
SPC Mall loss ofrental income
Assoc / JV Postal All Others UNP 9MFY16/17
Other items (largely finance
expense and taxes)
Investments in transformation ($27.6m) Postal ($6.5m)
Costs related to Regional eCommerce Logistics Hub
Assoc / JV (largely 4PX
expansion plans)
Loss of rental from SPC mall
redevelopment
Decline in Postal Operating profit
Largely US eCommerce
business
Differences in total due to rounding

9
Cash flow 9M FY16/17 9M FY15/16
Operating cash flow (before working capital changes) Changes in working capital
Net cash provided by operating activities
158.1 24.0
152.5
162.3 (60.7)
72.0
Cash flow used in investing activities (65.4) (463.9)
Cash flow (used in) / provided by financing activities 15.4 (7.1)
Net increase / (decrease) in cash & cash equivalents 102.4 (399.1)
Financial indicators As at
Dec 2016 As at
Mar 2016
Cash & cash equivalents at end of financial period 229.1 126.6
Borrowings 414.9 280.3
Net debt position 185.8 153.6
EBITDA to interest expense (times) 24.7 29.81
Net debt to ordinary shareholders equity (%) 14.9% 12.8%
Balance sheet & financial indicators $M, unless otherwise stated
Interest coverage ratio remains strong. Including one-off divestment gains, the ratio in March was 42.1x
Increased borrowings with cash and short-term funds utilised for committed capital expenditure
Included capital expenditure for the Logistics Hub and SPC retail mall, partially offset by proceeds from partial divestment of Quantium Solutions International
Higher due to increased borrowings
Net cash from operating activities rose to $152.5million, boosted by positive changes in working capital
1. Excludes one-off divestment gains

10
Agenda
The following presentation contains forward looking statements by the management of Singapore Post Limited (“SingPost”) relating to financial trends for future periods, compared to the results for previous periods.
Some of the statements contained in this presentation that are not historical facts are statements of future expectations with respect to the financial conditions, results of operations and businesses, and related plans
and objectives. Forward looking information is based on management's current views and assumptions including, but not limited to, prevailing economic and market conditions. These statements involve known and
unknown risks and uncertainties that could cause actual results, performance or events to differ materially from those in the statements as originally made. Such statements are not, and should not be construed as a
representation as to future performance of SingPost. In particular, such targets should not be regarded as a forecast or projection of future performance of SingPost. It should be noted that the actual performance of
SingPost may vary significantly from such statements.
“$” means Singapore dollars unless otherwise indicated.
eCommerce-Related Revenues
Segmental Results
Business & Corporate Updates
Q3 & 9M FY2016/17 Financials
Summary & Outlook
Supplementary Information

11
eCommerce-related revenues now 50.3% of Group revenue
555.8
834.0
278.1 eCommerce
related
9M FY15/16
Non eCommerce
related
33.4%
Differences in total due to rounding
$210.4M
41%
eCommerce
29%
Postal 31%
Logistics
$515.7M
Group Revenue
9M FY16/17
515.7
508.8
1,024.5
50.3%
$105.9M
$55.1M
$117.1M
20%
eCommerce
38%
Postal 42%
Logistics
9M FY15/16 9M FY16/17
$278.1M
Revenue performance, 9M FY2015/16 vs 9M FY2016/17, $M
$147.7M
$157.6M

12
Overseas revenue now 51.4% of Group revenue Group revenue footprint 9M FY2015/16 vs 9M FY2016/17, $M
9M FY15/16
Overseas
9M FY16/17
Domestic
Differences in total due to rounding
Group Revenue
US 36%
$526.7M
Australia 27%
Asia 27%
Europe 10%
41.9%
51.4%
834.0
1,024.5
484.8
349.1
497.8
526.7
13
Agenda
The following presentation contains forward looking statements by the management of Singapore Post Limited (“SingPost”) relating to financial trends for future periods, compared to the results for previous periods.
Some of the statements contained in this presentation that are not historical facts are statements of future expectations with respect to the financial conditions, results of operations and businesses, and related plans
and objectives. Forward looking information is based on management's current views and assumptions including, but not limited to, prevailing economic and market conditions. These statements involve known and
unknown risks and uncertainties that could cause actual results, performance or events to differ materially from those in the statements as originally made. Such statements are not, and should not be construed as a
representation as to future performance of SingPost. In particular, such targets should not be regarded as a forecast or projection of future performance of SingPost. It should be noted that the actual performance of
SingPost may vary significantly from such statements.
“$” means Singapore dollars unless otherwise indicated.
eCommerce-Related Revenues
Segmental Results
Business & Corporate Updates
Q3 & 9M FY2016/17 Financials
Summary & Outlook
Supplementary Information
14
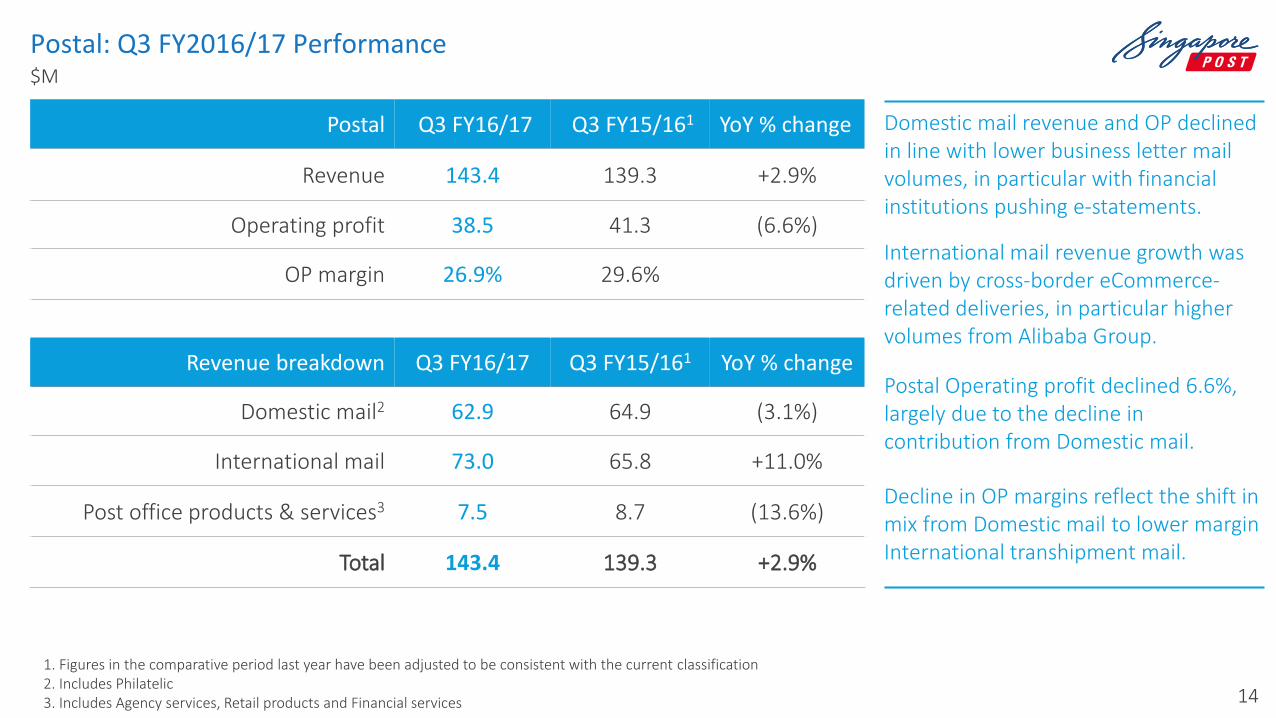
Postal: Q3 FY2016/17 Performance $M
1. Figures in the comparative period last year have been adjusted to be consistent with the current classification 2. Includes Philatelic 3. Includes Agency services, Retail products and Financial services
Postal Q3 FY16/17 Q3 FY15/161 YoY % change
Revenue 143.4 139.3 +2.9%
Operating profit 38.5 41.3 (6.6%)
OP margin 26.9% 29.6%
Revenue breakdown Q3 FY16/17 Q3 FY15/161 YoY % change
Domestic mail2 62.9 64.9 (3.1%)
International mail 73.0 65.8 +11.0%
Post office products & services3 7.5 8.7 (13.6%)
Total 143.4 139.3 +2.9%
Domestic mail revenue and OP declined in line with lower business letter mail volumes, in particular with financial institutions pushing e-statements.
International mail revenue growth was driven by cross-border eCommerce-related deliveries, in particular higher volumes from Alibaba Group.
Decline in OP margins reflect the shift in mix from Domestic mail to lower margin International transhipment mail.
Postal Operating profit declined 6.6%, largely due to the decline in contribution from Domestic mail.
15
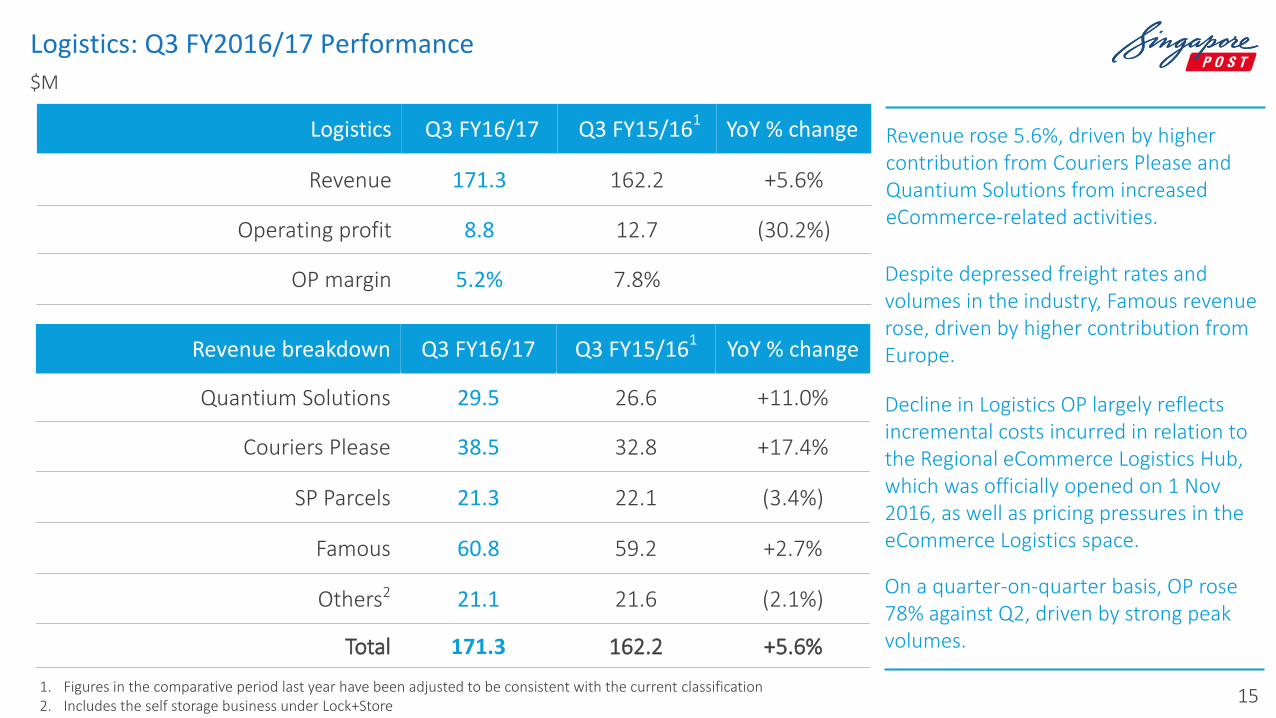
Logistics: Q3 FY2016/17 Performance $M
1. Figures in the comparative period last year have been adjusted to be consistent with the current classification 2. Includes the self storage business under Lock+Store
Logistics Q3 FY16/17 Q3 FY15/161 YoY % change
Revenue 171.3 162.2 +5.6%
Operating profit 8.8 12.7 (30.2%)
OP margin 5.2% 7.8%
Revenue breakdown Q3 FY16/17 Q3 FY15/161 YoY % change
Quantium Solutions 29.5 26.6 +11.0%
Couriers Please 38.5 32.8 +17.4%
SP Parcels 21.3 22.1 (3.4%)
Famous 60.8 59.2 +2.7%
Others2 21.1 21.6 (2.1%)
Total 171.3 162.2 +5.6%
Revenue rose 5.6%, driven by higher contribution from Couriers Please and Quantium Solutions from increased eCommerce-related activities.
Decline in Logistics OP largely reflects incremental costs incurred in relation to the Regional eCommerce Logistics Hub, which was officially opened on 1 Nov 2016, as well as pricing pressures in the eCommerce Logistics space.
On a quarter-on-quarter basis, OP rose 78% against Q2, driven by strong peak volumes.
Despite depressed freight rates and volumes in the industry, Famous revenue rose, driven by higher contribution from Europe.

16
eCommerce: Q3 FY2016/17 Performance $M
N.M.: Not meaningful
1.Figures in the comparative period last year have been adjusted to be consistent with the current classification 2.Revenue and operating profit contribution of end-to-end eCommerce customers using warehousing, freight, last mile and/or customer care services are reported under the Logistics segment
eCommerce Q3 FY16/17 Q3 FY15/161 YoY % change
Revenue 81.1 39.2 +106.8%
Operating profit (8.4) 1.8 N.M.
OP margin (10.4%) +4.6%
Revenue breakdown Q3 FY16/17 Q3 FY15/161 YoY % change
TradeGlobal 41.2 29.4 +40.1%
Jagged Peak 32.4 - N.M.
SP eCommerce2 7.6 9.8 (23.2%)
Total 81.1 39.2 +106.8%
eCommerce revenue rose with the inclusion of US acquisitions TradeGlobal and Jagged Peak.
TradeGlobal faced cost pressures and challenges, while Jagged Peak exceeded revenue and operating profit targets. Please refer to slide 18 for details.

17
Agenda
The following presentation contains forward looking statements by the management of Singapore Post Limited (“SingPost”) relating to financial trends for future periods, compared to the results for previous periods.
Some of the statements contained in this presentation that are not historical facts are statements of future expectations with respect to the financial conditions, results of operations and businesses, and related plans
and objectives. Forward looking information is based on management's current views and assumptions including, but not limited to, prevailing economic and market conditions. These statements involve known and
unknown risks and uncertainties that could cause actual results, performance or events to differ materially from those in the statements as originally made. Such statements are not, and should not be construed as a
representation as to future performance of SingPost. In particular, such targets should not be regarded as a forecast or projection of future performance of SingPost. It should be noted that the actual performance of
SingPost may vary significantly from such statements.
“$” means Singapore dollars unless otherwise indicated.
eCommerce-Related Revenues
Segmental Results
Business & Corporate Updates
Q3 & 9M FY2016/17 Financials
Summary & Outlook
Supplementary Information

18
Update on US eCommerce performance over the holiday season
• We prioritised customer satisfaction over the peak period, which is critical to the long-term success of the business. We succeeded and achieved good service level performance in fulfilling peak period orders.
• Revenue and operating profit were impacted by developments at two of our key customers:
• One of TradeGlobal’s largest customers faced financial difficulties, and we reduced our business with them as part of risk mitigation. The customer has since filed for bankruptcy under Chapter 11 of the US Bankruptcy Code.
• Another key customer had decided to in-source its eCommerce freight operations.
• Cost pressures:
• Due to labour shortage in the Cincinnati area, higher costs were incurred for temporary fulfilment labour.
• Warehouse automation and new customer implementation efforts took longer than expected, which impacted productivity.
TradeGlobal – delivered customer satisfaction; revenue and operating profit impacted by challenges in the operating environment
• We had good growth in volumes and revenue, and generated positive earnings for the Group.
• Jagged Peak also achieved new customer wins.
Jagged Peak : a successful holiday season

19
Completion of Second Investment Agreement with the Alibaba Group
Deepening strategic partnership
• On 27 October 2016, Alibaba invested S$86.2 million for a 34% stake in Quantium Solutions International, with SingPost owning the remaining 66%.
• On 11 January 2017, SingPost completed the issuance of 107,553,907 new shares to Alibaba Investment Limited for S$187.1 million, which increased their stake in SingPost from 10.2% to 14.4%.
Structure upon completion
Joint Venture
34% 66%
Other shareholders
Other businesses
14.4%
Alibaba Group
63.9%
Singtel
21.7%
20
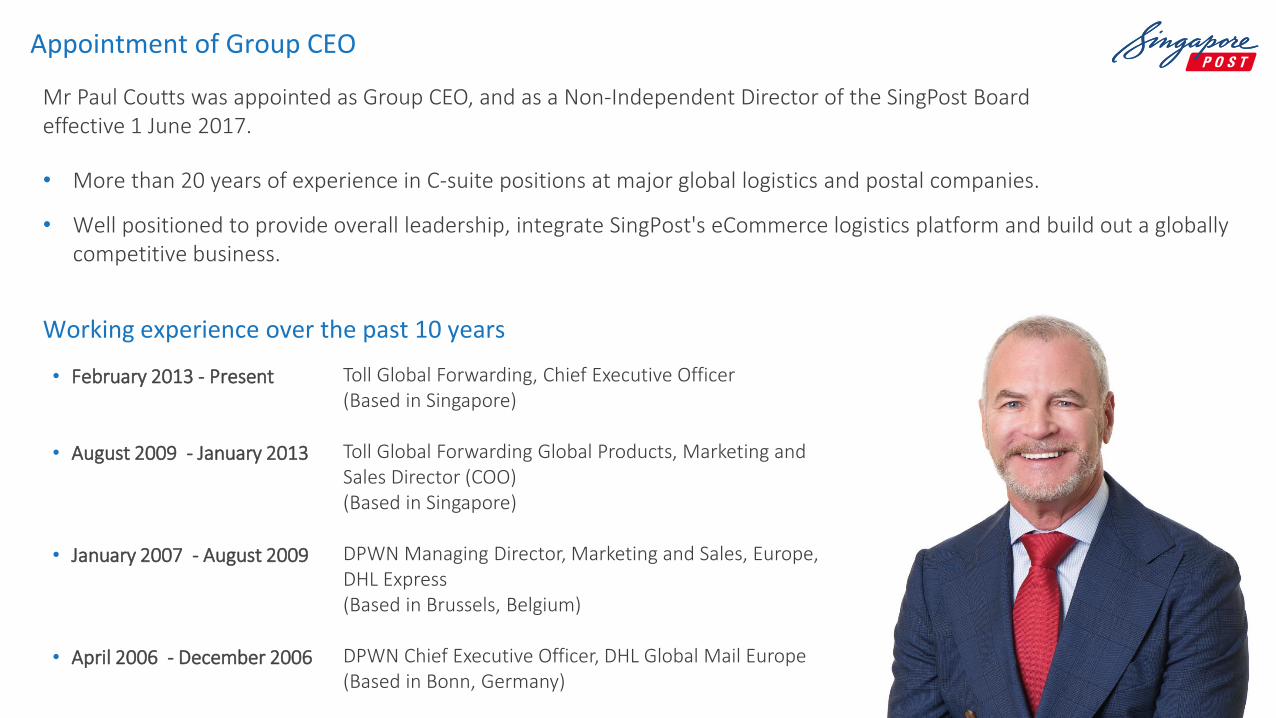
Appointment of Group CEO
Mr Paul Coutts was appointed as Group CEO, and as a Non-Independent Director of the SingPost Board effective 1 June 2017.
• More than 20 years of experience in C-suite positions at major global logistics and postal companies.
• Well positioned to provide overall leadership, integrate SingPost's eCommerce logistics platform and build out a globally competitive business.
Working experience over the past 10 years
• February 2013 - Present
• August 2009 - January 2013
• January 2007 - August 2009
• April 2006 - December 2006
Toll Global Forwarding, Chief Executive Officer (Based in Singapore) Toll Global Forwarding Global Products, Marketing and Sales Director (COO) (Based in Singapore) DPWN Managing Director, Marketing and Sales, Europe, DHL Express (Based in Brussels, Belgium) DPWN Chief Executive Officer, DHL Global Mail Europe (Based in Bonn, Germany)

21
Agenda
The following presentation contains forward looking statements by the management of Singapore Post Limited (“SingPost”) relating to financial trends for future periods, compared to the results for previous periods.
Some of the statements contained in this presentation that are not historical facts are statements of future expectations with respect to the financial conditions, results of operations and businesses, and related plans
and objectives. Forward looking information is based on management's current views and assumptions including, but not limited to, prevailing economic and market conditions. These statements involve known and
unknown risks and uncertainties that could cause actual results, performance or events to differ materially from those in the statements as originally made. Such statements are not, and should not be construed as a
representation as to future performance of SingPost. In particular, such targets should not be regarded as a forecast or projection of future performance of SingPost. It should be noted that the actual performance of
SingPost may vary significantly from such statements.
“$” means Singapore dollars unless otherwise indicated.
eCommerce-Related Revenues
Segmental Results
Business & Corporate Updates
Q3 & 9M FY2016/17 Financials
Summary & Outlook
Supplementary Information
22
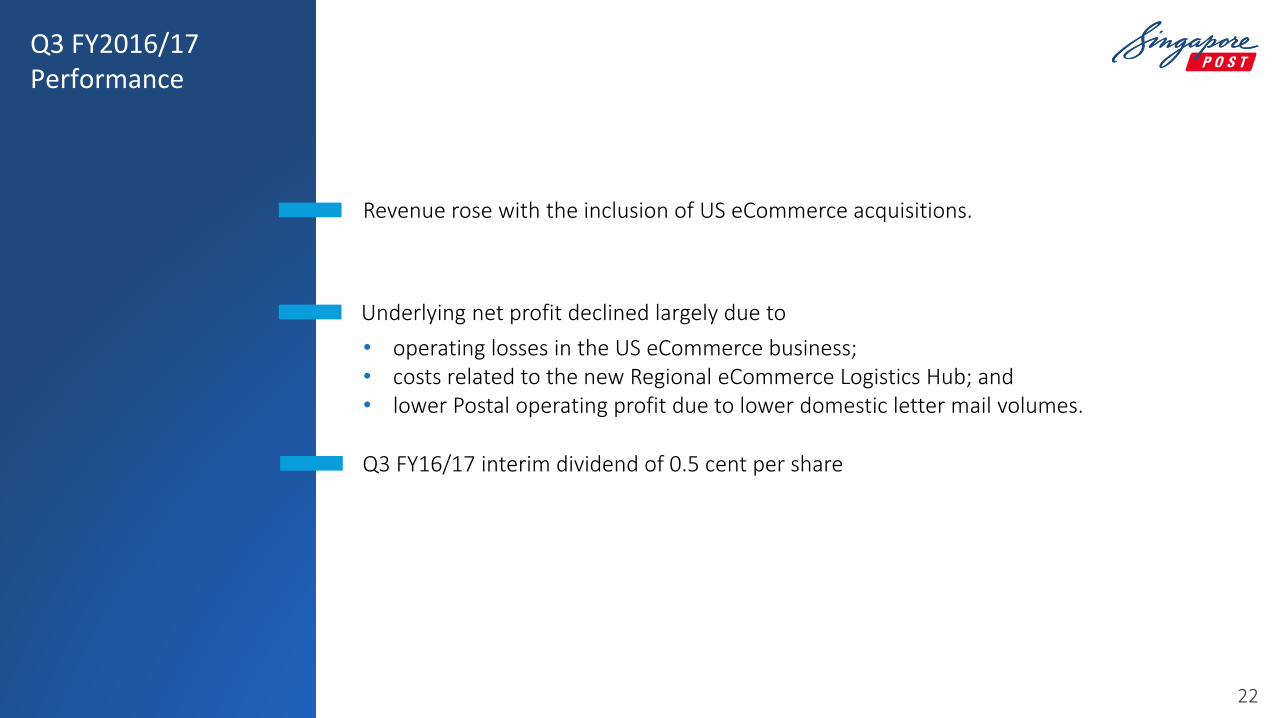
Q3 FY2016/17 Performance
Revenue rose with the inclusion of US eCommerce acquisitions.
Underlying net profit declined largely due to
• operating losses in the US eCommerce business; • costs related to the new Regional eCommerce Logistics Hub; and • lower Postal operating profit due to lower domestic letter mail volumes.
Q3 FY16/17 interim dividend of 0.5 cent per share

23
Outlook
SingPost continues to build its capabilities to transform from a Singapore postal company into a leading eCommerce logistics provider, which is fundamental to securing its future. SingPost has been working to integrate acquisitions and this will remain a priority. In the Postal segment, Domestic mail remains under pressure with declining volumes but the impact was partially offset by growth from International mail volumes. The shift in revenue mix towards International mail will lead to a decline in margins on a blended basis. While the Logistics segment is expected to benefit from growing eCommerce trends, the industry faces tight operating margins. The focus is to increase volumes on the network so as to derive operating leverage from economies of scale but this will take time. The Regional eCommerce Logistics Hub obtained TOP in April 2016 and enhanced SingPost’s eCommerce logistics capabilities in the region. The facility has resulted in higher depreciation and operating expenses. This is a long-term investment, and there will not be any immediate benefits to the bottom line.

24
Outlook (continued)
The eCommerce segment operates in an environment where margins are under pressure amid intense competition and changing consumer behaviour. The Group is facing challenges in the operating environment in the US. For the nine months ended 31 December 2016, TradeGlobal has not achieved the underlying profit assumptions of the business plan which supported the investment. TradeGlobal incurred a significant loss instead of a projected profit in the third quarter peak season and it is expected to make a loss for the full year. The business is being restructured to improve its performance. Due to the poor performance of TradeGlobal, the Board of SingPost is of the view that there is a risk of significant impairment to TradeGlobal’s carrying value. The Board will also be conducting a review of all the investments of SingPost. Impairments, if any, will be assessed based on the full financial year results and future plans for the businesses.

25
Outlook (continued)
The redevelopment of SPC retail mall is expected to be completed around mid-2017, and leasing of the mall is on track. The Group continues to forgo rental income during the redevelopment. For the rest of FY2016/17, there will be residual capital expenditure committed for the redevelopment of the SPC retail mall. On 11 January 2017, SingPost completed the issuance of new shares to the Alibaba Group. This increased Alibaba’s stake in SingPost to 14.4 per cent, up from 10.2 per cent, and has deepened the strategic partnership.

26
Agenda
The following presentation contains forward looking statements by the management of Singapore Post Limited (“SingPost”) relating to financial trends for future periods, compared to the results for previous periods.
Some of the statements contained in this presentation that are not historical facts are statements of future expectations with respect to the financial conditions, results of operations and businesses, and related plans
and objectives. Forward looking information is based on management's current views and assumptions including, but not limited to, prevailing economic and market conditions. These statements involve known and
unknown risks and uncertainties that could cause actual results, performance or events to differ materially from those in the statements as originally made. Such statements are not, and should not be construed as a
representation as to future performance of SingPost. In particular, such targets should not be regarded as a forecast or projection of future performance of SingPost. It should be noted that the actual performance of
SingPost may vary significantly from such statements.
“$” means Singapore dollars unless otherwise indicated.
eCommerce-Related Revenues
Segmental Results
Business & Corporate Updates
Q3 & 9M FY2016/17 Financials
Summary & Outlook
Supplementary Information
27
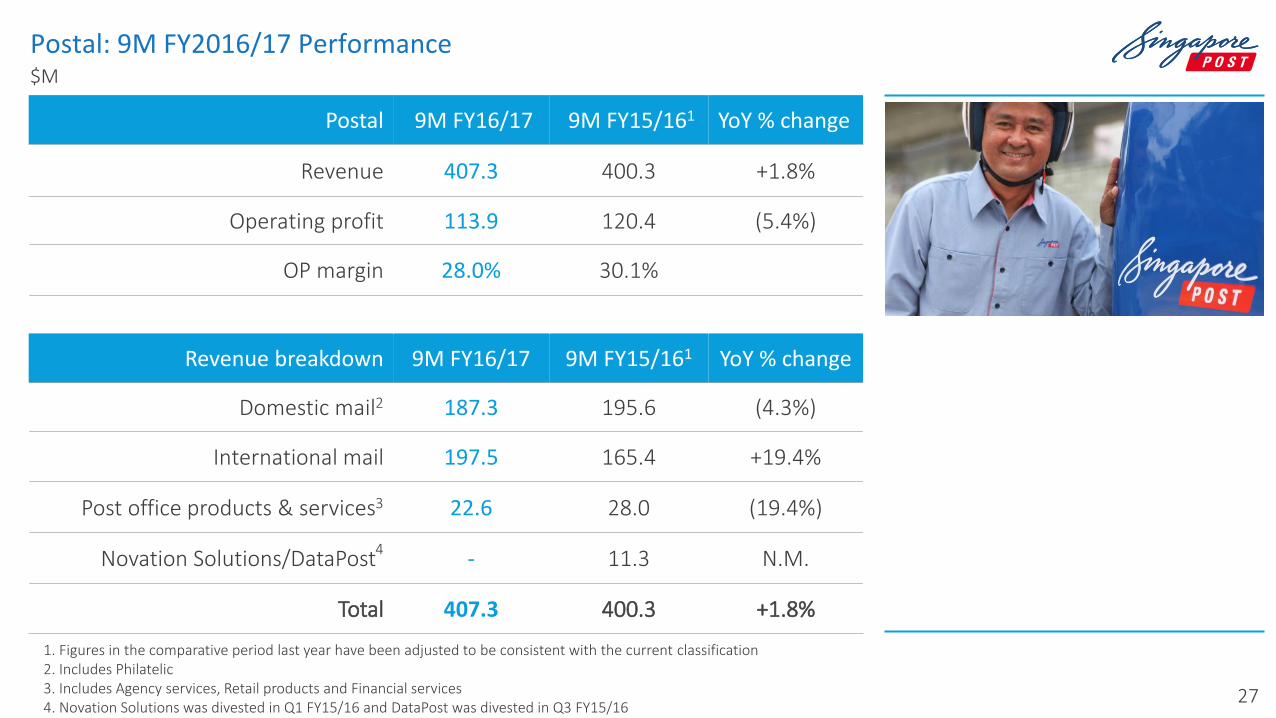
Postal: 9M FY2016/17 Performance $M
Postal 9M FY16/17 9M FY15/161 YoY % change
Revenue 407.3 400.3 +1.8%
Operating profit 113.9 120.4 (5.4%)
OP margin 28.0% 30.1%
Revenue breakdown 9M FY16/17 9M FY15/161 YoY % change
Domestic mail2 187.3 195.6 (4.3%)
International mail 197.5 165.4 +19.4%
Post office products & services3 22.6 28.0 (19.4%)
Novation Solutions/DataPost4 - 11.3 N.M.
Total 407.3 400.3 +1.8%
1. Figures in the comparative period last year have been adjusted to be consistent with the current classification 2. Includes Philatelic 3. Includes Agency services, Retail products and Financial services 4. Novation Solutions was divested in Q1 FY15/16 and DataPost was divested in Q3 FY15/16
28
Logistics: 9M FY2016/17 Performance $M
Logistics 9M FY16/17 9M FY15/161 YoY % change
Revenue 482.1 458.4 +5.2%
Operating profit 21.0 27.2 (22.7%)
OP margin 4.4% 5.9%
Revenue breakdown 9M FY16/17 9M FY15/161 YoY % change
Quantium Solutions 84.4 80.8 +4.5%
Couriers Please 107.4 93.3 +15.1%
SP Parcels 58.2 59.4 (2.1%)
Famous 173.0 166.8 +3.7%
Others2 59.0 58.1 +1.5%
Total 482.1 458.4 +5.2%
1. Figures in the comparative period last year have been adjusted to be consistent with the current classification 2. Includes the self storage business under Lock+Store

29
eCommerce: 9M FY2016/17 Performance $M
eCommerce 9M FY16/17 9M FY15/161 YoY % change
Revenue 210.4 55.1 +281.7%
Operating profit (18.7) (2.2) @
OP margin (8.9%) (4.0%)
Revenue breakdown 9M FY16/17 9M FY15/161 YoY % change
TradeGlobal 101.7 29.4 +246.1%
Jagged Peak 82.6 - N.M.
SP eCommerce2 26.1 25.7 +1.3%
Total 210.4 55.1 +281.7%
N.M.: Not meaningful @ denotes variance exceeding 300% 1.Figures in the comparative period last year have been adjusted to be consistent with the current classification 2.Revenue and operating profit contribution of end-to-end eCommerce customers using warehousing, freight, last mile and/or customer care services are reported under the Logistics segment
30
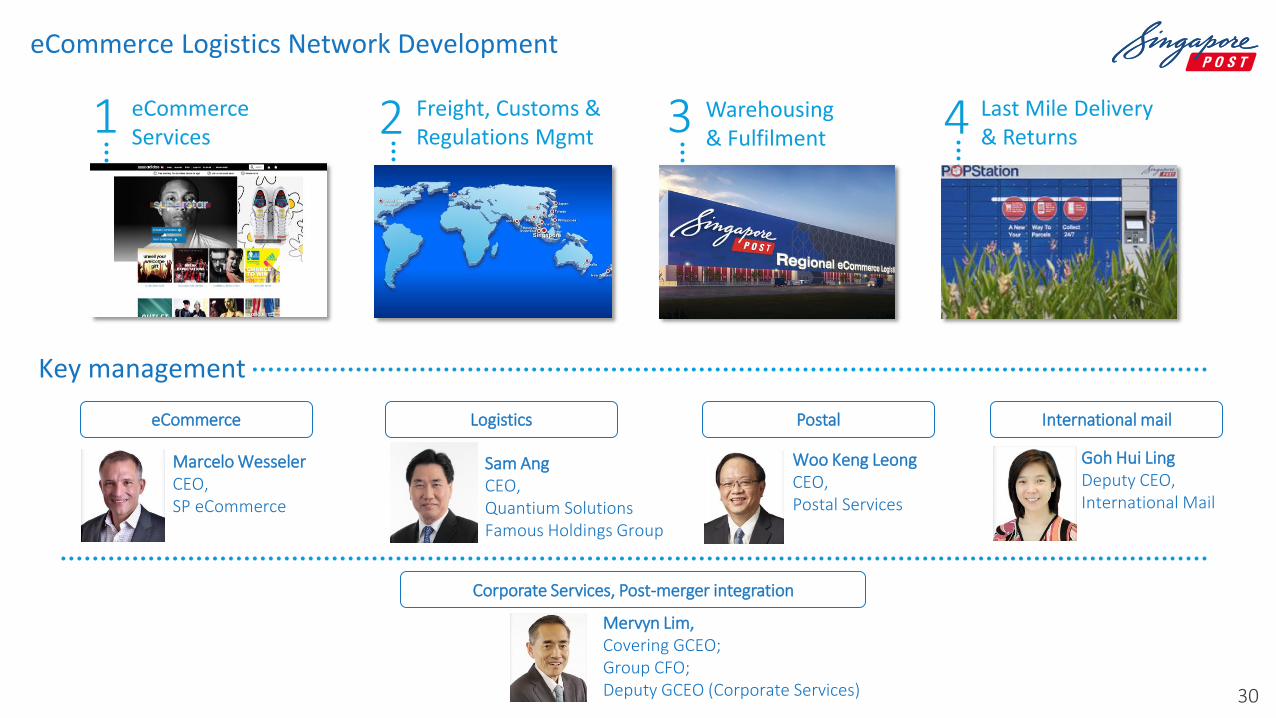
eCommerce Logistics Network Development
eCommerce Services
Warehousing & Fulfilment
Last Mile Delivery & Returns
Freight, Customs & Regulations Mgmt
Marcelo Wesseler CEO, SP eCommerce
eCommerce
Sam Ang CEO, Quantium Solutions Famous Holdings Group
Logistics
Woo Keng Leong CEO, Postal Services
Postal
Goh Hui Ling Deputy CEO, International Mail
International mail
Mervyn Lim, Covering GCEO; Group CFO; Deputy GCEO (Corporate Services)
Corporate Services, Post-merger integration
Key management

Thank you