Embed Size (px)
Citation preview
Q3 Financial Presentation 2016
DOF ASA

Highlights
- Q3 Presentation 2016 DOF ASA
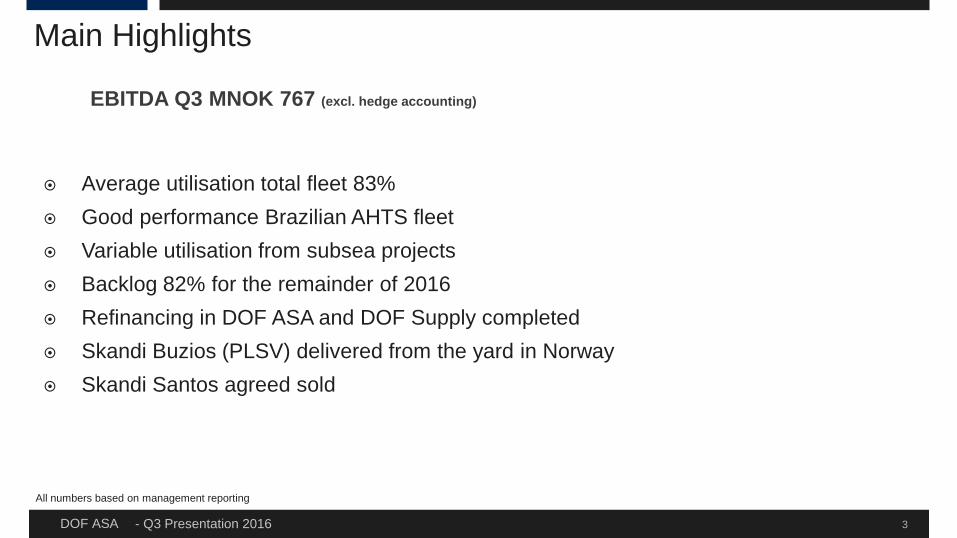
Main Highlights
Average utilisation total fleet 83% Good performance Brazilian AHTS fleet Variable utilisation from subsea projects Backlog 82% for the remainder of 2016 Refinancing in DOF ASA and DOF Supply completed Skandi Buzios (PLSV) delivered from the yard in Norway Skandi Santos agreed sold
3
All numbers based on management reporting
EBITDA Q3 MNOK 767 (excl. hedge accounting)
- Q3 Presentation 2016 DOF ASA
Highlights
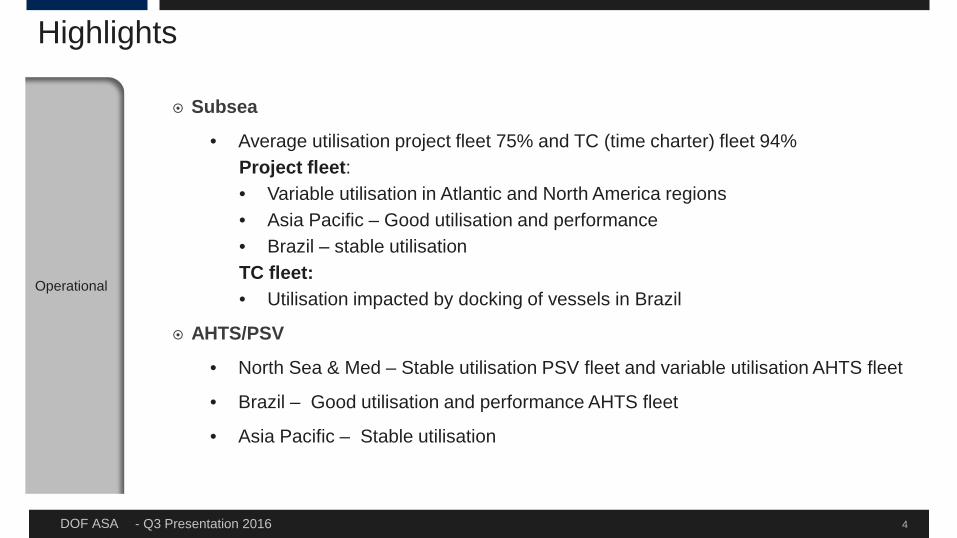
Subsea
• Average utilisation project fleet 75% and TC (time charter) fleet 94% Project fleet: • Variable utilisation in Atlantic and North America regions • Asia Pacific – Good utilisation and performance • Brazil – stable utilisation TC fleet: • Utilisation impacted by docking of vessels in Brazil
AHTS/PSV
• North Sea & Med – Stable utilisation PSV fleet and variable utilisation AHTS fleet
• Brazil – Good utilisation and performance AHTS fleet
• Asia Pacific – Stable utilisation
Operational
4
- Q3 Presentation 2016 DOF ASA
Highlights
5
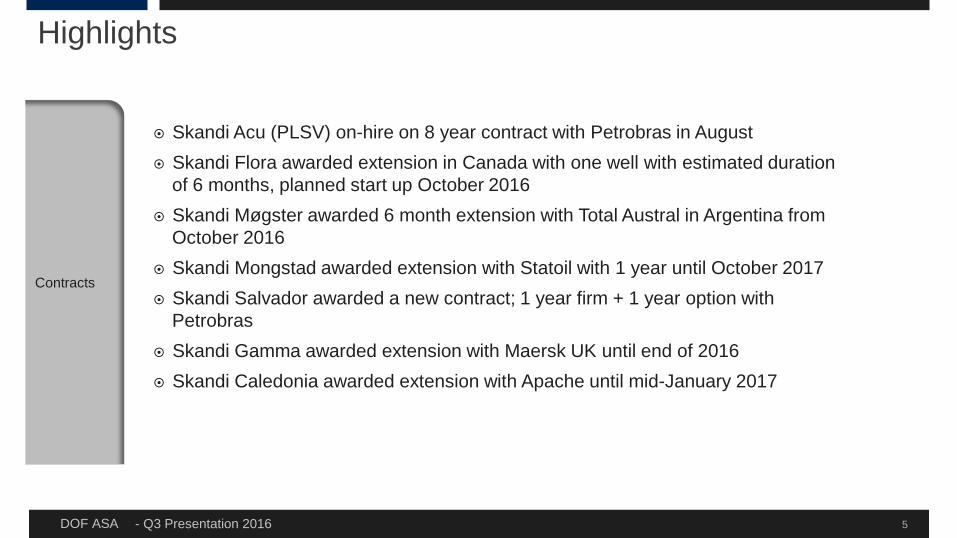
Skandi Acu (PLSV) on-hire on 8 year contract with Petrobras in August Skandi Flora awarded extension in Canada with one well with estimated duration
of 6 months, planned start up October 2016 Skandi Møgster awarded 6 month extension with Total Austral in Argentina from
October 2016 Skandi Mongstad awarded extension with Statoil with 1 year until October 2017 Skandi Salvador awarded a new contract; 1 year firm + 1 year option with
Petrobras Skandi Gamma awarded extension with Maersk UK until end of 2016 Skandi Caledonia awarded extension with Apache until mid-January 2017
Contracts

- Q3 Presentation 2016 DOF ASA
Highlights
Fleet
6
Financing
Skandi Stord (AHTS) sold and delivered to new owners
Skandi Santos (OSCV) sales agreement (with subjects) signed with Akastor JV
• Marine management and personnel services to continue under Norskan
• ROV services to continue under DOF Subsea
Skandi Buzios (PLSV) first delivery in September 2016
Rights issue of NOK 1 060 mill completed in August
New Subordinated Convertible bond and a rights issue registered in August
A new facility of NOK 3 800 mill drawn in October

Overview Group

- Q3 Presentation 2016 DOF ASA
DOF ASA in brief
Vessels
Fleet 67 vessels (wholly and partly owned) (19 PSV, 19 AHTS, 29 Subsea)
• 58 vessels in operation, 3 in lay up • 2 vessels owned via minority share • 4 newbuilds (3 vessels 50% owned via
Technip JV and 1 vessel owned 45%)
1 subsea vessel chartered in from external owner (firm until August 2017)
63 ROVs, 4 ROVs on order
NOK 33 billion in fair market value owned vessel in operation* (100% basis)
Average age approx. 9 years, value adjusted fleet age of 6.0 years*
Back log* Total NOK 59.0 bn
• Firm contracts: NOK 27.0 bn • Options: NOK 32.0 bn
Global organisation Head office in Norway Regional offices in Australia,
Singapore, UK, USA, Canada, Angola, Argentina and Brazil
Total of 4 225 employees* Subsea employees: 1 372 Marine personnel: 2 853
(*As per 30.09.2016)
8
29
19
19
1 Subsea
AHTS
PSV
Chartered SubseaVessels

- Q3 Presentation 2016 DOF ASA
Fleet overview and contract coverage
* Including Newbuilds ** Excl. vessels with minority share
9
No. of vessels
PSV AHTS Subsea Total fleet
DOF ASA/DOF REDERI AS 17 3 2 23
NORSKAN OFFSHORE 1 10 2 13
DOF SUBSEA AS 0 0 22* 22
DOF INSTALLER ASA 0 0 2 2
DOF DEEPWATER AS 0 5 0 5
Total fleet 18 18 28 64**
Contract coverage
Remaining 2016 Firm 89 % 77 % 81 % 82 %
Remaining 2016 Including options 89 % 77 % 81 % 82 %
2017 Firm 59 % 54 % 44 % 51 %
2017 Including options 74 % 63 % 55 % 63 %
Expectations for 2016 & 2017 • Our global footprint, track record and
project capacity will be vital to secure utilisation
• Blocking rights in Brazil vital to
secure contracts in this region
• Reasonable tender activity and number of leads in some regions
- Q3 Presentation 2016 DOF ASA
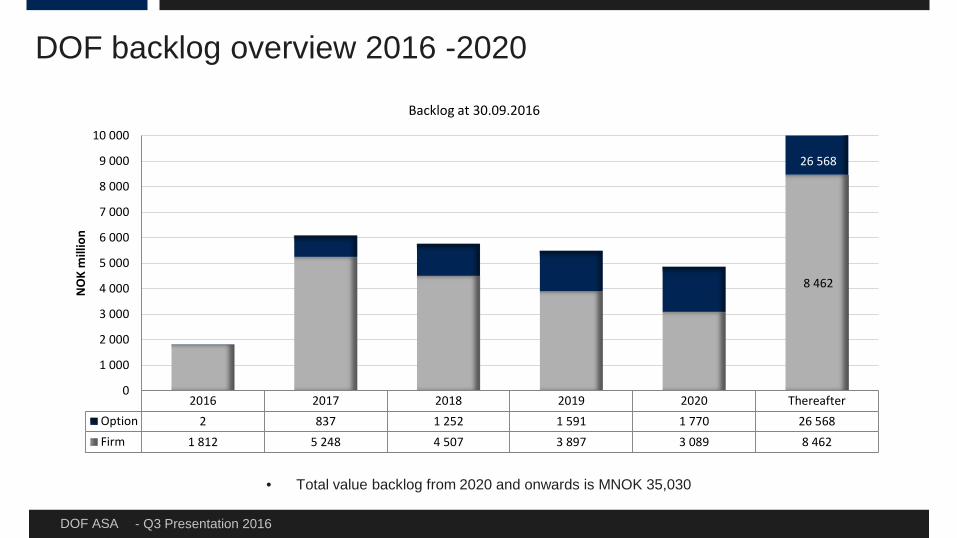
DOF backlog overview 2016 -2020
• Total value backlog from 2020 and onwards is MNOK 35,030
26,813
2016 2017 2018 2019 2020 ThereafterOption 2 837 1 252 1 591 1 770 26 568Firm 1 812 5 248 4 507 3 897 3 089 8 462
8 462
26 568
0
1 000
2 000
3 000
4 000
5 000
6 000
7 000
8 000
9 000
10 000
NO
K m
illio
n
Backlog at 30.09.2016
- Q3 Presentation 2016 DOF ASA 11
Region Perth
Rio de Janeiro
Buenos Aires
Singapore
Houston
St. Johns
Aberdeen
Cairo
Brunei
Macaé
Jakarta
Manila
Luanda
Austevoll
Malaysia
28
5
23
7
1
Melbourne
Darwin
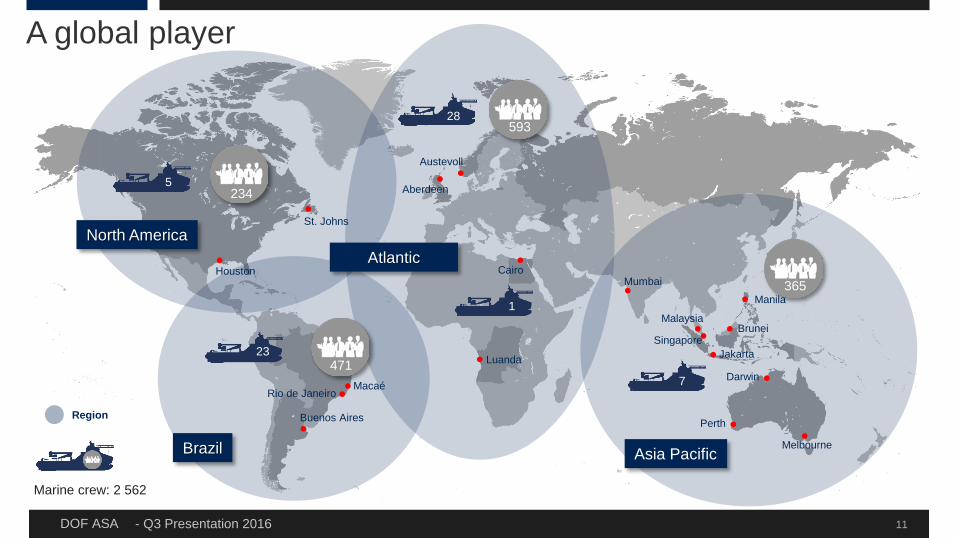
593
471
365
North America
Asia Pacific Brazil
Atlantic
234
Marine crew: 2 562
Mumbai
A global player

- Q3 Presentation 2016 DOF ASA
Skandi Buzios (PLSV) 50% ownership 8 yrs contract (Petrobras) Loan agreement signed, first
tranche drawn on 1st delivery
Skandi Recife (PLSV)
50% ownership 8 yrs contract (Petrobras) Loan agreement signed with BNDES
Skandi Olinda (PLSV)
50% ownership 8 yrs contract (Petrobras) Loan agreement signed with BNDES
Newbuilding program
12
DOF Subsea has a minority share in NB-834 (MPSV), which will start on a 10-year IMR contract for Husky Energy upon delivery.

- Q3 Presentation 2016 DOF ASA
2001-2006 2009 2010 2011 2012 2013 2016
Establishing a strategic position in Brazil
Skandi Copacabana First Brazilian built AHTS
Skandi Vitória and Niterói First Brazilian built PLSVs
Skandi Amazonas & Skandi Iguaçu Biggest AHTS vessels built in Brazil by DOF
4 new PLSV´s 2 built in Brazil
2006: DOF Subsea Brasil
established
Skandi Salvador First Brazilian built CSV
Skandi Santos First CSV installing x-mas tree
2001: First step in Brazil
Strategy: Brazilian flag, local content, local employees Contract awards and newbuilds on-hire on long term contracts YTD 2016 confirms the Groups strategy
Skandi Santos agreed sold Skandi Açu on-hire for 8 yrs contract in Aug Skandi Paraty on-hire 4 yrs contract in May
Geograph Petrobras extended
contract by 18 months
- Q3 Presentation 2016 DOF ASA
-
20
40
60
80
100
120
140
-
5
10
15
20
25
30
35
40
AHTS 18.000 AHTS 21.000+ RSV WSV MPSV DSV PLSV
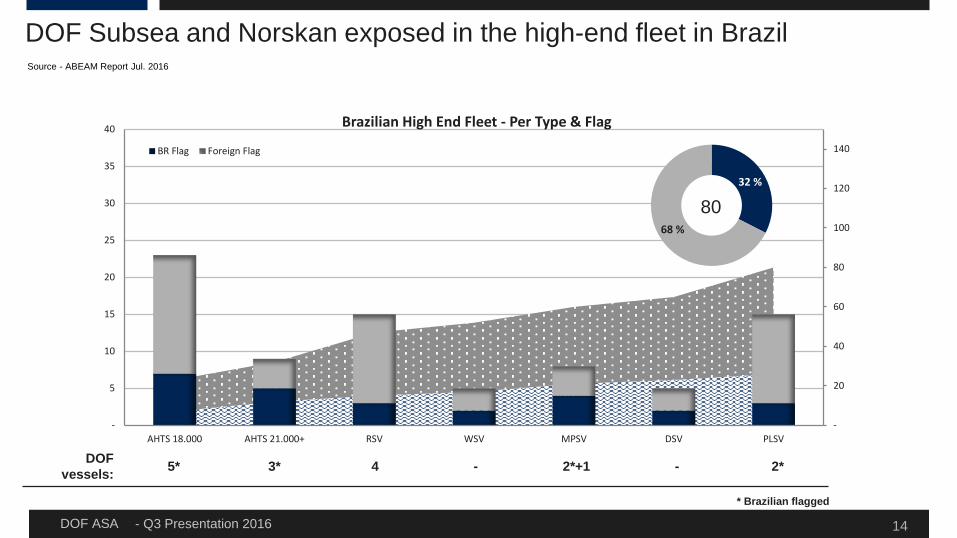
Brazilian High End Fleet - Per Type & Flag
BR Flag Foreign Flag
80 32 %
68 %
14
DOF Subsea and Norskan exposed in the high-end fleet in Brazil Source - ABEAM Report Jul. 2016
DOF vessels: 5* 3* 4 - 2*+1 - 2*
* Brazilian flagged

Financials Management Reporting
- Q3 Presentation 2016 DOF ASA
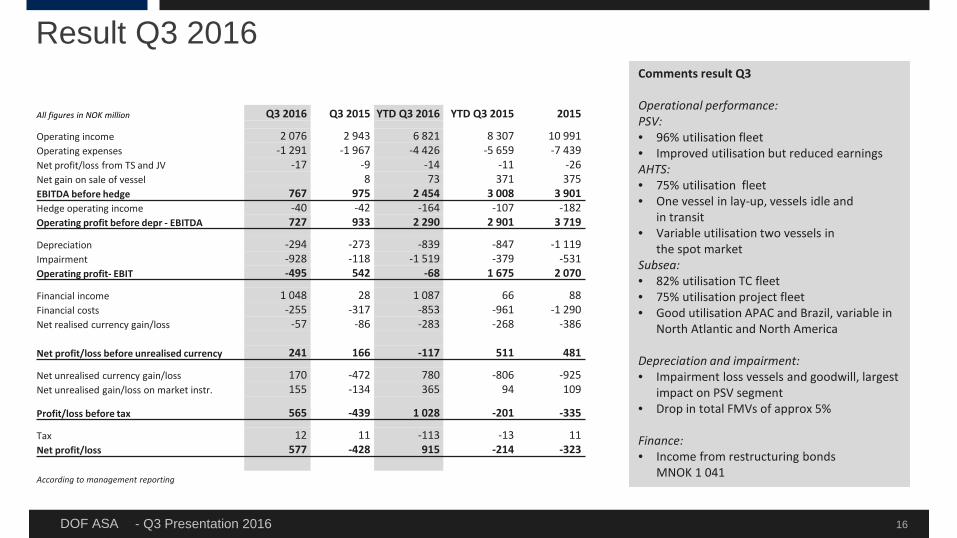
Result Q3 2016 Comments result Q3 Operational performance: PSV: • 96% utilisation fleet • Improved utilisation but reduced earnings AHTS: • 75% utilisation fleet • One vessel in lay-up, vessels idle and
in transit • Variable utilisation two vessels in
the spot market Subsea: • 82% utilisation TC fleet • 75% utilisation project fleet • Good utilisation APAC and Brazil, variable in
North Atlantic and North America
Depreciation and impairment: • Impairment loss vessels and goodwill, largest
impact on PSV segment • Drop in total FMVs of approx 5%
Finance: • Income from restructuring bonds
MNOK 1 041
16
All figures in NOK million Q3 2016 Q3 2015 YTD Q3 2016 YTD Q3 2015 2015
Operating income 2 076 2 943 6 821 8 307 10 991 Operating expenses -1 291 -1 967 -4 426 -5 659 -7 439 Net profit/loss from TS and JV -17 -9 -14 -11 -26 Net gain on sale of vessel 8 73 371 375 EBITDA before hedge 767 975 2 454 3 008 3 901 Hedge operating income -40 -42 -164 -107 -182 Operating profit before depr - EBITDA 727 933 2 290 2 901 3 719
Depreciation -294 -273 -839 -847 -1 119 Impairment -928 -118 -1 519 -379 -531 Operating profit- EBIT -495 542 -68 1 675 2 070
Financial income 1 048 28 1 087 66 88 Financial costs -255 -317 -853 -961 -1 290 Net realised currency gain/loss -57 -86 -283 -268 -386 Net profit/loss before unrealised currency 241 166 -117 511 481
Net unrealised currency gain/loss 170 -472 780 -806 -925 Net unrealised gain/loss on market instr. 155 -134 365 94 109
Profit/loss before tax 565 -439 1 028 -201 -335
Tax 12 11 -113 -13 11 Net profit/loss 577 -428 915 -214 -323 According to management reporting
- Q3 Presentation 2016 DOF ASA 17
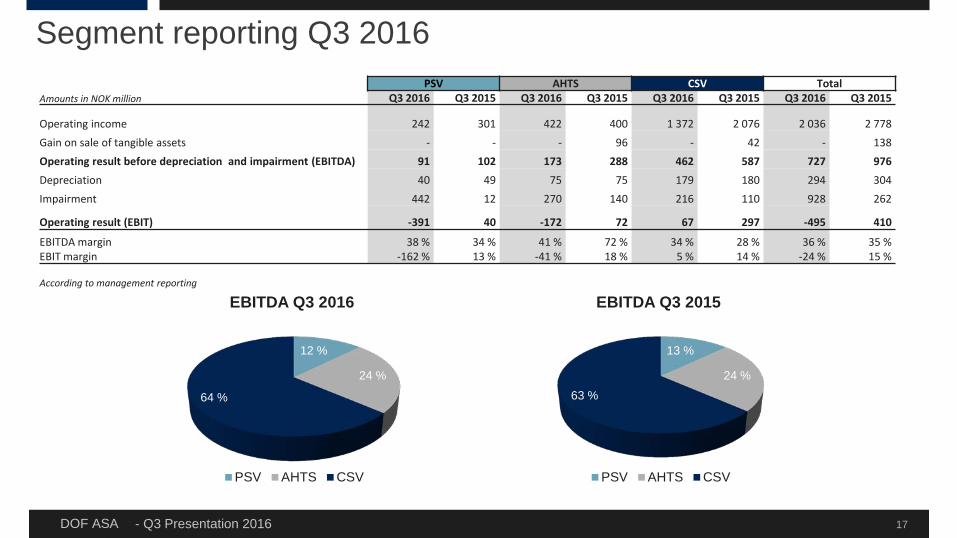
Segment reporting Q3 2016
12 %
24 %
64 %
EBITDA Q3 2016
PSV AHTS CSV
13 %
24 %
63 %
EBITDA Q3 2015
PSV AHTS CSV
PSV AHTS CSV Total Amounts in NOK million Q3 2016 Q3 2015 Q3 2016 Q3 2015 Q3 2016 Q3 2015 Q3 2016 Q3 2015
Operating income 242 301 422 400 1 372 2 076 2 036 2 778 Gain on sale of tangible assets - - - 96 - 42 - 138 Operating result before depreciation and impairment (EBITDA) 91 102 173 288 462 587 727 976 Depreciation 40 49 75 75 179 180 294 304 Impairment 442 12 270 140 216 110 928 262
Operating result (EBIT) -391 40 -172 72 67 297 -495 410
EBITDA margin 38 % 34 % 41 % 72 % 34 % 28 % 36 % 35 % EBIT margin -162 % 13 % -41 % 18 % 5 % 14 % -24 % 15 %
According to management reporting
- Q3 Presentation 2016 DOF ASA
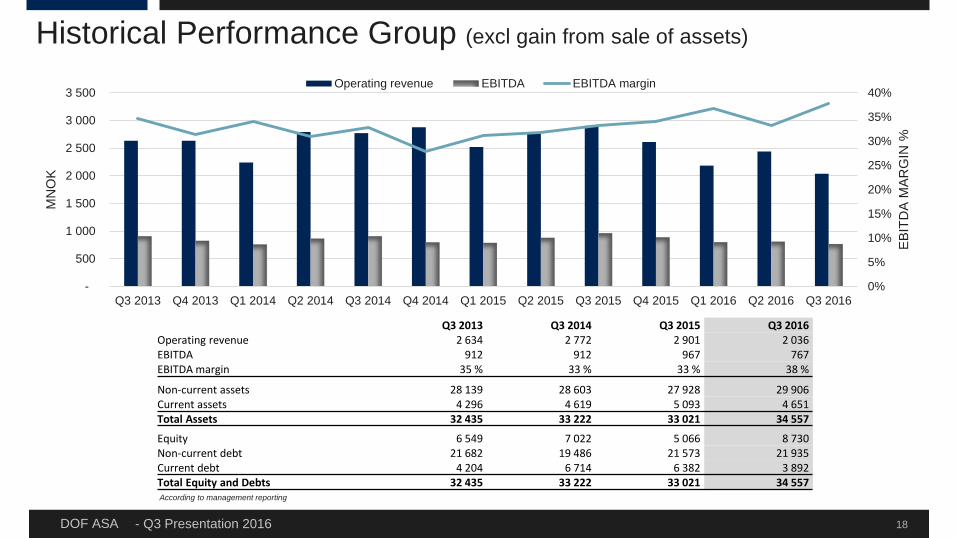
Historical Performance Group (excl gain from sale of assets)
18
According to management reporting
0%
5%
10%
15%
20%
25%
30%
35%
40%
-
500
1 000
1 500
2 000
2 500
3 000
3 500
Q3 2013 Q4 2013 Q1 2014 Q2 2014 Q3 2014 Q4 2014 Q1 2015 Q2 2015 Q3 2015 Q4 2015 Q1 2016 Q2 2016 Q3 2016
EBIT
DA
MAR
GIN
%
MN
OK
Operating revenue EBITDA EBITDA margin
Q3 2013 Q3 2014 Q3 2015 Q3 2016 Operating revenue 2 634 2 772 2 901 2 036 EBITDA 912 912 967 767 EBITDA margin 35 % 33 % 33 % 38 %
Non-current assets 28 139 28 603 27 928 29 906 Current assets 4 296 4 619 5 093 4 651 Total Assets 32 435 33 222 33 021 34 557
Equity 6 549 7 022 5 066 8 730 Non-current debt 21 682 19 486 21 573 21 935 Current debt 4 204 6 714 6 382 3 892 Total Equity and Debts 32 435 33 222 33 021 34 557
- Q3 Presentation 2016 DOF ASA
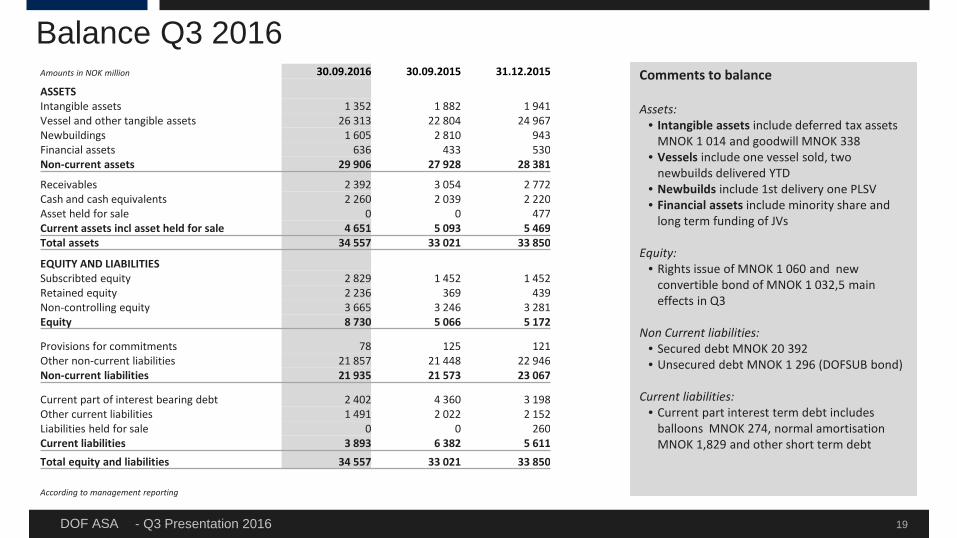
Balance Q3 2016 Comments to balance Assets:
• Intangible assets include deferred tax assets MNOK 1 014 and goodwill MNOK 338
• Vessels include one vessel sold, two newbuilds delivered YTD
• Newbuilds include 1st delivery one PLSV • Financial assets include minority share and
long term funding of JVs
Equity: • Rights issue of MNOK 1 060 and new
convertible bond of MNOK 1 032,5 main effects in Q3
Non Current liabilities: • Secured debt MNOK 20 392 • Unsecured debt MNOK 1 296 (DOFSUB bond)
Current liabilities:
• Current part interest term debt includes balloons MNOK 274, normal amortisation MNOK 1,829 and other short term debt
19
Amounts in NOK million 30.09.2016 30.09.2015 31.12.2015
ASSETS Intangible assets 1 352 1 882 1 941 Vessel and other tangible assets 26 313 22 804 24 967 Newbuildings 1 605 2 810 943 Financial assets 636 433 530 Non-current assets 29 906 27 928 28 381
Receivables 2 392 3 054 2 772 Cash and cash equivalents 2 260 2 039 2 220 Asset held for sale 0 0 477 Current assets incl asset held for sale 4 651 5 093 5 469 Total assets 34 557 33 021 33 850
EQUITY AND LIABILITIES Subscribted equity 2 829 1 452 1 452 Retained equity 2 236 369 439 Non-controlling equity 3 665 3 246 3 281 Equity 8 730 5 066 5 172
Provisions for commitments 78 125 121 Other non-current liabilities 21 857 21 448 22 946 Non-current liabilities 21 935 21 573 23 067
Current part of interest bearing debt 2 402 4 360 3 198 Other current liabilities 1 491 2 022 2 152 Liabilities held for sale 0 0 260 Current liabilities 3 893 6 382 5 611 Total equity and liabilities 34 557 33 021 33 850
According to management reporting

- Q3 Presentation 2016 DOF ASA
-
1,00
2,00
3,00
4,00
5,00
6,00
7,00
8,00
9,00
10,00
-
5 000
10 000
15 000
20 000
25 000
2011 2012 2013 2014 2015 Q3 2016*
Mill
ion
NO
K
Net interest bearing debt ex unemployed capital
EBITDA ex gain on sale of assets and hedgeaccountingNIBD/EBITDA
Key Figures
20
* EBITDA for current quarter plus 3 previous quarters.
NIBD historical development Q3 2016 Q3 2015 2015 FINANCIAL RESULT EBITDA margin 1 33 % 31 % 32 % EBIT margin 2 21 % 20 % 22 % Profit per share ex. non-controlling interest 0.37 -2.55 0.73 Profit per share ex. unrealised loss/gain and taxes 0,21 0,90 5,00 BALANCE Return on net capital 10 % -4 % -6 % Equity ratio 25 % 15 % 15 % Net interest bearing debt 21 665 23 246 23 731 Net interest bearing debt ex. unemployed capital 20 060 20 436 22 788
NIBD/EBITDA 3 6.26 5.93
6.46
NIBD/EBIT 4 9.29 8.95
9.46 1 EBITDA excluded net gain on sale of assets and hedge accounting / Operating Income 2 EBIT excluded net gain on sale of assets, hedge accounting and impairment / Operating Income 3 Net interest bearing debt excluded unemployed capital / 4 quarters rolling EBITDA excluded net gain on sale of assets, hedge accounting og impairment 4 Net interest bearing debt excluded unemployed capital / 4 quarters rolling EBIT excluded net gain on sale of assets and hedge accounting
According to management reporting

- Q3 Presentation 2016 DOF ASA
Net interest bearing debt 30.09.2016
21
Comments interest bearing debt Non-current debt:
• DOF bond MNOK 1 365 deleted in August and replaced with a Subordinated Convertible Bond
Current debt: • Debt to credit institutions:
• Two balloons MNOK 274 • Amortisation MNOK 1 829
• DOF bond MNOK 700 deleted in August
Cash and derivatives: • MNOK 402 represent cash deposit
Amounts in NOK million 30.09.2016 30.09.2015 31.12.2015
Bond loan 1 296 3 345 3 347 Debt to credit institutions 20 392 17 805 19 328 Total non-current interest bearing liabilities 21 688 21 149 22 674 Bond loan - 926 422 Debt to credit institutions 2 103 3 186 2 422 Utilised credit facilities 134 23 172 Liabilities held for sale - - 260 Total current interest bearing liabilities 2 237 4 135 3 276 Total interest bearing liabilities 23 925 25 285 25 951 Cash and cash equivalents 2 260 2 039 2 220 Total net interest bearing liabilities 21 665 23 246 23 731
Newbuilds 1 605 2 810 943 Net interest bearing liabilities, excluding unemployed capital 20 060 20 436 22 788
According to management reporting

- Q3 Presentation 2016 DOF ASA
Cash Flow Statement
22
Comments Cash flow Statement Operating activities Investing activities:
• Delivery of one newbuild
Financing activitites: Proceeds: Net impact funding newbuilds and refinancing activity Prepayments: Amortisation and net impact refinancing activity Share issue: Net proceeds from share issue Bonds: Repurchase convertible bond
Amounts in NOK million Q3 2016 Q3 2015 YTD Q3
2016 YTD Q3
2015
Cash from operating activities 839 811 2 272 2 608
Net interest paid -270 -267 -821 -
902 Taxes paid -24 -27 -63 -164 Net cash from operating activities 545 517 1 388 1 543
Sale of tangible assets - 679 551 2 598 Purchase of tangible assets -875 -169 -3 714 -3 412 Sale of shares - -417 3 - Purchase of shares -2 - -2 - Other changes in investing activities -4 100 -153 -89 Net cash from investing activities -881 194 -3 314 -903
Proceeds from borrowings 160 1 971 3 451 5 481 Prepayment of borrowings -45 -2 468 -2 248 -6 740 Share issue 1 044 - 1 044 - Purchase of convertible bond loan -209 - -209 - Payment from/to non-controlling interests - -98 -26 -116 Net cash from financing activities 950 -595 2 013 -1 375
Net changes in cash and cash equivalents 614 116 86 -735
Cash and cash equivalents at the start of the period 1 667 1 951 2 220 2 695 Exchange gain/loss on cash and cash equivalents -21 -27 -46 79 Cash and cash equivalents at the end of the period 2 260 2 039 2 260 2 039
According to management reporting

- Q3 Presentation 2016 DOF ASA
Status after refinancing DOF ASA and DOF Supply (excl 100% owned Norskan Offshore Ltda and 51% owned DOF Subsea AS) has completed the following refinancing:
Rights issue of NOK 1 060 million completed in August
Subordinated Convertible Bond registered at a value of NOK 823,5 million after repurchase of NOK 209 million in bonds
• Zero coupon interest • Conversion to shares within 5 years
A new facility of NOK 3 800 million has been drawn in October to refinance 27 vessels • 75% reduction in installments the next three years • New financial covenants
Based on the above the net debt reduced by approx NOK 2 900 million
By November NOK 323,5 million in bonds in the convertible loan has been converted to shares
23
- Q3 Presentation 2016 DOF ASA
DO
F ex
Sub
sea
DO
F S
ubse
a
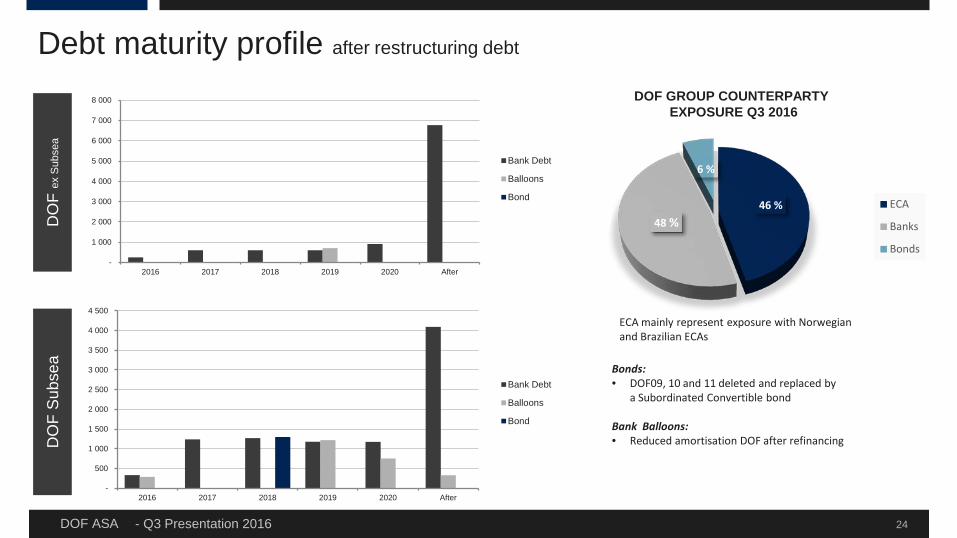
Bonds: • DOF09, 10 and 11 deleted and replaced by
a Subordinated Convertible bond
Bank Balloons: • Reduced amortisation DOF after refinancing
DOF GROUP COUNTERPARTY EXPOSURE Q3 2016
24
ECA mainly represent exposure with Norwegian and Brazilian ECAs
Debt maturity profile after restructuring debt
-
1 000
2 000
3 000
4 000
5 000
6 000
7 000
8 000
2016 2017 2018 2019 2020 After
Bank Debt
Balloons
Bond
-
500
1 000
1 500
2 000
2 500
3 000
3 500
4 000
4 500
2016 2017 2018 2019 2020 After
Bank Debt
Balloons
Bond
46 % 48 %
6 %
ECA
Banks
Bonds

DOF Subsea
- Q3 Presentation 2016 DOF ASA
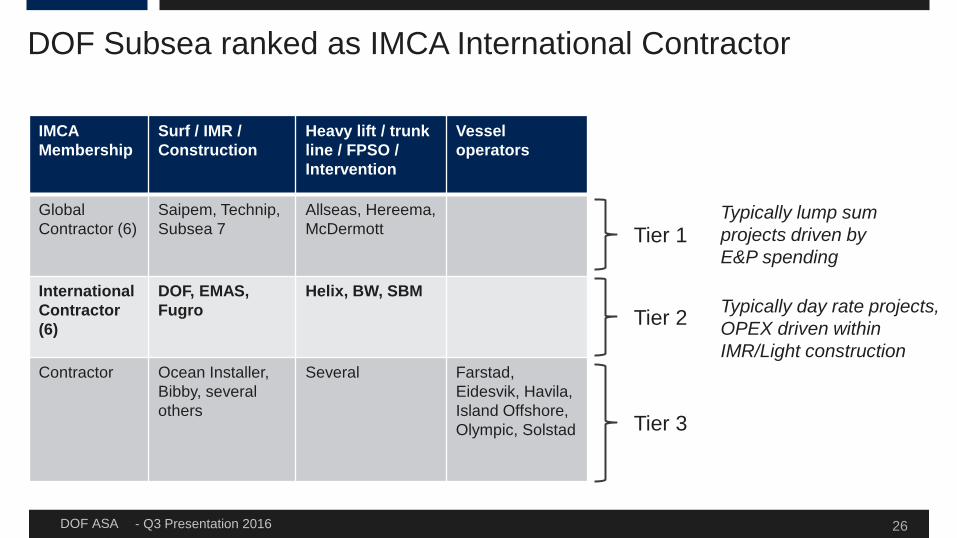
DOF Subsea ranked as IMCA International Contractor
Tier 1
Tier 2
Tier 3
IMCA Membership
Surf / IMR / Construction
Heavy lift / trunk line / FPSO / Intervention
Vessel operators
Global Contractor (6)
Saipem, Technip, Subsea 7
Allseas, Hereema, McDermott
International Contractor (6)
DOF, EMAS, Fugro
Helix, BW, SBM
Contractor Ocean Installer, Bibby, several others
Several Farstad, Eidesvik, Havila, Island Offshore, Olympic, Solstad
Typically lump sum projects driven by E&P spending
Typically day rate projects, OPEX driven within IMR/Light construction
26
- Q3 Presentation 2016 DOF ASA
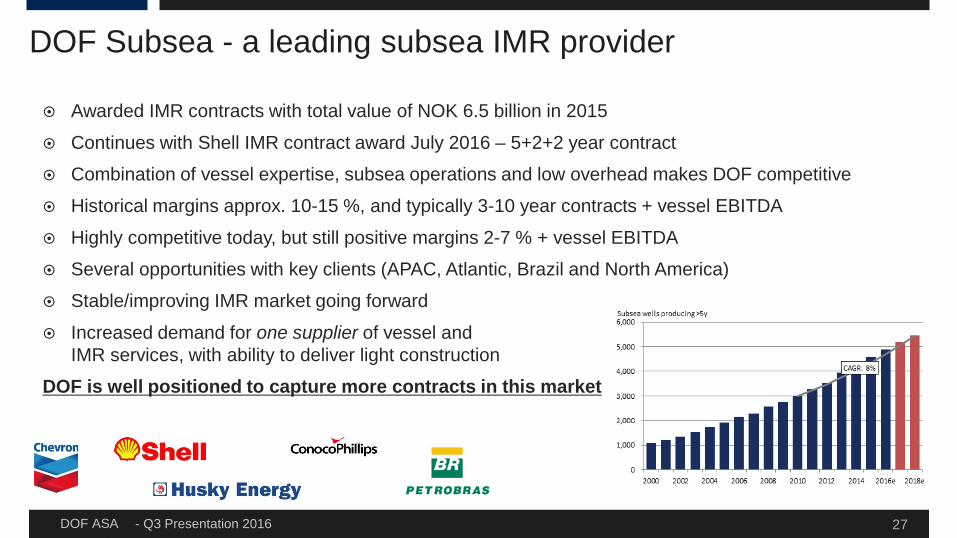
DOF Subsea - a leading subsea IMR provider
27
Awarded IMR contracts with total value of NOK 6.5 billion in 2015
Continues with Shell IMR contract award July 2016 – 5+2+2 year contract
Combination of vessel expertise, subsea operations and low overhead makes DOF competitive
Historical margins approx. 10-15 %, and typically 3-10 year contracts + vessel EBITDA
Highly competitive today, but still positive margins 2-7 % + vessel EBITDA
Several opportunities with key clients (APAC, Atlantic, Brazil and North America)
Stable/improving IMR market going forward
Increased demand for one supplier of vessel and IMR services, with ability to deliver light construction
DOF is well positioned to capture more contracts in this market
- Q3 Presentation 2016 DOF ASA
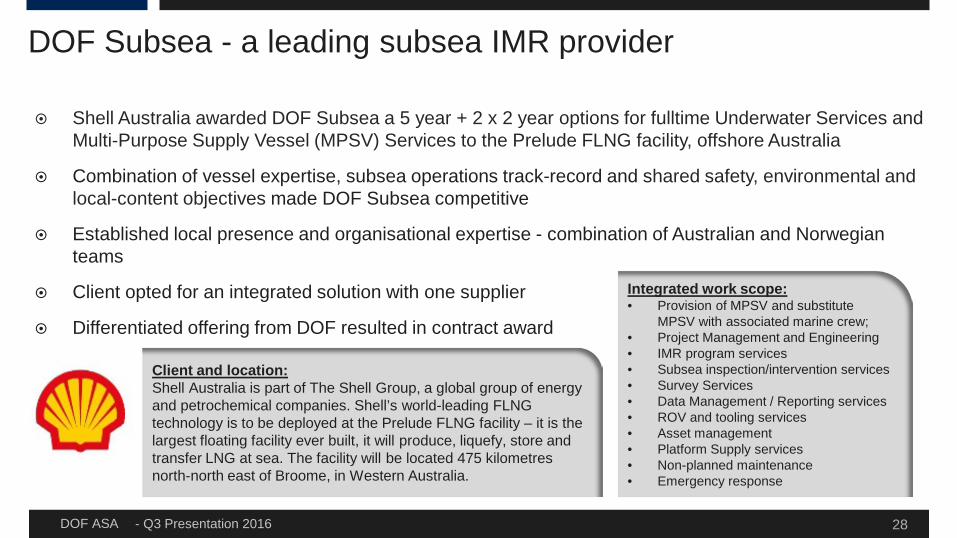
DOF Subsea - a leading subsea IMR provider
Shell Australia awarded DOF Subsea a 5 year + 2 x 2 year options for fulltime Underwater Services and Multi-Purpose Supply Vessel (MPSV) Services to the Prelude FLNG facility, offshore Australia
Combination of vessel expertise, subsea operations track-record and shared safety, environmental and local-content objectives made DOF Subsea competitive
Established local presence and organisational expertise - combination of Australian and Norwegian teams
Client opted for an integrated solution with one supplier
Differentiated offering from DOF resulted in contract award
Integrated work scope: • Provision of MPSV and substitute
MPSV with associated marine crew; • Project Management and Engineering • IMR program services • Subsea inspection/intervention services • Survey Services • Data Management / Reporting services • ROV and tooling services • Asset management • Platform Supply services • Non-planned maintenance • Emergency response
Client and location: Shell Australia is part of The Shell Group, a global group of energy and petrochemical companies. Shell’s world-leading FLNG technology is to be deployed at the Prelude FLNG facility – it is the largest floating facility ever built, it will produce, liquefy, store and transfer LNG at sea. The facility will be located 475 kilometres north-north east of Broome, in Western Australia.
28

- Q3 Presentation 2016 DOF ASA 29
According to management reporting
DOF Subsea quarterly performance (excl. asset sales)
0%
5%
10%
15%
20%
25%
30%
35%
40%
-
500
1 000
1 500
2 000
2 500
Q3 2013 Q4 2013 Q1 2014 Q2 2014 Q3 2014 Q4 2014 Q1 2015 Q2 2015 Q3 2015 Q4 2015 Q1 2016 Q2 2016 Q3 2016
EBIT
DA
Mar
gin
%
MN
OK
Operating revenue EBITDA EBITDA margin
Q3 2013 Q3 2014 Q3 2015 Q3 2016 Operating revenue 1 804 1 904 1 991 1 232 EBITDA 595 552 553 447 EBITDA margin 33% 29% 28% 36%
Non-current assets 16 330 16 215 16 447 18 514 Current assets 3 119 2 998 3 674 2 742 Total assets 19 450 19 213 20 121 21 256
Equity 5 167 5 938 5 641 6 437 Non-current debt 11 474 9 668 9 988 12 174 Current debt 2 808 3 607 4 492 2 645 Total Equity and Debts 19 449 19 213 20 121 21 256

- Q3 Presentation 2016 DOF ASA
In general, weak global markets within supply and subsea, however still differences in regional opportunities
Subsea: APAC market
Reduced spending from operators leading to low activity Competition scene changing with the bigger contractors now interested in IMR as
construction work dries up
DOF SUB:
Still long and short term opportunities, but downward pressure on rates
Brazil market We expect a slow market, with few new tenders, strong pressure on rates and “blocking activity” leading to
termination and renegotiation of contracts (DOF is benefiting from blockings).
DOF SUB:
Challenging and time-consuming for vessels that are up for renewal
Important with Brazilian flag
Market and outlook
30

- Q3 Presentation 2016 DOF ASA
Market and outlook
31
Subsea: North America market We still see a reasonable level of activities in the IMR and Tie-back, however prices are lower due
to cost saving approach by the Operators
Atlantic market We expect Norway and UK sector to be weak in Q4 2016 and through 2017

- Q3 Presentation 2016 DOF ASA
Market and outlook
32
Supply: Brazil Slow market continues, with few new tenders, increased competition and lower rates Petrobras redelivering vessels in order to reduce current fleet size, but at slower pace DOF Few vessels up for renewal. There are some opportunities for Brazilian flagged and international
vessels using “REB flag import capacity”, through blocking. Slow progress on negotiations and risk of idle time
North Sea: We expect the North Sea market for both AHTS and PSV to be weak DOF: Gradually higher exposure going forward Asia Pacific: We see low tender activity in the region within supply Downward pressure on rates and over-supply of tonnage DOF: 3 vessels in the region, two on term contracts and one in the spot market
- Q3 Presentation 2016 DOF ASA
Operational EBITDA for Q4 2016 to be weaker than Q3 2016, however no change in full year guidance
Refinancing plan completed and DOF has secured sufficient liquidity to sustain a downturn
Challenging markets expected to continue through 2017
Outlook
33

Thank you Presented by Mons Aase - CEO Hilde Drønen - CFO

- Q3 Presentation 2016 DOF ASA
DISCLAIMER This presentation by DOF ASA designed to provide a high level overview of aspects of the operations of the DOF ASA Group. The material set out in the presentation is current as at 16 November 2016. This presentation contains forward-looking statements relating to operations of the DOF ASA Group that are based on management’s own current expectations, estimates and projections about matters relevant to DOF ASA‘s future financial performance. Words such as “likely”, “aims”, “looking forward”, “potential”, “anticipates”, “expects”, “predicts”, “plans”, “targets”, “believes” and “estimates” and similar expressions are intended to identify forward-looking statements. References in the presentation to assumptions, estimates and outcomes and forward-looking statements about assumptions, estimates and outcomes, which are based on internal business data and external sources, are uncertain given the nature of the industry, business risks, and other factors. Also, they may be affected by internal and external factors that may have a material effect on future business performance and results. No assurance or guarantee is, or should be taken to be, given in relation to the future business performance or results of the DOF ASA Group or the likelihood that the assumptions, estimates or outcomes will be achieved. While management has taken every effort to ensure the accuracy of the material in the presentation, the presentation is provided for information only. DOF ASA , its officers and management exclude and disclaim any liability in respect of anything done in reliance on the presentation. All forward-looking statements made in this presentation are based on information presently available to management and DOF ASA assumes no obligation to update any forward looking- statements. Nothing in this presentation constitutes investment advice and this presentation shall not constitute an offer to sell or the solicitation of any offer to buy any securities or otherwise engage in any investment activity. You should make your own enquiries and take your own advice (including financial and legal advice) before making an investment in the company's shares or in making a decision to hold or sell your shares.
35