Embed Size (px)
Citation preview

Q3 2018 Interim report January-September
For further information please contact Investor relations at + 46 (0) 73 699 2714 / [email protected] or Public relations at +46 (0) 76 494 09 13/ [email protected]
Record Q3 sales & increased profits
Q3 2018 highlights ■ Record Q3 sales of SEK 4,683m (4,280) with 3% organic growth
■ Operating income before IAC of SEK 328m (257) including transaction costs related to the proposed split of MTG of SEK 7m 1)
■ Total operating income of SEK 340m (257) including items affecting comparability of SEK 12m 2)
■ Total net income of SEK 192m (177) including net income from discontinued operations of SEK -2m (-11) and total basic earnings per share of SEK 2.32 (2.31)
■ Net debt of SEK 3,085m (3,309) equivalent to 1.6x trailing EBITDA before IAC
Financial overview
(SEKm) Q3 2018 Q3 2017 Nine
months 2018
Nine months
2017
Full year 2017
Continuing operations
Net sales 4,683 4,280 14,367 12,230 17,537 Organic growth 3.2% 7.0% 7.1% 6.9% 7.7% Acquisitions/divestments 1.0% 10.0% 6.7% 5.7% 8.3% Changes in FX rates 5.3% 0.1% 3.6% 1.7% 1.0% Change in reported net sales 9.4% 17.0% 17.5% 14.3% 16.9%
Operating income before IAC 328 257 1,004 785 1,264 Operating margin before IAC 7.0% 6.0% 7.0% 6.4% 7.2% Items affecting comparability 12 - -18 -23 -340 Operating income 340 257 986 763 923
Net income 194 189 693 547 612 Basic earnings per share (SEK) 2.35 2.49 8.96 7.61 8.19 Cash flow from operations 251 273 1,028 772 1,311
Discontinued operations 3)
Net income -2 -11 -11 161 748
Total operations
Net income 192 177 682 708 1,360 Basic earnings per share (SEK) 2.32 2.31 8.80 9.37 18.73 Net debt 3,085 3,309 3,085 3,309 1,812
1) Comprises costs relating to the proposed split of MTG and the previously announced merger agreement to combine MTG Nordics and TDC Group, which was terminated on 19 June 2018
2) Q3 2018 IAC primarily comprise a non-cash revaluation gain of SEK 172m relating to Turtle Entertainment and a non-cash cost of SEK 164m relating to Zoomin.TV asset write-downs. See page 25 for a comprehensive list of items affecting comparability
3) Comprises results of businesses in Tanzania in Q3 2018, and results of businesses in the Czech Republic and the Baltics in 2017. The full year 2017 results include a SEK 593m capital gain from the divestment of the Baltic operations
Alternative performance measures used in this report are explained and reconciled on pages 23-27

Q3 2018 Modern Times Group MTG AB 2(30)
President & CEO’s comments Profitable growth This was another quarter of top and bottom line growth. Our continued organic sales growth was complemented by a 28% increase in operating profits, even when including SEK 7m of transaction costs related to the proposed split of MTG.
Solid performance Nordic Entertainment delivered its eighth consecutive quarter of higher sales and profits. The growth continues to be driven by our streaming services in general, and Viaplay in particular. Free-TV sales were down at constant FX but our Swedish Radio business again delivered double digit sales growth after the launch of the new radio licenses from August, and our Viafree streaming service continues to grow rapidly. Studios sales and profits were down but we have a healthy forward pipeline of contracted productions. Overall, we have continued to invest in original local dramas and premium sports, in order to drive up subscription and consumption levels further.
Nova Bulgaria continued to report double digit profitable growth, and we have now appealed the local competition authority ruling regarding the sale of Nova.
MTGx generated double digit organic sales growth, and we converted an EBIT loss last year into a profit this year following significant improvements at both InnoGames and ESL. This was the fifth consecutive quarter of EBITDA profits for MTGx. InnoGames delivered an exceptional quarter following a number of game updates and successful marketing campaigns. We are now ramping up the marketing of Warlords of Aternum, which has had a promising commercial launch.
Esports sales were up and losses were down. Healthy revenue growth in our owned and operated businesses was offset by lower work for hire volumes as we continue to strategically transform the business. We now expect esport sales to be down in Q4 before growing again in 2019, and we expect a significant improvement in the profitability of the esports operations.
Split set for Q1 2019 Our former shareholder Kinnevik completed the distribution of all of its MTG shares in August, in order to facilitate the EU approval of the Tele2 / ComHem merger. Following this process, we have now continued our work towards the split of MTG and separate listing of NENT Group, including the appointment of three new NENT board members, securing a five year credit facility and increasing our ownership in ESL. Subject to shareholder approval, we intend to list NENT in March 2019.
Jørgen Madsen Lindemann
President & Chief Executive Officer “This was yet another quarter of profitable growth, and we are on track with the planned split. I would like to welcome Kinnevik’s shareholders as direct owners of MTG now.”

Q3 2018 Modern Times Group MTG AB 3(30)
Significant events in and after the quarter
19 July – Decision by the Bulgarian Competition Commission MTG noted the decision by the Bulgarian Commission for the Protection of Competition to disallow the proposed sale, announced on 19 February, of MTG’s shareholding in Nova Broadcasting Group in Bulgaria to PPF Group.
15 August – MTG and NENT Group secure SEK 4 billion credit facility MTG and its subsidiary Nordic Entertainment Group AB (NENT Group) jointly agreed a SEK 4 billion five year revolving credit facility with a group of six Nordic banks.
17 & 31 August – Changes in ownership in MTG and number of votes MTG noted that Kinnevik AB had notified the Swedish Financial Supervision Authority that Kinnevik had completed the previously announced distribution of all of its MTG shares to its shareholders. Following the reclassification by Modern Times Group MTG AB shareholders of 4,461,691 MTG Class A shares into MTG Class B shares during August 2018, the total number of MTG Class A shares decreased from 5,007,353 to 545,662 and the total number of MTG Class B shares increased from 61,979,771 to 66,441,462. The total number of MTG Class C shares was unchanged at 660,000.
11 September – NENT listing planned for Q119 & appointment of Board Directors Following the completion of Kinnevik AB’s distribution of its entire shareholding in MTG to its shareholders, MTG announced that it would continue its work towards the previously announced distribution and listing of NENT Group (comprising Nordic Entertainment, MTG Studios and Splay Networks) in Q1 2019. Anders Borg, Henrik Clausen and Kristina Schauman were also appointed as new NENT Group Board Directors.
18 September – NENT Group Norway appoints new CEO NENT Group appointed Vegard Klubbenes Drogseth as CEO of NENT Group Norway, with responsibility for the Norwegian broadcast TV, streaming and radio operations.
18 September – NENT Group secures Danish rights to UEFA Euro 2020 NENT Group acquired the exclusive Danish rights to the 2020 UEFA European Football Championship (UEFA Euro 2020). The tournament will be played in 12 cities across Europe – including four matches in Copenhagen – and all games will be shown live on NENT Group’s streaming service Viaplay in Denmark.
28 September – Increased ownership in ESL & writes down Zoomin.TV assets MTG increased its ownership in Turtle Entertainment GmbH (Turtle), the world’s largest esports company and operator of the well-known ESL brand, by 8.44% to 82.48% for a cash consideration of EUR 14.3m (approximately SEK 149m). MTG acquired the shares from the founders and members of the management team. The remaining liability related to the option and the contingent consideration was valued at SEK 316m based on the terms in the agreement, resulting in a non-cash revaluation gain of SEK 172m. MTG also reported a non-cash cost of SEK 164m related to Zoomin.TV arising from the writing down of assets after a thorough review of the balance sheet following MTG’s acquisition of the remaining shares in the company in May 2018. Both items are reported as IAC in the Q3 2018 results.
A full list of MTG announcements and reports can be found at www.mtg.com.

Q3 2018 Modern Times Group MTG AB 4(30)
Group performance Net sales Net sales were up 9% on a reported basis to SEK 4,683m (4,280), and up 3% on an organic basis. Acquisitions and divestments contributed 1% of the growth and primarily comprised the consolidation of Kongregate, while the FX impact was 5%.
Net sales & y-o-y organic growth (SEKm (left side); % (right side))
Net sales by segment (SEKm)
Operating expenditure Operating expenditure was up 4% at constant FX and driven primarily by the ongoing investment in digital expansion and the consolidation of Kongregate. Depreciation and amortisation charges increased to SEK 111m (87), including amortisation charges of surplus values of SEK 37m (30).
Operating income and items affecting comparability Operating income before IAC was up 28% to SEK 328m (257) and included SEK 7m of transaction costs related to the proposed split of MTG. All segments but MTG Studios reported higher profits compared to last year. Items affecting comparability amounted to SEK 12m (-) and primarily included a revaluation gain of SEK 172m resulting from the acquisition of shares in Turtle Entertainment and a non-cash cost of SEK 164m following the writing down of Zoomin.TV;s assets. Please see page 25 for a comprehensive list of items affecting comparability.

Q3 2018 Modern Times Group MTG AB 5(30)
Operating income & operating margin before IAC 1) (SEKm (left side); % (right side))
Operating income by segment (SEKm)
1) Quarterly fluctuations reflect the seasonality of advertising markets. Please refer to page 23 for Alternative Performance Measures
Net financials & net income from continuing operations Net interest and other financial items totalled SEK -16m (-14). Net interest amounted to SEK -1m (-7). Other financial items amounted to SEK -15m (-7) and mainly comprised the impact of exchange rate differences on financial items. Net income from continuing operations amounted to SEK 194m (189), and basic earnings per share totalled SEK 2.35 (2.49).
Discontinued operations Discontinued operations in the quarter comprised the Tanzanian operation, the sale of which is yet to close. Net income from discontinued operations amounted to SEK -2m (-11). Total net income for the Group therefore amounted to SEK 192m (177), and total basic earnings per share amounted to SEK 2.32 (2.31).
0
5
10
15
0
100
200
300
400
500
600
Q42016
Q12017
Q22017
Q32017
Q42017
Q12018
Q22018
Q32018
Operating income Operating margin
NordicEntertainment
InternationalEntertainment
MTG Studios MTGx-100
-50
0
50
100
150
200
250
300
350
Q3 2017 Q3 2018

Q3 2018 Modern Times Group MTG AB 6(30)
Segmental performance
Nordic Entertainment
Sales & profits up
(SEKm) Q3 2018 Q3 2017 Nine
months 2018
Nine months
2017
Full year 2017
Net sales 2,985 2,819 9,397 8,733 11,961 of which Free-TV & Radio 1,167 1,134 3,876 3,656 5,094 of which Pay-TV 1,818 1,685 5,521 5,076 6,867
Costs -2,664 -2,518 -8,267 -7,668 -10,388
Operating income 321 301 1,130 1,064 1,574 Operating margin 10.8% 10.7% 12.0% 12.2% 13.2%
Net sales growth y-o-y
Organic growth 2.2% 3.2% 5.1% 7.4% 6.6% Acquisitions/divestments 0.0% 0.0% 0.0% 0.0% 0.0% Changes in FX rates 3.7% -0.1% 2.5% 1.4% 0.8% Reported growth 5.9% 3.1% 7.6% 8.8% 7.4%
Sales were up 2% on an organic basis and driven by the continued growth of Viaplay and the Swedish radio business. Operating costs were also up and reflected FX effects, the ongoing investments in the scaling of Viaplay and Viafree, as well as costs related to the two new national radio networks in Sweden. Operating income increased to SEK 321m (301), with an operating margin of 10.8% (10.7).
Free-TV and Radio sales were up 3% on a reported basis but down at constant FX rates. Viafree has continued its rapid growth, and the growth in the Swedish Radio business accelerated further following the launch of the new radio licenses from the beginning of August. Free-TV sales were down and reflected the lower TV viewing levels and the coverage of the FIFA World Cup on competing channels. The Swedish TV advertising market is estimated to have grown, while the Danish and Norwegian markets are estimated to have declined. The Danish, Norwegian and Swedish TV audience shares were all down, while both the Swedish and Norwegian radio audience shares were up.
Pay-TV sales were up 8% on a reported basis following continued volume and value growth at Viaplay. When excluding Viaplay, the subscriber base was up y-o-y but slightly down q-o-q. Average revenue per satellite user was up at constant FX.

Q3 2018 Modern Times Group MTG AB 7(30)
International Entertainment
Organic sales & profits up
(SEKm) Q3 2018 Q3 2017 Nine
months 2018
Nine months
2017
Full year 2017
Net sales 232 246 861 817 1,189
Costs -183 -216 -700 -717 -1,013
Operating income 49 29 161 100 176 Operating margin 21.1% 11.9% 18.7% 12.3% 14.8%
Net sales growth y-o-y
Organic growth 10.1% 12.0% 10.4% 7.3% 6.9% Acquisitions/divestments -22.6% -1.0% -11.2% -1.1% -1.0% Changes in FX rates 6.8% 0.3% 6.2% 2.4% 1.9% Reported growth -5.7% 11.2% 5.4% 8.6% 7.8%
Sales were up 10% on an organic basis following continued healthy growth in the Bulgarian TV and online businesses. The Bulgarian audience share was slightly down while the TV advertising market is estimated to have grown. Operating income increased to SEK 49m (29) with an operating margin of 21.1% (11.9).
Trace was deconsolidated from the start of May following the closure of the previously announced divestment. The Bulgarian Commission for Protection of Competition announced in July that it would not allow the previously announced sale of MTG’s shareholding in Nova Broadcasting Group in Bulgaria to PPF Group. Nova appealed the decision with the Bulgarian Supreme Administrative Court on 30 July 2018 and the first hearing of the appeal is scheduled for 12 March 2019. Nova filed a request to the Chairman of the Supreme Administrative Court in September to reschedule the hearing for an earlier date.

Q3 2018 Modern Times Group MTG AB 8(30)
MTG Studios
Sales & profits down
(SEKm) Q3 2018 Q3 2017 Nine
months 2018
Nine months
2017
Full year 2017
Net sales 480 529 1,277 1,315 1,832
Costs -446 -486 -1,249 -1,270 -1,764
Operating income 34 43 28 45 68 Operating margin 7.1% 8.1% 2.2% 3.5% 3.7%
Net sales growth y-o-y
Organic growth -22.7% 14.8% -14.4% 4.5% 2.7% Acquisitions/divestments 8.8% 0.7% 7.9% 0.3% 0.3% Changes in FX rates 4.7% 0.0% 3.5% 1.0% 0.1% Reported growth -9.2% 15.5% -2.9% 5.7% 3.1%
Sales were down 23% on an organic basis and reflected lower sales of both scripted and non-scripted productions. The reported decline of 9% included the contribution from Splay Networks, which was moved to MTG Studios from the MTGx segment in Q2 2018. Historical numbers have not been restated.
Scripted sales were down as a result of timing differences in the production schedule with two large scale productions delayed until Q4. The demand for scripted drama remains high and the promising forward pipeline includes a number of signed development deals. Non-scripted sales were also down in the quarter. Splay Networks delivered another quarter of double digit sales growth as interest in branded content and influencer campaigns continued to rise.
Operating income amounted to SEK 34m (43) with an operating margin of 7.1% (8.1).
MTG Studios net sales and operating income would have been SEK 432m and SEK 34m, respectively, if Splay Networks’ results had not been included in the quarter.

Q3 2018 Modern Times Group MTG AB 9(30)
MTGx
Sales up & EBIT profitable
(SEKm) Q3 2018 Q3 2017 Nine
months 2018
Nine months
2017
Full year 2017
Net sales 1,024 798 2,970 1,699 2,964 of which esports 370 349 1,071 855 1,370 of which online gaming 618 364 1,740 600 1,234 of which digital video content 36 84 159 245 360
Costs before depreciation and amortisation -946 -792 -2,814 -1,784 -2,949
EBITDA 78 6 157 -85 14 EBITDA margin 7.6% 0.7% 5.3% -5.0% 0.5%
Depreciation -14 -11 -41 -28 -40 Amortisation 1) -53 -33 -137 -66 -145
Costs -1,014 -836 -2,992 -1,878 -3,134
Operating income 11 -38 -21 -179 -170 Operating margin 1.1% -4.8% -0.7% -10.5% -5.7%
Net sales growth y-o-y
Organic growth 12.1% 39.3% 19.3% 22.1% 37.0% Acquisitions/divestments 6.4% 117.5% 47.8% 72.2% 101.7% Changes in FX rates 10.0% 1.0% 7.6% 4.2% 2.6% Change in presentation of prize money - -9.2% - -15.6% -17.8% Reported growth 28.4% 148.5% 74.8% 82.9% 123.5%
1) Includes amortisation and write down of intangible assets in subsidiaries and on acquisition related surplus values.
Sales were up 12% on an organic basis and primarily reflected the exceptional performance of InnoGames. The reported growth of 28% included the consolidation of Kongregate (the entire period from 21 July to 31 December 2017 was reported in MTG’s Q4 results statement). The reported growth did not include Splay Networks, which has been reported in MTG Studios from Q2 2018 and historical numbers have not been restated.
Segment EBITDA amounted to SEK 78m (6). Depreciation and amortisation charges totalled SEK 67m (44) and included SEK 31m of surplus value amortisation charges. Operating income for the segment amounted to SEK 11m (-38). MTGx net sales and operating income would have been SEK 1,073m and SEK 11m, respectively, if Splay Networks’ had still been included in the quarter.
Esports sales were up 6% and driven by 16% growth in ESL’s revenues from owned & operated events, as well as positive currently effects. This was offset by lower work-for-hire revenues, as well as lower DreamHack revenues following changes in the event schedule between Q3 and Q4.
Online gaming sales were up approximately 29% on a pro forma basis. The InnoGames sales growth was driven by the exceptional performance of Forge of Empires, which was boosted by marketing campaigns around content updates. Kongregate’s pro forma revenues were down, which partly reflected delays in new game launches.
Digital Video Content sales were down 57% and primarily reflected the above-mentioned move of Splay Networks out of the segment, as well as a 16% revenue decline for Zoomin.TV, which is being gradually transformed into a branded entertainment company.

Q3 2018 Modern Times Group MTG AB 10(30)
Financial review
Cash flow from continuing operations
Cash flow from operations Cash flow from operations before changes in working capital amounted to SEK 251m (273). Depreciation and amortisation charges totalled SEK 111m (87). The Group reported a SEK -194m (-776) change in working capital. The reduction compared to last year is largely driven by lower sports payments. Net cash flow from operations totalled SEK 57m (-503).
Investing activities Investments in business operations amounted to SEK 154m (518) and was related to the acquisition of the remaining 8,44% of ESL (SEK 149m), 51% of Epic Film ApS (SEK 4 m) and the remaining minority in Digital Rights Group (SEK 1m). Group capital expenditure on tangible and intangible assets totalled SEK 445m (115) including payments for the new radio licences in Sweden. Total cash flow relating to investing activities amounted to SEK -546m (-679).
Financing activities Cash flow from financing activities amounted to SEK 261m (-582). Total borrowings decreased in the quarter by SEK 342m to SEK 3,849m (3,992).
The net change in cash and cash equivalents amounted to SEK -229m (-1,764). The Group had cash and cash equivalents of SEK 733m (395) at the end of the period.
Net debt The Group's net debt position, which is defined as the sum of short and long-term interest-bearing liabilities less total cash and interest-bearing assets, amounted to SEK 3,085m (3,309) at the end of the period.
Net debt (SEKm)
Net debt/EBITDA ratio, based on 12 months EBITDA before IAC, continuing operations
Related party transactions There are no related party relationships other than with subsidiaries, associated companies and joint ventures since Kinnevik distributed all its shares held in MTG in August 2018.

Q3 2018 Modern Times Group MTG AB 11(30)
Parent company Modern Times Group MTG AB is the Group’s parent company and is responsible for Group-wide management, administration and financing.
(SEKm) Q3 2018 Q3 2017 Nine
months 2018
Nine months
2017
Full year 2017
Net sales 6 10 30 30 49 Net interest and other financial items 41 50 133 198 263 Income before tax and appropriations 14 1 -48 39 -49
The increase in income before tax and appropriations in the quarter mainly relates to lower operating costs as part of the cost base was transferred to the NENT Group parent. Net interest and other financial items are affected by transaction costs related to new facilities with the banks. The parent company had cash and cash equivalents of SEK 22m (33) at the end of the period. Total available credit facilities amounted to SEK 4,325m whereof SEK 3,968m (5,820) was unutilised at the end of the period.
The total number of shares outstanding at the end of the period was 67,660,866 (66,725,249) and excluded the 660,000 Class C shares and 6,099 Class B shares held by MTG as treasury shares. The total number of issued shares did not change during the period.
Other information
Corporate responsibility Educational entertainment, equality and diversity, and creating positive social impacts are all key sustainability priorities, which is why award-winning Viaplay kids format ‘The Great Escape’ will return for a second season in December 2018 across Scandinavia. ESL and Vodafone have also agreed a global partnership that includes support for initiatives promoting diversity and female participation in esports. NENT Group launched a new campaign to support research and raise awareness about diabetes, which today affects 415 million adults worldwide, and will host the second annual Diabetes Gala fundraiser on 14 November in Stockholm.
Accounting policies This Interim report has been prepared according to ‘IAS 34 Interim Financial Reporting’ and ‘The Annual Accounts Act’. The interim report for the parent company has been prepared according to the Annual Accounts Act - Chapter 9 ‘Interim Report’.
The Group's consolidated accounts and the parent company accounts have been prepared according to the same accounting policies and calculation methods as were applied in the preparation of the 2017 Annual Report except for the new standards IFRS 9 Financial instruments and IFRS 15 Revenue from Contracts with Customer that have been applied in 2018.
IFRS 9 Financial instruments: This standard addresses the classification, measurement, recognition, impairment and derecognition of financial instruments. IFRS9 also addresses general hedge accounting. The standard has no material impact on the Group’s financial position or result.
IFRS 15 Revenue from Contracts with Customers: The standard replaces IAS 11 Construction Contracts and IAS 18 Revenue and establishes a new framework for determining when and how

Q3 2018 Modern Times Group MTG AB 12(30)
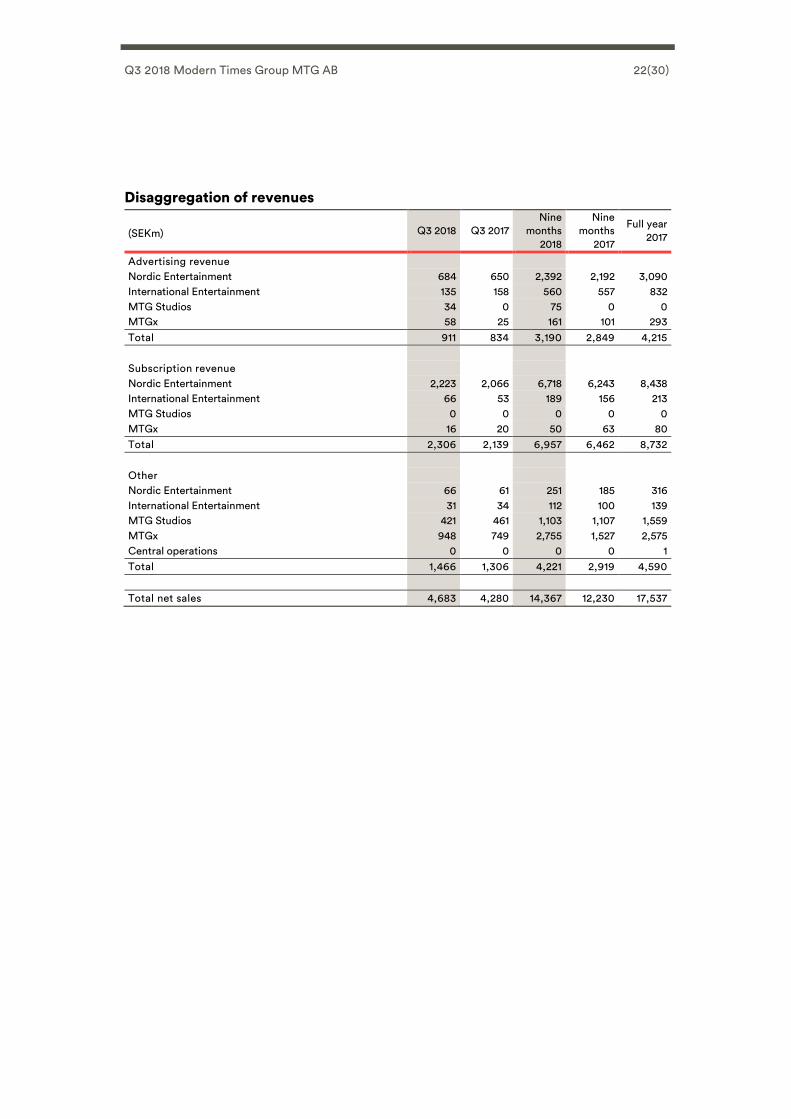
much revenue to recognise. The standard introduces a five-step model to be applied to all contracts with customers in order to establish the revenue recognition. IFRS 15 has had no significant effects on the timing and the amount of revenue recognised in the Group’s consolidated accounts. For further disclosures please see Disaggregation of revenues on page 22.
IFRS 16 Leases (effective from financial year 2019): For the lessee the classification according to IAS 17 in operating and finance lease is replaced by a single lease accounting model. All leases should be recognized on-balance sheet as a right-of-use asset and lease liability. Leases of low-value assets and items as well as leases of 12 months or less are exempt from the requirements. Depreciation of lease assets must be separately recognised from interest on lease liabilities in the income statement. The Group is yet to assess IFRS 16’s full impact, however, there is a number of operating leases for e.g. offices which will result in an increase of the balance sheet and a certain shift from operating expenses to interest expenses in the Group’s income statement.
Discontinued operations/Assets held for sale: Discontinued operations comprise MTG´s business in Tanzania. In 2017 the Czech, Baltic and African (excluding Trace) operations were reported as discontinued operations as a consequence of the completion of the divestments of the Czech (Prima) and Baltic operations and the agreement to sell the African operation (pending regulatory approval). Net income and net change in cash from discontinued operations have been reported on separate line items in the consolidated income statement and the consolidated statement of cash flow respectively. The considerations received for the divestment of Prima and the Baltic operations in 2017 are included in cash flow from continuing operations in the line Proceeds from sales of shares. Assets and liabilities related to the named operations are reported on the line items Assets held for sale and Liabilities related to assets held for sale in the consolidated balance sheet in the relevant periods.
MTG has entered into an agreement to sell its shares in the Nova Broadcasting Group within the segment International Entertainment. Hereby, the assets and liabilities of the company have been reported as Assets held for sale and Liabilities related to assets held for sale since the first quarter of 2018. The sale of the shares in TRACE PARTNERS S.A.S. was completed in May. Trace assets and liabilities was reported as Assets held for sale and Liabilities related to assets held for sale in the first quarter of 2018.
Risks & uncertainties Significant risks and uncertainties exist for the Group and the parent company. These factors include the prevailing economic and business environments in some of the markets; commercial risks related to expansion into new territories; other political and legislative risks related to changes in rules and regulations in the various territories in which the Group operates; exposure to foreign exchange rate movements, and the US dollar and Euro linked currencies in particular; and the emergence of new technologies and competitors. The increasing shift towards online viewing and platforms could also potentially make the Group a target for cyber-attacks, intrusions, disruptions or denials of service. Risks and uncertainties are also described in more detail in the 2017 Annual Report, which is available at www.mtg.com.
Stockholm, 23 October 2018 Jørgen Madsen Lindemann President & CEO

Q3 2018 Modern Times Group MTG AB 13(30)
Auditors’ Review Report
Introduction We have reviewed the summary interim financial information (interim report) of Modern Times Group MTG AB (publ.) as of 30 September 2018 and the nine month period then ended. The Board of Directors and the President & CEO are responsible for the preparation and presentation of this interim report in accordance with IAS 34 and the Annual Accounts Act. Our responsibility is to express a conclusion on this interim report based on our review.
Scope of review We conducted our review in accordance with International Standard on Review Engagements ISRE 2410 Review of Interim Financial Information Performed by the Independent Auditor of the Entity. A review of interim financial information consists of making inquiries, primarily of persons responsible for financial and accounting matters, and applying analytical and other review procedures. A review is substantially less in scope than an audit conducted in accordance with International Standards on Auditing and other generally accepted auditing practices and consequently does not enable us to obtain assurance that we would become aware of all significant matters that might be identified in an audit. Accordingly, we do not express an audit opinion.
Conclusion Based on our review, nothing has come to our attention that causes to believe that the interim report is not prepared, in all material respects, for the Group in accordance with IAS 34 and the Annual Accounts Act, and for the Parent Company in accordance with the Annual Accounts Act.
Stockholm, 23 October 2018
KPMG AB
Joakim Thilstedt Authorised Public Accountant
Q3 2018 Modern Times Group MTG AB 14(30)
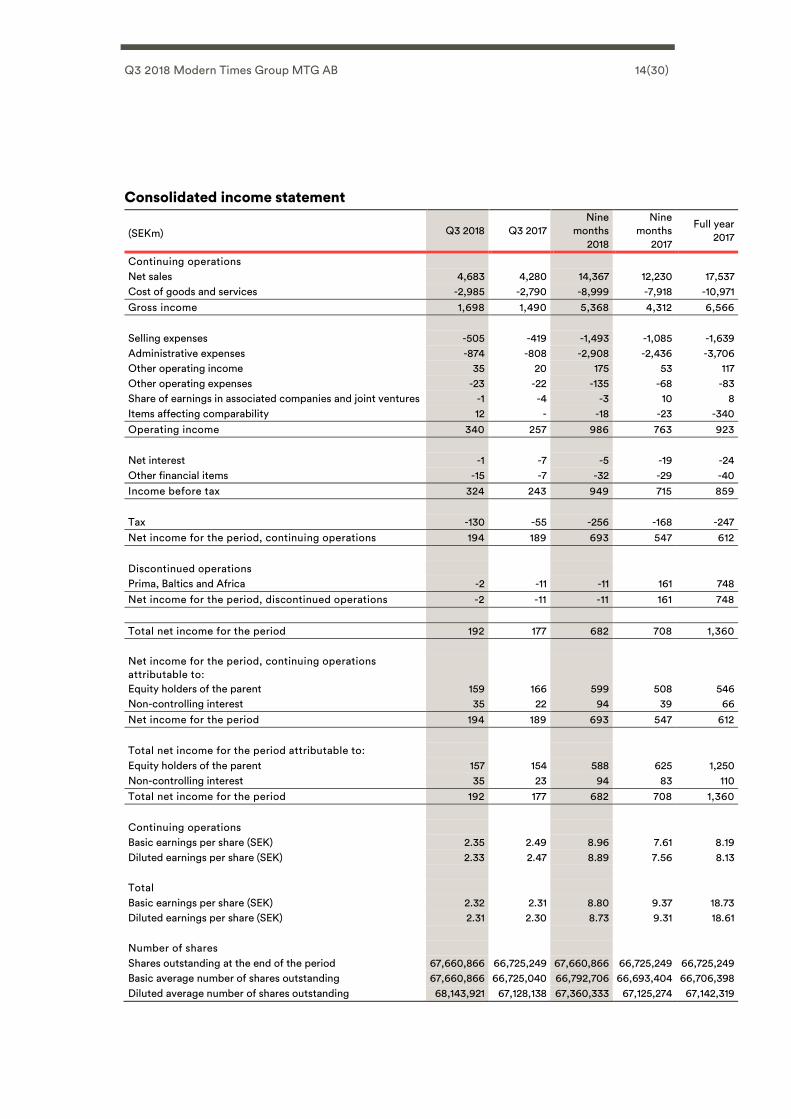
Consolidated income statement
(SEKm) Q3 2018 Q3 2017 Nine
months 2018
Nine months
2017
Full year 2017
Continuing operations
Net sales 4,683 4,280 14,367 12,230 17,537 Cost of goods and services -2,985 -2,790 -8,999 -7,918 -10,971 Gross income 1,698 1,490 5,368 4,312 6,566
Selling expenses -505 -419 -1,493 -1,085 -1,639 Administrative expenses -874 -808 -2,908 -2,436 -3,706 Other operating income 35 20 175 53 117 Other operating expenses -23 -22 -135 -68 -83 Share of earnings in associated companies and joint ventures -1 -4 -3 10 8 Items affecting comparability 12 - -18 -23 -340 Operating income 340 257 986 763 923
Net interest -1 -7 -5 -19 -24 Other financial items -15 -7 -32 -29 -40 Income before tax 324 243 949 715 859
Tax -130 -55 -256 -168 -247 Net income for the period, continuing operations 194 189 693 547 612
Discontinued operations
Prima, Baltics and Africa -2 -11 -11 161 748 Net income for the period, discontinued operations -2 -11 -11 161 748
Total net income for the period 192 177 682 708 1,360
Net income for the period, continuing operations attributable to:
Equity holders of the parent 159 166 599 508 546 Non-controlling interest 35 22 94 39 66 Net income for the period 194 189 693 547 612
Total net income for the period attributable to:
Equity holders of the parent 157 154 588 625 1,250 Non-controlling interest 35 23 94 83 110 Total net income for the period 192 177 682 708 1,360
Continuing operations
Basic earnings per share (SEK) 2.35 2.49 8.96 7.61 8.19 Diluted earnings per share (SEK) 2.33 2.47 8.89 7.56 8.13
Total
Basic earnings per share (SEK) 2.32 2.31 8.80 9.37 18.73 Diluted earnings per share (SEK) 2.31 2.30 8.73 9.31 18.61
Number of shares
Shares outstanding at the end of the period 67,660,866 66,725,249 67,660,866 66,725,249 66,725,249 Basic average number of shares outstanding 67,660,866 66,725,040 66,792,706 66,693,404 66,706,398 Diluted average number of shares outstanding 68,143,921 67,128,138 67,360,333 67,125,274 67,142,319

Q3 2018 Modern Times Group MTG AB 15(30)
Consolidated statement of comprehensive income
(SEKm) Q3 2018 Q3 2017 Nine
months 2018
Nine months
2017
Full year 2017
Net income, continuing operations 194 189 693 547 612 Other comprehensive income
Items that are or may be reclassified to profit or loss net of tax:
Currency translation differences -92 -3 329 -39 36 Cash flow hedge -10 -35 77 -166 -121 Other comprehensive income, continuing operations -102 -37 406 -205 -85
Total comprehensive income, continuing operations 93 151 1,099 342 527
Net income, discontinued operations 1) -2 -11 -11 161 748 Other comprehensive income
Items that are or may be reclassified to profit or loss net of tax:
Currency translation differences 0 5 -6 -59 -54 Total comprehensive income, discontinued operations -2 -7 -17 102 693
Total comprehensive income for the period 91 145 1,082 444 1,221
Total comprehensive income attributable to:
Equity holders of the parent 75 120 919 369 1,098 Non-controlling interest 16 25 163 75 123 Total comprehensive income for the period 91 145 1,082 444 1,221
1) The full year 2017 results include a capital gain of SEK 593m from the divestment of the Baltic operations.

Q3 2018 Modern Times Group MTG AB 16(30)
Condensed consolidated balance sheet
(SEKm) 30 Sep
2018 30 Sep
2017 31 Dec
2017
Non-current assets Goodwill 6,212 6,964 6,363 Other intangible assets 2,783 2,446 2,521 Total intangible assets 8,995 9,410 8,884
Total tangible assets 273 264 272
Shares and participations in associated companies 121 80 85 Interest-bearing financial receivables 16 13 10 Other financial receivables 375 382 413 Total non-current financial assets 512 474 507 Total non-current assets 9,780 10,148 9,664
Current assets Inventory 2,400 2,263 2,183 Interest-bearing current receivables 0 69 2 Other current receivables 6,083 5,606 6,027 Cash, cash equivalents and short-term investments 733 395 1,394 Assets held for sale 1) 840 774 16 Total current assets 10,057 9,106 9,622 Total assets 19,837 19,254 19,285
Equity Shareholders’ equity 5,291 4,433 5,179 Non-controlling interest 1,552 1,339 1,393 Total equity 6,843 5,772 6,572
Non-current liabilities Long-term borrowings 500 499 500 Other non-current interest-bearing liabilities 0 83 95 Total non-current interest-bearing liabilities 500 582 595
Provisions 1,188 1,099 1,175 Non-current liabilities at fair value 417 1,209 829 Other non-interest-bearing liabilities 32 59 48 Total non-current non-interest-bearing liabilities 1,637 2,368 2,052 Total non-current liabilities 2,137 2,950 2,648
Current liabilities Current liabilities at fair value 42 154 176 Short-term loans 3,349 3,408 2,625 Other current interest-bearing liabilities 0 1 3 Other current non-interest-bearing liabilities 7,110 6,741 7,244 Liabilities related to assets held for sale 1) 355 228 18 Total current liabilities 10,857 10,533 10,066 Total liabilities 12,993 13,482 12,713 Total shareholders’ equity and liabilities 19,837 19,254 19,285
1) Relates to Nova Group in Q3 2018 and to the Baltic and African companies (excluding Trace) in 2017.
The carrying amounts are considered to be reasonable approximations of fair value for all financial assets and financial liabilities.

Q3 2018 Modern Times Group MTG AB 17(30)
Condensed consolidated statement of cash flows
(SEKm) Q3 2018 Q3 2017 Nine
months 2018
Nine months
2017
Full year 2017
Cash flow from operations 251 273 1,028 772 1,311 Changes in working capital -194 -776 -661 -976 -725 Net cash flow to/from operations 57 -503 368 -204 586
Proceeds from sales of shares 0 - 297 1,108 2,013 Acquisitions of subsidiaries and associates -154 -518 -235 -1,114 -1,250 Investments in other non-current assets -445 -115 -668 -258 -330 Other cash flow from/used in investing activities 52 -47 -25 -41 32 Cash flow from/used in investing activities -546 -679 -631 -305 465
Net change in loans 342 -597 623 998 227 Dividends to shareholders 0 - -834 -800 -800 Other cash flow from/used in financing activities -81 15 3 36 224 Cash flow from/used in financing activities 261 -582 -208 234 -349
Net change in cash, continuing operations -229 -1,764 -472 -274 703
Net change in cash, discontinued operations -1 -1 3 28 42
Total net change in cash and cash equivalents -230 -1,765 -469 -246 745
Cash and cash equivalents at the beginning of the period
1,026 2,167 1,394 666 666
Translation differences in cash and cash equivalents 5 -1 42 -1 2 Cash and cash equivalents in assets held for sale -69 -4 -234 -24 -19 Cash and cash equivalents at end of the period 733 395 733 395 1,394
Condensed consolidated statement of changes in equity
(SEKm) 30 Sep
2018 30 Sep
2017 31 Dec
2017
Opening balance 6,572 5,016 5,016 Net loss/income for the period 682 708 1,360 Other comprehensive income for the period 400 -264 -139 Total comprehensive income for the period 1,082 444 1,221
Effect of employee share programmes 27 55 73 Change in non-controlling interests 1 1,061 1,067 Dividends to shareholders -834 -800 -800 Dividends to non-controlling interests -5 -4 -4 Closing balance 6,843 5,772 6,572

Q3 2018 Modern Times Group MTG AB 18(30)
Parent company condensed income statement
(SEKm) Q3 2018 Q3 2017 Nine
months 2018
Nine months
2017
Full year 2017
Net sales 6 10 30 30 49 Gross income 6 10 30 30 49
Administrative expenses -32 -59 -211 -188 -361 Operating income -26 -49 -181 -158 -312
Net interest and other financial items 41 50 133 198 263 Income before tax and appropriations 14 1 -48 39 -49
Appropriations - - - - 317
Tax -3 -1 18 1 -59 Net income for the period 11 0 -31 40 209
Parent company condensed statement of comprehensive income
(SEKm) Q3 2018 Q3 2017 Nine
months 2018
Nine months
2017
Full year 2017
Net income for the period 11 0 -31 40 209
Other comprehensive income for the period - - - - -
Total comprehensive income for the period 11 0 -31 40 209

Q3 2018 Modern Times Group MTG AB 19(30)
Parent company condensed balance sheet
(SEKm) 30 Sep
2018 30 Sep
2017 31 Dec
2017
Non-current assets Capitalised expenditure 1 0 0 Machinery and equipment 0 0 0 Shares and participations 6,025 6,340 6,340 Other financial receivables 9,636 10,043 9,976 Total non-current assets 15,662 16,384 16,316
Current assets Current receivables 299 263 877 Cash, cash equivalents and short-term investments 22 33 844 Total current assets 321 296 1,721 Total assets 15,983 16,680 18,037
Shareholders’ equity Restricted equity 338 338 338 Non-restricted equity 4,496 5,154 5,361 Total equity 4,834 5,492 5,699
Untaxed reserves 90 - 90
Non-current liabilities Interest-bearing liabilities 500 500 500 Provisions 18 2 13 Non-interest-bearing liabilities 19 39 35 Total non-current liabilities 537 540 548
Current liabilities Other interest-bearing liabilities 10,314 10,459 11,227 Non-interest-bearing liabilities 208 188 473 Total current liabilities 10,522 10,647 11,700 Total shareholders’ equity and liabilities 15,983 16,680 18,037

Q3 2018 Modern Times Group MTG AB 20(30)
Net Sales by business segments
(SEKm) Q1
2017 Q2
2017 Q3
2017 Q4
2017 Full year
2017 Q1
2018 Q2
2018 Q3
2018
Nordic Entertainment 2,911 3,003 2,819 3,229 11,961 3,120 3,292 2,985 of which Free-TV & Radio 1,204 1,319 1,134 1,438 5,094 1,287 1,422 1,167 of which Pay-TV 1,706 1,684 1,685 1,791 6,867 1,833 1,870 1,818 International Entertainment 264 308 246 372 1,189 315 315 232 MTG Studios 323 463 529 517 1,832 321 476 480 MTGx 292 610 798 1,264 2,964 952 994 1,024 of which esports 219 286 349 515 1,370 290 411 370 of which online gaming - 236 364 634 1,234 577 544 618 of which digital video content 73 88 84 115 360 85 38 36 Central operations 46 47 45 53 190 36 30 16 Eliminations -130 -184 -156 -127 -599 -70 -96 -54 Total net sales 3,704 4,246 4,280 5,307 17,537 4,674 5,010 4,683
Splay Networks is from Q2 2018 reported in MTG Studios instead of MTGx. Historical numbers have not been restated. Net sales for Q3 2018 in MTG Studios and MTGx would have been SEK 432m and SEK 1,073m when excluding this impact.
Net sales – External & Internal
(SEKm) Q1
2017 Q2
2017 Q3
2017 Q4
2017 Full year
2017 Q1
2018 Q2
2018 Q3
2018
Sales external customers Nordic Entertainment 2,875 2,967 2,778 3,225 11,845 3,109 3,279 2,973 International Entertainment 264 304 246 372 1,185 315 315 232 MTG Studios 276 369 461 453 1,559 300 423 455 MTGx 290 605 795 1,258 2,948 950 993 1,023 Central operations 0 0 0 0 1 0 0 0 Total 3,704 4,246 4,280 5,307 17,537 4,674 5,010 4,683
Sales between segments Nordic Entertainment 36 36 41 4 116 11 13 12 International Entertainment - 4 0 0 4 0 0 0 MTG Studios 47 94 68 64 273 20 53 25 MTGx 2 4 3 7 16 3 0 2 Central operations 45 47 44 53 189 36 30 16 Total 130 184 156 127 599 70 96 54
Operating income by business segments
(SEKm) Q1
2017 Q2
2017 Q3
2017 Q4
2017 Full year
2017 Q1
2018 Q2
2018 Q3
2018
Nordic Entertainment 299 465 301 509 1,574 310 498 321 International Entertainment 21 50 29 76 176 40 72 49 MTG Studios -16 19 43 23 68 -15 9 34 MTGx -88 -53 -38 8 -170 -8 -24 11 Central operations & eliminations -78 -90 -78 -138 -384 -90 -117 -87 Total operating income before IAC 137 391 257 478 1,264 237 439 328 Items affecting comparability - -23 - -318 -340 -17 -13 12 Total operating income 137 369 257 161 923 220 426 340
Operating income for Q3 2018 in MTG Studios and MTGx would have been SEK 34m and SEK 11m when excluding the impact of moving Splay from MTGx to MTG Studios.

Q3 2018 Modern Times Group MTG AB 21(30)
Group & segment performance data Q1
2017 Q2
2017 Q3
2017 Q4
2017 Full year
2017 Q1
2018 Q2
2018 Q3
2018
GROUP Organic sales growth (%) 8.7 5.0 7.0 9.7 7.7 9.2 9.3 3.2 Operating margin (%) 1) 3.7 9.2 6.0 9.0 7.2 5.1 8.8 7.0 ROCE, continuing operations (%) 1) 20 19 18 18 17 17 17 Net debt (SEKm) 2,439 2,212 3,309 1,812 2,334 2,287 3,085 Net debt/EBITDA 1.9 1.7 2.2 1.1 1.4 1.3 1.6 NORDIC ENTERTAINMENT Organic sales growth (%) 10.7 8.4 3.2 4.5 6.6 6.2 6.9 2.2 Operating margin (%) 10.3 15.5 10.7 15.8 13.2 9.9 15.1 10.8 CSOV Sweden (15-49) 25.4 24.1 24.6 22.2 24.1 23.1 23.9 23.1 CSOV Norway (15-49) 14.1 17.6 15.3 15.4 15.5 15.1 15.9 13.5 CSOV Denmark (15-49) 22.8 24.6 23.1 23.6 23.6 21.4 24.6 21.6 Subscriber base excl Viaplay ('000s) 981 956 939 938 970 953 946 - of which satellite 442 432 422 409 398 389 382 - of which 3rd party networks 539 525 517 529 572 564 564 Satellite ARPU (SEK) 5,429 5,532 5,503 5,500 5,542 5,764 5,727 INTERNATIONAL ENTERTAINMENT Organic sales growth (%) 4.8 5.1 12.0 6.1 6.9 14.1 7.1 10.1 Operating margin (%) 7.8 16.4 11.9 20.4 14.8 12.8 22.8 21.1 CSOV Bulgaria (18-49) 42.6 42.4 41.9 42.0 42.2 42.2 43.0 41.8 MTG STUDIOS Organic sales growth (%) -5.4 1.4 14.8 -1.5 2.7 -2.1 -13.4 -22.7 Operating margin (%) 1) -5.0 4.1 8.1 4.4 3.7 -4.7 1.9 7.1 MTGx Organic sales growth (%) 27.4 2.8 39.3 71.4 37.0 27.4 24.9 12.1 Operating margin (%) 1) -30.0 -8.7 -4.8 0.7 -5.7 -0.9 -2.4 1.1
1) Adjusted for Items affecting comparability.
Q3 2018 Modern Times Group MTG AB 22(30)
Disaggregation of revenues
(SEKm) Q3 2018 Q3 2017 Nine
months 2018
Nine months
2017
Full year 2017
Advertising revenue Nordic Entertainment 684 650 2,392 2,192 3,090 International Entertainment 135 158 560 557 832 MTG Studios 34 0 75 0 0 MTGx 58 25 161 101 293 Total 911 834 3,190 2,849 4,215
Subscription revenue Nordic Entertainment 2,223 2,066 6,718 6,243 8,438 International Entertainment 66 53 189 156 213 MTG Studios 0 0 0 0 0 MTGx 16 20 50 63 80 Total 2,306 2,139 6,957 6,462 8,732
Other Nordic Entertainment 66 61 251 185 316 International Entertainment 31 34 112 100 139 MTG Studios 421 461 1,103 1,107 1,559 MTGx 948 749 2,755 1,527 2,575 Central operations 0 0 0 0 1 Total 1,466 1,306 4,221 2,919 4,590
Total net sales 4,683 4,280 14,367 12,230 17,537

Q3 2018 Modern Times Group MTG AB 23(30)
Alternative performance measures The purpose of Alternative Performance Measures (APMs) is to facilitate the analysis of business performance and industry trends that cannot be directly derived from financial statements. MTG is using the following APMs:
• Change in net sales from Organic growth, Acquisitions/divestments and Changes in FX rates
• Operating income & margin before IAC • Net debt and Net debt/EBITDA • Capital employed and Return on Capital Employed (ROCE)

Q3 2018 Modern Times Group MTG AB 24(30)
Reconciliation of sales growth Since the Group generates the majority of its sales in currencies other than in the reporting currency (i.e. SEK, Swedish Krona) and currency rates have proven to be rather volatile, and due to the fact that the Group has historically made several acquisitions and divestments, the Company's sales trends and performance are analysed as changes in organic sales growth. This presents the increase or decrease in the overall SEK net sales on a comparable basis, allowing separate discussions of the impact of acquisitions/divestments and exchange rates. The following tables present changes in organic sales growth as reconciled to the change in the total reported net sales.
Sales growth
(SEKm) Q3
2018 %
Q3 2017
% Nine
months 2018
% Nine
months 2017
% Full
year 2017
%
Nordic Entertainment Organic growth 61 2.2% 87 3.2% 446 5.1% 591 7.4% 733 6.6% Acquisitions/divestments 0 0.0% 0 0.0% 0 0.0% 0 0.0% 0 0.0% Changes in FX rates 105 3.7% -2 -0.1% 218 2.5% 115 1.4% 90 0.8% Reported growth 166 5.9% 85 3.1% 664 7.6% 707 8.8% 822 7.4%
International Entertainment Organic growth 20 10.1% 26 12.0% 76 10.4% 54 7.3% 75 6.9% Acquisitions/divestments -50 -22.6% -2 -1.0% -83 -11.2% -8 -1.1% -10 -1.0% Changes in FX rates 17 6.8% 1 0.3% 51 6.2% 18 2.4% 21 1.9% Reported growth -14 -5.7% 25 11.2% 44 5.4% 65 8.6% 86 7.8%
MTG Studios Organic growth -120 -22.7% 68 14.8% -189 -14.4% 56 4.5% 48 2.7% Acquisitions/divestments 46 8.8% 3 0.7% 104 7.9% 3 0.3% 6 0.3% Changes in FX rates 25 4.7% 0 0.0% 46 3.5% 12 1.0% 2 0.1% Reported growth -49 -9.2% 71 15.5% -39 -2.9% 71 5.7% 56 3.1%
MTGx Organic growth 92 12.1% 122 39.3% 312 19.3% 189 22.1% 455 37.0% Acquisitions/divestments 56 6.4% 364 117.5% 829 47.8% 618 72.2% 1,249 101.7% Changes in FX rates 80 10.0% 3 1.0% 130 7.6% 36 4.2% 32 2.6% Change in presentation of prize money
- - -11 -9.2% - - -73 -15.6% -98 -17.8%
Reported growth 227 28.4% 477 148.5% 1,271 74.8% 771 82.9% 1,638 123.5%
Total operations Organic growth 135 3.2% 256 7.0% 867 7.1% 734 6.9% 1,151 7.7% Acquisitions/divestments 44 1.0% 365 10.0% 830 6.7% 614 5.7% 1,244 8.3% Changes in FX rates 224 5.3% 2 0.1% 439 3.6% 180 1.7% 143 1.0% Reported growth 403 9.4% 623 17.0% 2,136 17.5% 1,529 14.3% 2,538 16.9%

Q3 2018 Modern Times Group MTG AB 25(30)
Reconciliation of operating income before IAC Operating income before items affecting comparability refers to operating income after the reversal of material items and events related to changes in the Group’s structure or lines of business, which are relevant for understanding the Group’s development on a like-for-like basis. This measure is used by management to follow and analyse the underlying profits and to offer more comparable figures between periods.
Operating income before and after IAC
(SEKm) Q3 2018 Q3 2017 Nine
months 2018
Nine months
2017
Full year 2017
Operating income 340 257 986 763 923 Items affecting comparability -12 - 18 23 340 Operating income before items affecting comparability
328 257 1,004 785 1,264
Items affecting comparability
(SEKm) Q3 2018 Q3 2017 Nine
months 2018
Nine months
2017
Full year 2017
Restructuring NENT Group 0 - -53 - - Restructuring ESL 0 - -49 - - Capital gain divestment of Trace 0 - 61 - - Net capital gain related to options to acquire shares 182 - 193 - 333 Impairment of goodwill related to closed company -6 - -6 - - Write down of assets, Zoomin.TV -164 - -164 - - Impairment related to goodwill, Zoomin.TV - - - - -593 Impairment related to capitalized development costs, Zoomin.TV
- - - - -58
Reclassification of transaction cost related to InnoGames - - - -23 -23 Total 12 - -18 -23 -340
Items affecting comparability classified by function
(SEKm) Q3 2018 Q3 2017 Nine
months 2018
Nine months
2017
Full year 2017
Cost of goods and services 0 - -15 - -58 Administrative expenses 0 - -86 - - Other operating income 182 - 274 - 333 Other operating expenses -170 - -190 -23 -616 Total 12 - -18 -23 -340

Q3 2018 Modern Times Group MTG AB 26(30)
Reconciliation of net debt and net debt/EBITDA ratio Net debt refers to the net of interest-bearing liabilities less total cash and interest-bearing assets. Net debt is used by management to track the debt evolvement of the Group and to analyse the leverage and refinancing need of the Group. The net debt to EBITDA ratio provides a KPI for net debt in relation to cash profits generated by the business, i.e. an indication of a business' ability to pay off all its debts. This measure is commonly used by financial institutions to rate credit worthiness.
Net debt
(SEKm) 31 Mar
2017 30 Jun
2017 30 Sep
2017 31 Dec
2017 31 Mar
2018 30 Jun
2018 30 Sep
2018
Short-term loans 1,551 2,999 2,408 1,625 2,525 3,000 3,349 Current part of long-term borrowings 1,000 1,000 1,000 1,000 0 0 0 Short-term borrowings 2,551 3,999 3,408 2,625 2,525 3,000 3,349 Other short-term interest-bearing liabilities 1 12 1 3 9 0 0 Total short-term borrowings 2,553 4,011 3,410 2,628 2,534 3,000 3,349 Long-term borrowings 500 500 499 500 500 500 500 Other long-term interest-bearing liabilities 73 79 83 95 124 0 0 Total long-term borrowings 573 579 582 595 624 500 500 Total borrowings 3,125 4,589 3,992 3,223 3,158 3,500 3,849 Cash and cash equivalents 481 2,167 395 1,394 673 1,026 733 Long- and short-term interest bearing assets 14 14 81 11 8 9 16 Total cash and interest bearing assets 495 2,180 477 1,405 681 1,035 749 Net debt excluding assets held for sale 2,630 2,409 3,515 1,818 2,477 2,465 3,100 Net debt related to assets held for sale -191 -197 -206 -6 -143 -178 -15 Total net debt 2,439 2,212 3,309 1,812 2,334 2,287 3,085
Net debt/EBITDA (before IAC) ratio 12 months trailing
(SEKm) Q1
2017 Q2
2017 Q3
2017 Q4
2017 Q1
2018 Q2
2018 Q3
2018
Operating income before IAC 1,055 1,087 1,203 1,264 1,363 1,411 1,482 Depreciation and amortisation 215 240 272 321 365 400 423 EBITDA last 12 months 1) 1,270 1,327 1,476 1,584 1,728 1,810 1,905 Total net debt/EBITDA ratio 12 months trailing
1.9 1.7 2.2 1.1 1.4 1.3 1.6
1) EBITDA relates to continuing operations.
Q3 2018 Modern Times Group MTG AB 27(30)
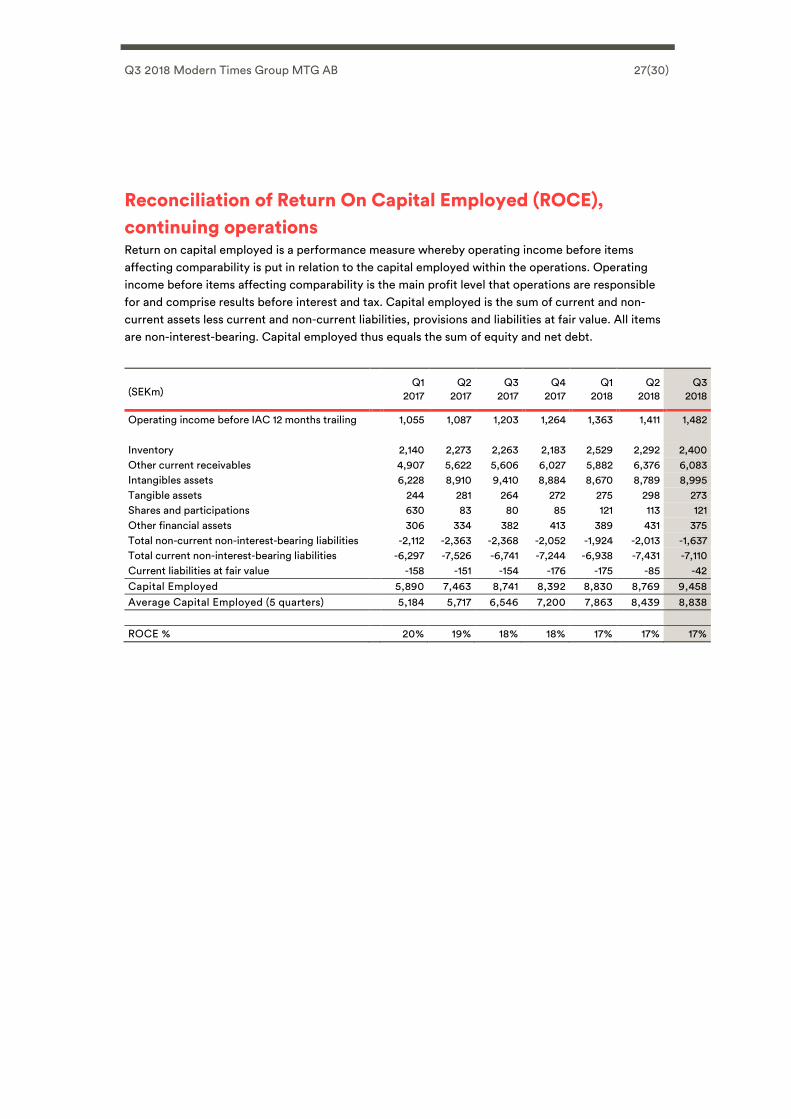
Reconciliation of Return On Capital Employed (ROCE), continuing operations Return on capital employed is a performance measure whereby operating income before items affecting comparability is put in relation to the capital employed within the operations. Operating income before items affecting comparability is the main profit level that operations are responsible for and comprise results before interest and tax. Capital employed is the sum of current and non-current assets less current and non-current liabilities, provisions and liabilities at fair value. All items are non-interest-bearing. Capital employed thus equals the sum of equity and net debt.
(SEKm) Q1
2017 Q2
2017 Q3
2017 Q4
2017 Q1
2018 Q2
2018 Q3
2018
Operating income before IAC 12 months trailing 1,055 1,087 1,203 1,264 1,363 1,411 1,482
Inventory 2,140 2,273 2,263 2,183 2,529 2,292 2,400 Other current receivables 4,907 5,622 5,606 6,027 5,882 6,376 6,083 Intangibles assets 6,228 8,910 9,410 8,884 8,670 8,789 8,995 Tangible assets 244 281 264 272 275 298 273 Shares and participations 630 83 80 85 121 113 121 Other financial assets 306 334 382 413 389 431 375 Total non-current non-interest-bearing liabilities -2,112 -2,363 -2,368 -2,052 -1,924 -2,013 -1,637 Total current non-interest-bearing liabilities -6,297 -7,526 -6,741 -7,244 -6,938 -7,431 -7,110 Current liabilities at fair value -158 -151 -154 -176 -175 -85 -42 Capital Employed 5,890 7,463 8,741 8,392 8,830 8,769 9,458 Average Capital Employed (5 quarters) 5,184 5,717 6,546 7,200 7,863 8,439 8,838
ROCE % 20% 19% 18% 18% 17% 17% 17%

Q3 2018 Modern Times Group MTG AB 28(30)
Definitions Capital employed Capital employed is the sum of current and non-current assets less current and non-current liabilities, provisions and liabilities at fair value. All items are non-interest-bearing.
Cash flow from operations Cash flow from operations comprises operating cash flow before financial items and tax payments, taking into account other financial cash flow.
Earnings per share Earnings per share is expressed as net income attributable to equity holders of the parent divided by the average number of shares.
EBITDA EBITDA is read Earnings Before Interest, Tax, Depreciation and Amortisation.
Items Affecting Comparability Items Affecting Comparability refers to material items and events related to changes in the Group’s structure or lines of business, which are relevant for understanding the Group’s development on a like-for-like basis.
Net debt Net debt is the sum of short- and long-term interest-bearing liabilities less total cash and interest-bearing assets.
Operating income Operating income comprise results before interest and tax. A synonym for operating income is EBIT (Earnings Before Interest and Tax).
Organic growth Change in net sales compared to the same period of the previous year excluding acquisitions and divestments and adjusted for currency effects.
Return on capital employed (ROCE) % Return on capital employed is calculated as operating income as a percentage of average capital employed.

Q3 2018 Modern Times Group MTG AB 29(30)
Shareholder information
2019 Annual General Meeting The 2019 Annual General Meeting will be held on Tuesday 21 May 2019 in Stockholm. Shareholders wishing to have matters considered at the meeting should submit their proposals in writing to [email protected] or to the Company Secretary, Modern Times Group MTG AB, Box 2094, SE-103 13 Stockholm, Sweden, at least seven weeks before the meeting in order for that such proposals may be included in the notices to the meeting. Further details of when and how to register will be published in advance of the meeting.
In accordance with the resolution of the 2018 Annual General Meeting, the then largest shareholder in MTG, Kinnevik AB, convened a Nomination Committee to prepare proposals for the 2019 Annual General Meeting. Due to the distribution by Kinnevik AB of its shareholding in MTG to its shareholders and the resignation by its representative from the Nomination Committee, the Nomination Committee currently consists of Joachim Spetz, appointed by Swedbank Robur Funds; John Hernander, appointed by Nordea Funds; and Jimmy Bengtsson, appointed by Skandia Liv. The three shareholders which have appointed representatives to the Nomination Committee hold approximately 21 percent of the total voting rights in MTG. The members of the Nomination Committee appointed Joachim Spetz as Committee Chairman at their first meeting.
Please see www.mtg.com/governance/#nomination-committee for information about the work of the Nomination Committee.
Financial calendar Q4 and full year 2018 report 5 February 2019
Questions? [email protected] (or Tobias Gyhlénius, Head of Public Relations; +46 73 699 27 09) [email protected] (or Stefan Lycke, Head of Investor Relations; +46 73 699 27 14)
Download high-resolution photos: Flickr
Follow us: mtg.com / Facebook / Twitter / LinkedIn / Instagram / YouTube
Conference call The company will host a conference call today at 09.00 Stockholm local time, 08.00 London local time and 03.00 New York local time. To participate in the conference call, please dial:
Sweden: +46 (0)8 5033 6574 UK: +44 (0)330 336 9105 US: +1 323-794-2093
The access pin code for the call is 4428237. To listen to the conference call online and for further information, please visit www.mtg.com.

Q3 2018 Modern Times Group MTG AB 30(30)
Modern Times Group MTG AB (Publ.) - Reg no: 556309-9158 – Phone +46 8 562 000 50 – mtg.com
MTG (Modern Times Group MTG AB (publ.)) is a leading international digital entertainment group and we are shaping the future of entertainment by connecting consumers with the content that they love in as many ways as possible. Our brands span TV, radio and next generation entertainment experiences in esports, digital video content and online gaming. Born in Sweden, our shares are listed on Nasdaq Stockholm (‘MTGA’ and ‘MTGB’). This information is information that MTG (Modern Times Group MTG AB (publ.)) is obliged to make public pursuant to the EU Market Abuse Regulation. The information was submitted for publication, through the agency of the contact person set out above, at 07:30 CET on 23 October, 2018.