Embed Size (px)
Citation preview

Q3 2016 Analyst Teleconference
Speaker Notes
Slide 3 : 2016 Third Quarter Market Conditions
Due to the seasonal positive effects, 3rd Quarter is usually the strongest period for the refining operations. However, it was relatively flat in 2016 since already low diesel cracks struggled to rebound in July and August and last year’s record high gasoline cracks were not realised. Therefore refining environment in Q3 of 2016 was considerably weaker than that of 2015. In Q3;
High WTI/Brent spread in the previous years declined and stabilized in 2016.
Positive effects of widening heavy Crude differentials and normalised Crude production with stabilization of high inventories were seen at the end of the quarter.
Especially in September, seasonal maintenance activities started earlier and higher than usual due to the postponements in the previous months supporting the cracks through the end of the month.
In connection with the strong gasoline demand high global capacity utilisation rates were seen creating extra middle distillate supply.
Fluctuating currencies and oil prices within the instable macro economic environment was negative for refining.
On the other hand lower than expected demand in industrial consumption and global terrorist attacks affected tourism hitting the middle distillate demand.
Slide 4 :Key Data Effecting Refining in Q3
Crude oil prices lost some ground in July and in early August with the fear of potential effects of Brexit and decreasing Chinese appetite for the strategic reserves. News about positive developments in Nigeria and Libya which would be adding extra production to the markets were also putting additional pressure on the crude prices. However the easing in dollar after the postponement of the

Fed interest rate hikes and OPEC’s deal for limiting production supported the prices at the end of the quarter.
Increasing availability of heavier crudes in Med increased competition, widening the dated brent-heavy differentials.
Product crack spreads were lower than expected in July-August period but started to improve towards the end of September.
High capacity utilisation rates mainly due to the favorable gasoline cracks despite the record high inventory levels created extra supply. Additionally lower than expected Chinese consumption, lower US industrial activity, more than average Monsoon rains and the effects of global terrorism limited the consumption and decreased demand. Therefore although Q3 was expected to start strong, we have seen depressed cracks in July& Aug.
Especially in late September the situation improved and we started to see better refining environment. During the first half of the year, higher than usual gasoline cracks had made refineries to postpone the maintenance schedules till the end of August. When we’ve come to the end of driving season, many refineries initiated their delayed maintenance in September, positively affecting cracks.
Increase in the agricultural consumption and strong demand in some countries like India, S. Korea, Germany, Great Britain and Turkey helped diesel cracks.
Eventually, we have seen stronger cracks, especially in diesel at the end of Q3
Slide 5 :Key Highlights in Q3 2016
Turkish economy with its strong fundamentals for petroleum products consumption continues to grow. The increase in the vehicle park and oil prices around 50 dollar per barrel levels helped gasoline consumption to sustain its growth pattern Infrastructure investments like 3rd airport, 3rd İstanbul bridge, İstanbul – İzmir highway and urban transformation
makes diesel grow continuously and on top of 15.8 % growth in 2015 diesel continued to grow by 8,6% in the first 8 months of 2016.
Since we have the advantageous position for processing heavy products at RUP, we have achieved to run all of our refineries at full capacity meeting our full capacity utilization targets. Capacity utilizations even higher than 100 % became possible, depending on the optimizations and profitability of the market.
Thanks to the increased capacity utilisation of Tüpraş with the help of RUP and the extra production coming from RUP itself, our sales increased by 8 % in 2016. Domestic Diesel sales in the first 9 months reached to record high 7,8 million tons. As you can see at the bottom of the slide, sales in July has not been effected from the tragic events in Turkey and our sales increased in August and September.

Slide 6 :8 Months 2016 - Turkish Consumption (Million tons)
Despite the fact that there were quite a lot of disturbing one-off factors, Turkish consumption of petroleum products continued its growth pattern in the first 8 months of 2016. According to Energy Market Regulatory Authority, diesel and gasoline consumption in Turkey have increased by 8,6 % and 6,9 % respectively compared to the first 8 months of 2015, reaching to the volumes of 14,4 million
tons and 1,5 million tons respectively.
With the effects of global terrorism and the tension between Russia and Turkey, both tourism and transit flights have been affected. Total Jet consumption including the bunker Jet Fuels sales has declined by 2.6 % in the first 8 months of 2016. Our domestic Jet sales has not been affected and even increased by 4,7%.
Fuel Oil market is quite stable and it’s not decreasing anymore but increased slightly by 1,5%.
Slide 7 :Crude Price Differentials ($/Barrel)
The availability of heavier grades continued to increase in Q3, therefore with rising competition, differentials were even higher.
Although historically Ural spread was expected to be narrowing in the summer months, the competition in Med market resulted in deepening of Urals and Brent differentials. Increasing number of Iranian cargoes added with the Kuwaiti, Iraqi and
Saudi barrels availability in the market made Ural differentials decreasing to historic low values for August and September with more than minus 2,0 dollars per barrel.
In Q3, heavy crude differentials stayed in similar high levels with Q2. The main crudes processed in Tüpraş have been priced between – 4,5 to – 7,0 USD/bbl.
If compared to 2015, positive effects of the differentials on our profitability is higher in 2016. However since Ural’s differentials continue to widen, Med margin was also inflated by 1 – 1,5 USD/bbl.
Slide 8 :Quarterly Product Crack Margins ($/bbl)
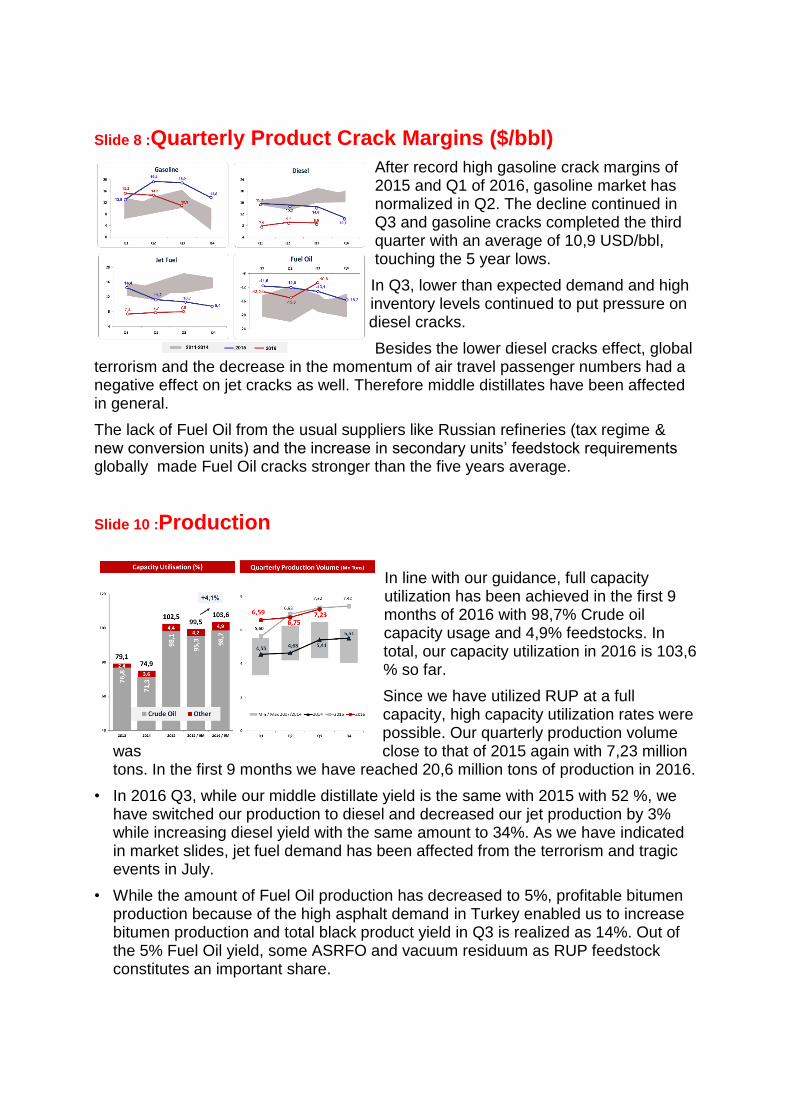
After record high gasoline crack margins of 2015 and Q1 of 2016, gasoline market has normalized in Q2. The decline continued in Q3 and gasoline cracks completed the third quarter with an average of 10,9 USD/bbl, touching the 5 year lows.
In Q3, lower than expected demand and high inventory levels continued to put pressure on diesel cracks.
Besides the lower diesel cracks effect, global terrorism and the decrease in the momentum of air travel passenger numbers had a negative effect on jet cracks as well. Therefore middle distillates have been affected in general.
The lack of Fuel Oil from the usual suppliers like Russian refineries (tax regime & new conversion units) and the increase in secondary units’ feedstock requirements globally made Fuel Oil cracks stronger than the five years average.
Slide 10 :Production
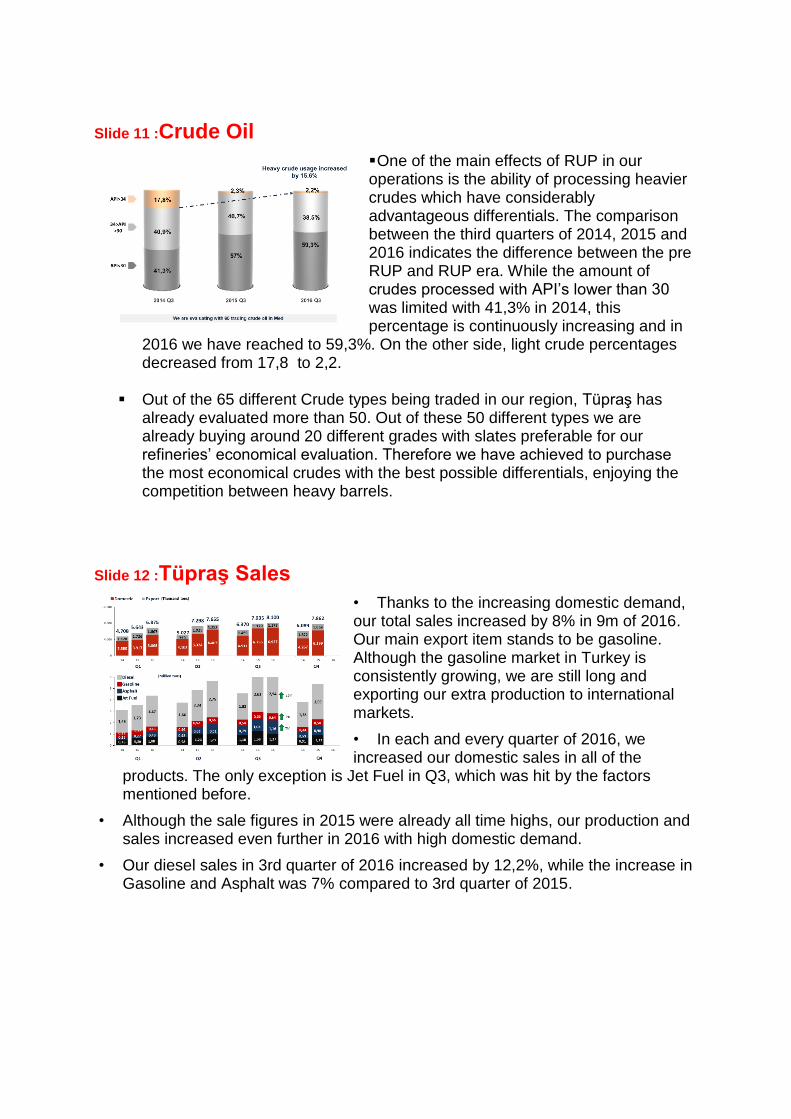
In line with our guidance, full capacity utilization has been achieved in the first 9 months of 2016 with 98,7% Crude oil capacity usage and 4,9% feedstocks. In total, our capacity utilization in 2016 is 103,6 % so far.
Since we have utilized RUP at a full capacity, high capacity utilization rates were possible. Our quarterly production volume
was close to that of 2015 again with 7,23 million tons. In the first 9 months we have reached 20,6 million tons of production in 2016.
• In 2016 Q3, while our middle distillate yield is the same with 2015 with 52 %, we have switched our production to diesel and decreased our jet production by 3% while increasing diesel yield with the same amount to 34%. As we have indicated in market slides, jet fuel demand has been affected from the terrorism and tragic events in July.
• While the amount of Fuel Oil production has decreased to 5%, profitable bitumen production because of the high asphalt demand in Turkey enabled us to increase bitumen production and total black product yield in Q3 is realized as 14%. Out of the 5% Fuel Oil yield, some ASRFO and vacuum residuum as RUP feedstock constitutes an important share.
Slide 11 :Crude Oil
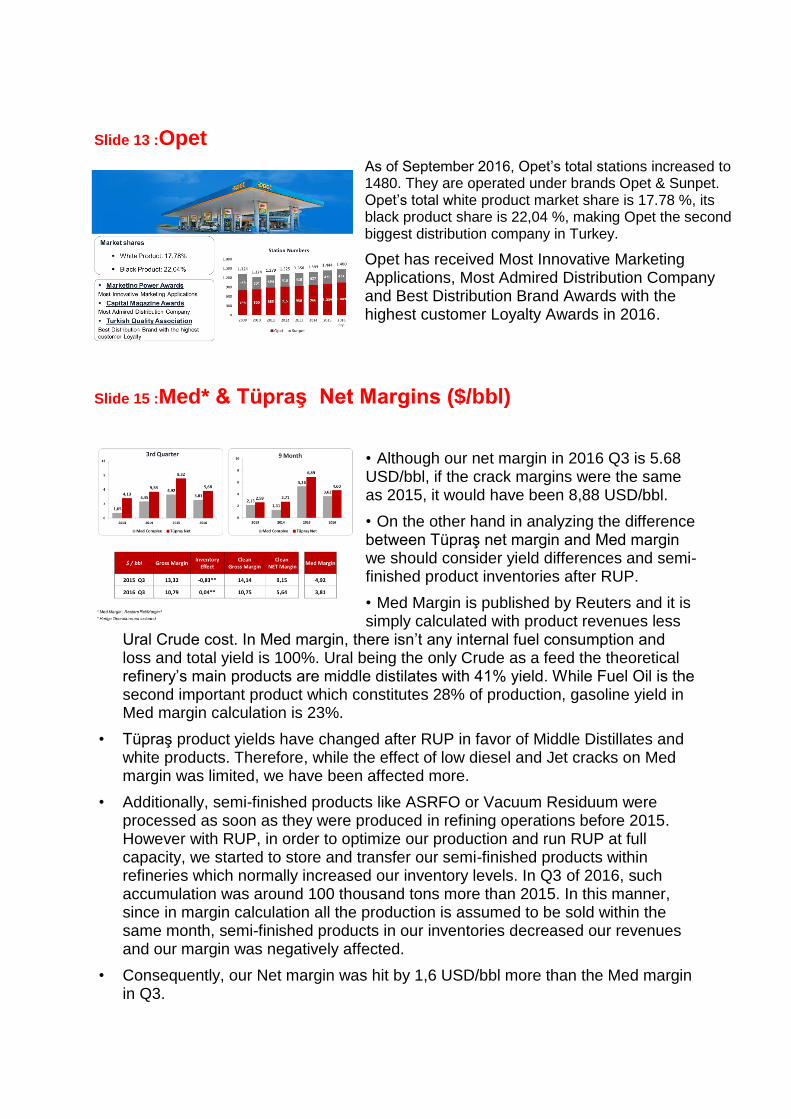
One of the main effects of RUP in our operations is the ability of processing heavier crudes which have considerably advantageous differentials. The comparison between the third quarters of 2014, 2015 and 2016 indicates the difference between the pre RUP and RUP era. While the amount of crudes processed with API’s lower than 30 was limited with 41,3% in 2014, this percentage is continuously increasing and in
2016 we have reached to 59,3%. On the other side, light crude percentages decreased from 17,8 to 2,2.
Out of the 65 different Crude types being traded in our region, Tüpraş has already evaluated more than 50. Out of these 50 different types we are already buying around 20 different grades with slates preferable for our refineries’ economical evaluation. Therefore we have achieved to purchase the most economical crudes with the best possible differentials, enjoying the competition between heavy barrels.
Slide 12 :Tüpraş Sales
• Thanks to the increasing domestic demand, our total sales increased by 8% in 9m of 2016. Our main export item stands to be gasoline. Although the gasoline market in Turkey is consistently growing, we are still long and exporting our extra production to international markets.
• In each and every quarter of 2016, we increased our domestic sales in all of the
products. The only exception is Jet Fuel in Q3, which was hit by the factors mentioned before.
• Although the sale figures in 2015 were already all time highs, our production and sales increased even further in 2016 with high domestic demand.
• Our diesel sales in 3rd quarter of 2016 increased by 12,2%, while the increase in Gasoline and Asphalt was 7% compared to 3rd quarter of 2015.
Slide 13 :Opet
As of September 2016, Opet’s total stations increased to 1480. They are operated under brands Opet & Sunpet. Opet’s total white product market share is 17.78 %, its black product share is 22,04 %, making Opet the second biggest distribution company in Turkey.
Opet has received Most Innovative Marketing Applications, Most Admired Distribution Company and Best Distribution Brand Awards with the highest customer Loyalty Awards in 2016.
Slide 15 :Med* & Tüpraş Net Margins ($/bbl)
• Although our net margin in 2016 Q3 is 5.68 USD/bbl, if the crack margins were the same as 2015, it would have been 8,88 USD/bbl.
• On the other hand in analyzing the difference between Tüpraş net margin and Med margin we should consider yield differences and semi-finished product inventories after RUP.
• Med Margin is published by Reuters and it is simply calculated with product revenues less
Ural Crude cost. In Med margin, there isn’t any internal fuel consumption and loss and total yield is 100%. Ural being the only Crude as a feed the theoretical refinery’s main products are middle distilates with 41% yield. While Fuel Oil is the second important product which constitutes 28% of production, gasoline yield in Med margin calculation is 23%.
• Tüpraş product yields have changed after RUP in favor of Middle Distillates and white products. Therefore, while the effect of low diesel and Jet cracks on Med margin was limited, we have been affected more.
• Additionally, semi-finished products like ASRFO or Vacuum Residuum were processed as soon as they were produced in refining operations before 2015. However with RUP, in order to optimize our production and run RUP at full capacity, we started to store and transfer our semi-finished products within refineries which normally increased our inventory levels. In Q3 of 2016, such accumulation was around 100 thousand tons more than 2015. In this manner, since in margin calculation all the production is assumed to be sold within the same month, semi-finished products in our inventories decreased our revenues and our margin was negatively affected.
• Consequently, our Net margin was hit by 1,6 USD/bbl more than the Med margin in Q3.
•
Slide 16 : Product Price Effect on Tüpraş in Q3 (FOB Italy Prices)
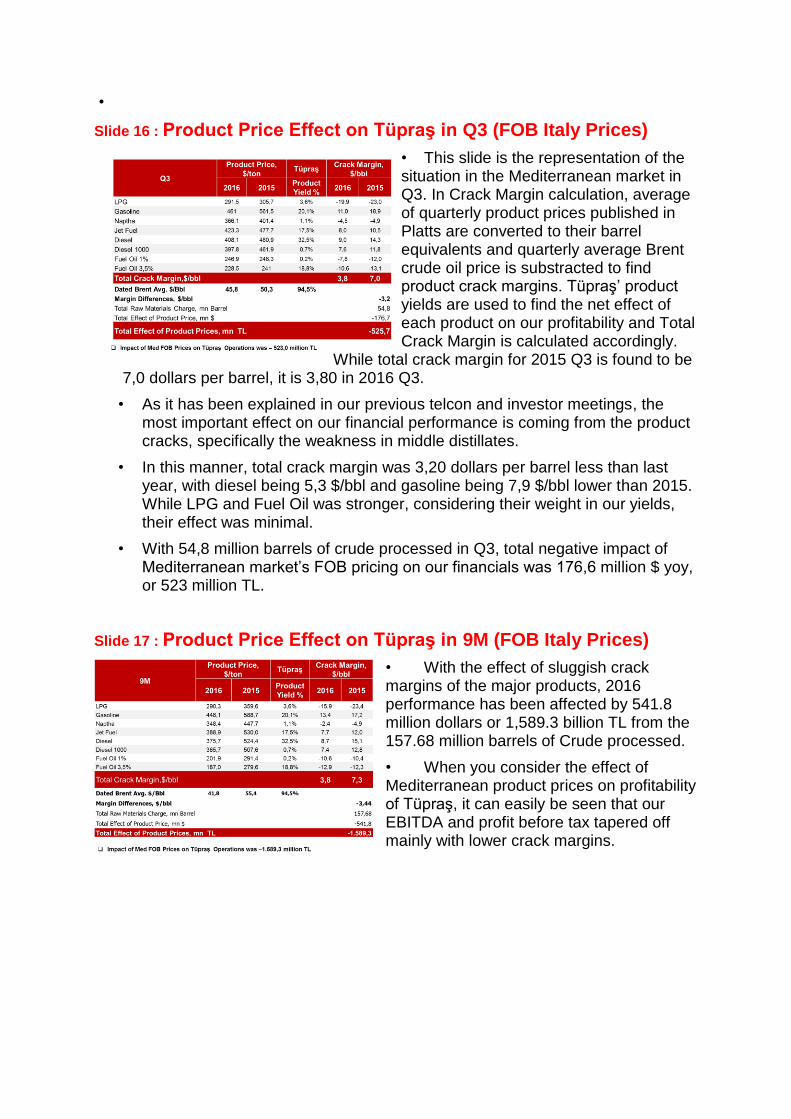
• This slide is the representation of the situation in the Mediterranean market in Q3. In Crack Margin calculation, average of quarterly product prices published in Platts are converted to their barrel equivalents and quarterly average Brent crude oil price is substracted to find product crack margins. Tüpraş’ product yields are used to find the net effect of each product on our profitability and Total Crack Margin is calculated accordingly.
While total crack margin for 2015 Q3 is found to be 7,0 dollars per barrel, it is 3,80 in 2016 Q3.
• As it has been explained in our previous telcon and investor meetings, the most important effect on our financial performance is coming from the product cracks, specifically the weakness in middle distillates.
• In this manner, total crack margin was 3,20 dollars per barrel less than last year, with diesel being 5,3 $/bbl and gasoline being 7,9 $/bbl lower than 2015. While LPG and Fuel Oil was stronger, considering their weight in our yields, their effect was minimal.
• With 54,8 million barrels of crude processed in Q3, total negative impact of Mediterranean market’s FOB pricing on our financials was 176,6 million $ yoy, or 523 million TL.
Slide 17 : Product Price Effect on Tüpraş in 9M (FOB Italy Prices)
• With the effect of sluggish crack margins of the major products, 2016 performance has been affected by 541.8 million dollars or 1,589.3 billion TL from the 157.68 million barrels of Crude processed.
• When you consider the effect of Mediterranean product prices on profitability of Tüpraş, it can easily be seen that our EBITDA and profit before tax tapered off mainly with lower crack margins.
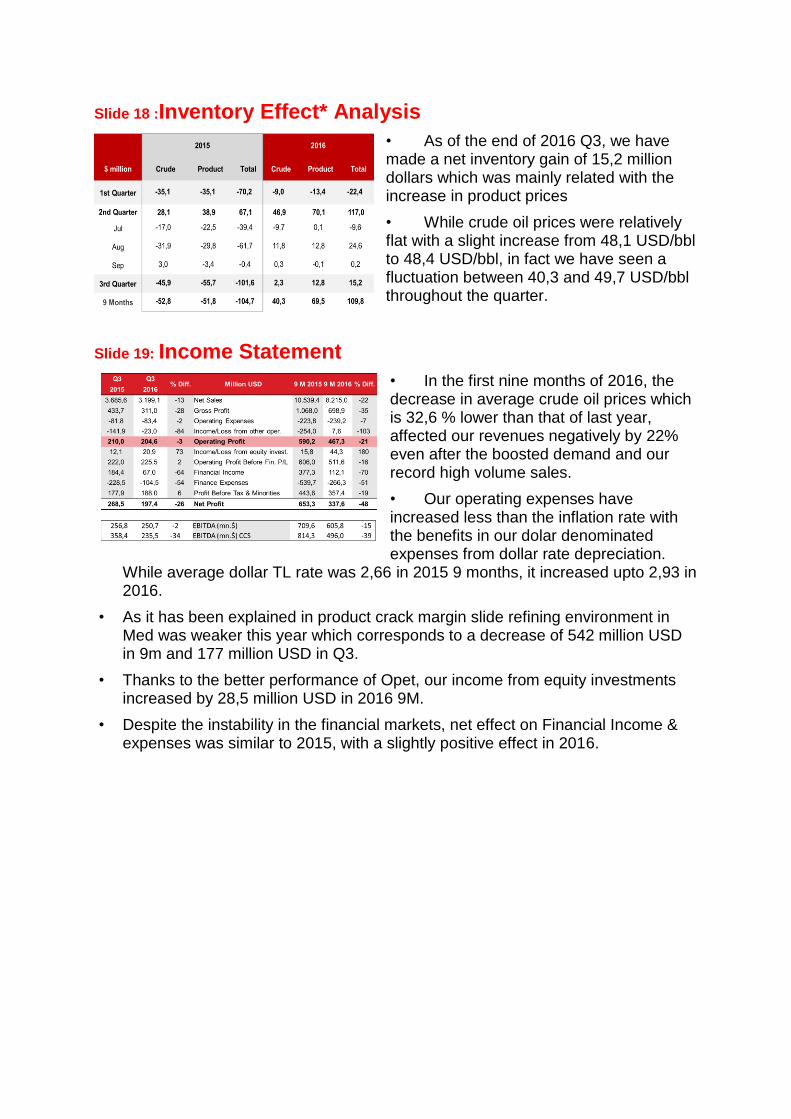
Slide 18 :Inventory Effect* Analysis
• As of the end of 2016 Q3, we have made a net inventory gain of 15,2 million dollars which was mainly related with the increase in product prices
• While crude oil prices were relatively flat with a slight increase from 48,1 USD/bbl to 48,4 USD/bbl, in fact we have seen a fluctuation between 40,3 and 49,7 USD/bbl throughout the quarter.
Slide 19: Income Statement
• In the first nine months of 2016, the decrease in average crude oil prices which is 32,6 % lower than that of last year, affected our revenues negatively by 22% even after the boosted demand and our record high volume sales.
• Our operating expenses have increased less than the inflation rate with the benefits in our dolar denominated expenses from dollar rate depreciation.
While average dollar TL rate was 2,66 in 2015 9 months, it increased upto 2,93 in 2016.
• As it has been explained in product crack margin slide refining environment in Med was weaker this year which corresponds to a decrease of 542 million USD in 9m and 177 million USD in Q3.
• Thanks to the better performance of Opet, our income from equity investments increased by 28,5 million USD in 2016 9M.
• Despite the instability in the financial markets, net effect on Financial Income & expenses was similar to 2015, with a slightly positive effect in 2016.
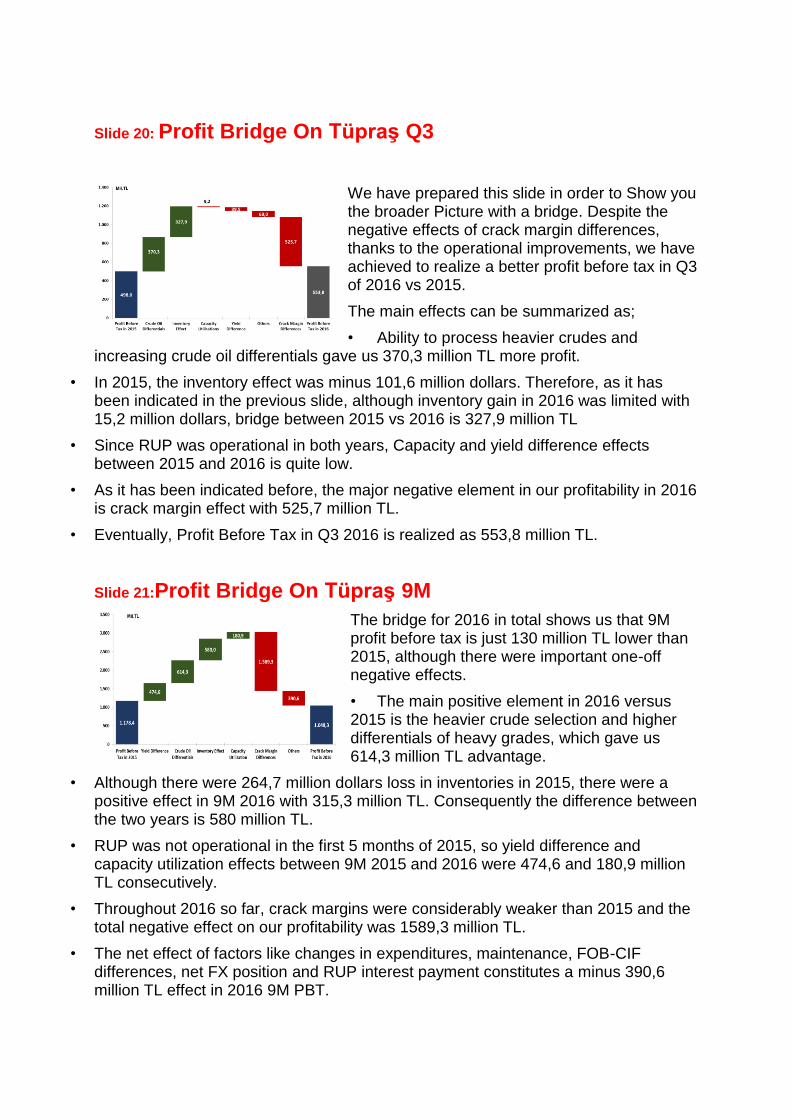
Slide 20: Profit Bridge On Tüpraş Q3
We have prepared this slide in order to Show you the broader Picture with a bridge. Despite the negative effects of crack margin differences, thanks to the operational improvements, we have achieved to realize a better profit before tax in Q3 of 2016 vs 2015.
The main effects can be summarized as;
• Ability to process heavier crudes and increasing crude oil differentials gave us 370,3 million TL more profit.
• In 2015, the inventory effect was minus 101,6 million dollars. Therefore, as it has been indicated in the previous slide, although inventory gain in 2016 was limited with 15,2 million dollars, bridge between 2015 vs 2016 is 327,9 million TL
• Since RUP was operational in both years, Capacity and yield difference effects between 2015 and 2016 is quite low.
• As it has been indicated before, the major negative element in our profitability in 2016 is crack margin effect with 525,7 million TL.
• Eventually, Profit Before Tax in Q3 2016 is realized as 553,8 million TL.
Slide 21:Profit Bridge On Tüpraş 9M
The bridge for 2016 in total shows us that 9M profit before tax is just 130 million TL lower than 2015, although there were important one-off negative effects.
• The main positive element in 2016 versus 2015 is the heavier crude selection and higher differentials of heavy grades, which gave us 614,3 million TL advantage.
• Although there were 264,7 million dollars loss in inventories in 2015, there were a positive effect in 9M 2016 with 315,3 million TL. Consequently the difference between the two years is 580 million TL.
• RUP was not operational in the first 5 months of 2015, so yield difference and capacity utilization effects between 9M 2015 and 2016 were 474,6 and 180,9 million TL consecutively.
• Throughout 2016 so far, crack margins were considerably weaker than 2015 and the total negative effect on our profitability was 1589,3 million TL.
• The net effect of factors like changes in expenditures, maintenance, FOB-CIF differences, net FX position and RUP interest payment constitutes a minus 390,6 million TL effect in 2016 9M PBT.
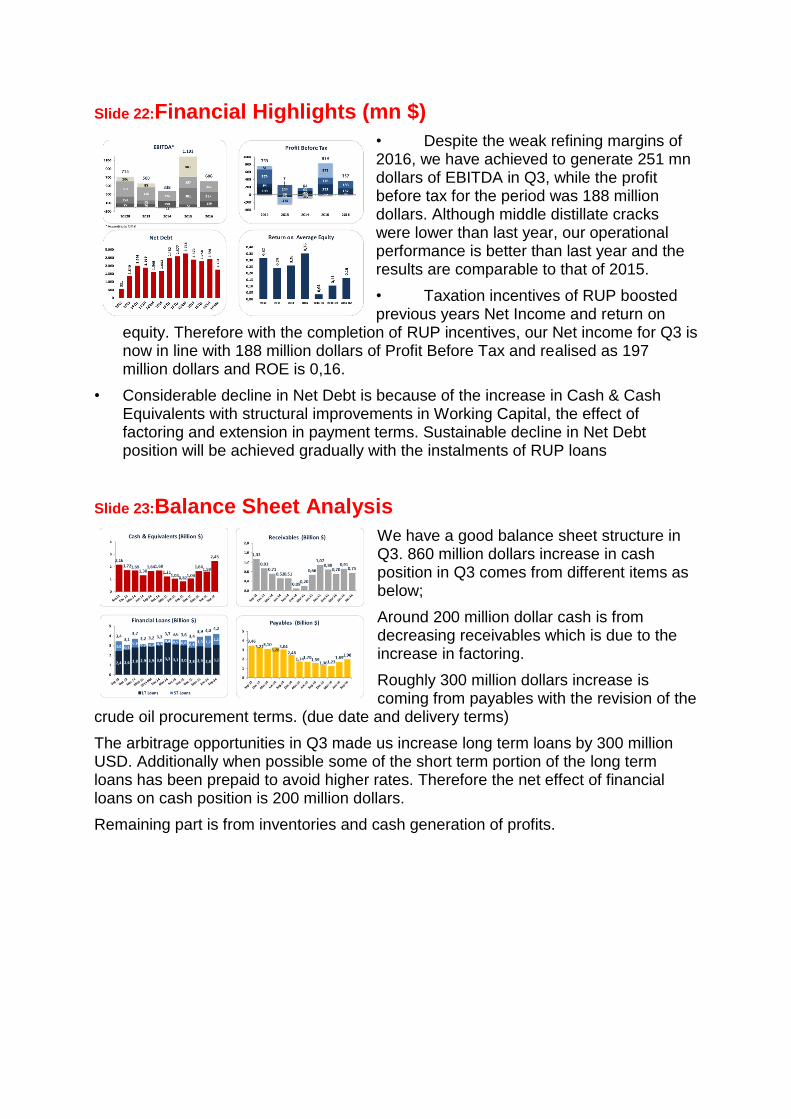
Slide 22:Financial Highlights (mn $)
• Despite the weak refining margins of 2016, we have achieved to generate 251 mn dollars of EBITDA in Q3, while the profit before tax for the period was 188 million dollars. Although middle distillate cracks were lower than last year, our operational performance is better than last year and the results are comparable to that of 2015.
• Taxation incentives of RUP boosted previous years Net Income and return on
equity. Therefore with the completion of RUP incentives, our Net income for Q3 is now in line with 188 million dollars of Profit Before Tax and realised as 197 million dollars and ROE is 0,16.
• Considerable decline in Net Debt is because of the increase in Cash & Cash Equivalents with structural improvements in Working Capital, the effect of factoring and extension in payment terms. Sustainable decline in Net Debt position will be achieved gradually with the instalments of RUP loans
Slide 23:Balance Sheet Analysis
We have a good balance sheet structure in Q3. 860 million dollars increase in cash position in Q3 comes from different items as below;
Around 200 million dollar cash is from decreasing receivables which is due to the increase in factoring.
Roughly 300 million dollars increase is coming from payables with the revision of the
crude oil procurement terms. (due date and delivery terms)
The arbitrage opportunities in Q3 made us increase long term loans by 300 million USD. Additionally when possible some of the short term portion of the long term loans has been prepaid to avoid higher rates. Therefore the net effect of financial loans on cash position is 200 million dollars.
Remaining part is from inventories and cash generation of profits.
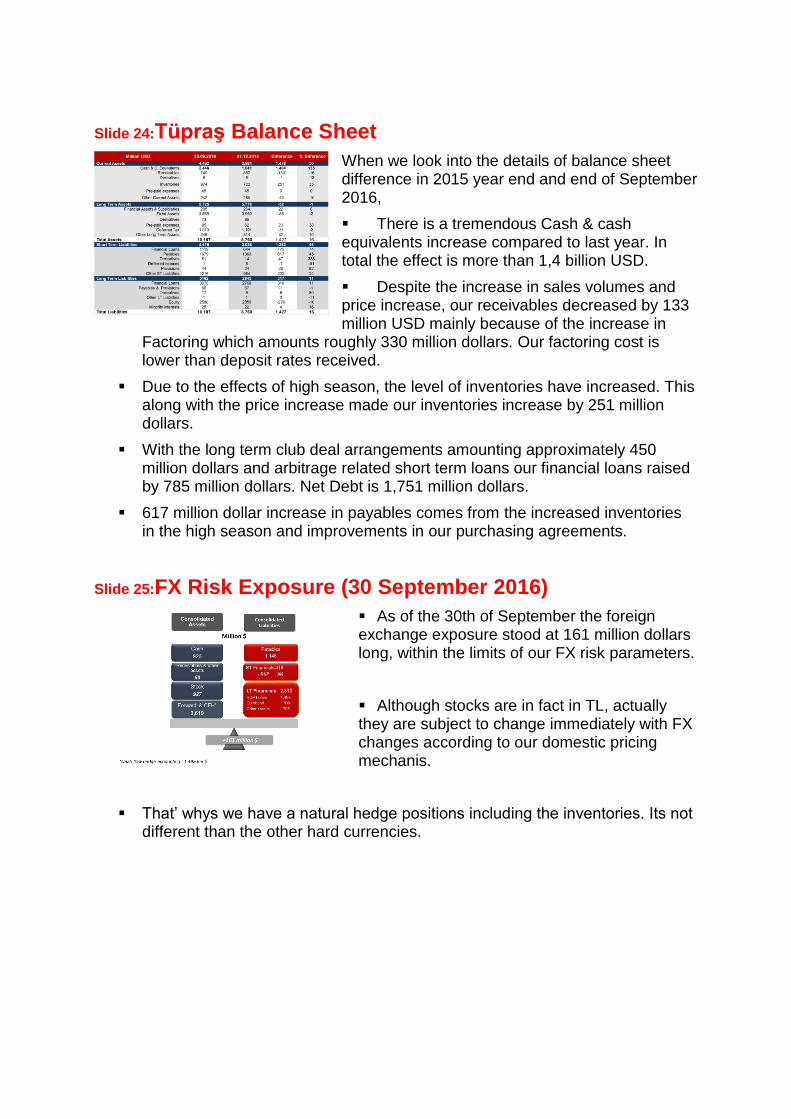
Slide 24:Tüpraş Balance Sheet
When we look into the details of balance sheet difference in 2015 year end and end of September 2016,
There is a tremendous Cash & cash equivalents increase compared to last year. In total the effect is more than 1,4 billion USD.
Despite the increase in sales volumes and price increase, our receivables decreased by 133 million USD mainly because of the increase in
Factoring which amounts roughly 330 million dollars. Our factoring cost is lower than deposit rates received.
Due to the effects of high season, the level of inventories have increased. This along with the price increase made our inventories increase by 251 million dollars.
With the long term club deal arrangements amounting approximately 450 million dollars and arbitrage related short term loans our financial loans raised by 785 million dollars. Net Debt is 1,751 million dollars.
617 million dollar increase in payables comes from the increased inventories in the high season and improvements in our purchasing agreements.
Slide 25:FX Risk Exposure (30 September 2016)
As of the 30th of September the foreign exchange exposure stood at 161 million dollars long, within the limits of our FX risk parameters.
Although stocks are in fact in TL, actually they are subject to change immediately with FX changes according to our domestic pricing mechanis.
That’ whys we have a natural hedge positions including the inventories. Its not different than the other hard currencies.

Slide 26:2016 Expectations vs 9 Month Results
As of today, the margins are within the range of our expectations. Therefore despite the low middle distillate cracks throughout the year, we believe that we would be achieving our 4.5-5.0 dollars per barrel 2016 for the full year margin indication.
We are keeping all of our estimations for Brent Price, Med Complex Margin, Capacity Utilization and Investments at the same levels.


![Analyst Presentation - Q3 FY16 [Company Update]](https://img.pdfslide.us/doc/110x75/577ca5e11a28abea748baf50/analyst-presentation-q3-fy16-company-update.jpg)


![Analyst Presentation (Q3 FY2015-16) [Company Update]](https://img.pdfslide.us/doc/110x75/577ca4d41a28abea748b4871/analyst-presentation-q3-fy2015-16-company-update.jpg)