Embed Size (px)
Citation preview

RESULTS FOR Q3 2016 ANALYSTTELECONFERENCE
02 Operation
03Financials
01Market
2
3
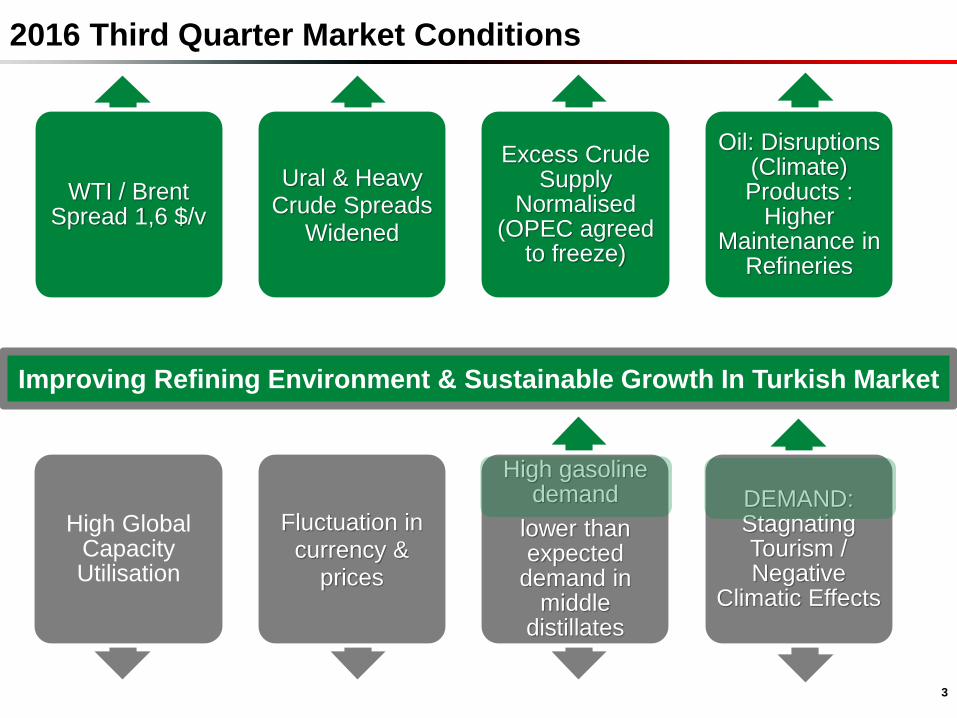
2016 Third Quarter Market Conditions
WTI / Brent Spread 1,6 $/v
Ural & HeavyCrude Spreads
Widened
Excess Crude Supply
Normalised(OPEC agreed
to freeze)
Oil: Disruptions (Climate) Products :
HigherMaintenance in
Refineries
High Global Capacity Utilisation
Fluctuation in currency &
prices
High gasolinedemand
lower than expected
demand in middle
distillates
DEMAND: StagnatingTourism / Negative
Climatic Effects
Improving Refining Environment & Sustainable Growth In Turkish Market
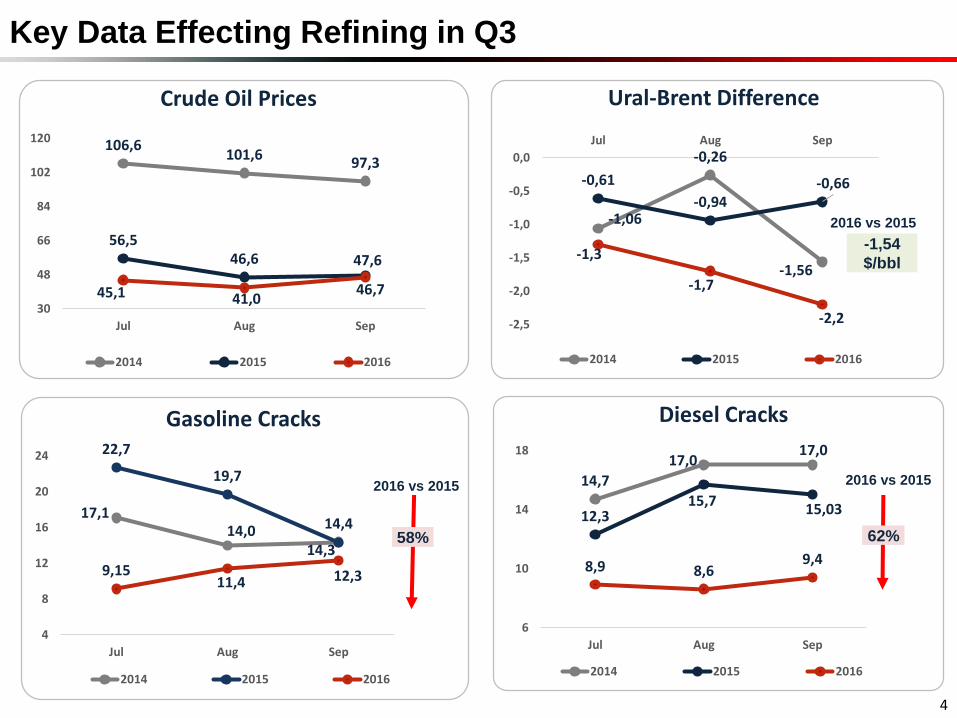
17,114,0 14,4
22,7
19,7
14,3
9,1511,4 12,3
4
8
12
16
20
24
Jul Aug Sep
Gasoline Cracks
2014 2015 2016
2016 vs 2015
Key Data Effecting Refining in Q3
4
106,6101,6
97,3
56,546,6 47,6
45,1 41,046,7
30
48
66
84
102
120
Jul Aug Sep
Crude Oil Prices
2014 2015 2016
-1,06
-0,26
-1,56
-0,61
-0,94-0,66
-1,3
-1,7
-2,2-2,5
-2,0
-1,5
-1,0
-0,5
0,0
Jul Aug Sep
Ural-Brent Difference
2014 2015 2016
2016 vs 2015
-1,54
$/bbl
14,7
17,017,0
12,315,7
15,03
8,9 8,69,4
6
10
14
18
Jul Aug Sep
Diesel Cracks
2014 2015 2016
58% 62%
2016 vs 2015
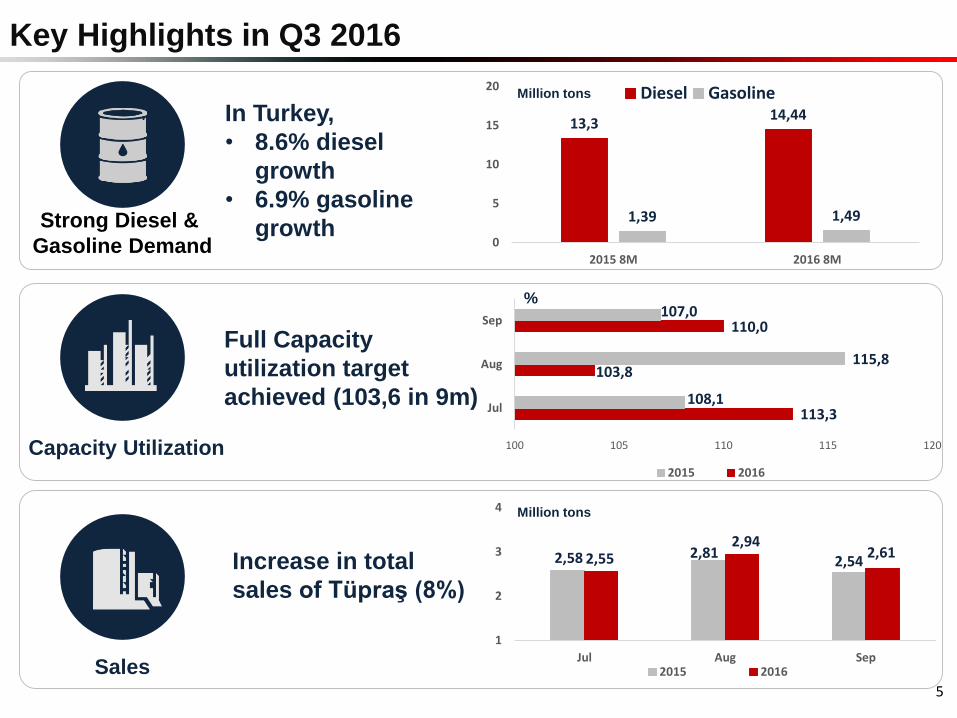
Key Highlights in Q3 2016
5
2,58 2,812,542,55
2,942,61
1
2
3
4
Jul Aug Sep2015 2016
Increase in total
sales of Tüpraş (8%)
In Turkey,
• 8.6% diesel
growth
• 6.9% gasoline
growth
Million tons
Million tons
Sales
Strong Diesel &
Gasoline Demand
%
13,314,44
1,39 1,49
0
5
10
15
20
2015 8M 2016 8M
Diesel Gasoline
Full Capacity
utilization target
achieved (103,6 in 9m)
Capacity Utilization
113,3
103,8
110,0
108,1
115,8
107,0
100 105 110 115 120
Jul
Aug
Sep
2015 2016
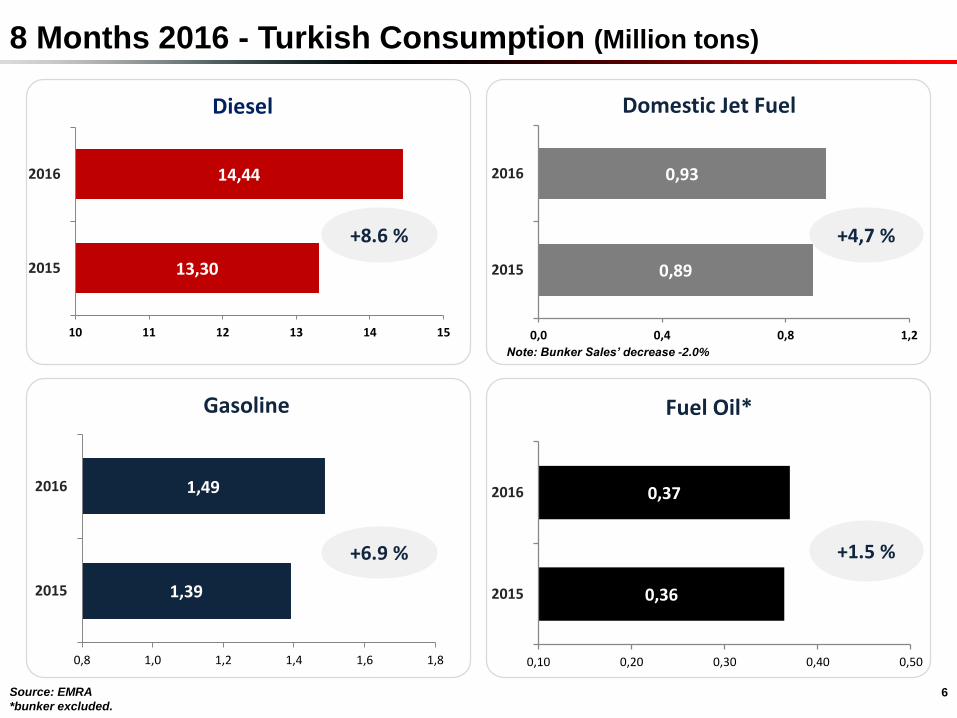
8 Months 2016 - Turkish Consumption (Million tons)
13,30
14,44
10 11 12 13 14 15
2015
2016
Diesel
0,89
0,93
0,0 0,4 0,8 1,2
2015
2016
Domestic Jet Fuel
1,39
1,49
0,8 1,0 1,2 1,4 1,6 1,8
2015
2016
Gasoline
0,36
0,37
0,10 0,20 0,30 0,40 0,50
2015
2016
Fuel Oil*
Source: EMRA
*bunker excluded.
+8.6 %
+1.5 %+6.9 %
+4,7 %
Note: Bunker Sales’ decrease -2.0%
6
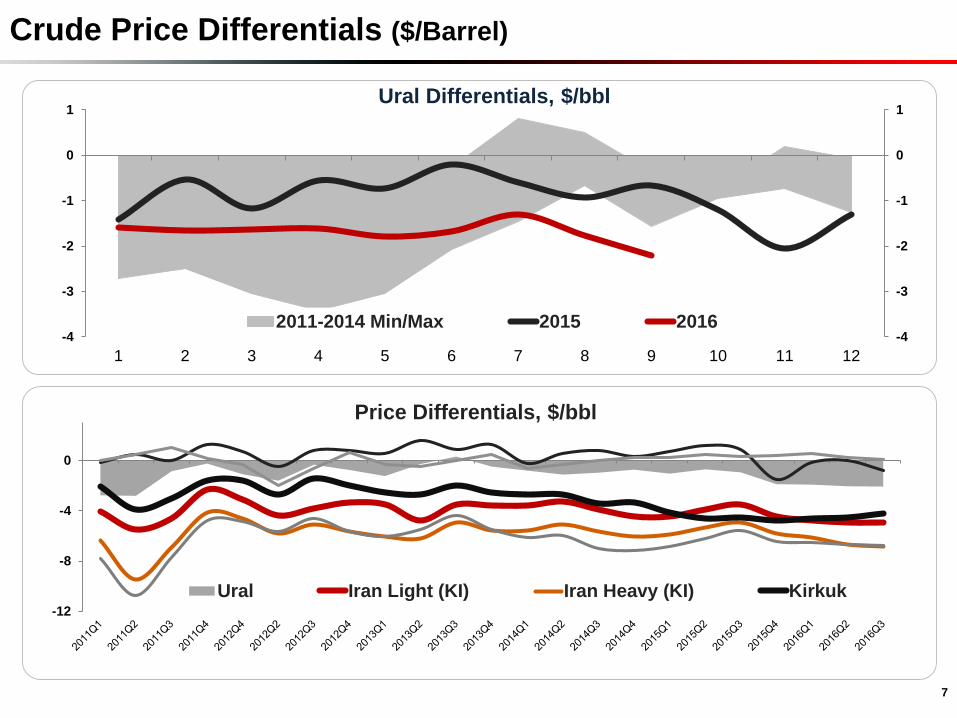
Crude Price Differentials ($/Barrel)
7
-12
-8
-4
0
Price Differentials, $/bbl
Ural Iran Light (KI) Iran Heavy (KI) Kirkuk
-4
-3
-2
-1
0
1
-4
-3
-2
-1
0
1
1 2 3 4 5 6 7 8 9 10 11 12
2011-2014 Min/Max 2015 2016
Ural Differentials, $/bbl
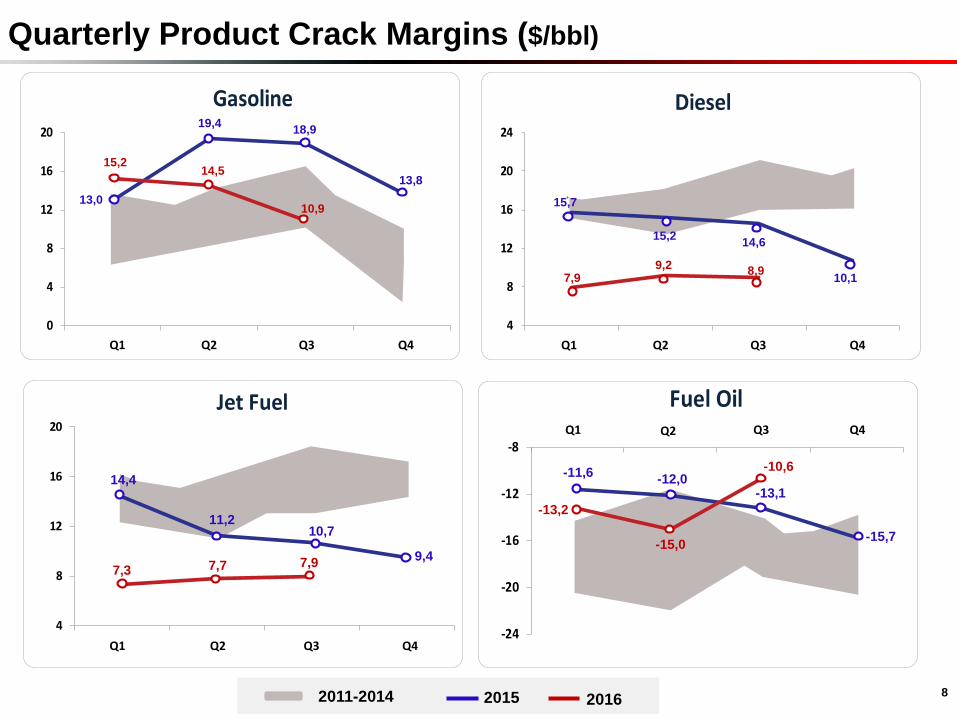
Quarterly Product Crack Margins ($/bbl)
82015 20162011-2014
15,214,5
10,913,0
19,418,9
13,8
Q1 Q4Q3Q2
-13,2
-15,0
-10,6
-15,7
-13,1-12,0
-11,6
Q1 Q4Q3Q2
7,3 7,7 7,99,4
11,210,7
14,4
Q1 Q4Q3Q2
15,7
15,214,6
10,18,9
9,27,9
Q1 Q4Q3Q2
Market Operations Financials
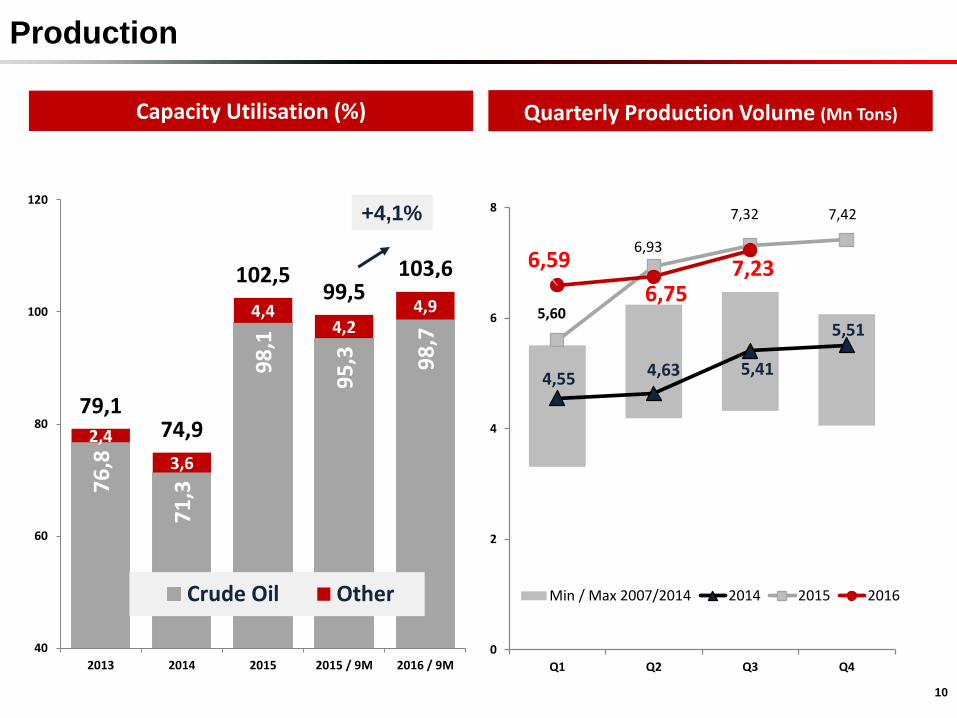
Capacity Utilisation (%)7
6,8
71
,3
98
,1
95
,3 98
,72,4
3,6
4,44,2
4,9
79,174,9
102,599,5
40
60
80
100
120
2013 2014 2015 2015 / 9M 2016 / 9M
Crude Oil Other
103,6
Quarterly Production Volume (Mn Tons)
4,55 4,63 5,41
5,515,60
6,93
7,32 7,42
6,59
6,757,23
0
2
4
6
8
Q1 Q2 Q3 Q4
Min / Max 2007/2014 2014 2015 2016
Production
10
+4,1%
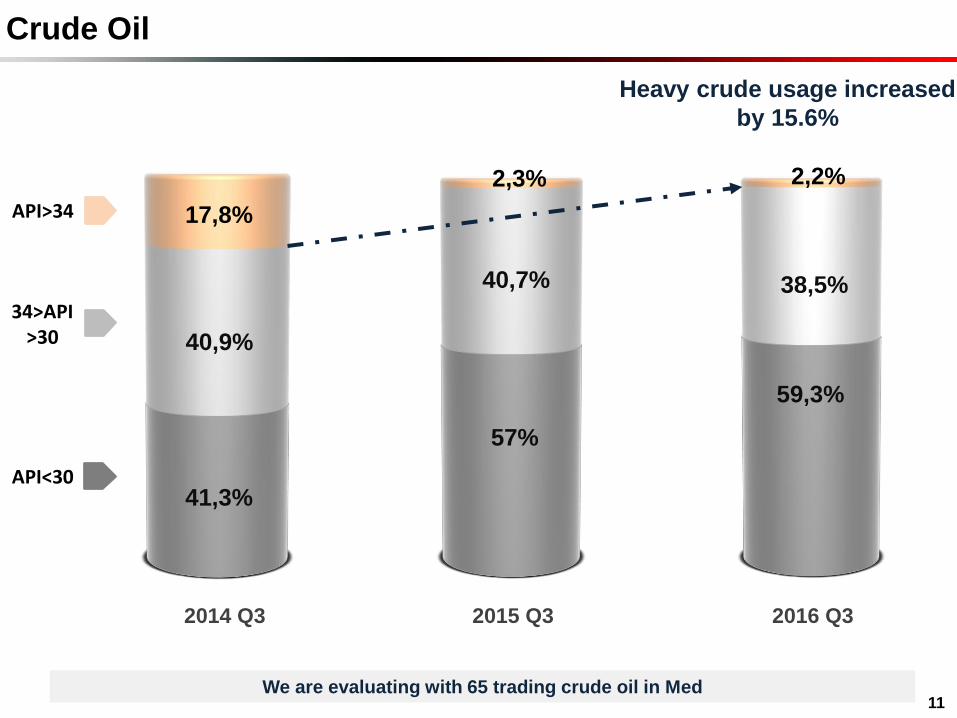
59,3%
38,5%
57%
40,7%
Crude Oil
11
2015 Q3 2016 Q3
We are evaluating with 65 trading crude oil in Med
41,3%
40,9%
2014 Q3
API<30
34>API>30
API>34 17,8%
2,3% 2,2%
Heavy crude usage increased
by 15.6%
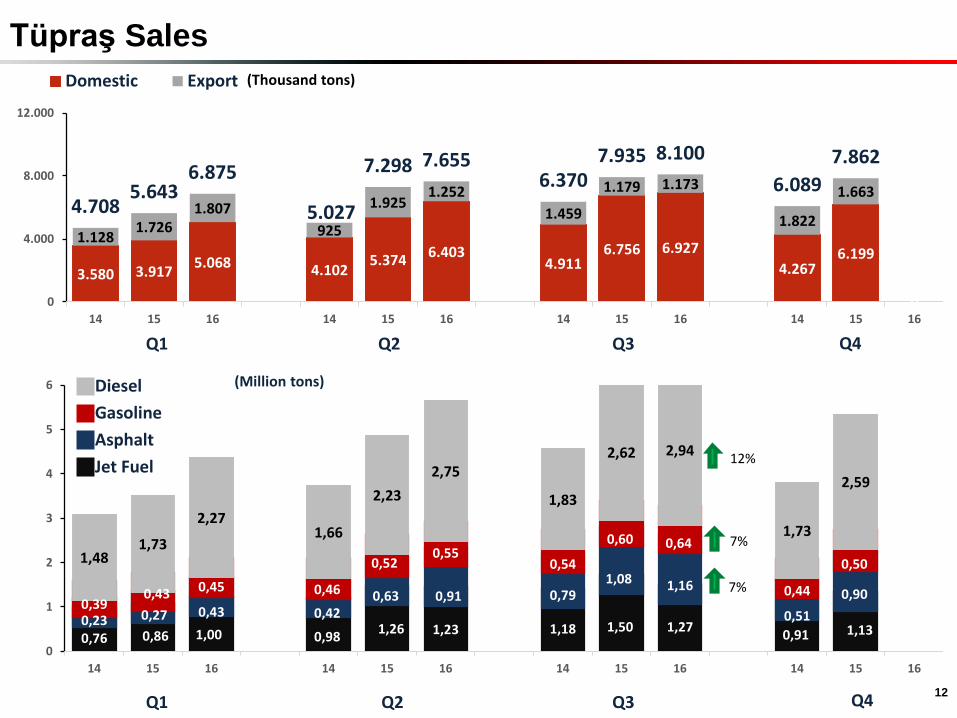
Tüpraş Sales
12
3.580 3.9175.068 4.102
5.3746.403
4.9116.756 6.927
4.2676.199
0
1.1281.726
1.807
925
1.9251.252
1.459
1.179 1.173
1.822
1.6634.708
5.6436.875
5.027
7.298 7.6556.370
7.935 8.100
6.089
7.862
0
4.000
8.000
12.000
14 15 16 14 15 16 14 15 16 14 15 16
Domestic Export (Thousand tons)
Q1 Q2 Q3 Q4
0,76 0,86 1,00 0,981,26 1,23 1,18 1,50 1,27
0,91 1,130,23 0,27 0,43 0,42
0,63 0,91 0,791,08 1,16
0,51
0,900,39
0,43 0,45 0,46
0,520,55
0,54
0,60 0,64
0,44
0,501,481,73
2,271,66
2,23
2,75
1,83
2,62 2,94
1,73
2,59
0
1
2
3
4
5
6
14 15 16 14 15 16 14 15 16 14 15 16
Diesel
Gasoline
Asphalt
Jet Fuel12%
7%
7%
Q1 Q2 Q3 Q4
(Million tons)
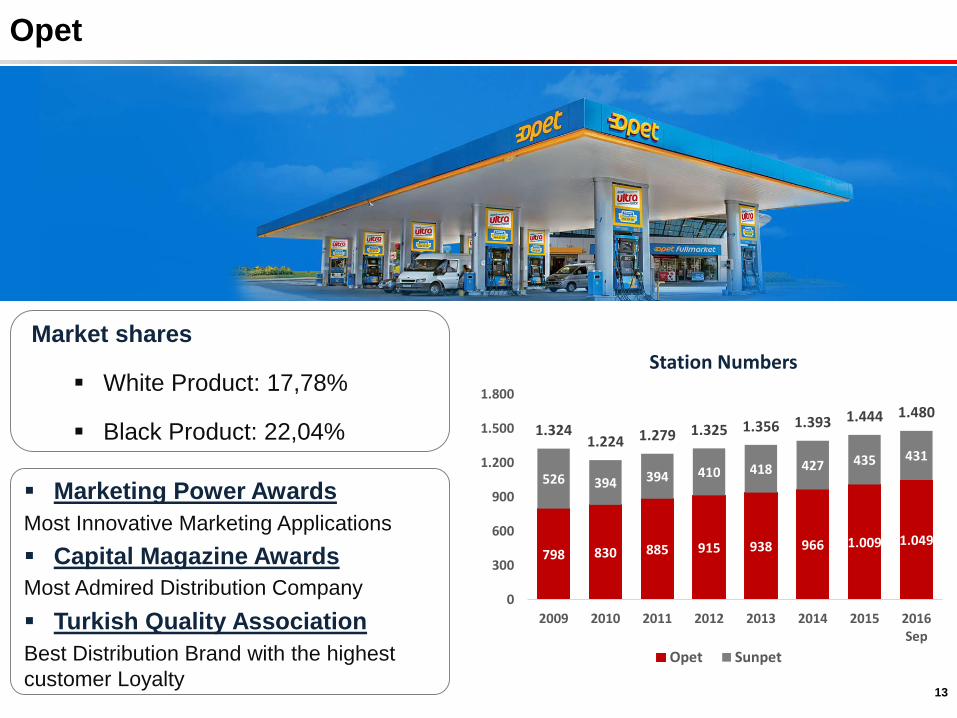
Opet
798 830 885 915 938 966 1.009 1.049
526 394 394 410 418 427 435 431
1.3241.224 1.279 1.325 1.356 1.393 1.444 1.480
0
300
600
900
1.200
1.500
1.800
2009 2010 2011 2012 2013 2014 2015 2016Sep
Station Numbers
Opet Sunpet
Market shares
White Product: 17,78%
Black Product: 22,04%
13
Marketing Power Awards
Most Innovative Marketing Applications
Capital Magazine Awards
Most Admired Distribution Company
Turkish Quality Association
Best Distribution Brand with the highest
customer Loyalty
Market Operations Financials
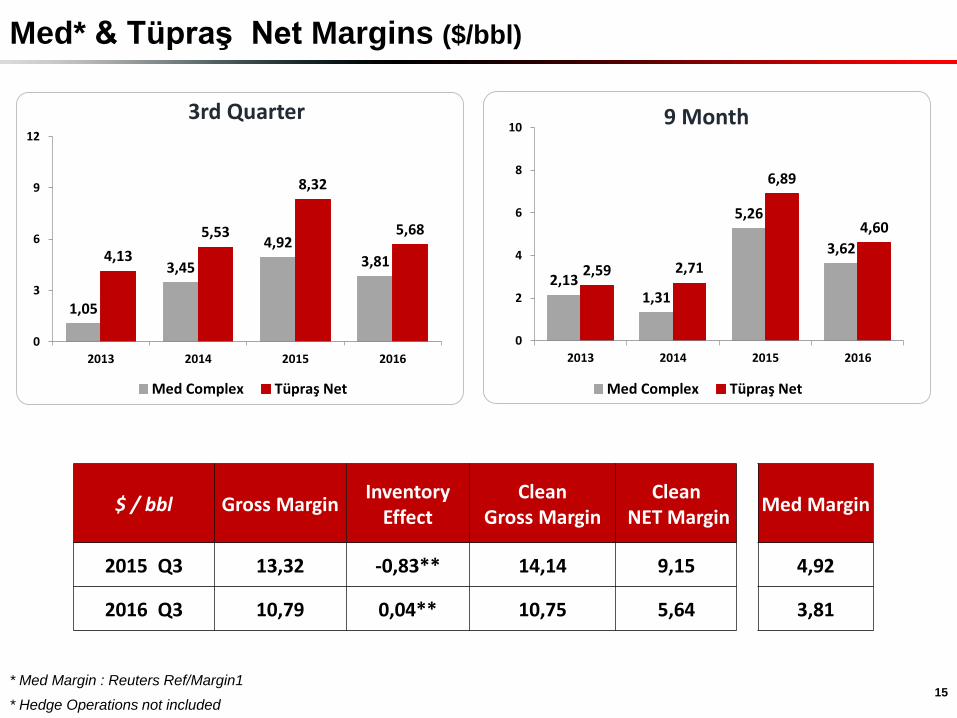
Med* & Tüpraş Net Margins ($/bbl)
15
2,131,31
5,26
3,62
2,59 2,71
6,89
4,60
0
2
4
6
8
10
2013 2014 2015 2016
9 Month
Med Complex Tüpraş Net
1,05
3,45
4,923,814,13
5,53
8,32
5,68
0
3
6
9
12
2013 2014 2015 2016
3rd Quarter
Med Complex Tüpraş Net
$ / bbl Gross MarginInventory
EffectClean
Gross MarginClean
NET MarginMed Margin
2015 Q3 13,32 -0,83** 14,14 9,15 4,92
2016 Q3 10,79 0,04** 10,75 5,64 3,81
* Hedge Operations not included
* Med Margin : Reuters Ref/Margin1
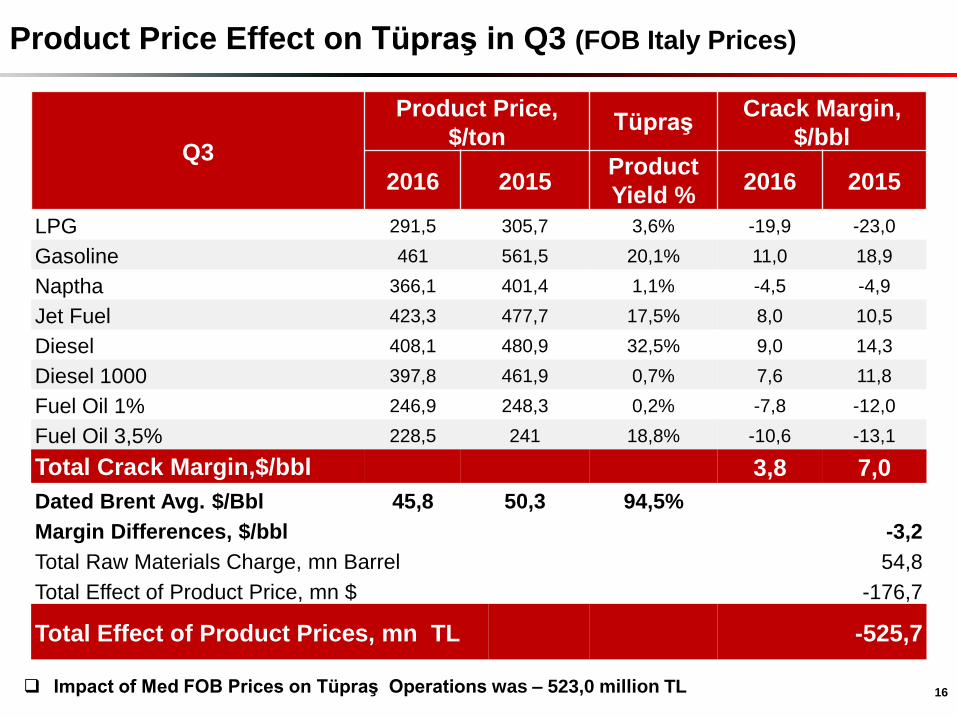
Product Price Effect on Tüpraş in Q3 (FOB Italy Prices)
Impact of Med FOB Prices on Tüpraş Operations was – 523,0 million TL
Q3
Product Price,
$/tonTüpraş
Crack Margin,
$/bbl
2016 2015Product
Yield %2016 2015
LPG 291,5 305,7 3,6% -19,9 -23,0
Gasoline 461 561,5 20,1% 11,0 18,9
Naptha 366,1 401,4 1,1% -4,5 -4,9
Jet Fuel 423,3 477,7 17,5% 8,0 10,5
Diesel 408,1 480,9 32,5% 9,0 14,3
Diesel 1000 397,8 461,9 0,7% 7,6 11,8
Fuel Oil 1% 246,9 248,3 0,2% -7,8 -12,0
Fuel Oil 3,5% 228,5 241 18,8% -10,6 -13,1
Total Crack Margin,$/bbl 3,8 7,0
Dated Brent Avg. $/Bbl 45,8 50,3 94,5%
Margin Differences, $/bbl -3,2
Total Raw Materials Charge, mn Barrel 54,8
Total Effect of Product Price, mn $ -176,7
Total Effect of Product Prices, mn TL -525,7
16
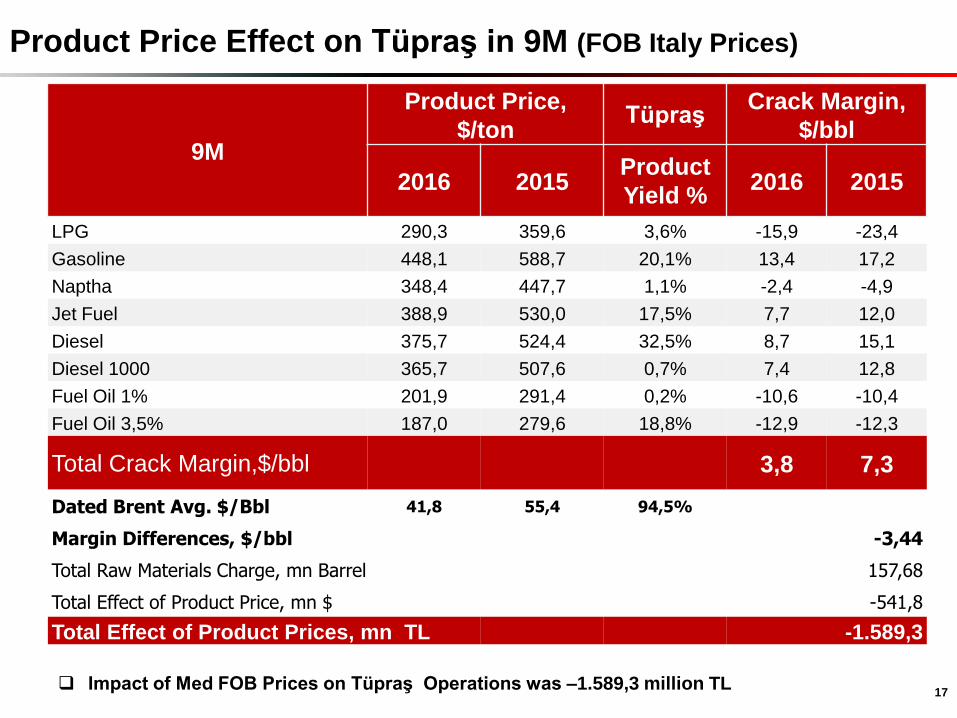
Product Price Effect on Tüpraş in 9M (FOB Italy Prices)
Impact of Med FOB Prices on Tüpraş Operations was –1.589,3 million TL
9M
Product Price,
$/tonTüpraş
Crack Margin,
$/bbl
2016 2015Product
Yield %2016 2015
LPG 290,3 359,6 3,6% -15,9 -23,4
Gasoline 448,1 588,7 20,1% 13,4 17,2
Naptha 348,4 447,7 1,1% -2,4 -4,9
Jet Fuel 388,9 530,0 17,5% 7,7 12,0
Diesel 375,7 524,4 32,5% 8,7 15,1
Diesel 1000 365,7 507,6 0,7% 7,4 12,8
Fuel Oil 1% 201,9 291,4 0,2% -10,6 -10,4
Fuel Oil 3,5% 187,0 279,6 18,8% -12,9 -12,3
Total Crack Margin,$/bbl 3,8 7,3
Dated Brent Avg. $/Bbl 41,8 55,4 94,5%
Margin Differences, $/bbl -3,44
Total Raw Materials Charge, mn Barrel 157,68
Total Effect of Product Price, mn $ -541,8
Total Effect of Product Prices, mn TL -1.589,3
17
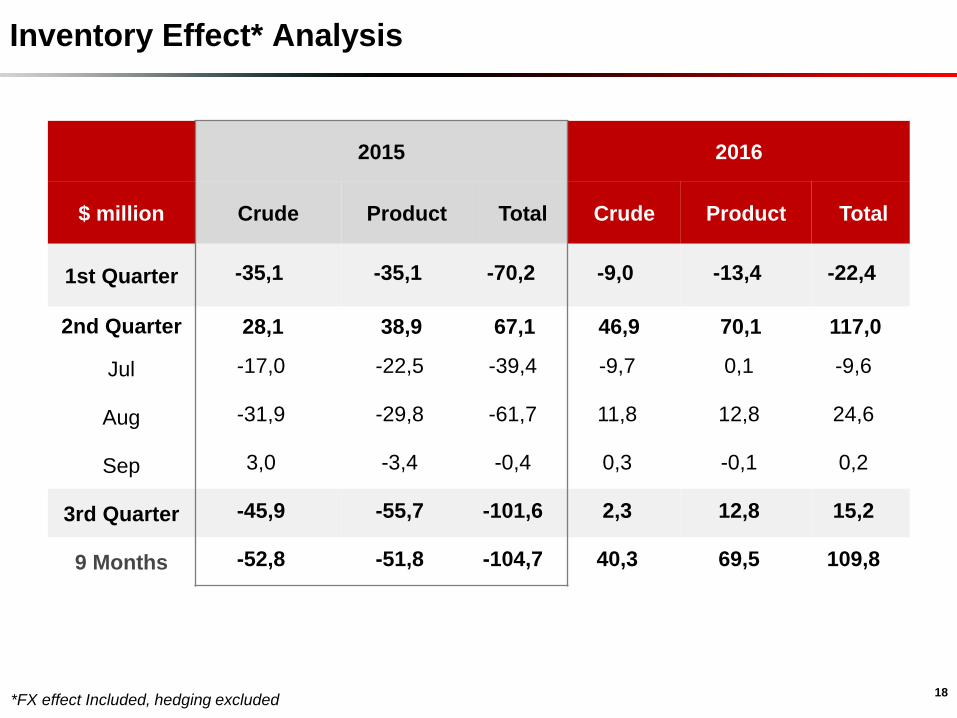
Inventory Effect* Analysis
18*FX effect Included, hedging excluded
2015 2016
$ million Crude Product Total Crude Product Total
1st Quarter -35,1 -35,1 -70,2 -9,0 -13,4 -22,4
2nd Quarter 28,1 38,9 67,1 46,9 70,1 117,0
Jul -17,0 -22,5 -39,4 -9,7 0,1 -9,6
Aug -31,9 -29,8 -61,7 11,8 12,8 24,6
Sep 3,0 -3,4 -0,4 0,3 -0,1 0,2
3rd Quarter -45,9 -55,7 -101,6 2,3 12,8 15,2
9 Months -52,8 -51,8 -104,7 40,3 69,5 109,8
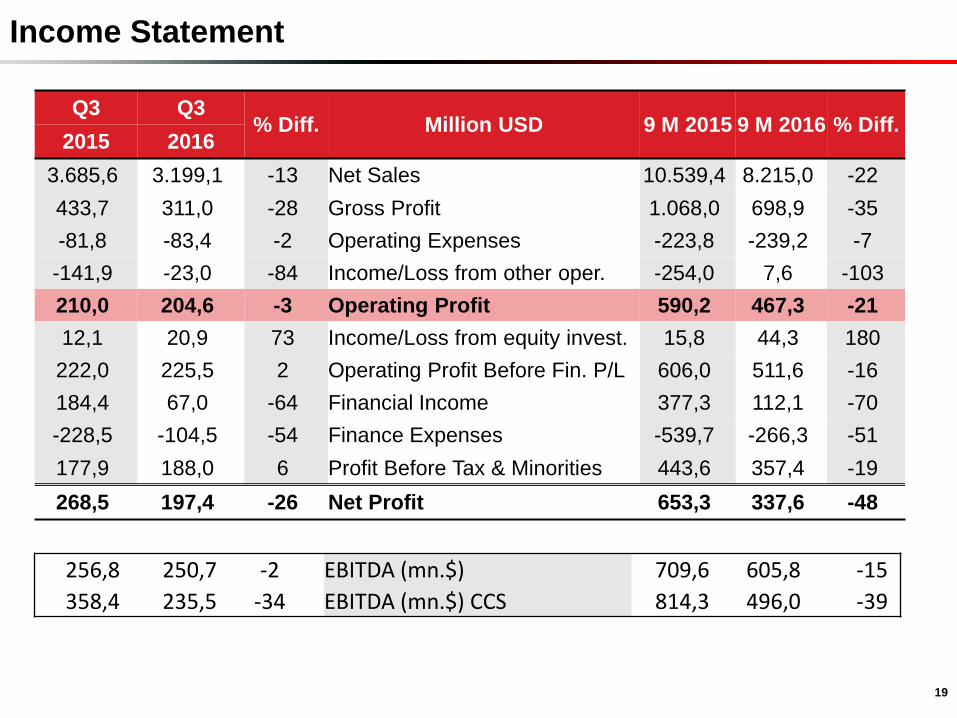
Income Statement
Q3 Q3% Diff. Million USD 9 M 2015 9 M 2016 % Diff.
2015 2016
3.685,6 3.199,1 -13 Net Sales 10.539,4 8.215,0 -22
433,7 311,0 -28 Gross Profit 1.068,0 698,9 -35
-81,8 -83,4 -2 Operating Expenses -223,8 -239,2 -7
-141,9 -23,0 -84 Income/Loss from other oper. -254,0 7,6 -103
210,0 204,6 -3 Operating Profit 590,2 467,3 -21
12,1 20,9 73 Income/Loss from equity invest. 15,8 44,3 180
222,0 225,5 2 Operating Profit Before Fin. P/L 606,0 511,6 -16
184,4 67,0 -64 Financial Income 377,3 112,1 -70
-228,5 -104,5 -54 Finance Expenses -539,7 -266,3 -51
177,9 188,0 6 Profit Before Tax & Minorities 443,6 357,4 -19
268,5 197,4 -26 Net Profit 653,3 337,6 -48
19
256,8 250,7 -2 EBITDA (mn.$) 709,6 605,8 -15
358,4 235,5 -34 EBITDA (mn.$) CCS 814,3 496,0 -39
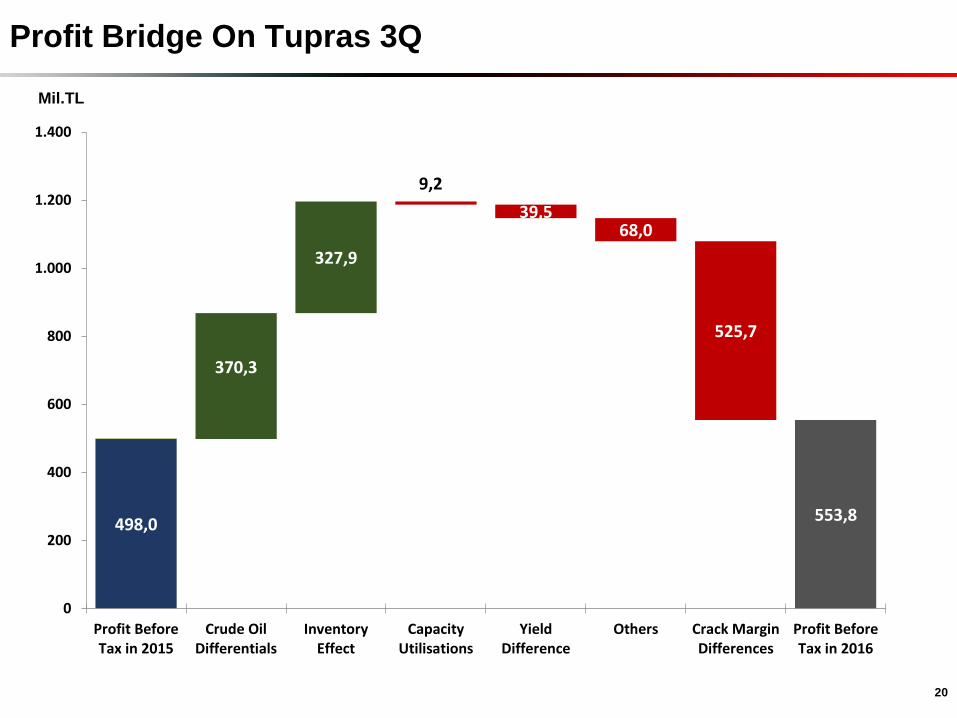
Profit Bridge On Tupras 3Q
20
Mil.TL
498,0553,8
370,3
327,9
9,2
39,568,0
525,7
0
200
400
600
800
1.000
1.200
1.400
Profit BeforeTax in 2015
Crude OilDifferentials
InventoryEffect
CapacityUtilisations
YieldDifference
Others Crack MarginDifferences
Profit BeforeTax in 2016
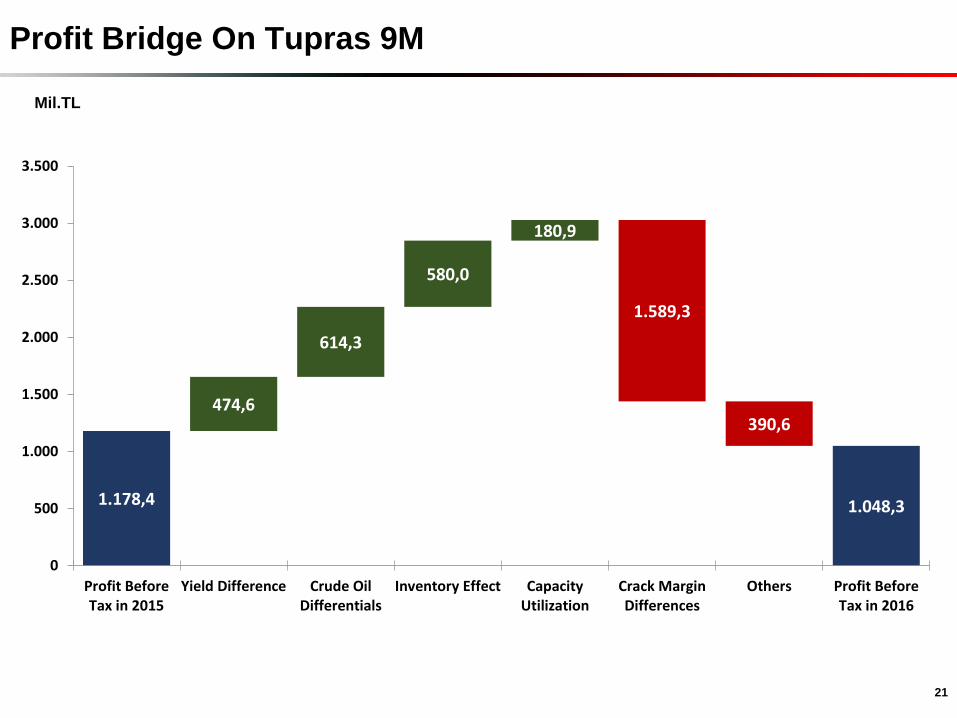
Profit Bridge On Tupras 9M
21
Mil.TL
1.178,4 1.048,3
474,6
614,3
580,0
180,9
1.589,3
390,6
0
500
1.000
1.500
2.000
2.500
3.000
3.500
Profit BeforeTax in 2015
Yield Difference Crude OilDifferentials
Inventory Effect CapacityUtilization
Crack MarginDifferences
Others Profit BeforeTax in 2016
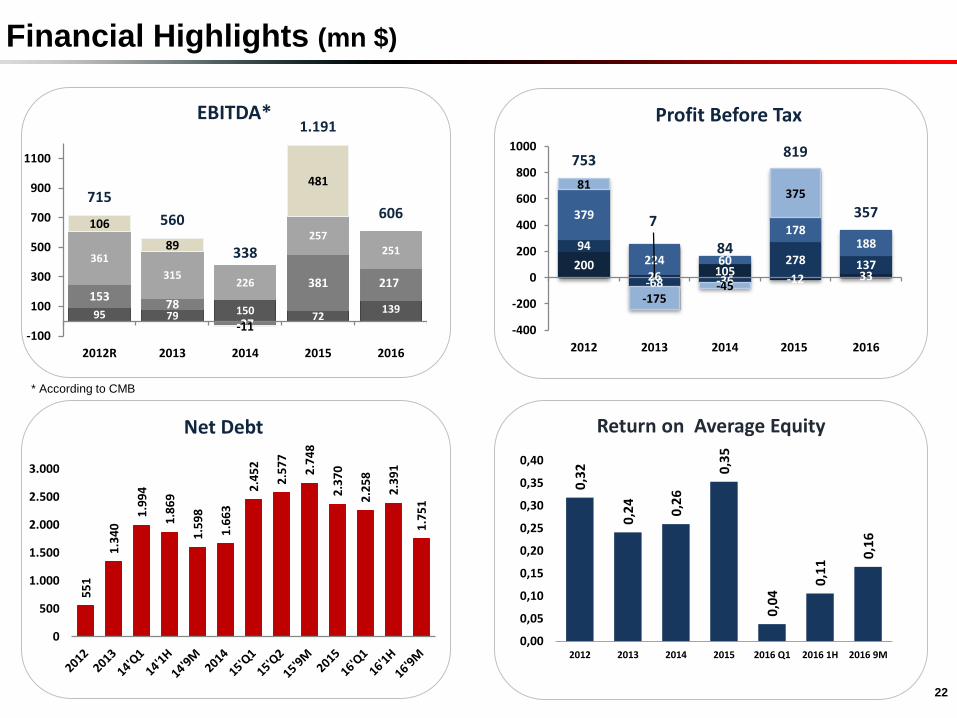
22
95 79 150 72139
15378
-27
381 217
361
315226
257251
106
89
-11
481
715
560
338
1.191
606
-100
100
300
500
700
900
1100
2012R 2013 2014 2015 2016
EBITDA*
20026 105
-12 33
94
-68 -36
278 137
379
224 60
178188
81
-175-45
375
753
7
84
819
357
-400
-200
0
200
400
600
800
1000
2012 2013 2014 2015 2016
Profit Before Tax
55
1
1.3
40
1.9
94
1.8
69
1.5
98
1.6
63
2.4
52
2.5
77
2.7
48
2.3
70
2.2
58
2.3
91
1.7
51
0
500
1.000
1.500
2.000
2.500
3.000
Net Debt
0,3
2
0,2
4
0,2
6
0,3
5
0,0
4
0,1
1
0,1
6
0,00
0,05
0,10
0,15
0,20
0,25
0,30
0,35
0,40
2012 2013 2014 2015 2016 Q1 2016 1H 2016 9M
Return on Average Equity
* According to CMB
Financial Highlights (mn $)
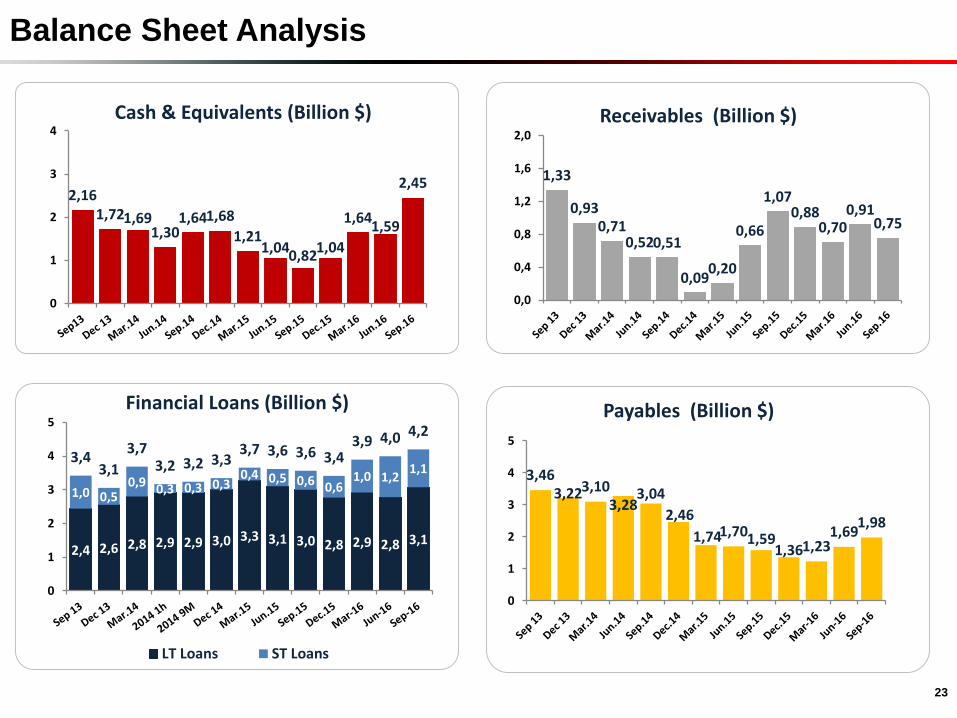
Balance Sheet Analysis
23
2,161,721,69
1,301,641,68
1,211,04
0,821,04
1,641,59
2,45
0
1
2
3
4Cash & Equivalents (Billion $)
1,33
0,930,71
0,520,51
0,090,20
0,66
1,070,88
0,700,91
0,75
0,0
0,4
0,8
1,2
1,6
2,0
Receivables (Billion $)
2,4 2,6 2,8 2,9 2,9 3,0 3,3 3,1 3,0 2,8 2,9 2,8 3,1
1,0 0,50,9 0,3 0,3 0,3
0,4 0,5 0,6 0,61,0 1,2
1,13,4
3,1
3,73,2 3,2 3,3
3,7 3,6 3,6 3,43,9 4,0 4,2
0
1
2
3
4
5
Financial Loans (Billion $)
LT Loans ST Loans
3,463,223,10
3,283,04
2,46
1,741,701,591,361,23
1,691,98
0
1
2
3
4
5
Payables (Billion $)
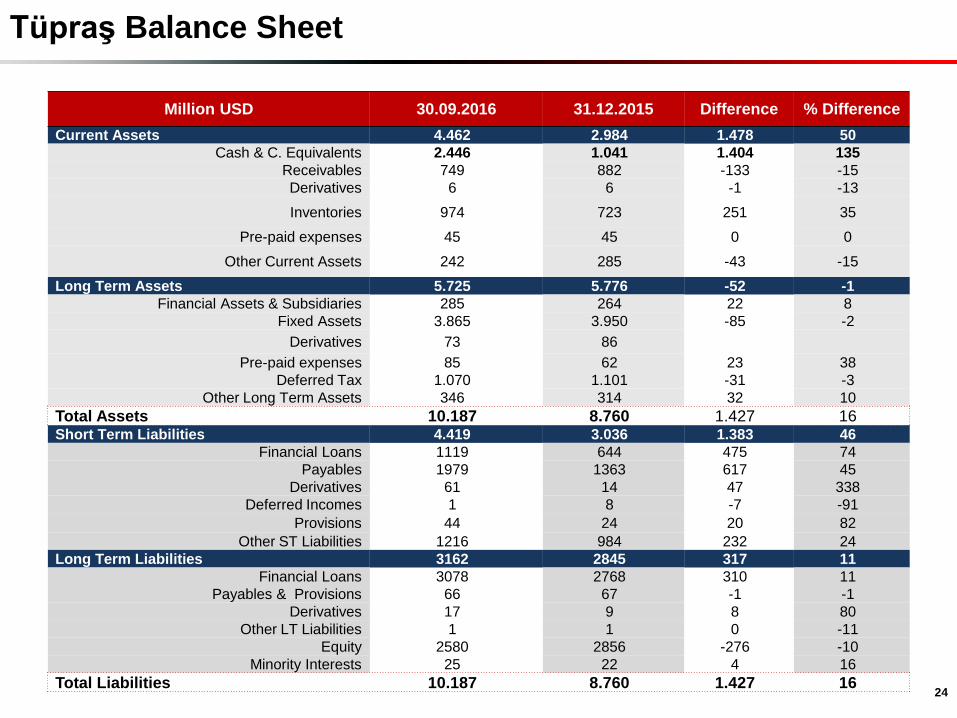
Tüpraş Balance Sheet
Million USD 30.09.2016 31.12.2015 Difference % Difference
Current Assets 4.462 2.984 1.478 50
Cash & C. Equivalents 2.446 1.041 1.404 135
Receivables 749 882 -133 -15
Derivatives 6 6 -1 -13
Inventories 974 723 251 35
Pre-paid expenses 45 45 0 0
Other Current Assets 242 285 -43 -15
Long Term Assets 5.725 5.776 -52 -1
Financial Assets & Subsidiaries 285 264 22 8
Fixed Assets 3.865 3.950 -85 -2
Derivatives 73 86
Pre-paid expenses 85 62 23 38
Deferred Tax 1.070 1.101 -31 -3
Other Long Term Assets 346 314 32 10
Total Assets 10.187 8.760 1.427 16Short Term Liabilities 4.419 3.036 1.383 46
Financial Loans 1119 644 475 74
Payables 1979 1363 617 45
Derivatives 61 14 47 338
Deferred Incomes 1 8 -7 -91
Provisions 44 24 20 82
Other ST Liabilities 1216 984 232 24
Long Term Liabilities 3162 2845 317 11
Financial Loans 3078 2768 310 11
Payables & Provisions 66 67 -1 -1
Derivatives 17 9 8 80
Other LT Liabilities 1 1 0 -11
Equity 2580 2856 -276 -10
Minority Interests 25 22 4 16
Total Liabilities 10.187 8.760 1.427 1624
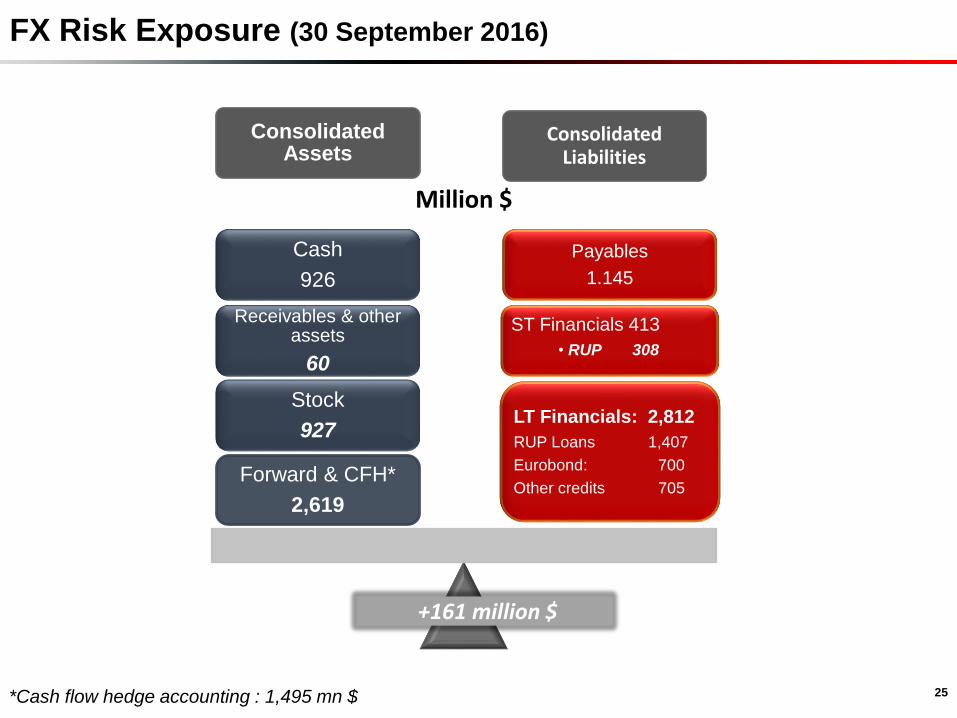
FX Risk Exposure (30 September 2016)
25*Cash flow hedge accounting : 1,495 mn $
ConsolidatedAssets
ConsolidatedLiabilities
LT Financials: 2,812
RUP Loans: 1,407
Eurobond: 700
Other credits 705
ST Financials 413
• RUP 308
Payables
1.145
Forward & CFH*
2,619
Stock
927
Receivables & otherassets
60
Cash
926
Million $
+161 million $
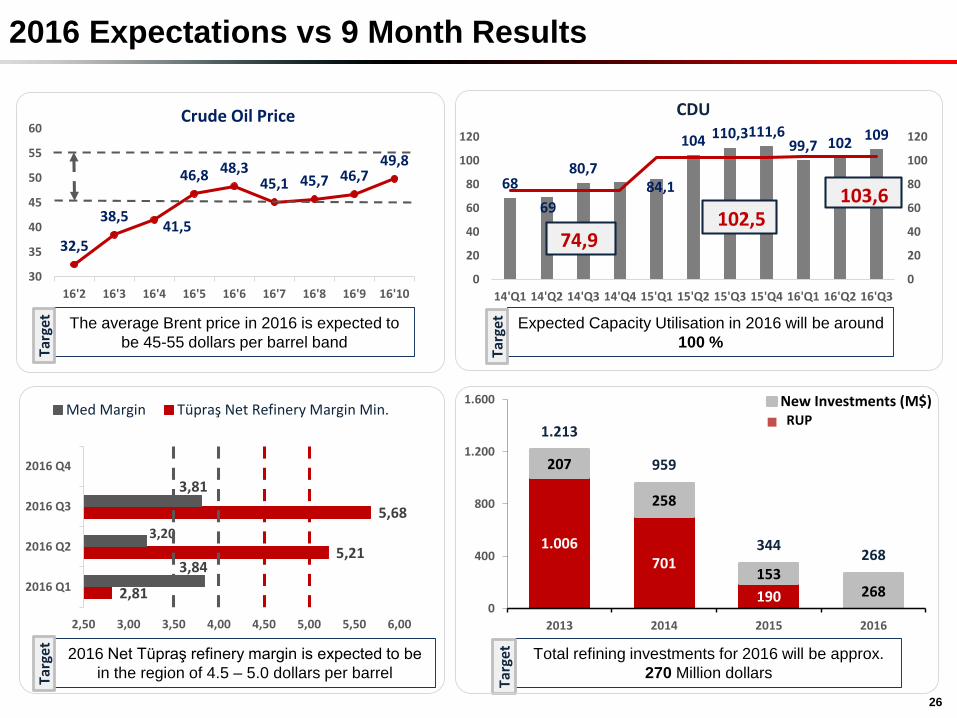
2016 Expectations vs 9 Month Results
26
32,5
38,541,5
46,8 48,345,1 45,7 46,7
49,8
30
35
40
45
50
55
60
16'2 16'3 16'4 16'5 16'6 16'7 16'8 16'9 16'10
Crude Oil Price
68
69
80,784,1
104 110,3111,699,7 102
109
0
20
40
60
80
100
120
0
20
40
60
80
100
120
14'Q1 14'Q2 14'Q3 14'Q4 15'Q1 15'Q2 15'Q3 15'Q4 16'Q1 16'Q2 16'Q3
CDU
74,9
The average Brent price in 2016 is expected to
be 45-55 dollars per barrel band
Expected Capacity Utilisation in 2016 will be around
100 %
2,81
5,21
5,68
3,84
3,20
3,81
2,50 3,00 3,50 4,00 4,50 5,00 5,50 6,00
2016 Q1
2016 Q2
2016 Q3
2016 Q4
Med Margin Tüpraş Net Refinery Margin Min.
Targ
et
Targ
et
103,6102,5
2016 Net Tüpraş refinery margin is expected to be
in the region of 4.5 – 5.0 dollars per barrelTarg
et
1.006701
190
207
258
153268
1.213
959
344268
0
400
800
1.200
1.600
2013 2014 2015 2016
New Investments (M$)RUP
Total refining investments for 2016 will be approx.
270 Million dollars
Targ
et
Disclaimer
This presentation contains forward-looking statements that reflect the Company
management’s current views with respect to certain future events. Although it is
believed that the expectations reflected in these statements are reasonable, they may
be affected by a variety of variables and changes in underlying assumptions that could
cause actual results to differ materially.
Neither Tüpraş nor any of its directors, managers or employees nor any other person
shall have any liability whatsoever for any loss arising from use of this presentation.
Thank You