Embed Size (px)
Citation preview
Q3 2014 Presentation
Arni Oddur Thordarson, CEO
Erik Kaman, CFO
Sigsteinn Gretarsson, COO
23 October 2014
Arni Oddur Thordarson
CEO

Record order intake and revenue with 9.3% adjusted EBIT
Revenue €188 million compared to €157
million in Q3 2013
Order book €169 million compared to
€156 million in last quarter
– €201 million in orders received
Adjusted EBIT of €17.4 million or 9.3%
Strong cash flow
The refocusing plan of becoming simpler,
smarter, and faster is proceeding
according to plan
Revenue
€188 million
Adjusted EBIT
€17.4 million*
Order book
€169 million
Free cash flow
€24.1 million
* Refocusing costs in Q3 amount to €1.3 million

At the customer, for the customer while refocusing
100
120
140
160
180
200
Q1 Q2 Q3 Q4 Q1 Q2 Q3 Q4 Q1 Q2 Q3
2012 2013 2014
EU
R m
illio
ns
Order book Order intake
Order
intake
€201 million

Operational results improving with strong cash flow
0
5
10
15
20
25
Q1 2014 Q2 2014 Q3 2014
Mill
ion
EU
R
adj. EBIT Free cash flow
Adjusted EBIT year-to-date
EUR 32.7 million
Year-to-date revenue has increased by 4%
compared to same period last year
Order book Q3 2014 is EUR 169 million
compared to EUR 138 million Q3 2013
Management guidance for 2014 is organic
growth and adjusted EBIT of EUR 40-50
million
EBITDA improvement and strong cash flow has driven Net Debt/adj.EBITDA down to 2.75
3.0%
6.3%
9.3%
Adjusted
EBIT ratio

Poultry
Business overview
Volume and
profitability continue to
increase
Several small and
medium size
Greenfields in new
emerging markets
Important
modernization projects
in the U.S. and Europe
Fish
Significant improvement
of profitability and
volume
Investments in the
Whitefish segment are
picking up with a
healthy pipeline
Salmon delivering
increased volume and
profits
Further Processing
Order intake
increasing and
operational
performance improving
RevoPortioner moving
into red meat and fish
building on past
success in poultry
Meat
Greenfield projects
secured and installed
in Argentina, Mexico,
Brazil and Russia
Marel is establishing
reference projects
around the globe
The aim is to gradually
improve profitability
from 2015 and onwards

Combine business units that serve the
same customer needs and rely on the
same technical capabilities
Optimize manufacturing footprint to
balance utilization of resources within the
company
Penetrate market faster after product
launches
Reduced “time to market” for
innovative solutions
Serve customer needs better
Simpler, Smarter, Faster initiative began in January 2014
Increase operational efficiency with a
target of EBIT in excess of €100
million in 2017

Refocusing on track
"At the customer for the
customer while refocusing"
Record order intake in Q3 on back of
strong order intake in Q2 2014
Improved operational efficiency
Transfer of salmon activities
to modern facility in Stovring
Meat activities transferred
from Oss to a multi-industry
site in Boxmeer
One-off cost in Q3 limited to
preparation for further
manufacturing optimization in
coming quarters
Cost of transfer fully absorbed. Running
with increased efficency in Q3
Transfer of operations according to
schedule and will be concluded in Q4
Focused market approach

Head of Global Innovation
Vidar Erlingsson
Born in 1975, married with three children
Been with Marel since 2000.
Vidar has been leading the build-up of the SensorX
technology within Marel
M.Sc. in engineering from DTU in Denmark and B.Sc. in
electrical and computer engineering from the University of
Iceland
Will drive and implement innovation strategy and vision across the company
Portfolio management and prioritizing of innovation projects
Utilize resources better
Shorten "time to market"

Erik Kaman CFO

Business results
EUR thousands
Q3
2014
Q3
2013
Change
in %
Revenue ..................................................................... 187,931 156,896 19.8
Gross profit before refocusing cost ............................. 67,372 58,030 16.1
as a % of revenue 35.8 37.0
Before refocusing costs
Result from operations (adjusted EBIT) ...................... 17,409 12,854 35.4
as a % of revenue 9.3 8.2
Adjusted EBITDA ......................................................... 25,912 19,523 32.7
as a % of revenue 13.8 12.4
After refocusing costs
Result from operations (EBIT) ..................................... 16,113 12,854 25.4
as a % of revenue 8.6 8.2
EBITDA ........................................................................ 24.616 19,523 26.1
as a % of revenue 13.1 12.4
Orders received (including service revenues) 200,747 163,346 22.9
Order book ………………………………………….…... 169,242 138,262 22.4

0%
2%
4%
6%
8%
10%
12%
14%
16%
18%
20%
0
20
40
60
80
100
120
140
160
180
200
Q1 Q2* Q3 Q4 Q1 Q2 Q3 Q4 Q1 Q2 Q3 Q4 Q1* Q2* Q3*
2011 2012 2013 2014
EU
R m
illio
ns
Revenue EBIT as % of revenue
Development of business results
* Results are normalized
Firm steps
to improve
profitability

Order book stands at EUR 169 million at the end of Q3
End of Q4 2013
132 million
Net increase in H1 2014
24 million
End of Q2 2014
156 million
End of Q3 2014
169 million
Orders received in Q3 2014
201 million
Revenues (booked off)
188 million
Q4 2013 Q2 2014 Q3 2014

Condensed consolidated balance sheet
ASSETS 30/9 2014 31/12 2013
EUR thousands
Non-current assets
Property, plant and equipment ................................................................. 97,705 104,707
Goodwill ................................................................................................... 386,791 378,708
Other intangible assets ............................................................................ 120,223 118,561
Receivables ............................................................................................. 93 691
Deferred income tax assets ..................................................................... 9,307 9,611
614,119 612,278
Current assets
Inventories ............................................................................................... 95,870 91,796
Production contracts ............................................................................... 25,076 24,829
Trade receivables .................................................................................... 75,226 68,737
Assets held for sale ................................................................................. 2,500 -
Other receivables and prepayments ....................................................... 24,114 22,135
Cash and cash equivalents ..................................................................... 25,839 19,793
248,625 227,290
Total assets 862,744 839,568
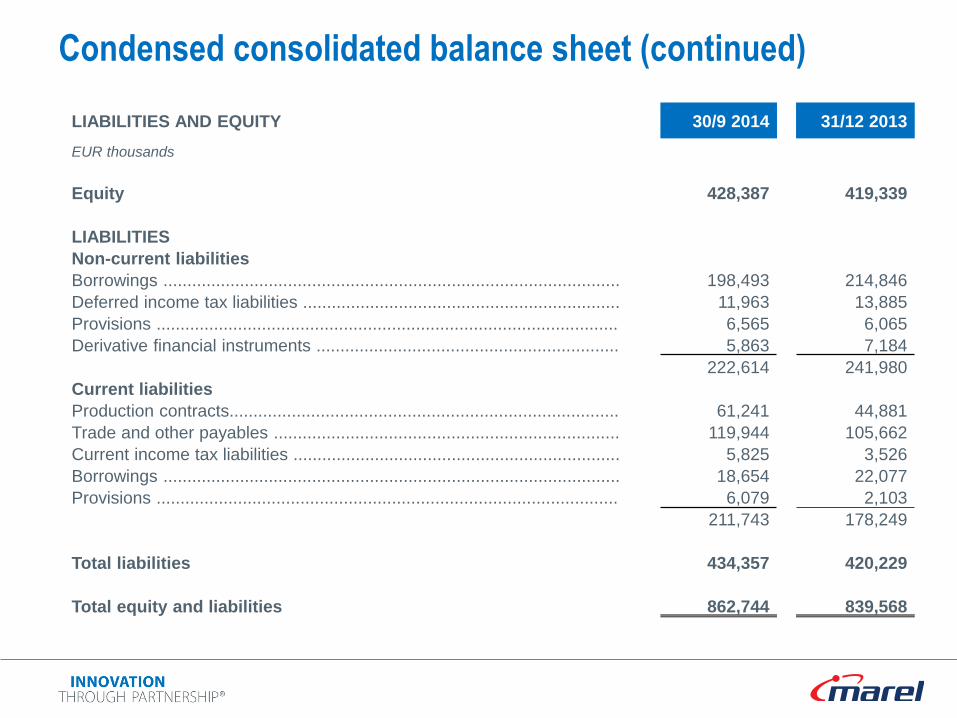
Condensed consolidated balance sheet (continued)
LIABILITIES AND EQUITY 30/9 2014 31/12 2013
EUR thousands
Equity 428,387 419,339
LIABILITIES
Non-current liabilities
Borrowings ............................................................................................... 198,493 214,846
Deferred income tax liabilities .................................................................. 11,963 13,885
Provisions ................................................................................................ 6,565 6,065
Derivative financial instruments ............................................................... 5,863 7,184
222,614 241,980
Current liabilities
Production contracts................................................................................. 61,241 44,881
Trade and other payables ........................................................................ 119,944 105,662
Current income tax liabilities .................................................................... 5,825 3,526
Borrowings ............................................................................................... 18,654 22,077
Provisions ................................................................................................ 6,079 2,103
211,743 178,249
Total liabilities 434,357 420,229
Total equity and liabilities 862,744 839,568

Operating activities (before interest & tax)
29.7 million
Free cash flow
24.1 million
Changes in net debt
13.2 million
Tax
0.3 million
Investment activities
5.3 million
Net finance cost
2.8 million Treasury shares
2.3 million
Other items*
5.8 million
Q3 2014 cash flow composition and changes in net debt
* Currency effect and change in capitalized finance charges.

Net interest bearing debt reduced by EUR 25.8 million YTD 2014
100
150
200
250
300
350
400
Q1 Q2 Q3 Q4 Q1 Q2 Q3 Q4 Q1 Q2 Q3 Q4 Q1 Q2 Q3 Q4 Q1 Q2 Q3 Q4 Q1 Q2 Q3
2009 2010 2011 2012 2013 2014
EU
R m
illio
ns

Arni Oddur Thordarson
CEO

Planting seeds in future growth markets
China
Poultry project
with leading
processor Mexico Streamline
solutions to the
meat industry
Vietnam Good projects in
the whitefish and
poultry segments
Africa Five greenfield
projects in poultry
Thailand Good project in
poultry
Argentina Successful
installment and start
of Streamline
project in meat
Taiwan Greenfield project
in poultry

Global Animal Protein Surpluses and Deficits
Source: FAO
Beef and veal
Pork
Chicken
Surplus Deficit Legend
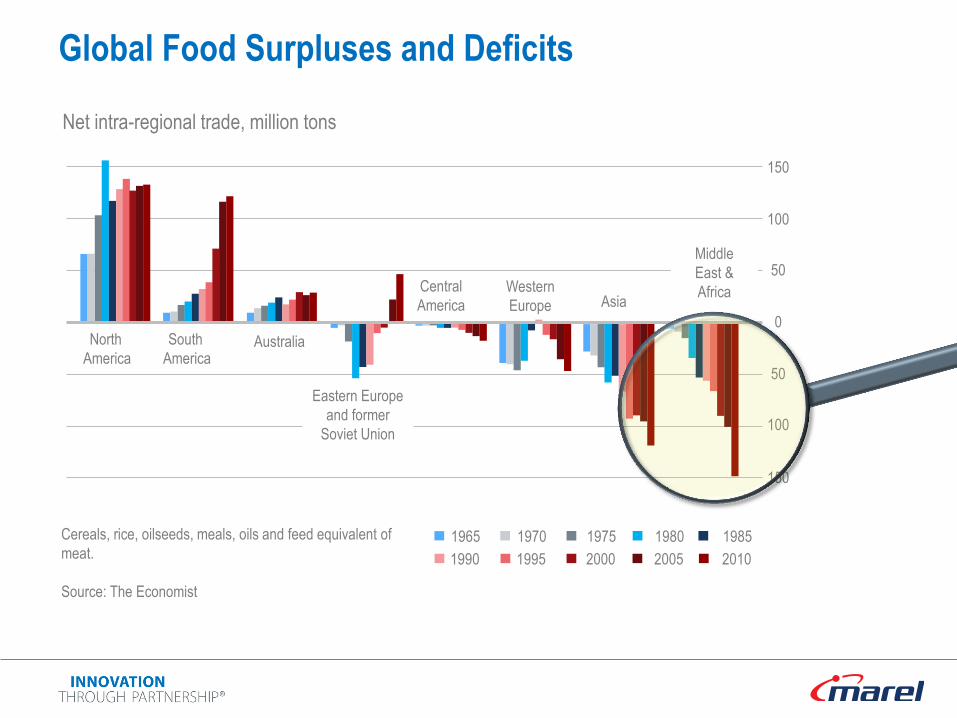
Global Food Surpluses and Deficits
Net intra-regional trade, million tons
1965
1990
1970
1995
1975
2000
1980
2005
1985
2010
150
100
50
0
50
100
150
North
America
South
America Australia
Eastern Europe
and former
Soviet Union
Western
Europe Asia
Middle
East &
Africa Central
America
Cereals, rice, oilseeds, meals, oils and feed equivalent of
meat.
Source: The Economist

Marel is transforming poultry processing in Africa
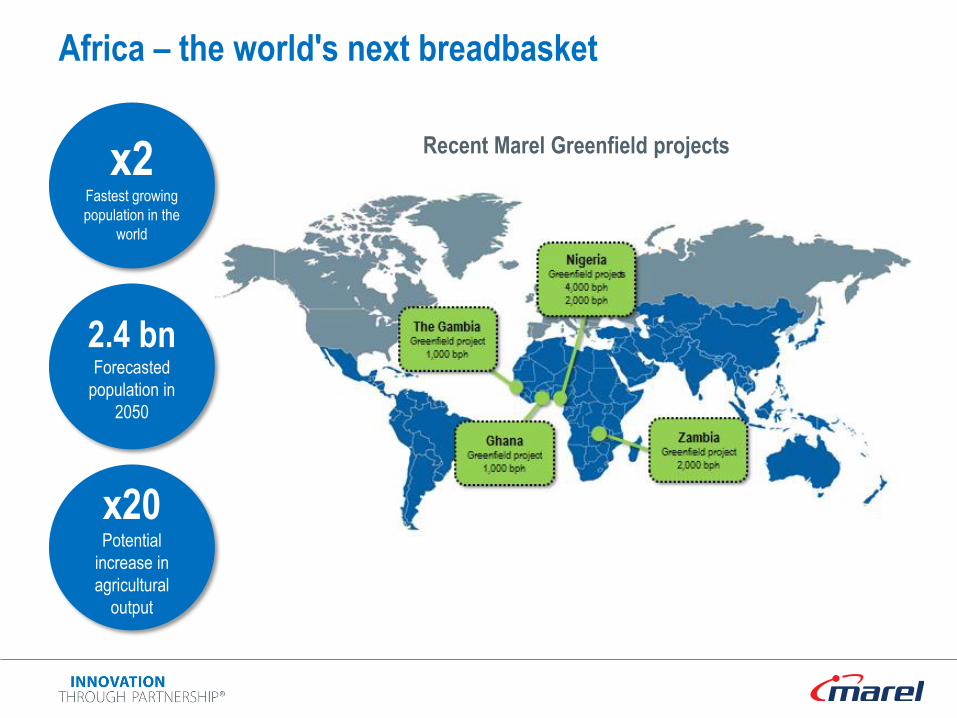
Africa – the world's next breadbasket
x2 Fastest growing
population in the
world
2.4 bn Forecasted
population in
2050
x20 Potential
increase in
agricultural
output
Recent Marel Greenfield projects

Record order intake and revenue in Q3 2014
Modernization and
standard equpiment ►
Investment in expansion
and modernization projects
picking up in the US and
Europe
◄ Greenfields
Several small and
medium sized
Greenfield projects in
emerging growth
markets such as
Africa, Asia, and South
America
Maintenance ▲
Marel has the largest installment base in its industry
Recurring service and spare parts revenues increasing steadily and are
currently around 40% of total revenues

Q&A

Disclaimer
This Presentation is being furnished for the sole purpose of assisting the recipient in deciding whether to proceed with further analysis of this potential opportunity. This Presentation is for informational purposes only and shall not be construed as an offer or solicitation for the subscription or purchase or sale of any securities, or as an invitation, inducement or intermediation for the sale, subscription or purchase of securities.
The information set out in this Presentation may be subject to updating, completion, revision and amendment and such information may change materially. Even though Marel hf. has given due care and attention in the preparation of this Presentation, no representation or warranty, express or implied, is or will be made by Marel hf. as to the accuracy, completeness or fairness of the information or opinions contained in this Presentation and any reliance the recipient places on them will be at its own sole risk. Without prejudice to the foregoing, Marel hf. does not accept any liability whatsoever for any loss howsoever arising, directly or indirectly, from use of this Presentation or its contents or otherwise arising in connection therewith. Any recipient of this Presentation is recommended to seek its own financial advice.
There is no representation, warranty or other assurance that any of the projections in the Presentation will be realized. The recipient should conduct its own investigation and analysis of the business, data and property described herein. Any statement contained in this Presentation that refers to estimated or anticipated future results or future activities are forward-looking statements which reflect current analysis of existing trends, information and plans. Forward-looking statements are subject to a number of risks and uncertainties that could cause actual results to differ materially and could adversely affect the outcome and financial effects of the plans and events described herein. As a result, the recipient is cautioned not to place undue reliance on such forward-looking statements.
Transactions with financial instruments by their very nature involve high risk. Historical price changes are not necessarily an indication of future price trends. Any recipient of this Presentation are encouraged to acquire general information from expert advisors concerning securities trading, investment issues, taxation, etc. in connection with securities transactions.
This Presentation and its contents are confidential and may not be further distributed, published or reproduced, in whole or in part, by any medium or in any form for any purpose, without the express written consent of Marel hf. By accepting this Presentation the recipient has agreed, upon request, to return promptly all material received from Marel hf. (including this Presentation) without retaining any copies. In furnishing this Presentation, Marel hf. undertakes no obligation to provide the recipient with access to any additional information or to update this Presentation or to correct any inaccuracies therein which may become apparent.
The distribution of this Presentation, or any of the information contained in it, in other jurisdictions than the Republic of Iceland may be restricted by law, and persons into whose possession this Presentation comes should inform themselves about, and observe, any such restrictions. Any failure to comply with these restrictions may constitute a violation of the laws of any such other jurisdictions.

Thank you
Dank u wel
Takk fyrir
Mange tak


![Q3 2015 Presentation · 2020. 11. 23. · Q3 2015 Presentation October 29, 2015 . Arni Oddur Thordarson, CEO • Revenue of €189 million [Q3 2014: 188m] - Good geographical and](https://img.pdfslide.us/doc/110x75/60f791db8dedc05b8d732763/q3-2015-presentation-2020-11-23-q3-2015-presentation-october-29-2015-arni.jpg)


![Q3 2015 PresentationQ3 2015 Presentation October 29, 2015 Arni Oddur Thordarson, CEO • Revenue of €189 million [Q3 2014: 188m] - Good geographical and product mix • Order intake](https://img.pdfslide.us/doc/110x75/5f9a7ad2e10bc52de5417e2a/q3-2015-presentation-q3-2015-presentation-october-29-2015-arni-oddur-thordarson.jpg)