Embed Size (px)
Citation preview

Q3 2013 Roadshow Presentation
2222
� ARPU: ARPU: ARPU: ARPU: Monthly average revenue per user is based on a rolling 12 months average taking into consideration total Incoming & outgoing revenues voice, SMS and MMM, visitor roaming ( excl.:MatMa, MVNO, IFRS, MBB )
� AUPUAUPUAUPUAUPU: Monthly average usage per user, defined as total usage for the 12 previous months divided by the weighted average number of customers
� M2MM2MM2MM2M: =Machine-to-machine = M2M cards are not included in the number of active customers
� MobileMobileMobileMobile MultimediaMultimediaMultimediaMultimedia: (MMM): Wireless high-speed internet access on handset devices
� MobileMobileMobileMobile broadbandbroadbandbroadbandbroadband (MBB): Wireless high-speed internet access through a portable modem / card, on tablets, netbooks, notebooks and laptops. (Internet Everywhere)
� MVNOMVNOMVNOMVNO: Mobile Virtual Network Operator. These are operators that do not have their own radio network and thus use the infrastructure of third-party networks.
� MTR: MTR: MTR: MTR: Mobile Termination Rate is the per minute charge paid by a telecommunications network operator when a customer makes a call to another mobile network operator
� MNPMNPMNPMNP: mobile number portability allows mobile customers to keep their mobile numbers when they change operators. The donor operator deactivates the mobile number in its information system; the recipient operator actives the same mobile number in its own
� NPSNPSNPSNPS (Net Promoter Score): A measure of customer loyalty. It is obtained by asking customers a single question on a scale of 0 to 10 where 10 is 'extremely likely' and 0 is 'not likely at all’.
� Operational Operational Operational Operational cashcashcashcash----flowflowflowflow: Corresponds to restated EBITDA minus CAPEX. Mobistar uses this indicator to measure the Group’s performance in generating cash flow from its operating activities.
DefinitionsDefinitionsDefinitionsDefinitions
3333
This presentation contains forward-looking statements about Mobistar, inparticular for 2013 and 2014. Although Mobistar believes these statements arebased on reasonable assumptions, these forward-looking statements are subjectto numerous risks and uncertainties, including matters not yet known to us or notcurrently considered material by us, and there can be no assurance thatanticipated events will occur or that the objectives set out will actually beachieved. Important factors that could cause actual results to differ materiallyfrom the results anticipated in the forward-looking statements include, amongothers, the impact of the price adjustments on the customer base resulting fromthe competitive pressure and the economic situation in Belgium, the accelerationof the efficiency programs which aims at a structural net savings of the cost baseof Mobistar from 30 to 50 million euro net as of 2014, the effectiveness ofMobistar convergent strategy including the success and market acceptance ofthe voice and date abundance plans, the Mobistar TV offers, the Mobistar brandand other strategic, operating and financial initiatives, Mobistar’s ability to adapt tothe on-going transformation of the telecommunications industry, regulatorydevelopments and constraints and the outcome of legal proceedings, risks anduncertainties related to business activity.
Cautionary StatementCautionary StatementCautionary StatementCautionary Statement

4444
• Key Highlights
• Operating Results
• Topics in the Spotlight
• Financial Review
• Outlook 2013
Jean Marc Jean Marc Jean Marc Jean Marc HarionHarionHarionHarionChief Executive Officer
Siddy Siddy Siddy Siddy JobeJobeJobeJobeDirector Investor Relations& Corporate Finance
Ludovic Ludovic Ludovic Ludovic PechPechPechPechChief Financial Officer
Agenda

5555
KEY QUARTERLY HIGHLIGHTSEconomic Indicators
Q3 Market Review
Company Highlights
Strategic priorities
6666
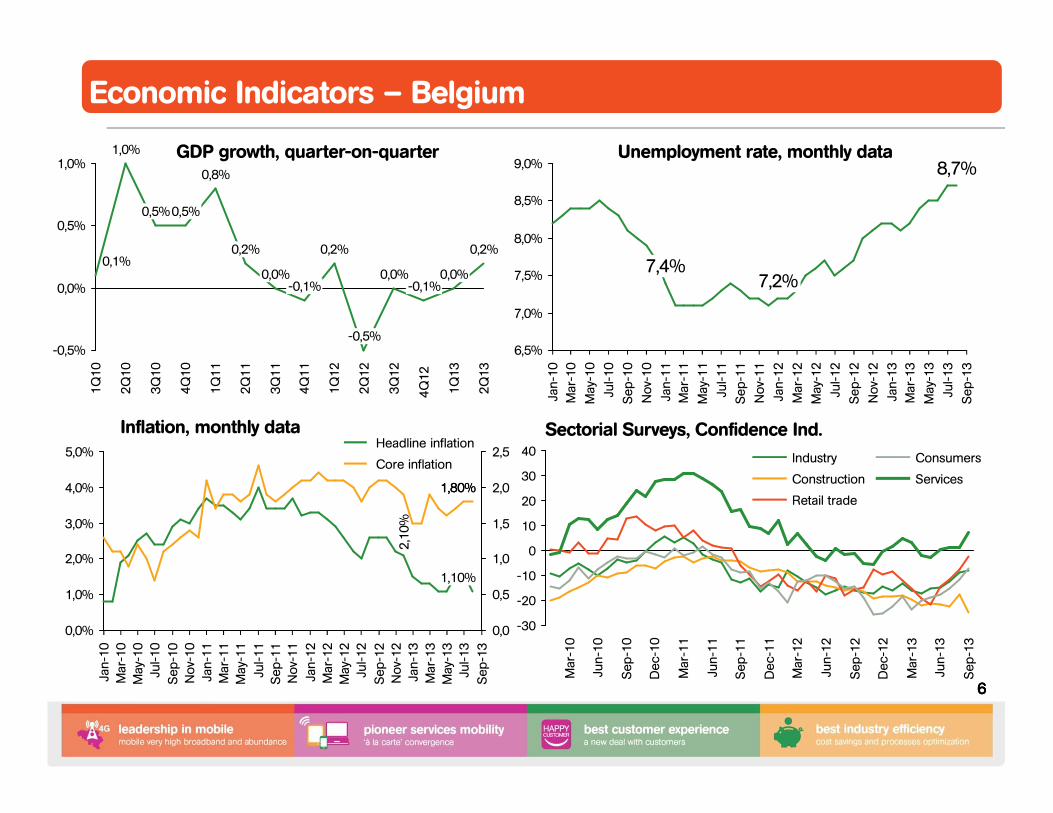
GDP growth, quarter-on-quarter Unemployment rate, monthly data
Inflation, monthly data Sectorial Surveys, Confidence Ind.
Jul-
12
Jan
-10
Mar
-11
Jul-
11
Mar
-12
No
v-1
1
Se
p-1
0
No
v-1
2
Mar
-13
May
-11
Mar
-10
May
-12
Se
p-1
3
May
-10
Jul-
10
Jan
-13
Se
p-1
2
Jan
-11
No
v-1
0
Jan
-12
Se
p-1
1
9,0%
8,5%
8,0%
7,5%
7,0%
6,5%
May
-13
Jul-
13
8,7%
7,2%7,4%
0,0%
-0,5%
0,5%
1,0%
1Q
13
0,0%
4Q
12
-0,1%
3Q
12
0,0%
2Q
12
-0,5%1
Q1
2
0,2% 0,2%
4Q
11
-0,1%3
Q1
10,0%
2Q
11
0,2%
1Q
11
0,8%4
Q1
0
0,5%
3Q
10
0,5%
2Q
10
1,0%
1Q
10
0,1%
2Q
13
Jul-
10
May
-11
Jan
-10
No
v-1
0
Mar
-12
Mar
-10
Jul-
11
No
v-1
1
Mar
-11
May
-12
1,5
2,0S
ep
-13
0,0
Se
p-1
2
May
-13
2,5
0,5
No
v-1
2
Jan
-13
Jul-
12
Mar
-13
1,0
5,0%
4,0%
3,0%
2,0%
1,0%
0,0%
May
-10
Jul-
13
Se
p-1
1
Jan
-12
Jan
-11
Se
p-1
0
1,80%
1,10%
2,1
0%
1,80%
Core inflation
Headline inflation
-30
-20
-10
0
10
20
30
40
Mar
-13
De
c-1
2
Se
p-1
2
Jun
-12
Mar
-12
De
c-1
1
Se
p-1
1
Jun
-11
Mar
-11
De
c-1
0
Se
p-1
0
Jun
-10
Mar
-10
Jun
-13
Se
p-1
3
Services
Consumers
Retail trade
Construction
Industry
Economic Indicators – Belgium
7777
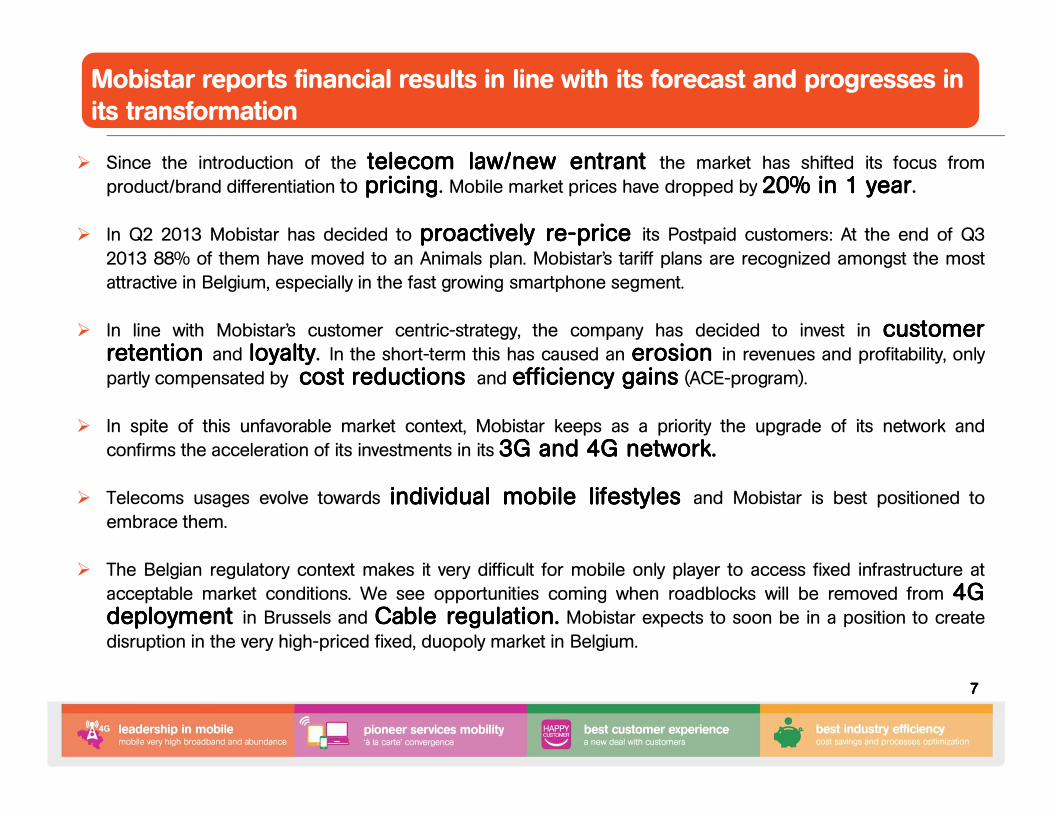
� Since the introduction of the telecomtelecomtelecomtelecom law/newlaw/newlaw/newlaw/new entrantentrantentrantentrant the market has shifted its focus from
product/brand differentiation to pricingpricingpricingpricing. Mobile market prices have dropped by 20202020%%%% inininin 1111 yearyearyearyear.
� In Q2 2013 Mobistar has decided to proactivelyproactivelyproactivelyproactively rererere----pricepricepriceprice its Postpaid customers: At the end of Q3
2013 88% of them have moved to an Animals plan. Mobistar’s tariff plans are recognized amongst the most
attractive in Belgium, especially in the fast growing smartphone segment.
� In line with Mobistar’s customer centric-strategy, the company has decided to invest in customercustomercustomercustomerretentionretentionretentionretention and loyaltyloyaltyloyaltyloyalty. In the short-term this has caused an erosionerosionerosionerosion in revenues and profitability, only
partly compensated by costcostcostcost reductionsreductionsreductionsreductions and efficiencyefficiencyefficiencyefficiency gainsgainsgainsgains (ACE-program).
� In spite of this unfavorable market context, Mobistar keeps as a priority the upgrade of its network and
confirms the acceleration of its investments in its 3333GGGG andandandand 4444GGGG networknetworknetworknetwork....
� Telecoms usages evolve towards individualindividualindividualindividual mobilemobilemobilemobile lifestyleslifestyleslifestyleslifestyles and Mobistar is best positioned to
embrace them.
� The Belgian regulatory context makes it very difficult for mobile only player to access fixed infrastructure at
acceptable market conditions. We see opportunities coming when roadblocks will be removed from 4444GGGGdeploymentdeploymentdeploymentdeployment in Brussels and CableCableCableCable regulationregulationregulationregulation.... Mobistar expects to soon be in a position to create
disruption in the very high-priced fixed, duopoly market in Belgium.
Mobistar reports financial results in line with its forecast and progresses in its transformation
8888
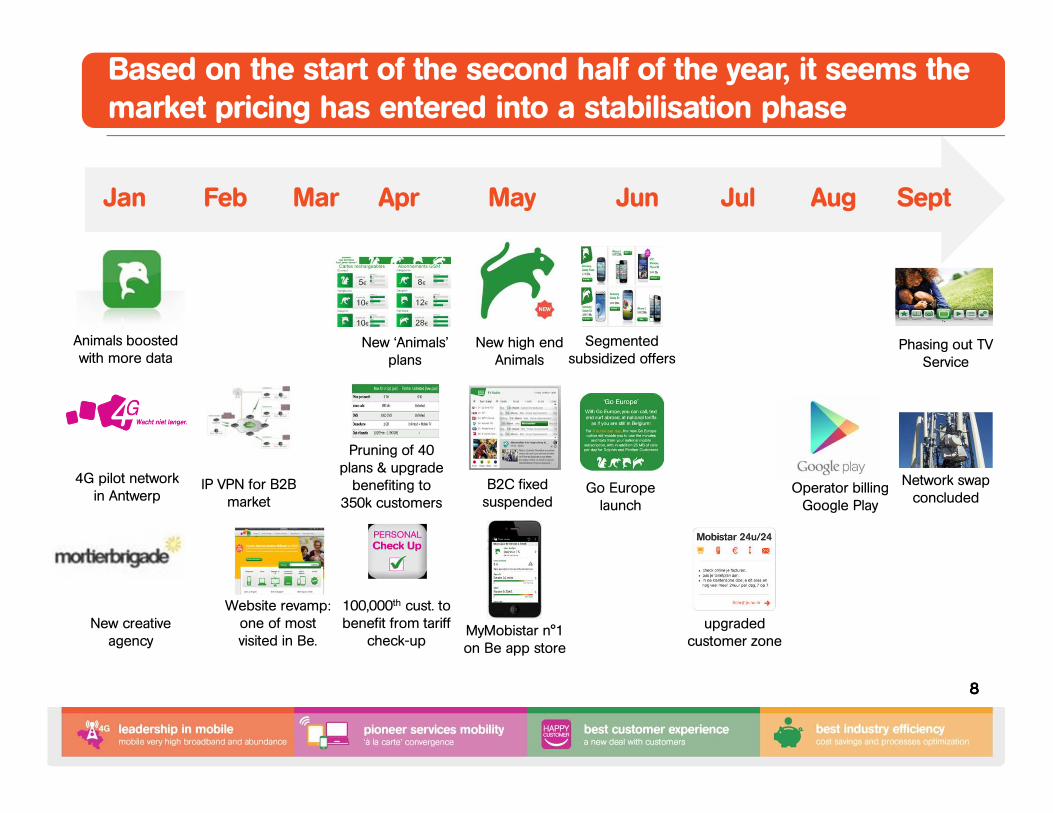
Based on the start of the second half of the year, it seems the market pricing has entered into a stabilisation phase
Apr May JunJan Feb Mar
New ‘Animals’ plans
Segmented subsidized offers
New high end Animals
Animals boostedwith more data
IP VPN for B2B market
Go Europe launch
B2C fixed suspended
Pruning of 40 plans & upgrade
benefiting to 350k customers
New creative agency
Website revamp: one of most visited in Be.
100,000th cust. to benefit from tariff
check-upMyMobistar n°1 on Be app store
4G pilot network in Antwerp
Jul Aug Sept
Network swap concluded
Phasing out TV Service
upgraded customer zone
Operator billing Google Play
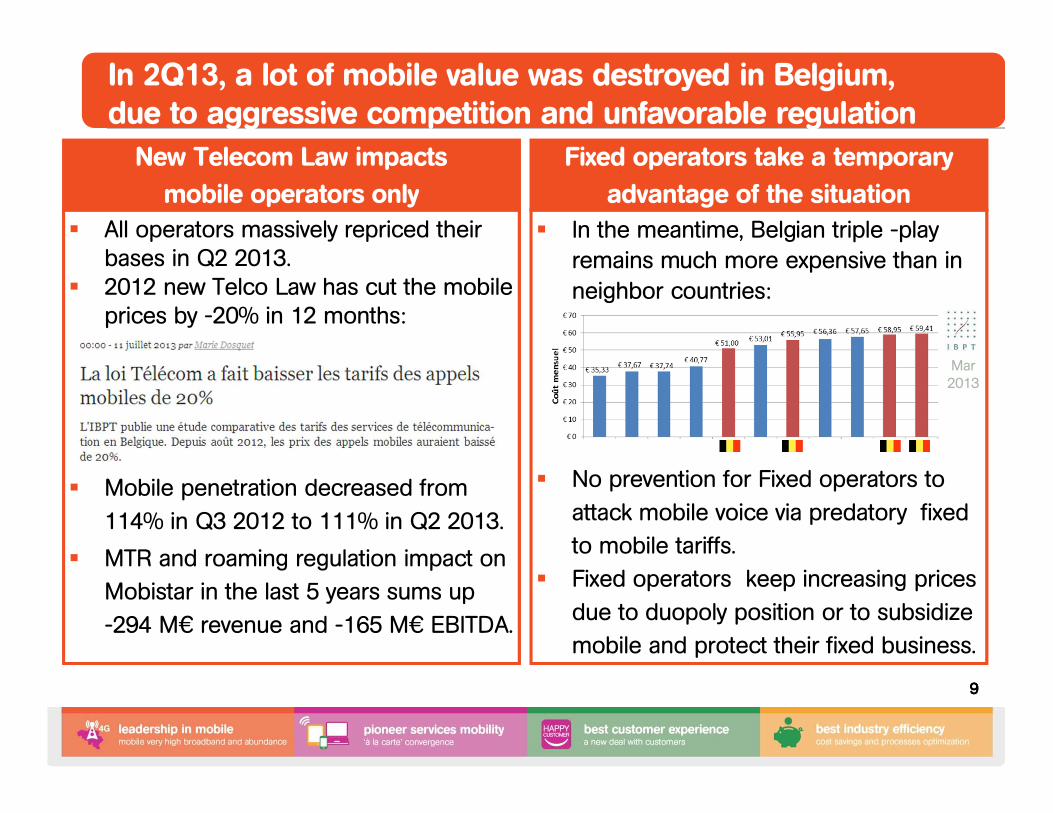
� In the meantime, Belgian triple -play remains much more expensive than in
neighbor countries:
� No prevention for Fixed operators to
attack mobile voice via predatory fixed
to mobile tariffs.
� Fixed operators keep increasing prices
due to duopoly position or to subsidize
mobile and protect their fixed business.
Telco Law has cut the mobile
EBITDA.
� All operators massively repriced their bases in Q2 2013.
� 2012 new Telco Law has cut the mobile prices by -20% in 12 months:
� Mobile penetration decreased from
114% in Q3 2012 to 111% in Q2 2013.
� MTR and roaming regulation impact on
Mobistar in the last 5 years sums up
-294 M€ revenue and -165 M€ EBITDA.
Mar 2013
9999
In 2Q13, a lot of mobile value was destroyed in Belgium,due to aggressive competition and unfavorable regulation
Fixed operators take a temporary
advantage of the situation
New Telecom Law impacts
mobile operators only
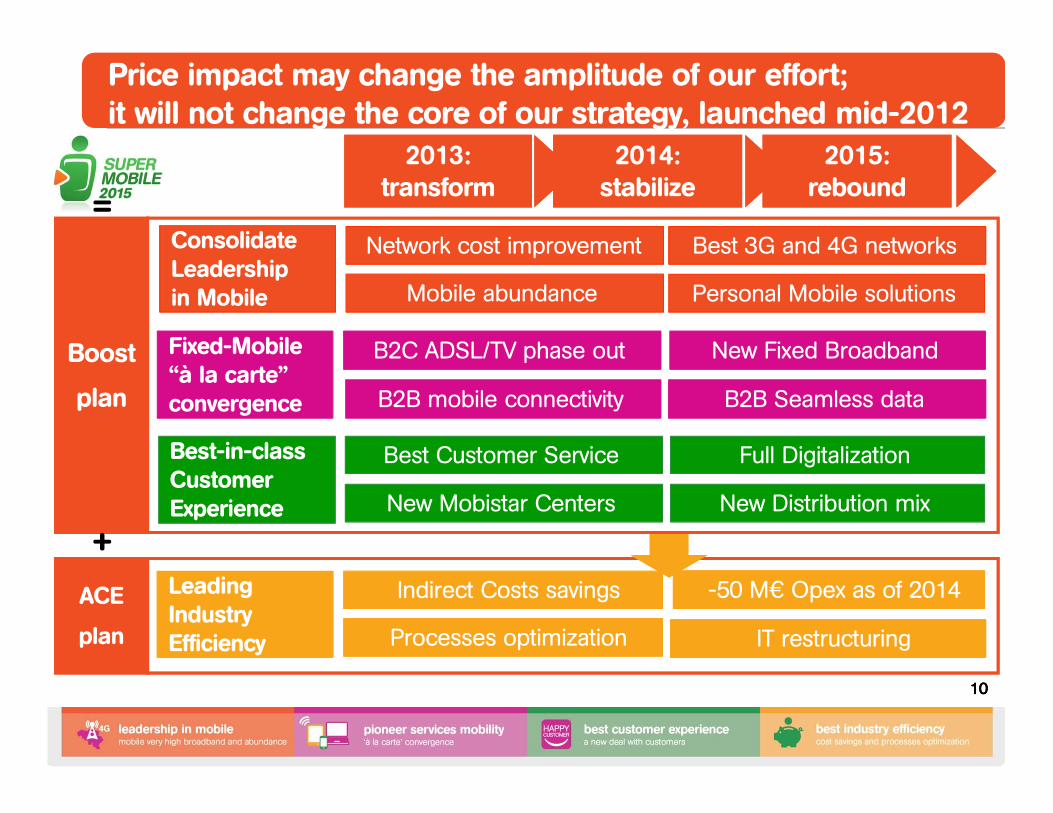
Processes optimization
-50 M€ Opex as of 2014
10101010
Price impact may change the amplitude of our effort;it will not change the core of our strategy, launched mid-2012
IT restructuring
Indirect Costs savings
Efficiency
LeadingIndustry Efficiency
Best 3G and 4G networks
Mobile abundance
Best Customer Service
New Mobistar Centers
New Fixed Broadband
B2B mobile connectivity
Network cost improvement
New Distribution mix
B2C ADSL/TV phase out
B2B Seamless data
Full Digitalization
Personal Mobile solutions
Boost
plan
ACE
plan
+
Best-in-class Customer Experience
ConsolidateLeadershipin Mobile
Fixed-Mobile“à la carte” convergence
2013:transform
2014:stabilize
2015:rebound
=
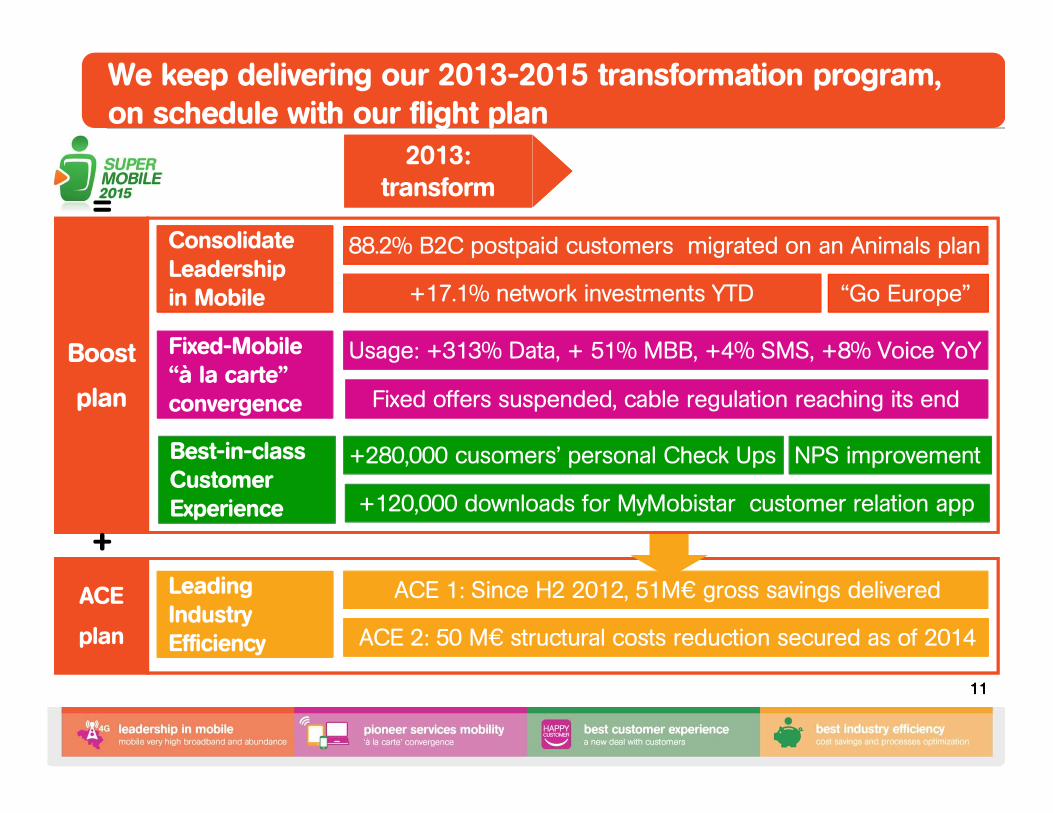
ACE 2: 50 M€ structural costs reduction secured as of 2014
11111111
We keep delivering our 2013-2015 transformation program, on schedule with our flight plan
ACE 1: Since H2 2012, 51M€ gross savings delivered
Efficiency
LeadingIndustry Efficiency
+17.1% network investments YTD
+280,000 cusomers’ personal Check Ups
+120,000 downloads for MyMobistar customer relation app
Fixed offers suspended, cable regulation reaching its end
88.2% B2C postpaid customers migrated on an Animals plan
Usage: +313% Data, + 51% MBB, +4% SMS, +8% Voice YoYBoost
plan
ACE
plan
+
Best-in-class Customer Experience
ConsolidateLeadershipin Mobile
Fixed-Mobile“à la carte” convergence
2013:transform
=
NPS improvement
“Go Europe”
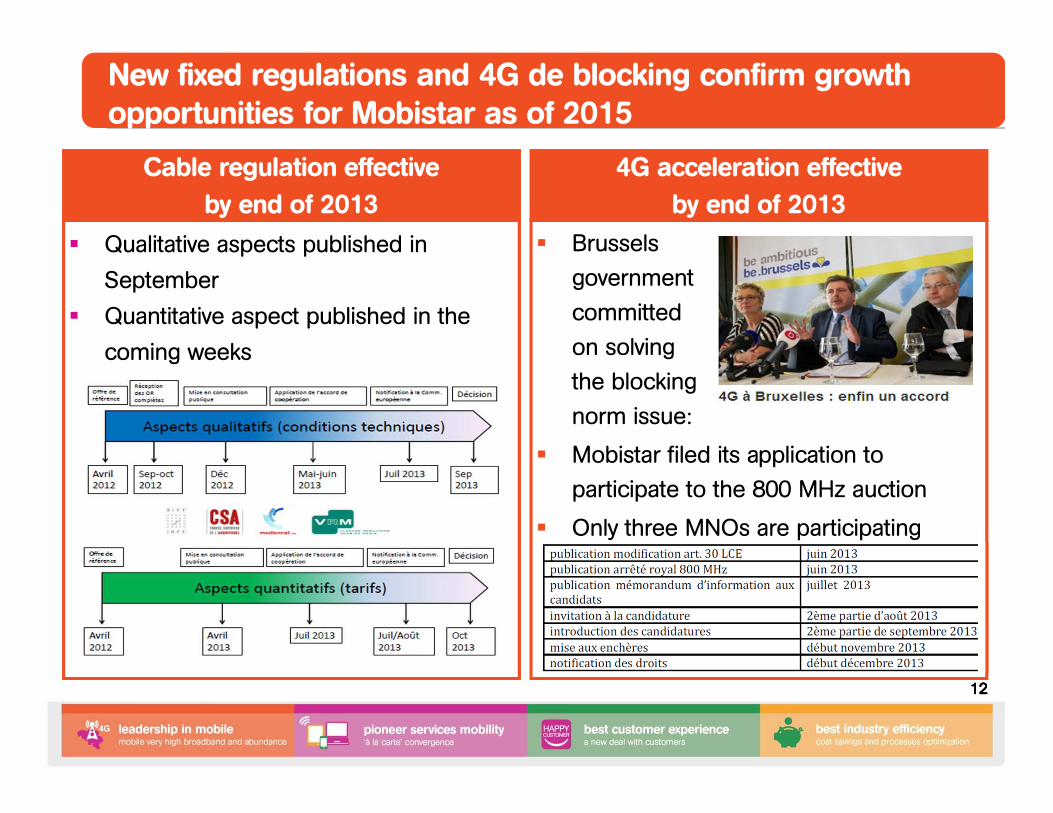
� Qualitative aspects published in
September
� Quantitative aspect published in the
coming weeks
� Brussels
government
committed
on solving
the blocking
norm issue:
� Mobistar filed its application to
participate to the 800 MHz auction
� Only three MNOs are participating
Cable regulation effective
by end of 2013
4G acceleration effective
by end of 2013
New fixed regulations and 4G de blocking confirm growth opportunities for Mobistar as of 2015
12121212
13131313
Operational UpdateMarket Dynamics
Customers, Price & Traffic Evolution
Mobile Data
B2B: M2M
Wholesale Business
14141414
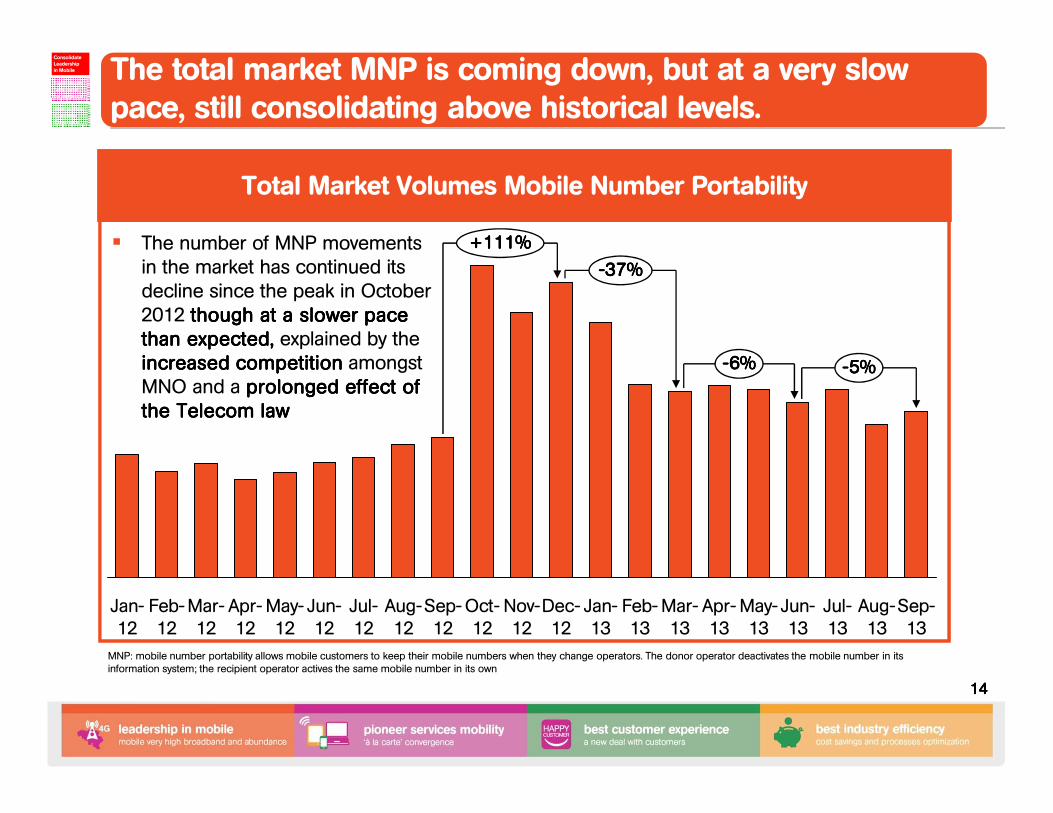
Total Market Volumes Mobile Number Portability
� The number of MNP movements in the market has continued its decline since the peak in October 2012 though at a slower pace though at a slower pace though at a slower pace though at a slower pace than than than than expected,expected,expected,expected, explained by the increased competitionincreased competitionincreased competitionincreased competition amongst MNO and a prolonged effect of prolonged effect of prolonged effect of prolonged effect of the Telecom lawthe Telecom lawthe Telecom lawthe Telecom law
MNP: mobile number portability allows mobile customers to keep their mobile numbers when they change operators. The donor operator deactivates the mobile number in its information system; the recipient operator actives the same mobile number in its own
----6%6%6%6%
+111%+111%+111%+111%
----37%37%37%37%
Sep-13
Aug-13
Jul-13
Jun-13
May-13
Apr-13
Mar-13
Feb-13
Jan-13
Dec-12
Nov-12
Oct-12
Sep-12
Aug-12
Jul-12
Jun-12
May-12
Apr-12
Mar-12
Feb-12
Jan-12
----5%5%5%5%
Best-in-class Customer Experience
ConsolidateLeadershipin Mobile
Fixed-Mobile“à la carte” convergence
The total market MNP is coming down, but at a very slow pace, still consolidating above historical levels.
15151515
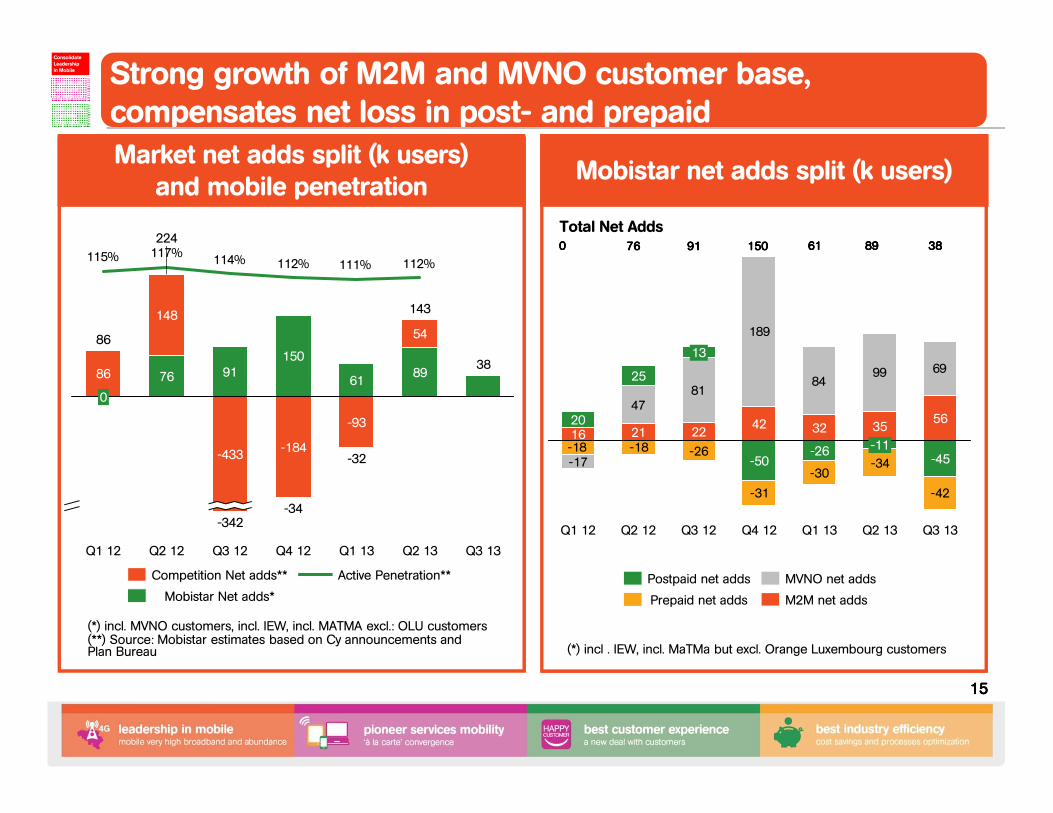
Strong growth of M2M and MVNO customer base, compensates net loss in post- and prepaid
76
38
112%111%112%114%117%115%
Q3 13Q2 13
143
89
54
Q1 13
-32
61
-93
-433
Q2 12
224
76
148
Q1 12
86
0
86
-342
Q3 12
-184
150
-34
Q4 12
91
Active Penetration**
Mobistar Net adds*
Competition Net adds**
-31
-30-34
-42
189
8499 69
-26-18-18-17
8147
Q3 13
56
-45
Q2 13
35
-11
Q1 13
32
-26
Q4 12
42
-50
Q3 12
22
13
Q2 12
21
25
Q1 12
1620
M2M net adds
MVNO net adds
Prepaid net adds
Postpaid net adds
(*) incl. MVNO customers, incl. IEW, incl. MATMA excl.: OLU customers(**) Source: Mobistar estimates based on Cy announcements and Plan Bureau (*) incl . IEW, incl. MaTMa but excl. Orange Luxembourg customers
0000 76767676 91919191 150150150150 61616161
Total Net Adds
Market net adds split (k users)and mobile penetration
Mobistar net adds split (k users)
89898989
Best-in-class Customer Experience
ConsolidateLeadershipin Mobile
Fixed-Mobile“à la carte” convergence
38383838
16161616
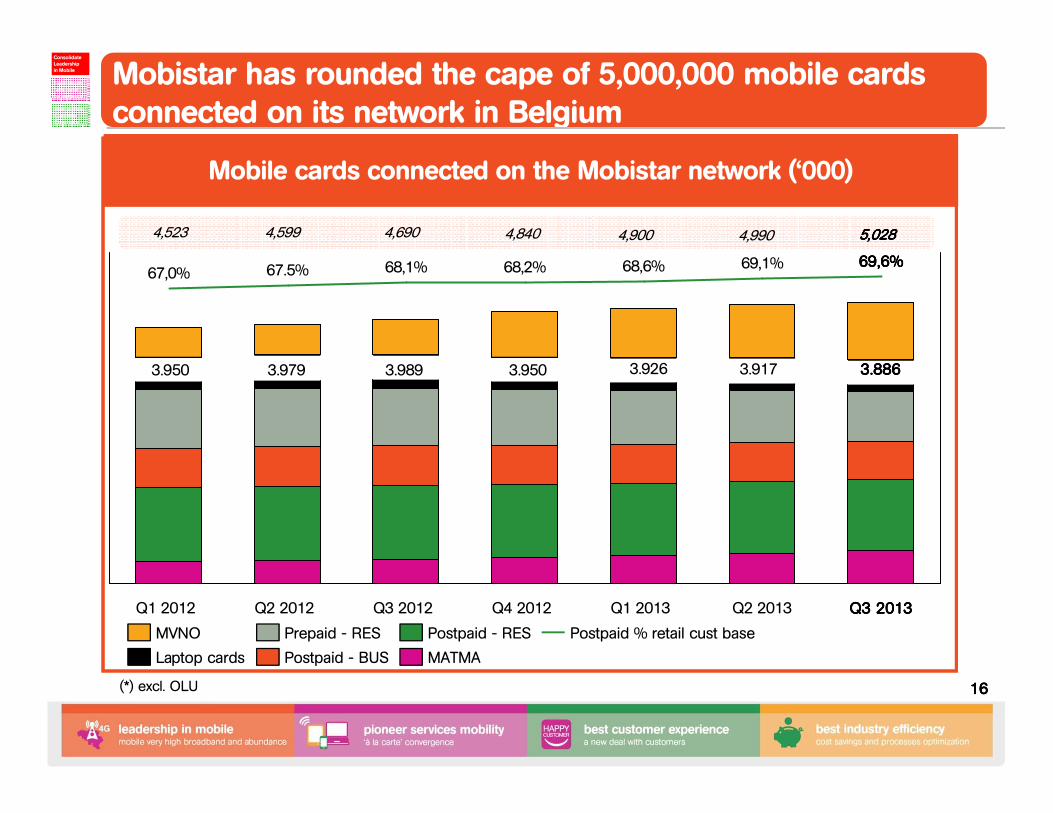
Mobistar has rounded the cape of 5,000,000 mobile cards connected on its network in Belgium
69,6%69,6%69,6%69,6%
Q3 2013Q3 2013Q3 2013Q3 2013Q2 2013
69,1%
Q1 2013
68,6%
Q4 2012
68,2%
Q3 2012
68,1%
Q2 2012
67.5%
Q1 2012
67,0%
Postpaid - RES
Postpaid - BUS
Postpaid % retail cust baseMVNO Prepaid - RES
Laptop cards MATMA
(*) excl. OLU
3.950 3.979 3.989 3.950 3.926
Mobile cards connected on the Mobistar network (‘000)
3.8863.8863.8863.886
Best-in-class Customer Experience
ConsolidateLeadershipin Mobile
Fixed-Mobile“à la carte” convergence
3.917
4,523 4,599 4,690 4,840 4,900 4,990 5,0285,0285,0285,028
April 1: continued push of Personal Check to all customers
April 16: New Animals portfolio: Postpaid review + Dolphin 12 web only
+ new High end unlimited Animals+ Prepaid Animals launched
May 7: upgrade of 350,000 old plans with new “Animals” tariff conditions
May 15: suspension of the commercialization of Fixed residential ADSL and satellite services
May 22: “iWant” tactical subsidized handset campaign
June 21: launch of Go Europe (unique roaming option)
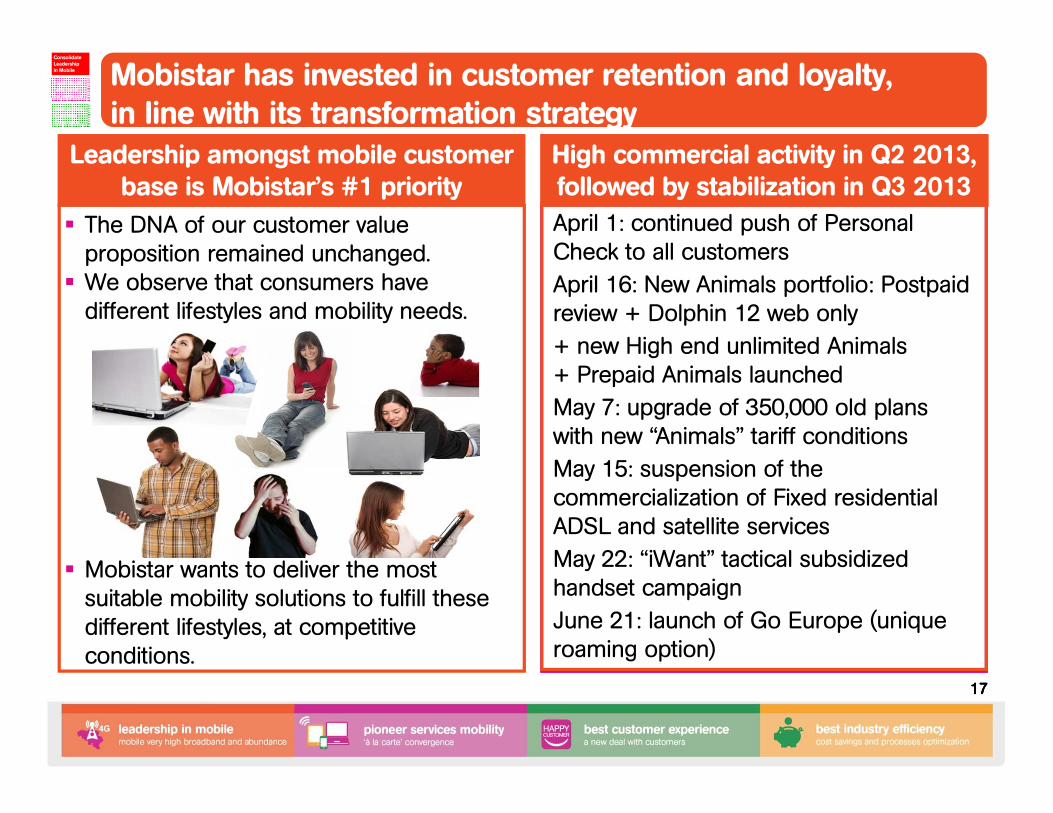
Mobistar has invested in customer retention and loyalty,in line with its transformation strategy
17171717
Best-in-class Customer Experience
ConsolidateLeadershipin Mobile
Fixed-Mobile“à la carte” convergence
� The DNA of our customer value proposition remained unchanged.
� We observe that consumers have different lifestyles and mobility needs.
� Mobistar wants to deliver the most suitable mobility solutions to fulfill these different lifestyles, at competitive conditions.
Leadership amongst mobile customer base is Mobistar’s #1 priority
High commercial activity in Q2 2013, followed by stabilization in Q3 2013
April 1: continued push of Personal Check to all customers
April 16: New Animals portfolio: Postpaid review + Dolphin 12 web only
+ new High end unlimited Animals+ Prepaid Animals launched
May 7: upgrade of 350,000 old plans with new “Animals” tariff conditions
May 15: suspension of the commercialization of Fixed residential ADSL and satellite services
May 22: “iWant” tactical subsidized handset campaign
June 21: launch of Go Europe (unique roaming option)
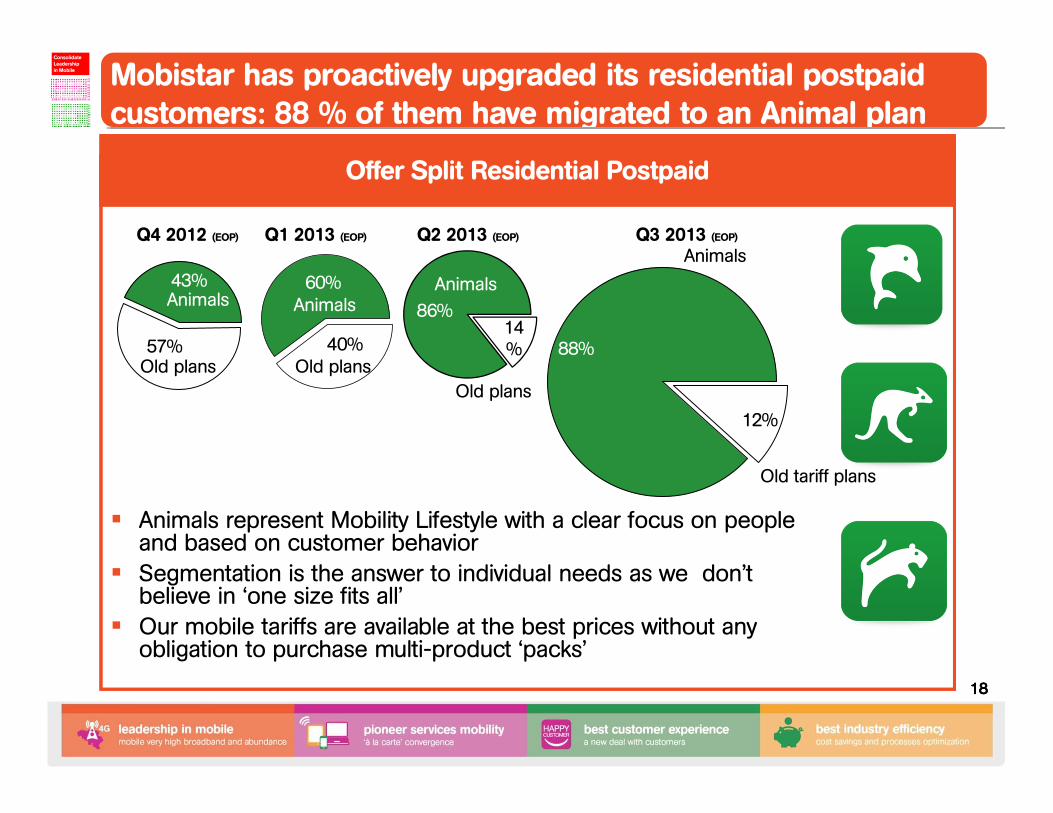
Mobistar has proactively upgraded its residential postpaid customers: 88 % of them have migrated to an Animal plan
18181818
Mobistar customers (in k customers) *Offer Split Residential Postpaid
Q4 2012 (EOP)
Animals60%
Old plans40%
Animals
Old plans
43%
57%
Q1 2013 (EOP)
� Animals represent Mobility Lifestyle with a clear focus on people and based on customer behavior
� Segmentation is the answer to individual needs as we don’t believe in ‘one size fits all’
� Our mobile tariffs are available at the best prices without any obligation to purchase multi-product ‘packs’
14%
86%
Old plans
Animals
Q2 2013 (EOP)
Best-in-class Customer Experience
ConsolidateLeadershipin Mobile
Fixed-Mobile“à la carte” convergence
12%
Old tariff plans
Animals
88%
Q3 2013 (EOP)
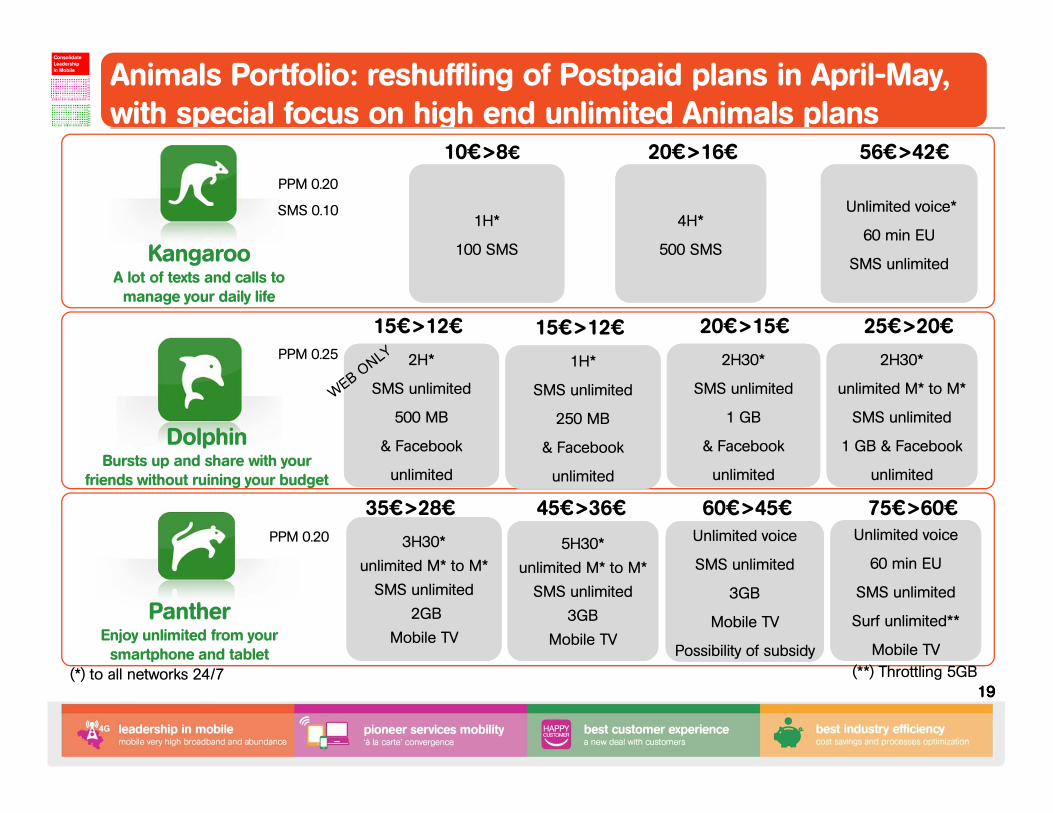
Animals Portfolio: reshuffling of Postpaid plans in April-May, with special focus on high end unlimited Animals plans
19191919
PPM 0.25
1H*
100 SMS
1H*
100 SMS
4H*
500 SMS
4H*
500 SMS
2H*
SMS unlimited
500 MB
unlimited
2H*
SMS unlimited
500 MB
unlimited
2H30*
SMS unlimited
1 GB
unlimited
2H30*
SMS unlimited
1 GB
unlimited
Unlimited voice*
60 min EU
SMS unlimited
Unlimited voice*
60 min EU
SMS unlimited
2H30*
unlimited M* to M*
SMS unlimited
1 GB & Facebook
unlimited
2H30*
unlimited M* to M*
SMS unlimited
1 GB & Facebook
unlimited
10€>8€ 20€>16€ 56€>42€
15€>12€ 20€>15€ 25€>20€
PPM 0.20 3H30*
unlimited M* to M*
SMS unlimited
2GB
Mobile TV
3H30*
unlimited M* to M*
SMS unlimited
2GB
Mobile TV
Unlimited voice
SMS unlimited
3GB
Mobile TV
Possibility of subsidy
Unlimited voice
SMS unlimited
3GB
Mobile TV
Possibility of subsidy
Unlimited voice
60 min EU
SMS unlimited
Surf unlimited**
Mobile TV
Unlimited voice
60 min EU
SMS unlimited
Surf unlimited**
Mobile TV
35€>28€ 60€>45€ 75€>60€
(**) Throttling 5GB
5H30*
unlimited M* to M*
SMS unlimited
3GB
Mobile TV
5H30*
unlimited M* to M*
SMS unlimited
3GB
Mobile TV
45€>36€
1H*
SMS unlimited
250 MB
unlimited
1H*
SMS unlimited
250 MB
unlimited
15€>12€
KangarooA lot of texts and calls to manage your daily life
DolphinBursts up and share with your
friends without ruining your budget
PantherEnjoy unlimited from your smartphone and tablet
Best-in-class Customer Experience
ConsolidateLeadershipin Mobile
Fixed-Mobile“à la carte” convergence
(*) to all networks 24/7
PPM 0.20
SMS 0.10
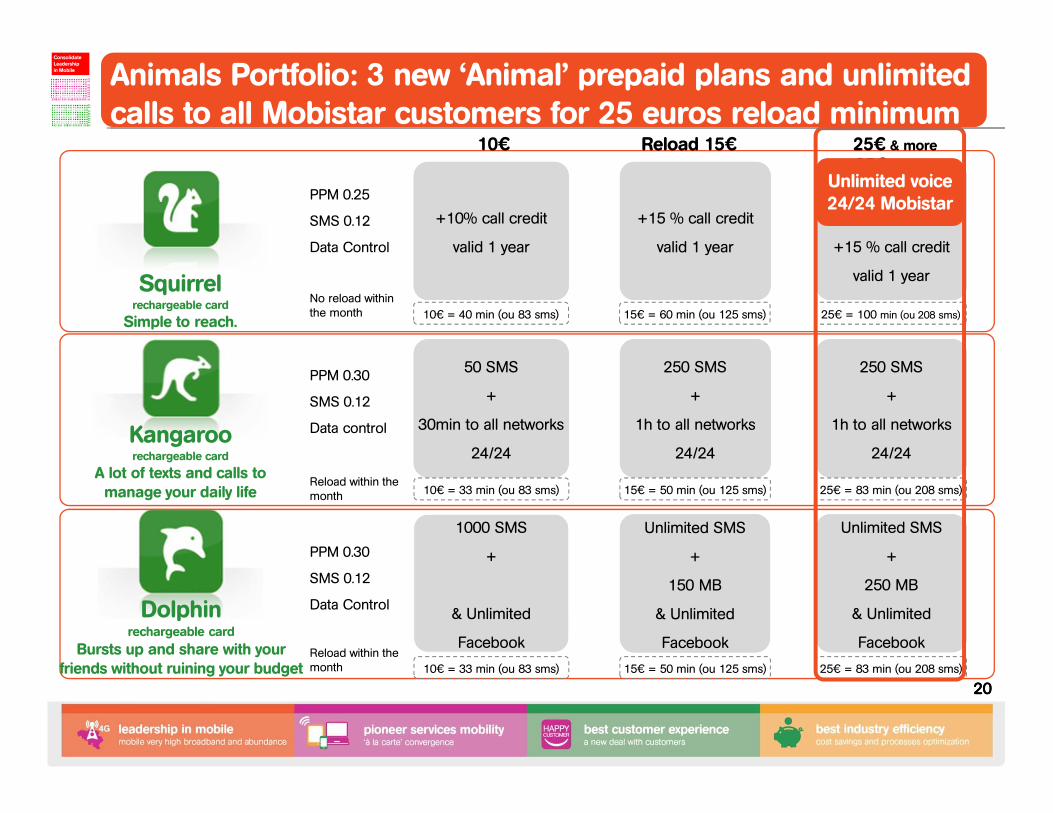
Animals Portfolio: 3 new ‘Animal’ prepaid plans and unlimited calls to all Mobistar customers for 25 euros reload minimum
20202020
25€ et plus
10€ Reload 15€
PPM 0.25
SMS 0.12
Data Control
PPM 0.30
SMS 0.12
Data Control
PPM 0.30
SMS 0.12
Data control
+10% call credit
valid 1 year
+10% call credit
valid 1 year
+15 % call credit
valid 1 year
+15 % call credit
valid 1 year
50 SMS
+
30min to all networks
24/24
50 SMS
+
30min to all networks
24/24
250 SMS
+
1h to all networks
24/24
250 SMS
+
1h to all networks
24/24
1000 SMS
+
& Unlimited
Unlimited SMS
+
150 MB
& Unlimited
Unlimited SMS
+
150 MB
& Unlimited
10€ = 33 min (ou 83 sms) 15€ = 50 min (ou 125 sms)
10€ = 33 min (ou 83 sms) 15€ = 50 min (ou 125 sms)
10€ = 40 min (ou 83 sms) 15€ = 60 min (ou 125 sms)
Squirrelrechargeable card
Simple to reach.
Kangaroorechargeable card
A lot of texts and calls to manage your daily life
+15 % call credit
valid 1 year
+15 % call credit
valid 1 year
250 SMS
+
1h to all networks
24/24
250 SMS
+
1h to all networks
24/24
Unlimited SMS
+
250 MB
& Unlimited
Unlimited SMS
+
250 MB
& Unlimited
25€ = 83 min (ou 208 sms)
25€ = 83 min (ou 208 sms)
25€ = 100 min (ou 208 sms)
Unlimited voice24/24 Mobistar
No reload within the month
Reload within the month
Reload within the month
25€ & more
Best-in-class Customer Experience
ConsolidateLeadershipin Mobile
Fixed-Mobile“à la carte” convergence
Dolphinrechargeable card
Bursts up and share with your friends without ruining your budget
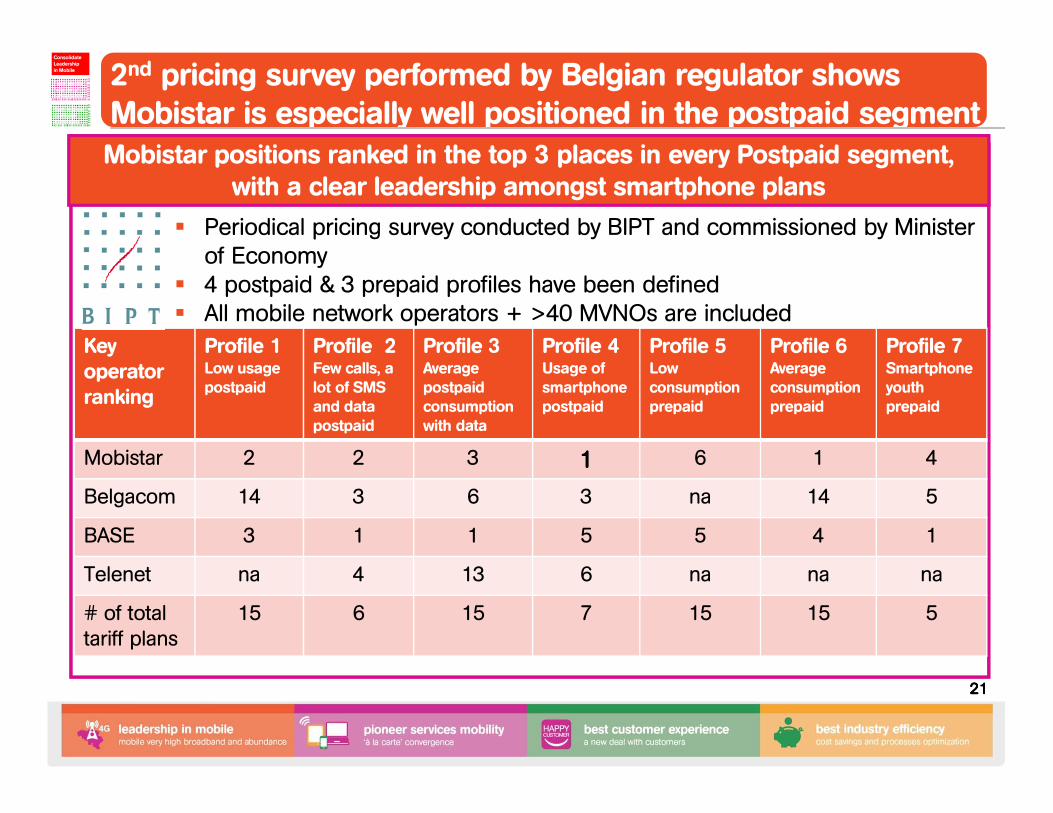
2nd pricing survey performed by Belgian regulator shows Mobistar is especially well positioned in the postpaid segment
21212121
Key operator ranking
Profile 1 Low usage postpaid
Profile 2Few calls, a lot of SMS and data postpaid
Profile 3 Average postpaid consumption with data
Profile 4 Usage of smartphone postpaid
Profile 5Low consumption prepaid
Profile 6 Average consumption prepaid
Profile 7 Smartphone youth prepaid
Mobistar 2 2 3 1111 6 1 4
Belgacom 14 3 6 3 na 14 5
BASE 3 1 1 5 5 4 1
Telenet na 4 13 6 na na na
# of total tariff plans
15 6 15 7 15 15 5
� Periodical pricing survey conducted by BIPT and commissioned by Ministerof Economy
� 4 postpaid & 3 prepaid profiles have been defined� All mobile network operators + >40 MVNOs are included
Best-in-class Customer Experience
ConsolidateLeadershipin Mobile
Fixed-Mobile“à la carte” convergence
Mobistar positions ranked in the top 3 places in every Postpaid segment,with a clear leadership amongst smartphone plans
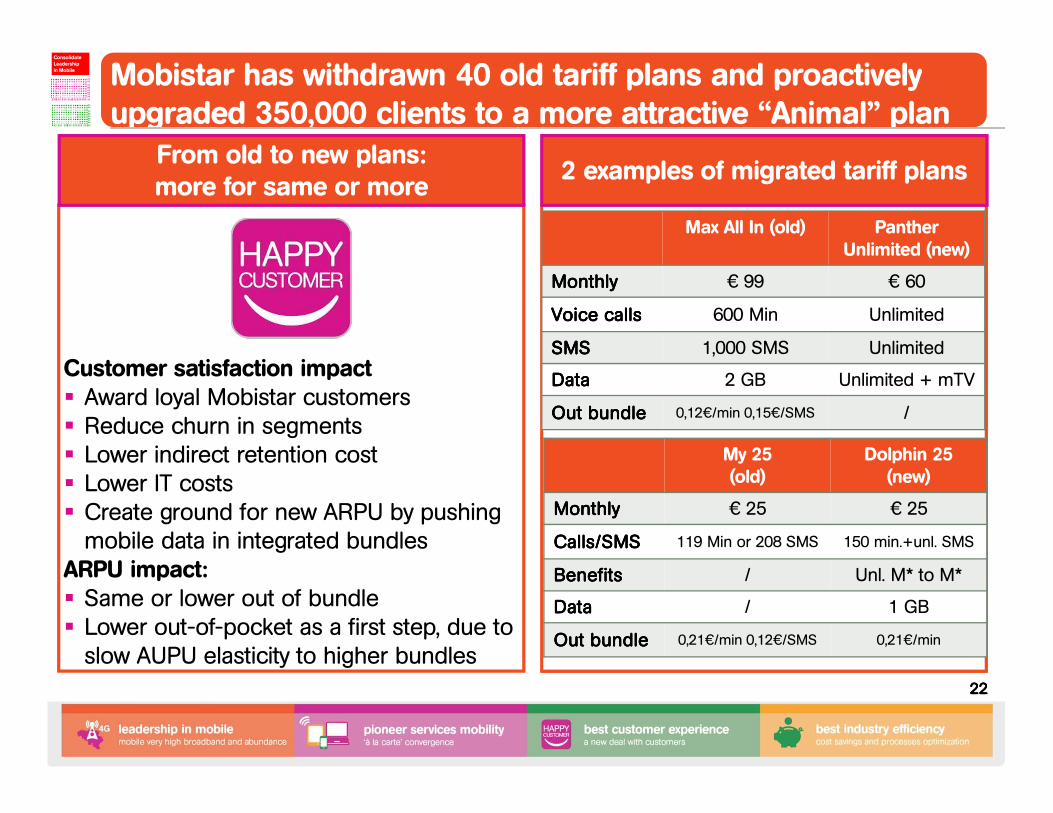
Customer satisfaction impact� Award loyal Mobistar customers� Reduce churn in segments � Lower indirect retention cost� Lower IT costs� Create ground for new ARPU by pushing
mobile data in integrated bundlesARPU impact:� Same or lower out of bundle� Lower out-of-pocket as a first step, due to
slow AUPU elasticity to higher bundles
From old to new plans:more for same or more
2 examples of migrated tariff plans
Mobistar has withdrawn 40 old tariff plans and proactively upgraded 350,000 clients to a more attractive “Animal” plan
22222222
Max All In (old) PantherUnlimited (new)
MMMMonthlyonthlyonthlyonthly € 99 € 60
Voice callsVoice callsVoice callsVoice calls 600 Min Unlimited
SMSSMSSMSSMS 1,000 SMS Unlimited
DataDataDataData 2 GB Unlimited + mTV
OutOutOutOut bundlebundlebundlebundle 0,12€/min 0,15€/SMS /
My 25(old)
Dolphin 25 (new)
MMMMonthlyonthlyonthlyonthly € 25 € 25
Calls/SMSCalls/SMSCalls/SMSCalls/SMS 119 Min or 208 SMS 150 min.+unl. SMS
BenefitsBenefitsBenefitsBenefits / Unl. M* to M*
DataDataDataData / 1 GB
OutOutOutOut bundlebundlebundlebundle 0,21€/min 0,12€/SMS 0,21€/min
Best-in-class Customer Experience
ConsolidateLeadershipin Mobile
Fixed-Mobile“à la carte” convergence
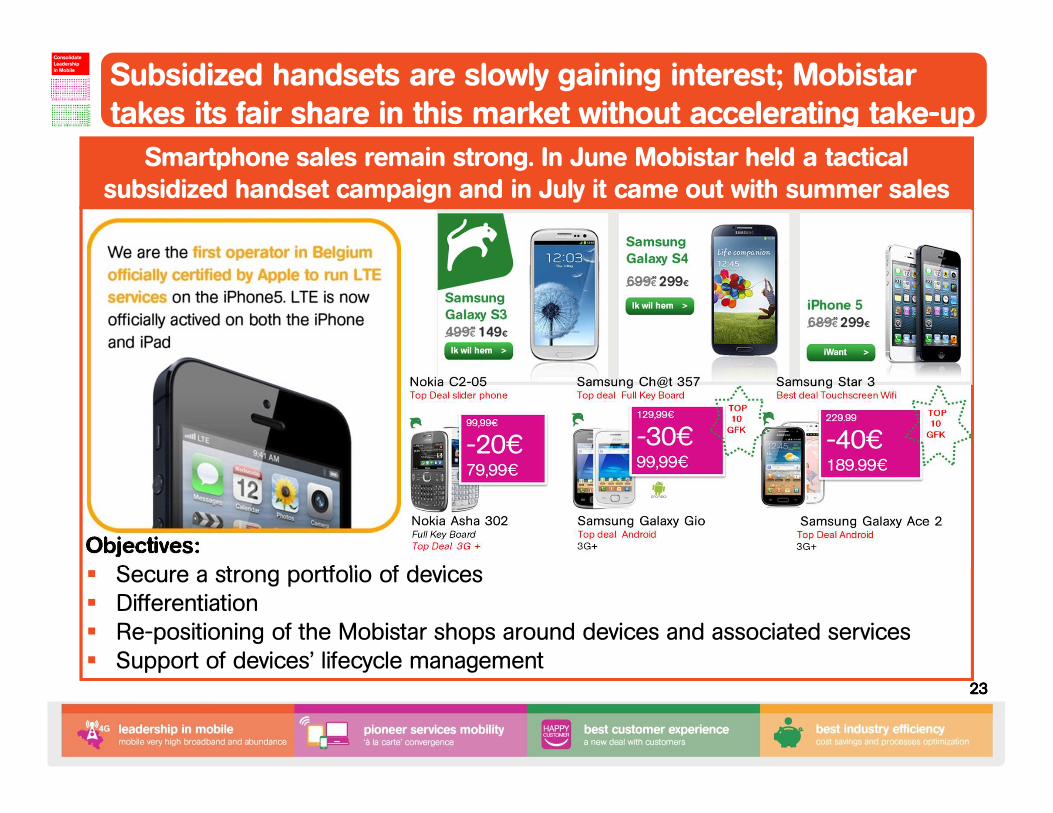
Smartphone sales remain strong. In June Mobistar held a tactical subsidized handset campaign and in July it came out with summer sales
23232323
Subsidized handsets are slowly gaining interest; Mobistartakes its fair share in this market without accelerating take-upBest-in-class
Customer Experience
ConsolidateLeadershipin Mobile
Fixed-Mobile“à la carte” convergence
Objectives:� Secure a strong portfolio of devices � Differentiation � Re-positioning of the Mobistar shops around devices and associated services � Support of devices’ lifecycle management
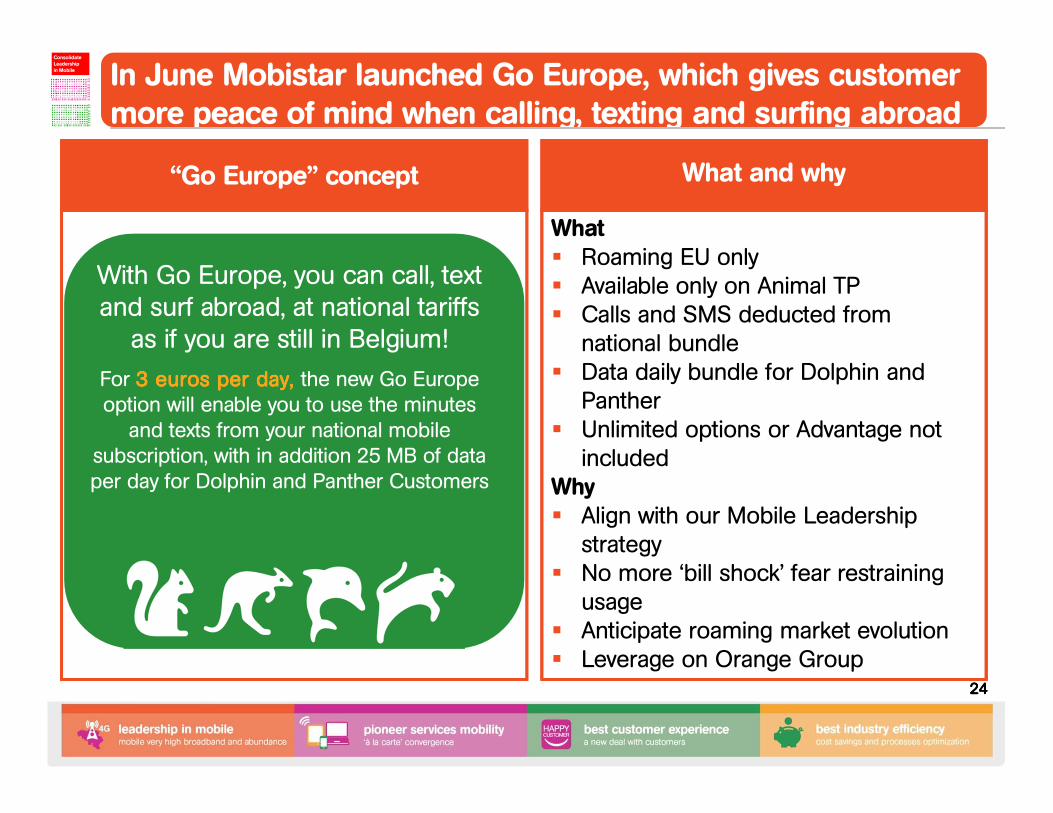
What � Roaming EU only� Available only on Animal TP� Calls and SMS deducted from
national bundle� Data daily bundle for Dolphin and
Panther� Unlimited options or Advantage not
includedWhy� Align with our Mobile Leadership
strategy� No more ‘bill shock’ fear restraining
usage� Anticipate roaming market evolution � Leverage on Orange Group
In June Mobistar launched Go Europe, which gives customer more peace of mind when calling, texting and surfing abroad
24242424
With Go Europe, you can call, text and surf abroad, at national tariffs
as if you are still in Belgium!
For 3 euros per 3 euros per 3 euros per 3 euros per day, day, day, day, the new Go Europe option will enable you to use the minutes
and texts from your national mobile subscription, with in addition 25 MB of data per day for Dolphin and Panther Customers
Best-in-class Customer Experience
ConsolidateLeadershipin Mobile
Fixed-Mobile“à la carte” convergence
What and why“Go Europe” concept
25252525
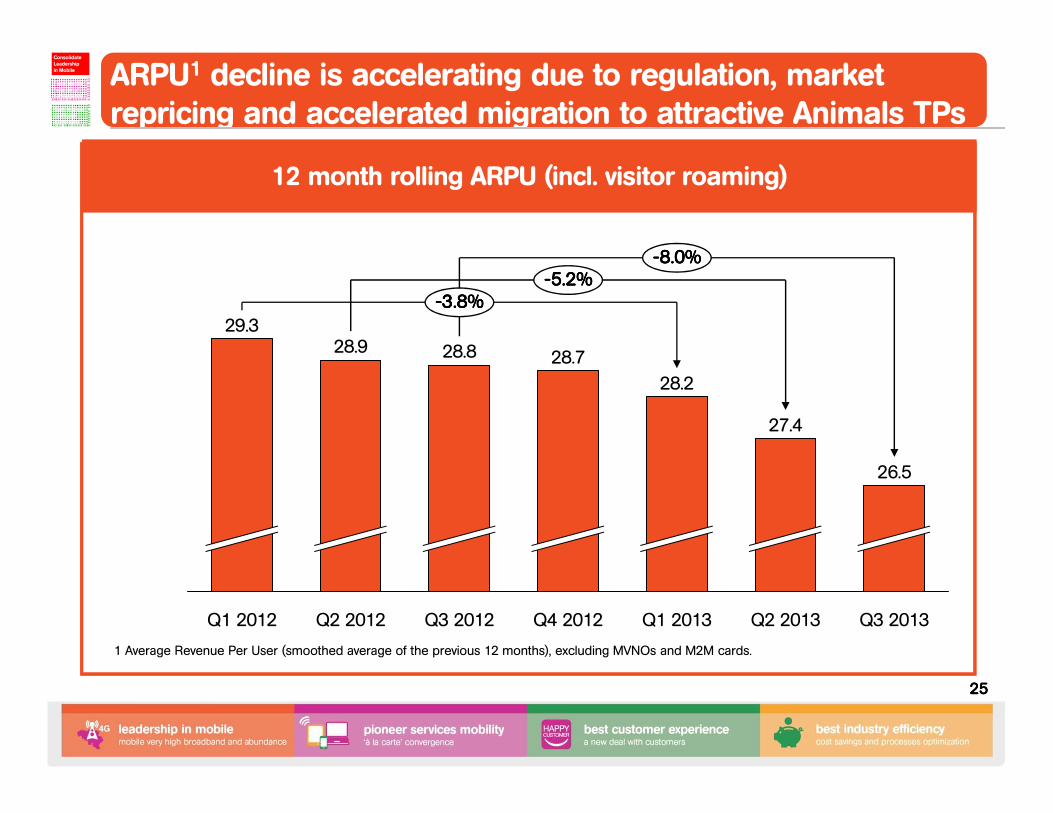
----8.0%8.0%8.0%8.0%
Q3 2013
26.5
Q2 2013
27.4
Q1 2013
28.2
Q4 2012
28.7
Q3 2012
28.8
Q2 2012
28.9
Q1 2012
----5.2%5.2%5.2%5.2%
29.3
----3.8%3.8%3.8%3.8%
ARPU1 decline is accelerating due to regulation, market repricing and accelerated migration to attractive Animals TPsBest-in-class
Customer Experience
ConsolidateLeadershipin Mobile
Fixed-Mobile“à la carte” convergence
1 Average Revenue Per User (smoothed average of the previous 12 months), excluding MVNOs and M2M cards.
12 month rolling ARPU (incl. visitor roaming)
26262626
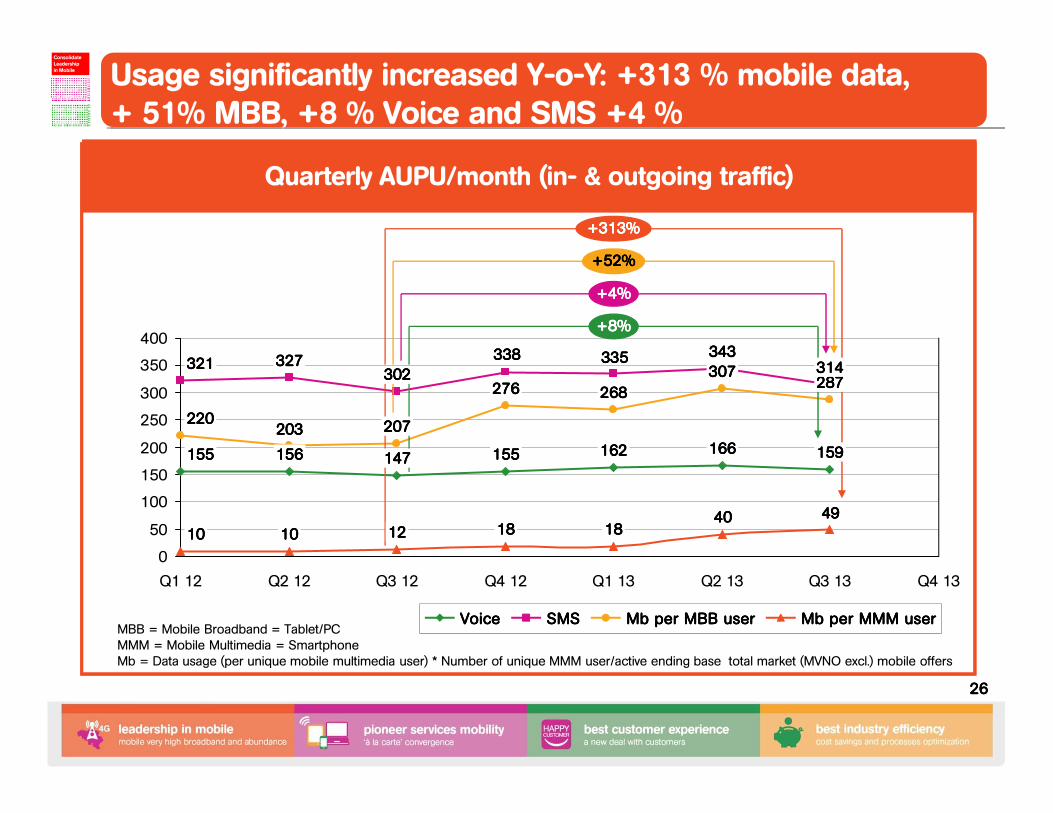
147147147147
343343343343335335335335338338338338302302302302
203203203203
4949494940404040
0
50
100
150
200
250
300
350
400
327327327327
156156156156
Q1 12
10101010
220220220220
321321321321
155155155155
Q4 13Q2 12
10101010
+8%+8%+8%+8%
+52%+52%+52%+52%
+4%+4%+4%+4%
+313%+313%+313%+313%
Q3 13
287287287287314314314314
159159159159
Q2 13
307307307307
166166166166
Q1 13
18181818
268268268268
162162162162
Q4 12
18181818
276276276276
155155155155
Q3 12
12121212
207207207207
SMSSMSSMSSMSVoiceVoiceVoiceVoice Mb per MBB userMb per MBB userMb per MBB userMb per MBB user Mb per MMM userMb per MMM userMb per MMM userMb per MMM user
Quarterly AUPU/month (in- & outgoing traffic)
MBB = Mobile Broadband = Tablet/PCMMM = Mobile Multimedia = SmartphoneMb = Data usage (per unique mobile multimedia user) * Number of unique MMM user/active ending base total market (MVNO excl.) mobile offers
Usage significantly increased Y-o-Y: +313 % mobile data, + 51% MBB, +8 % Voice and SMS +4 %Best-in-class
Customer Experience
ConsolidateLeadershipin Mobile
Fixed-Mobile“à la carte” convergence
27272727
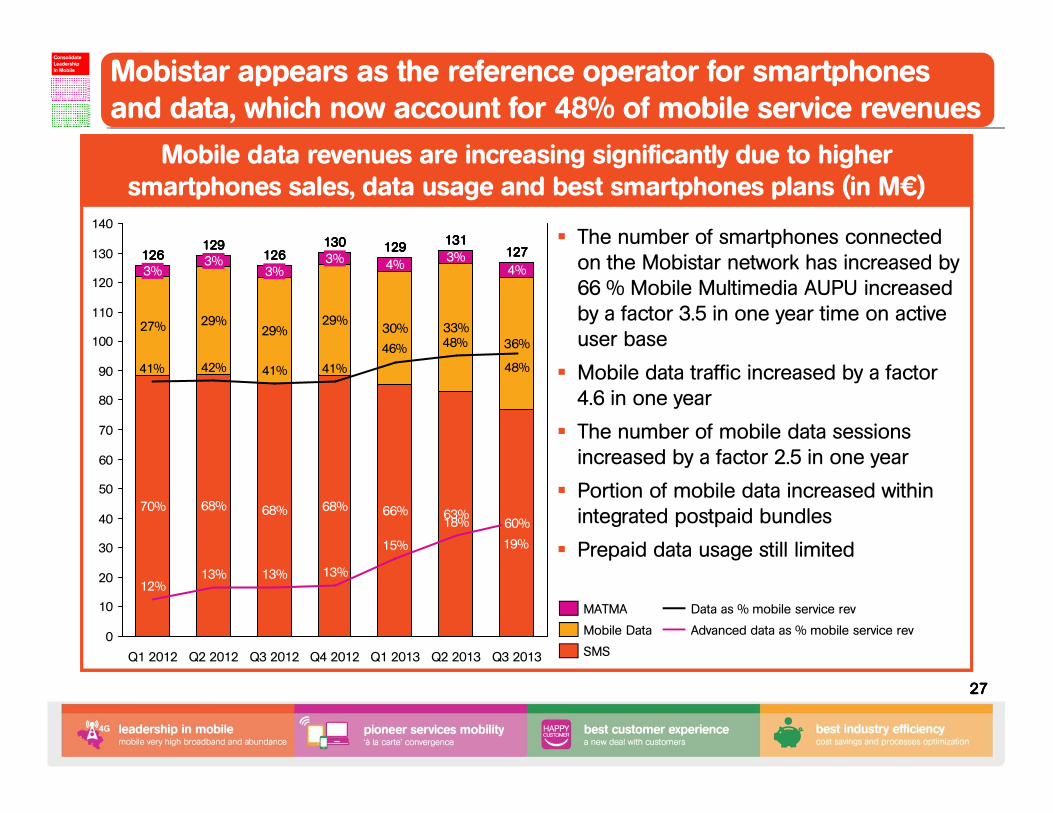
Mobile data revenues are increasing significantly due to higher smartphones sales, data usage and best smartphones plans (in M€)
48%46%
41%41%42%41% 48%
0
10
20
30
40
50
60
70
80
90
100
110
120
130
140
60%
36%
4%
Q2 2013
131131131131
18%63%
33%
3%
Q1 2013
129129129129
15%
66%
30%
4%
Q4 2012
130130130130
13%
68%
29%
3%
Q3 2013
127127127127
19%
Q3 2012
126126126126
13%
68%
29%
3%
Q2 2012
129129129129
13%
68%
29%
3%
Q1 2012
126126126126
12%
70%
27%
3%
Advanced data as % mobile service rev
Data as % mobile service rev
SMS
Mobile Data
MATMA
� The number of smartphones connected on the Mobistar network has increased by 66 % Mobile Multimedia AUPU increased by a factor 3.5 in one year time on active user base
� Mobile data traffic increased by a factor 4.6 in one year
� The number of mobile data sessions increased by a factor 2.5 in one year
� Portion of mobile data increased within integrated postpaid bundles
� Prepaid data usage still limited
Best-in-class Customer Experience
ConsolidateLeadershipin Mobile
Fixed-Mobile“à la carte” convergence
Mobistar appears as the reference operator for smartphonesand data, which now account for 48% of mobile service revenues
28282828
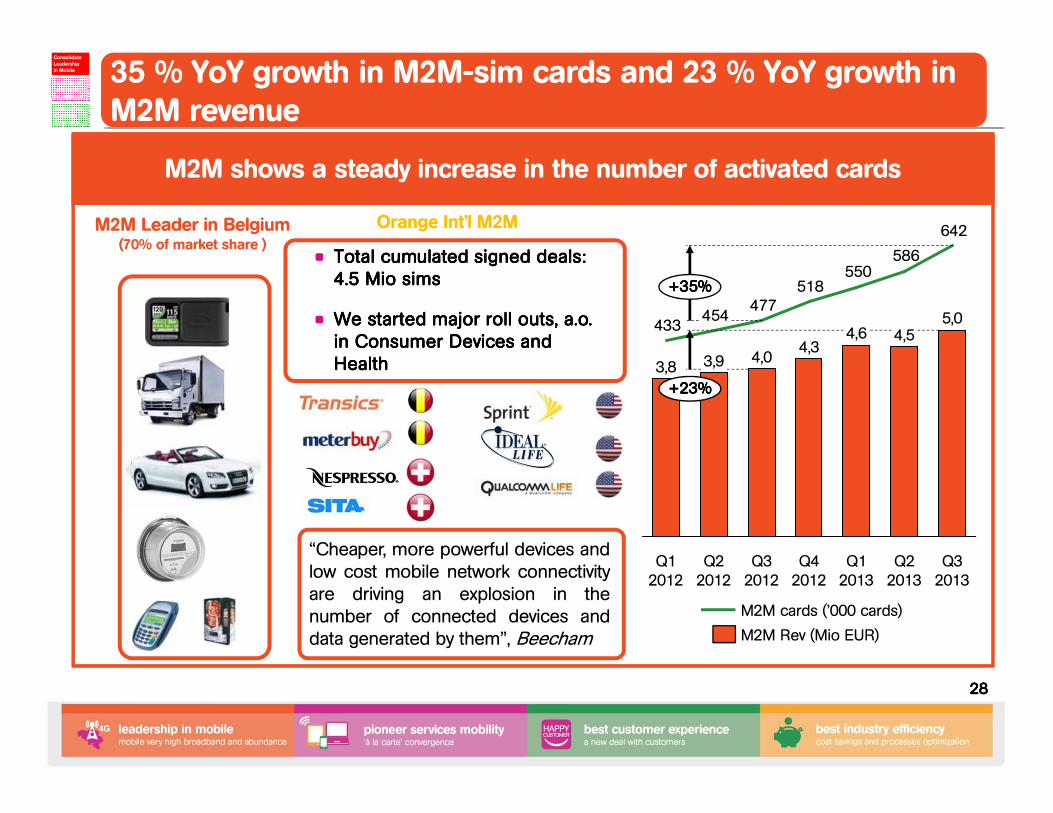
M2M Leader in Belgium (70% of market share )
Orange Int’l M2M
• Total cumulated signed deals: Total cumulated signed deals: Total cumulated signed deals: Total cumulated signed deals: 4.5 Mio 4.5 Mio 4.5 Mio 4.5 Mio simssimssimssims
• We started major roll outs, We started major roll outs, We started major roll outs, We started major roll outs, a.o.a.o.a.o.a.o.in Consumer Devices and in Consumer Devices and in Consumer Devices and in Consumer Devices and HealthHealthHealthHealth
“Cheaper, more powerful devices andlow cost mobile network connectivityare driving an explosion in thenumber of connected devices anddata generated by them”, Beecham
642
586550
518477
454433
+35%+35%+35%+35%
+23%+23%+23%+23%
Q3 2013
5,0
Q2 2013
4,5
Q1 2013
4,6
Q4 2012
4,3
Q3 2012
4,0
Q2 2012
3,9
Q1 2012
3,8
M2M Rev (Mio EUR)
M2M cards (’000 cards)
M2M shows a steady increase in the number of activated cards
35 % YoY growth in M2M-sim cards and 23 % YoY growth in M2M revenueBest-in-class
Customer Experience
ConsolidateLeadershipin Mobile
Fixed-Mobile“à la carte” convergence
29292929
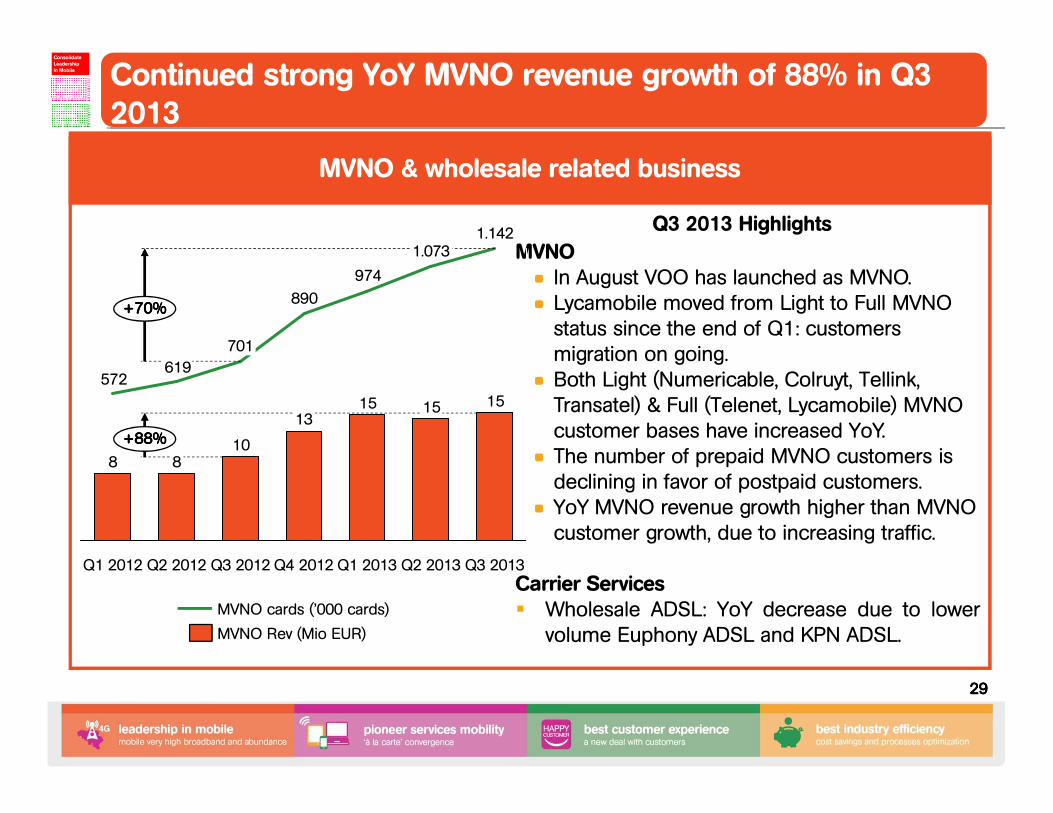
MVNO & wholesale related business
MVNO• In August VOO has launched as MVNO.• Lycamobile moved from Light to Full MVNO
status since the end of Q1: customers migration on going.
• Both Light (Numericable, Colruyt, Tellink, Transatel) & Full (Telenet, Lycamobile) MVNO customer bases have increased YoY.
• The number of prepaid MVNO customers is declining in favor of postpaid customers.
• YoY MVNO revenue growth higher than MVNO customer growth, due to increasing traffic.
Carrier Services� Wholesale ADSL: YoY decrease due to lower
volume Euphony ADSL and KPN ADSL.
151513
1088
15
974
890
619572
+70%+70%+70%+70%
+88%+88%+88%+88%
Q3 2013
1.142
Q2 2013
1.073
Q1 2013Q4 2012Q3 2012
701
Q2 2012Q1 2012
MVNO cards (’000 cards)
MVNO Rev (Mio EUR)
Q3 2013 Highlights
Continued strong YoY MVNO revenue growth of 88% in Q3 2013Best-in-class
Customer Experience
ConsolidateLeadershipin Mobile
Fixed-Mobile“à la carte” convergence

30303030
ACE
Distribution
Network
Spectrum
MTR & Roaming
Regulation
TOPICS IN THE SPOTLIGHT
in 2H 2012
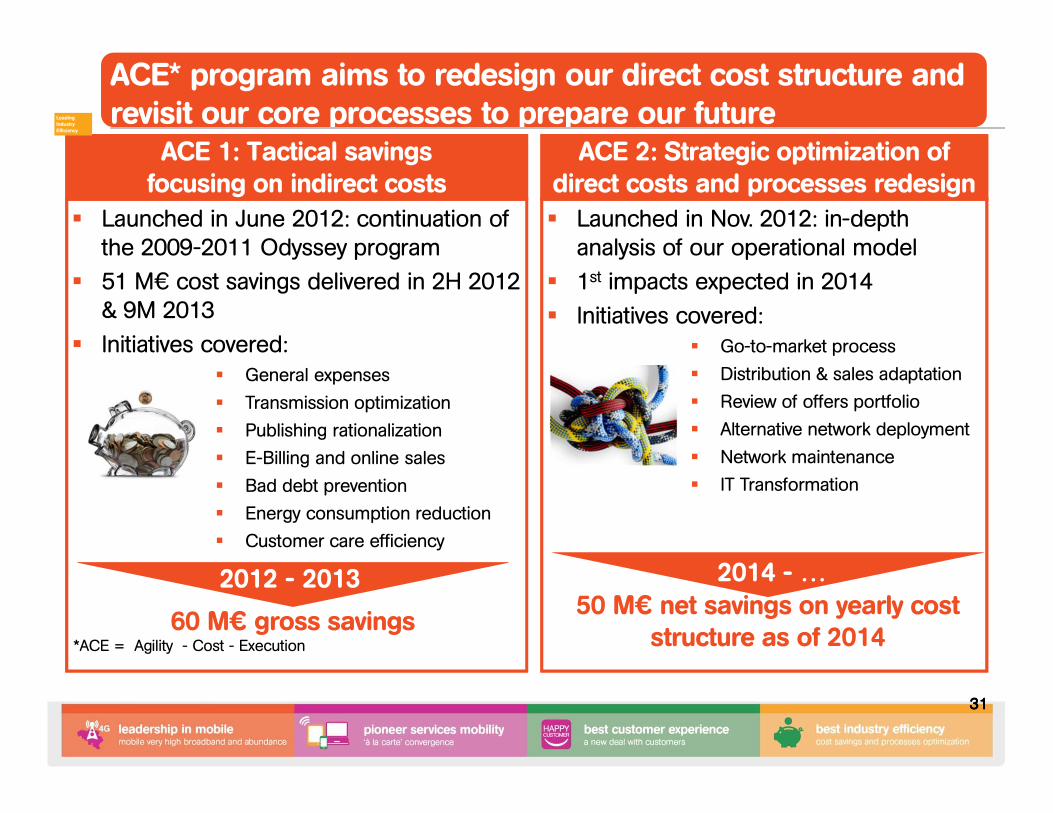
� Launched in June 2012: continuation of the 2009-2011 Odyssey program
� 51 M€ cost savings delivered in 2H 2012 & 9M 2013
� Initiatives covered:� General expenses
� Transmission optimization
� Publishing rationalization
� E-Billing and online sales
� Bad debt prevention
� Energy consumption reduction
� Customer care efficiency
31313131
� Launched in Nov. 2012: in-depth analysis of our operational model
� 1st impacts expected in 2014
� Initiatives covered:� Go-to-market process
� Distribution & sales adaptation
� Review of offers portfolio
� Alternative network deployment
� Network maintenance
� IT Transformation
direct costs and processes redesign ACE 2: Strategic optimization of
direct costs and processes redesign
2012-201350 M€ net savings on yearly cost
structure as of 201450 M€ net savings on yearly cost
structure as of 2014
2014 - …
focusing on indirect costs ACE 1: Tactical savingsfocusing on indirect costs
60 M€ gross savings60 M€ gross savings
2012 - 2013
*ACE = Agility - Cost - Execution
ACE* program aims to redesign our direct cost structure and revisit our core processes to prepare our futureLeading
Industry Efficiency
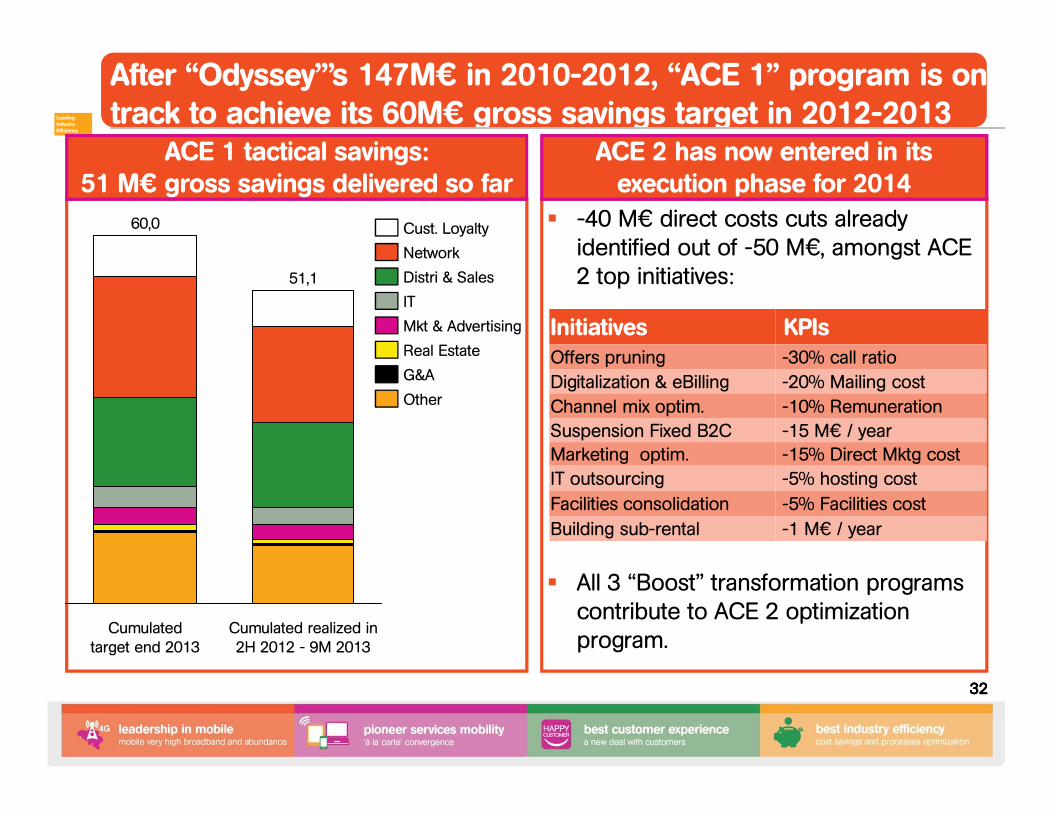
� -40 M€ direct costs cuts already identified out of -50 M€, amongst ACE 2 top initiatives:
� All 3 “Boost” transformation programs contribute to ACE 2 optimization program.
execution phase for 2014ACE 2 has now entered in its execution phase for 2014
32323232
After “Odyssey”’s 147M€ in 2010-2012, “ACE 1” program is on track to achieve its 60M€ gross savings target in 2012-2013Leading
Industry Efficiency
51 M€ gross savings delivered so farACE 1 tactical savings:
51 M€ gross savings delivered so far
Initiatives KPIsOffers pruning -30% call ratio
Digitalization & eBilling -20% Mailing cost
Channel mix optim. -10% Remuneration
Suspension Fixed B2C -15 M€ / yearMarketing optim. -15% Direct Mktg cost
IT outsourcing -5% hosting cost
Facilities consolidation -5% Facilities cost
Building sub-rental -1 M€ / year
Cumulated target end 2013
60,0
Cumulated realized in 2H 2012 - 9M 2013
51,1
Mkt & Advertising
Other
IT
Real Estate
Network
Cust. Loyalty
Distri & Sales
G&A
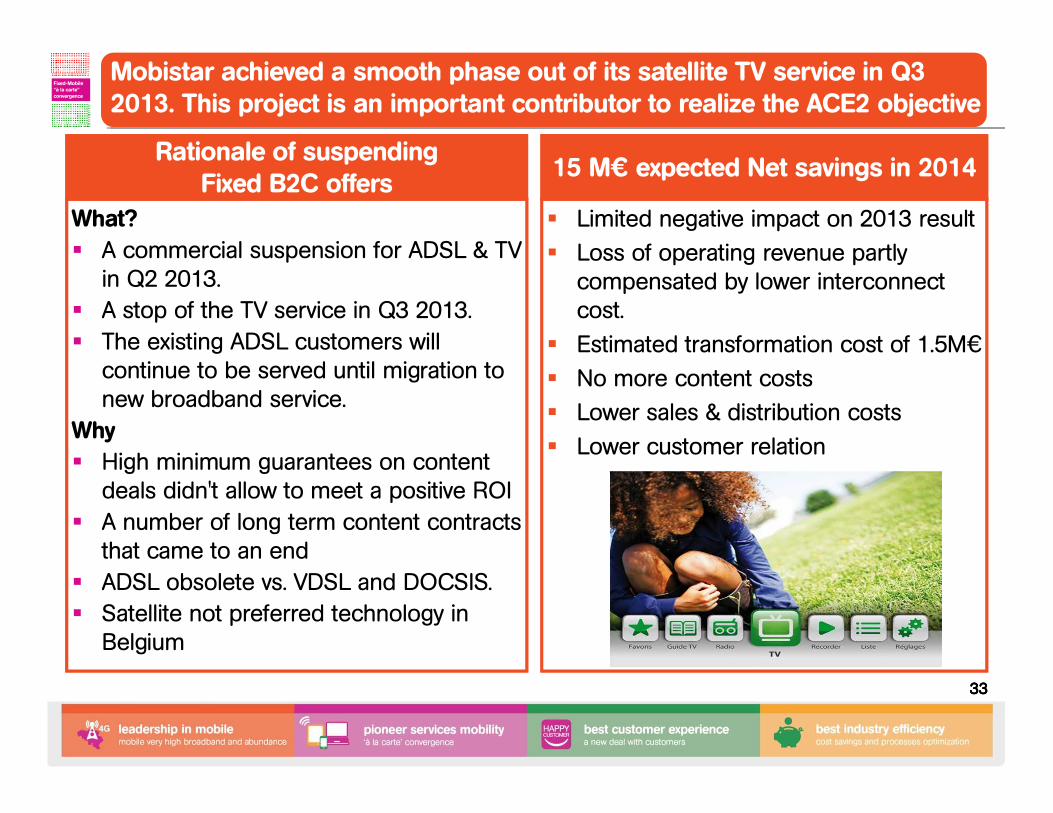
� Limited negative impact on 2013 result
� Loss of operating revenue partly compensated by lower interconnect cost.
� Estimated transformation cost of 1.5M€
� No more content costs
� Lower sales & distribution costs
� Lower customer relation
15 M€ expected Net savings in 2014
A commercial suspension for ADSL & TV
content contracts
What?
� A commercial suspension for ADSL & TV in Q2 2013.
� A stop of the TV service in Q3 2013.
� The existing ADSL customers will continue to be served until migration to new broadband service.
Why
� High minimum guarantees on content deals didn't allow to meet a positive ROI
� A number of long term content contracts that came to an end
� ADSL obsolete vs. VDSL and DOCSIS.
� Satellite not preferred technology in Belgium
Fixed B2C offers Rationale of suspending
Fixed B2C offers
33333333
Mobistar achieved a smooth phase out of its satellite TV service in Q3 2013. This project is an important contributor to realize the ACE2 objectiveBest-in-class
Customer Experience
ConsolidateLeadershipin Mobile
Fixed-Mobile“à la carte” convergence
34343434
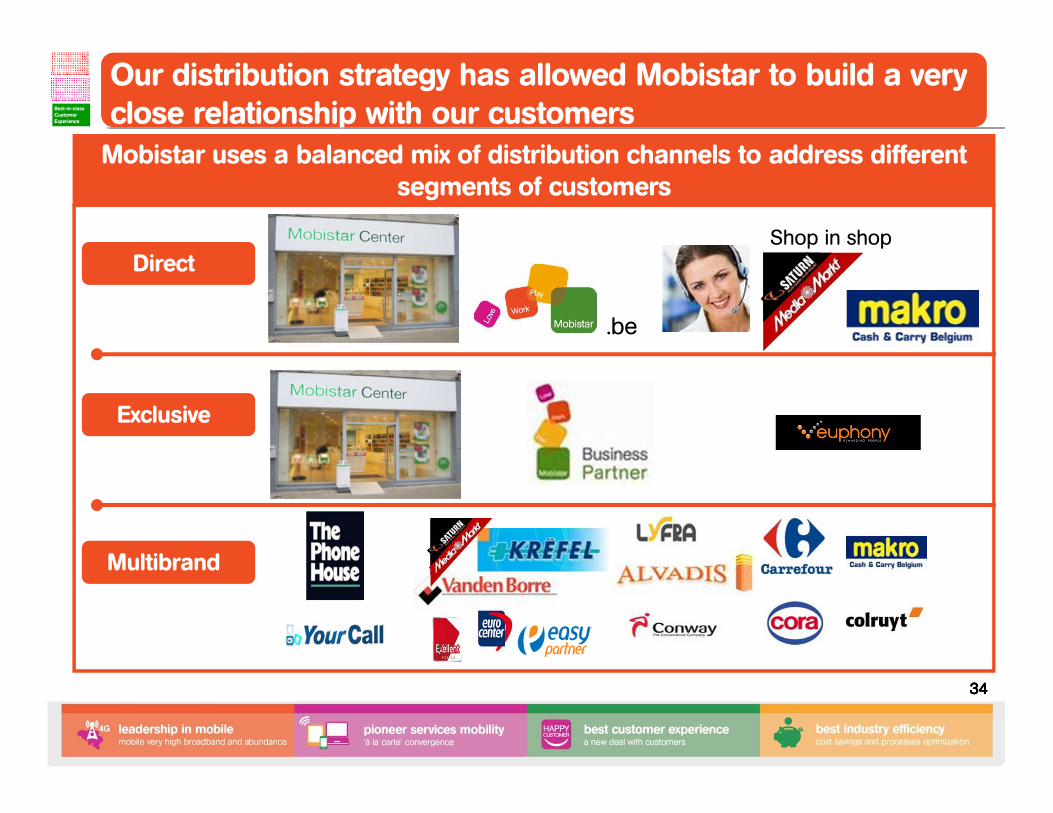
.be
Shop in shopDirect
Exclusive
Multibrand
Mobistar uses a balanced mix of distribution channels to address different segments of customers
Our distribution strategy has allowed Mobistar to build a very close relationship with our customers Best-in-class
Customer Experience
ConsolidateLeadershipin Mobile
Fixed-Mobile“à la carte” convergence
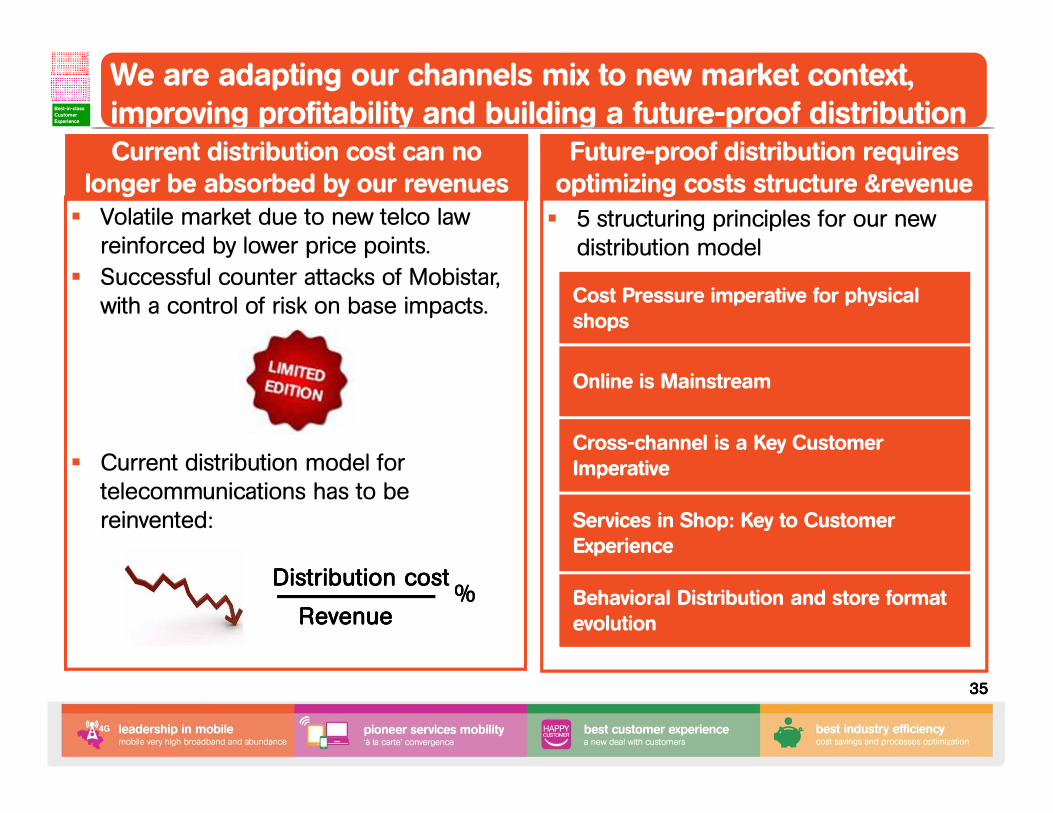
optimizing costs structure &revenueFuture-proof distribution requires optimizing costs structure &revenue
35353535
We are adapting our channels mix to new market context, improving profitability and building a future-proof distributionBest-in-class
Customer Experience
ConsolidateLeadershipin Mobile
Fixed-Mobile“à la carte” convergence
� 5 structuring principles for our new distribution model
� Volatile market due to new telco law reinforced by lower price points.
� Successful counter attacks of Mobistar, with a control of risk on base impacts.
� Current distribution model for telecommunications has to be reinvented:
longer be absorbed by our revenuesCurrent distribution cost can no
longer be absorbed by our revenues
Distribution Distribution Distribution Distribution costcostcostcost
RevenueRevenueRevenueRevenue%%%%
Cost Pressure imperative for physical shops
Online is Mainstream
Cross-channel is a Key Customer Imperative
Services in Shop: Key to Customer Experience
Behavioral Distribution and store format evolution
36363636
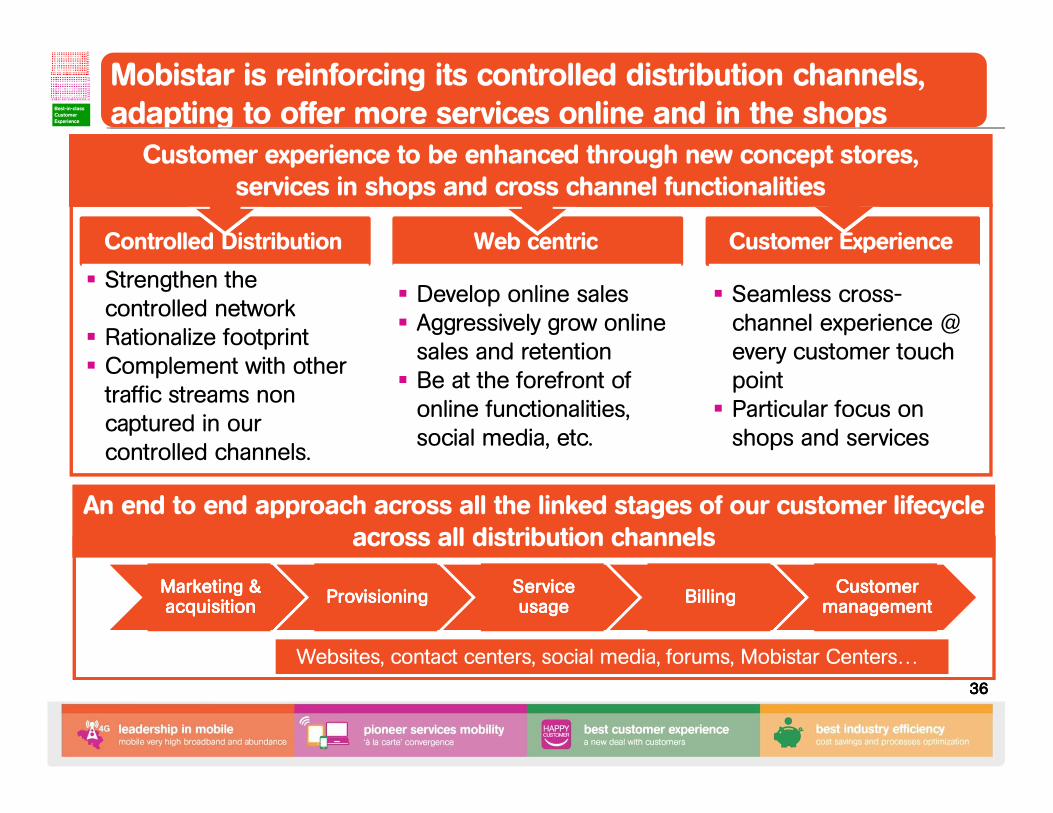
Web centricControlled Distribution Customer Experience
� Strengthen the controlled network
� Rationalize footprint� Complement with other
traffic streams non captured in our controlled channels.
� Strengthen the controlled network
� Rationalize footprint� Complement with other
traffic streams non captured in our controlled channels.
� Develop online sales� Aggressively grow online
sales and retention� Be at the forefront of
online functionalities, social media, etc.
� Develop online sales� Aggressively grow online
sales and retention� Be at the forefront of
online functionalities, social media, etc.
� Seamless cross-channel experience @ every customer touch point
� Particular focus on shops and services
� Seamless cross-channel experience @ every customer touch point
� Particular focus on shops and services
Mobistar is reinforcing its controlled distribution channels, adapting to offer more services online and in the shopsBest-in-class
Customer Experience
ConsolidateLeadershipin Mobile
Fixed-Mobile“à la carte” convergence
Customer experience to be enhanced through new concept stores, services in shops and cross channel functionalities
An end to end approach across all the linked stages of our customer lifecycle across all distribution channels
Marketing & Marketing & Marketing & Marketing & acquisitionacquisitionacquisitionacquisition
Marketing & Marketing & Marketing & Marketing & acquisitionacquisitionacquisitionacquisition
ProvisioningProvisioningProvisioningProvisioningProvisioningProvisioningProvisioningProvisioningService Service Service Service usageusageusageusage
Service Service Service Service usageusageusageusage
BillingBillingBillingBillingBillingBillingBillingBillingCustomer Customer Customer Customer
managementmanagementmanagementmanagementCustomer Customer Customer Customer
managementmanagementmanagementmanagement
Websites, contact centers, social media, forums, Mobistar Centers…
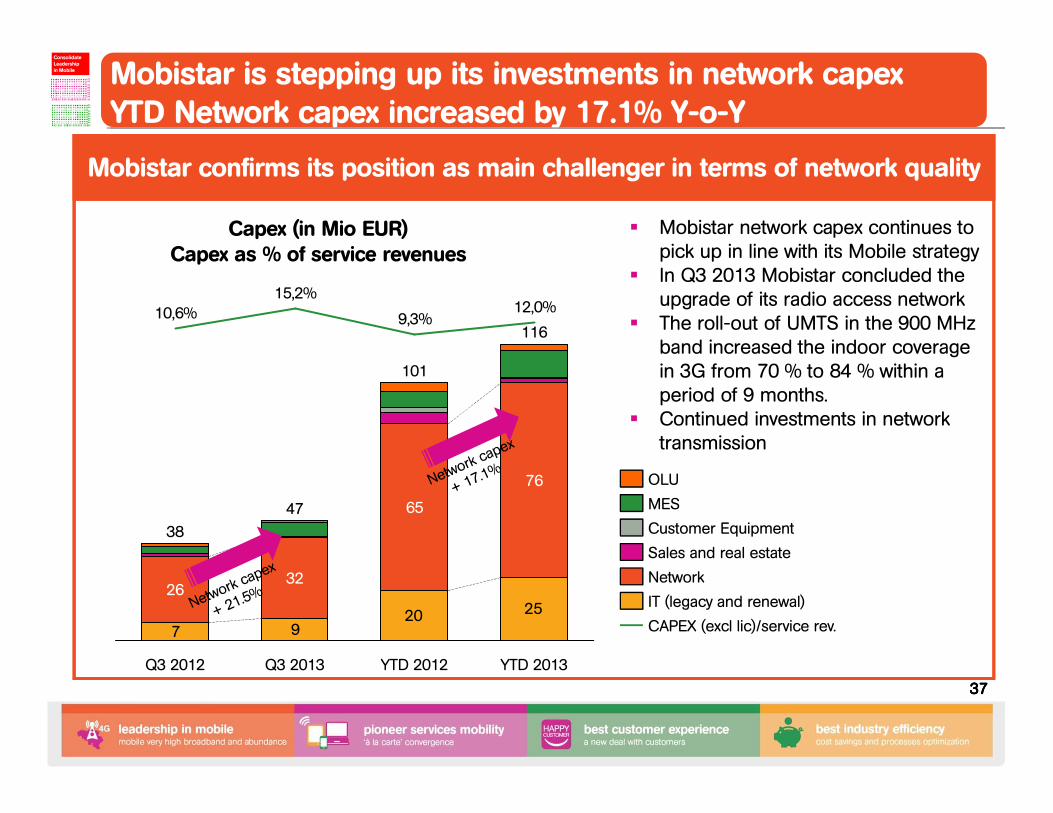
Capex (in Mio EUR) Capex as % of service revenues
Mobistar confirms its position as main challenger in terms of network quality
37373737
20 25
97
12,0%
116
YTD 2013
101
9,3%
76
Q3 2013
47
15,2%
YTD 2012
65
3226
38
Q3 2012
10,6%
Customer Equipment
CAPEX (excl lic)/service rev.
Network
Sales and real estate
OLU
MES
IT (legacy and renewal)
� Mobistar network capex continues to pick up in line with its Mobile strategy
� In Q3 2013 Mobistar concluded the upgrade of its radio access network
� The roll-out of UMTS in the 900 MHz band increased the indoor coverage in 3G from 70 % to 84 % within a period of 9 months.
� Continued investments in network transmission
Mobistar is stepping up its investments in network capexYTD Network capex increased by 17.1% Y-o-YBest-in-class
Customer Experience
ConsolidateLeadershipin Mobile
Fixed-Mobile“à la carte” convergence
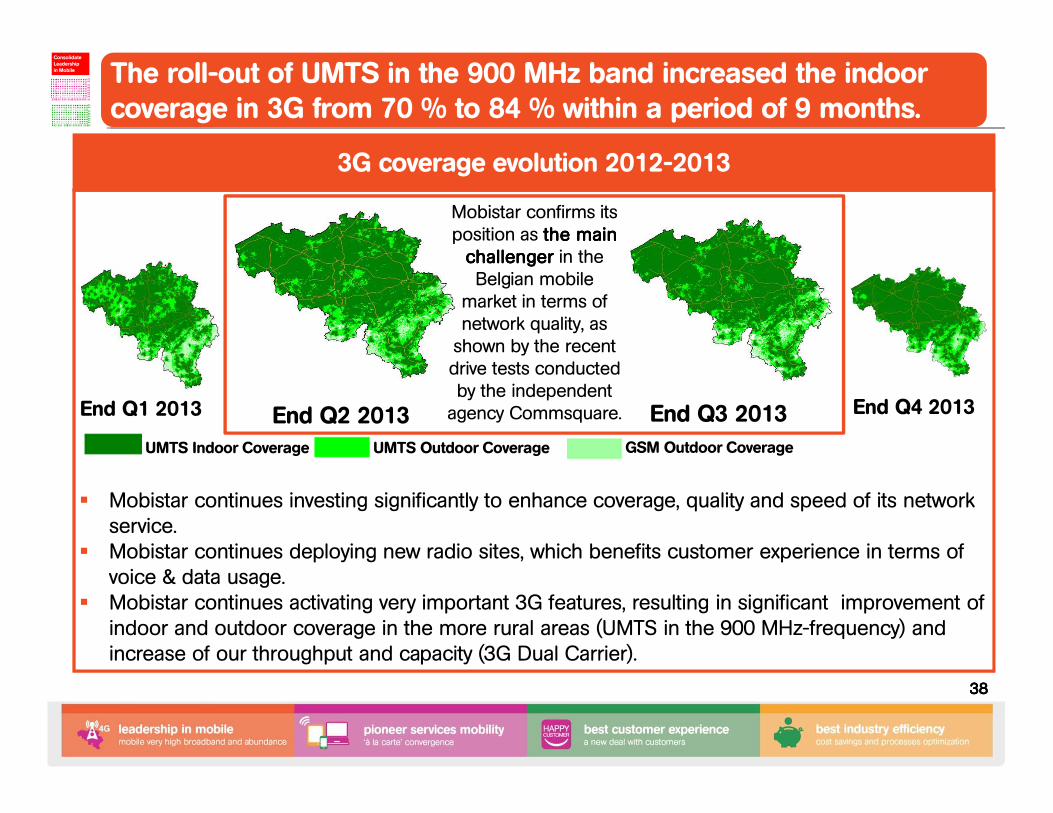
� Mobistar continues investing significantly to enhance coverage, quality and speed of its network service.
� Mobistar continues deploying new radio sites, which benefits customer experience in terms of voice & data usage.
� Mobistar continues activating very important 3G features, resulting in significant improvement of indoor and outdoor coverage in the more rural areas (UMTS in the 900 MHz-frequency) and increase of our throughput and capacity (3G Dual Carrier).
38383838
UMTS Indoor Coverage UMTS Outdoor Coverage GSM Outdoor Coverage
End Q2 2013
3G coverage evolution 2012-2013
End Q3 2013
Mobistar confirms its position as the main the main the main the main
challengerchallengerchallengerchallenger in the Belgian mobile
market in terms of network quality, as
shown by the recent drive tests conducted
by the independent agency Commsquare.
The roll-out of UMTS in the 900 MHz band increased the indoor coverage in 3G from 70 % to 84 % within a period of 9 months.
End Q1 2013 End Q4 2013
Best-in-class Customer Experience
ConsolidateLeadershipin Mobile
Fixed-Mobile“à la carte” convergence
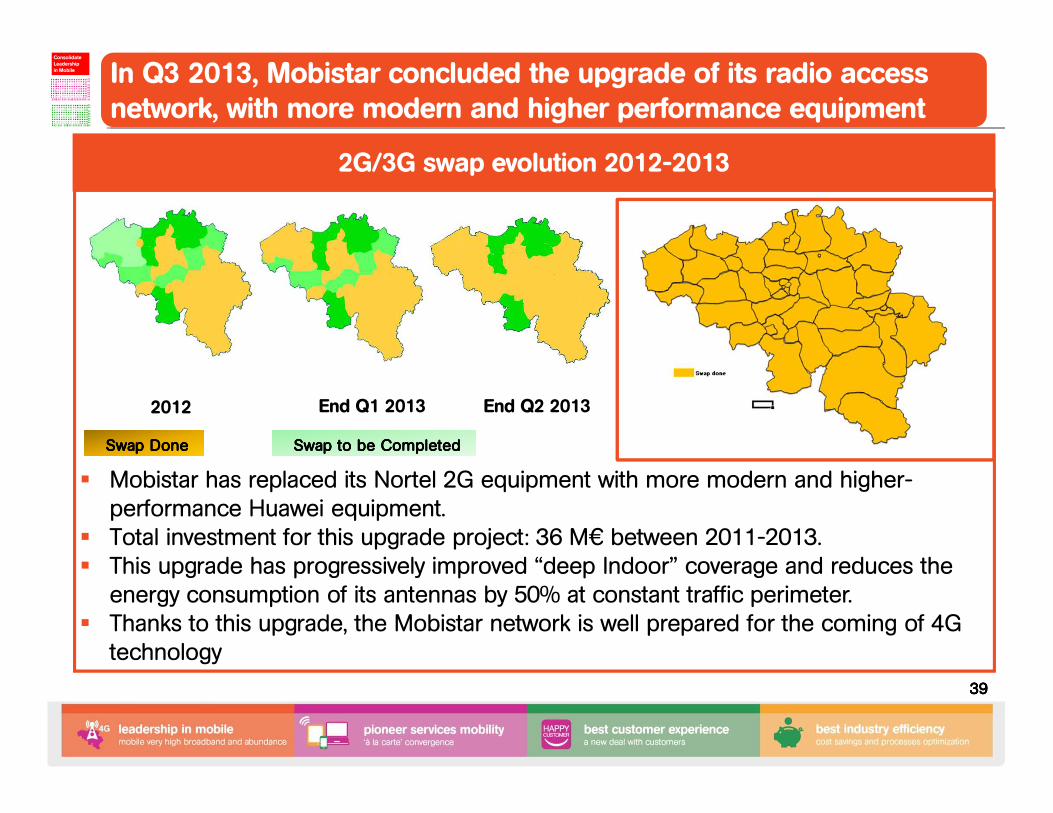
� Mobistar has replaced its Nortel 2G equipment with more modern and higher-performance Huawei equipment.
� Total investment for this upgrade project: 36 M€ between 2011-2013.� This upgrade has progressively improved “deep Indoor” coverage and reduces the
energy consumption of its antennas by 50% at constant traffic perimeter.� Thanks to this upgrade, the Mobistar network is well prepared for the coming of 4G
technology
39393939
2G/3G swap evolution 2012-2013
In Q3 2013, Mobistar concluded the upgrade of its radio access network, with more modern and higher performance equipment
SwapSwapSwapSwap DoneDoneDoneDone SwapSwapSwapSwap to be Completedto be Completedto be Completedto be Completed
2012 End Q1 2013 End Q2 2013
Best-in-class Customer Experience
ConsolidateLeadershipin Mobile
Fixed-Mobile“à la carte” convergence
40404040
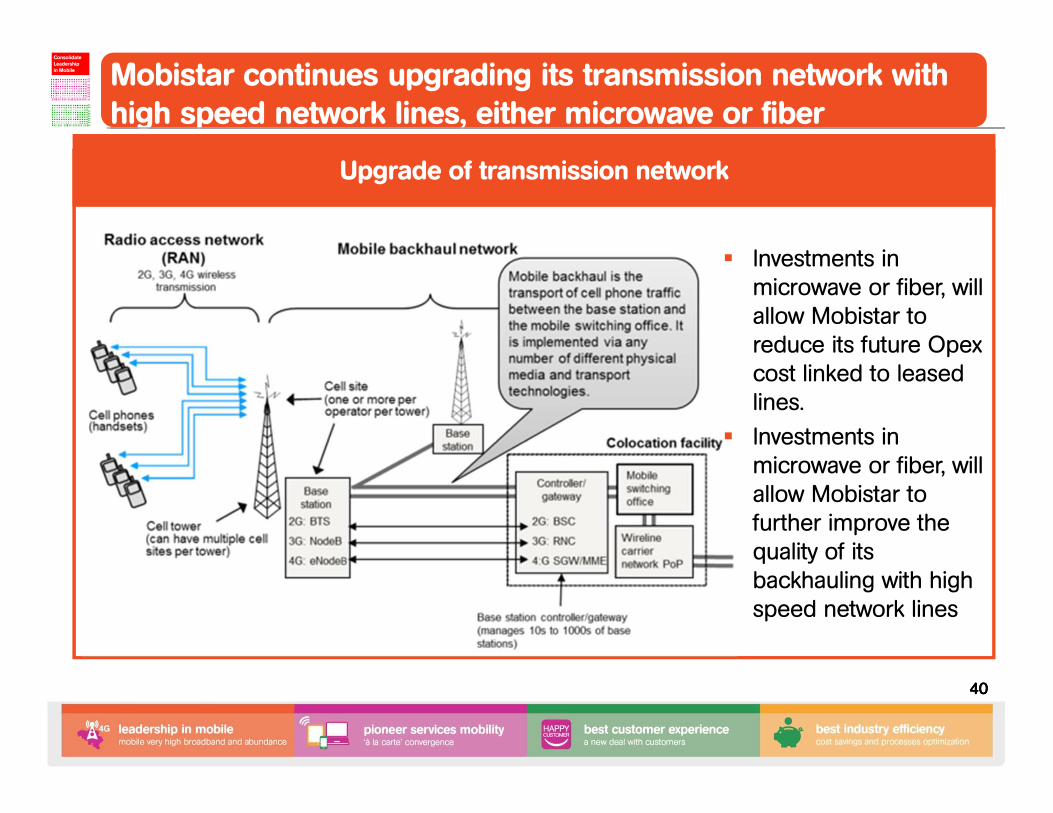
Upgrade of transmission network
� Investments in microwave or fiber, will allow Mobistar to reduce its future Opexcost linked to leased lines.
� Investments in microwave or fiber, will allow Mobistar to further improve the quality of its backhauling with high speed network lines
Mobistar continues upgrading its transmission network with high speed network lines, either microwave or fiberBest-in-class
Customer Experience
ConsolidateLeadershipin Mobile
Fixed-Mobile“à la carte” convergence
41414141
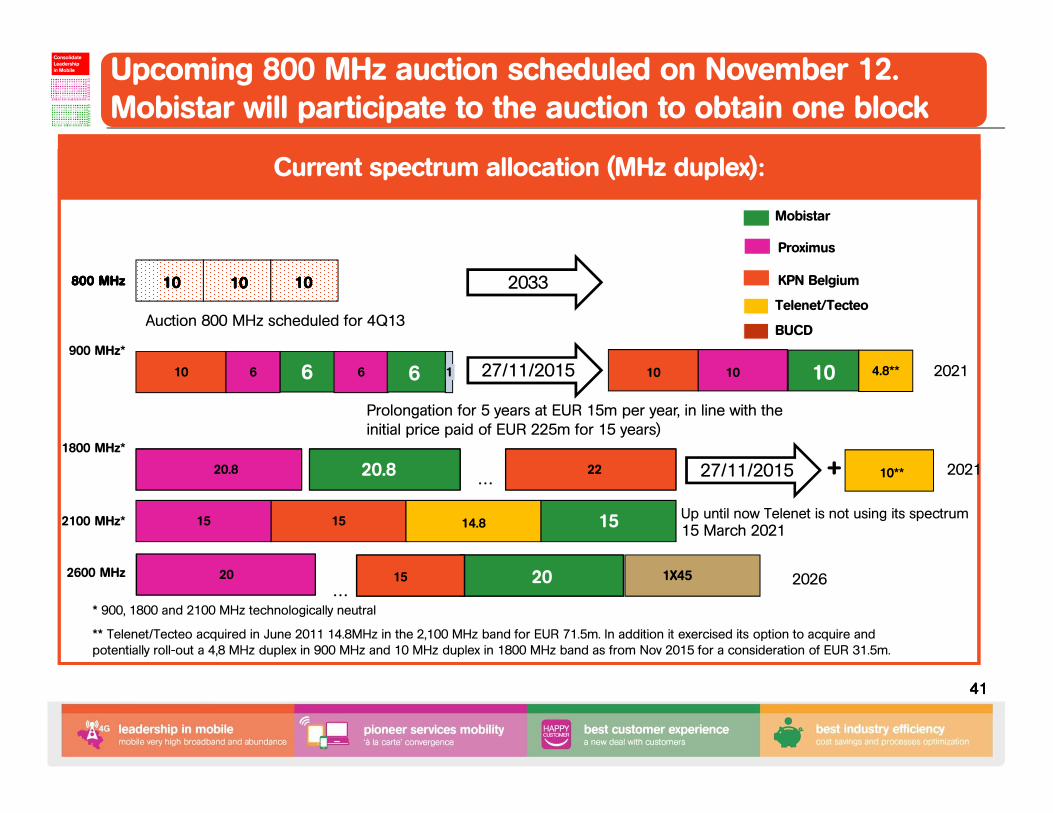
* 900, 1800 and 2100 MHz technologically neutral
** Telenet/Tecteo acquired in June 2011 14.8MHz in the 2,100 MHz band for EUR 71.5m. In addition it exercised its option to acquire and potentially roll-out a 4,8 MHz duplex in 900 MHz and 10 MHz duplex in 1800 MHz band as from Nov 2015 for a consideration of EUR 31.5m.
1X45
10 6 6 6
15 15 14.8 15
20.8 20.8 22
1
10101010
1800 MHz*
800 MHz800 MHz800 MHz800 MHz
900 MHz*
2100 MHz*
2600 MHz
Telenet/Tecteo
20 15
Up until now Telenet is not using its spectrum
10 1027/11/2015 10 4.8**
… 27/11/2015 10**+
…20
15 March 2021
2021
2026
2033
Prolongation for 5 years at EUR 15m per year, in line with the initial price paid of EUR 225m for 15 years)
6
Proximus
Mobistar
KPN Belgium10101010 10101010
Auction 800 MHz scheduled for 4Q13
2021
BUCD
Current spectrum allocation (MHz duplex):
Upcoming 800 MHz auction scheduled on November 12. Mobistar will participate to the auction to obtain one blockBest-in-class
Customer Experience
ConsolidateLeadershipin Mobile
Fixed-Mobile“à la carte” convergence
42424242
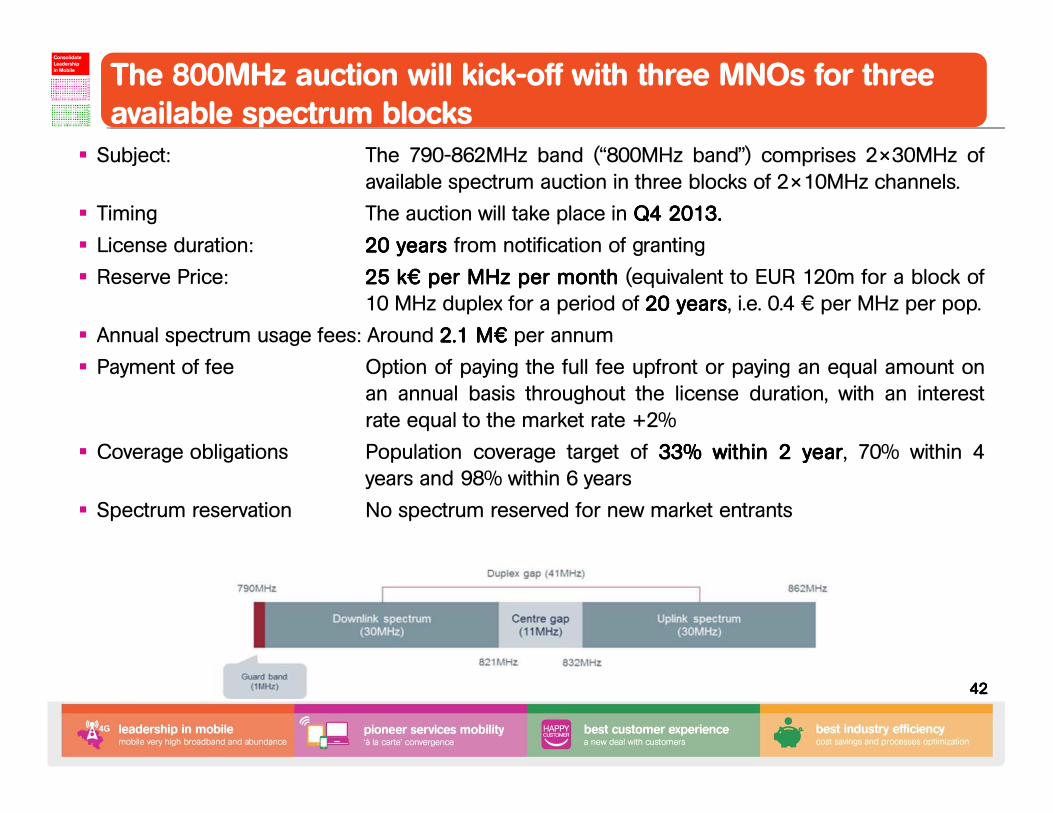
� Subject: The 790-862MHz band (“800MHz band”) comprises 2×30MHz ofavailable spectrum auction in three blocks of 2×10MHz channels.
� Timing The auction will take place in QQQQ4444 2013201320132013....
� License duration: 20202020 yearsyearsyearsyears from notification of granting
� Reserve Price: 25252525 kkkk€€€€ perperperper MHzMHzMHzMHz perperperper monthmonthmonthmonth (equivalent to EUR 120m for a block of10 MHz duplex for a period of 20202020 yearsyearsyearsyears, i.e. 0.4 € per MHz per pop.
� Annual spectrum usage fees: Around 2222....1111 MMMM€€€€ per annum
� Payment of fee Option of paying the full fee upfront or paying an equal amount onan annual basis throughout the license duration, with an interestrate equal to the market rate +2%
� Coverage obligations Population coverage target of 33333333%%%% withinwithinwithinwithin 2222 yearyearyearyear, 70% within 4years and 98% within 6 years
� Spectrum reservation No spectrum reserved for new market entrants
The 800MHz auction will kick-off with three MNOs for three available spectrum blocks Best-in-class
Customer Experience
ConsolidateLeadershipin Mobile
Fixed-Mobile“à la carte” convergence
43434343
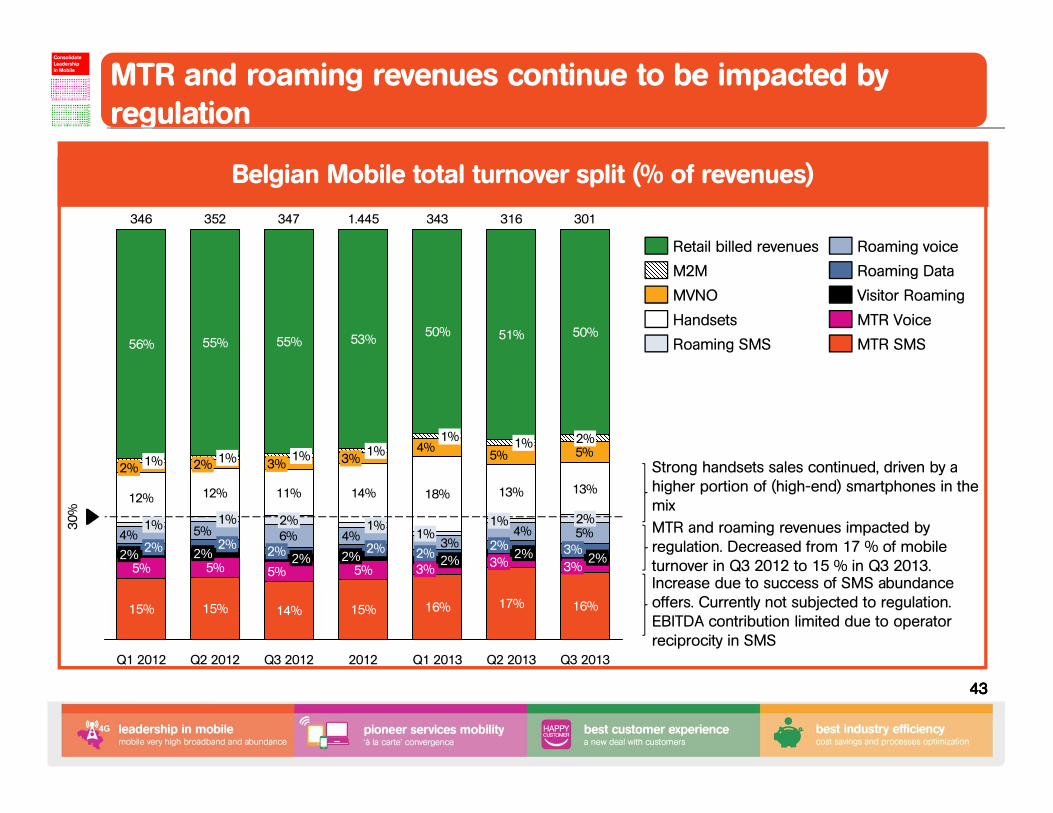
Belgian Mobile total turnover split (% of revenues)
6%
12% 12% 11% 14% 18% 13% 13%
5%4%3%
5%4% 4%
5%5%4%
50%
343
Q3 2012
347
14%
5%2%2%
2%
3%1%
55%
3%
Q1 2013
16%
2%2%
1%
1%
30
%
Q3 2013
301
16%
3%2%
3%
2%
2%
50%
Q2 2013
316
17%
3%2%
2%
1%
1%
51%
2012
1.445
15%
5%2%
2%
1%
3%1%
53%
Q1 2012 Q2 2012
15%
5%2% 2%
2%
1%
1%
56%
346
15%
5%2%
2%
1%
2% 1%
55%
352
Roaming SMS
Handsets
MVNO
M2M
Retail billed revenues
MTR SMS
MTR Voice
Visitor Roaming
Roaming Data
Roaming voice
Increase due to success of SMS abundance offers. Currently not subjected to regulation. EBITDA contribution limited due to operator reciprocity in SMS
MTR and roaming revenues impacted by regulation. Decreased from 17 % of mobile turnover in Q3 2012 to 15 % in Q3 2013.
Strong handsets sales continued, driven by a higher portion of (high-end) smartphones in the mix
MTR and roaming revenues continue to be impacted by regulationBest-in-class
Customer Experience
ConsolidateLeadershipin Mobile
Fixed-Mobile“à la carte” convergence
44444444
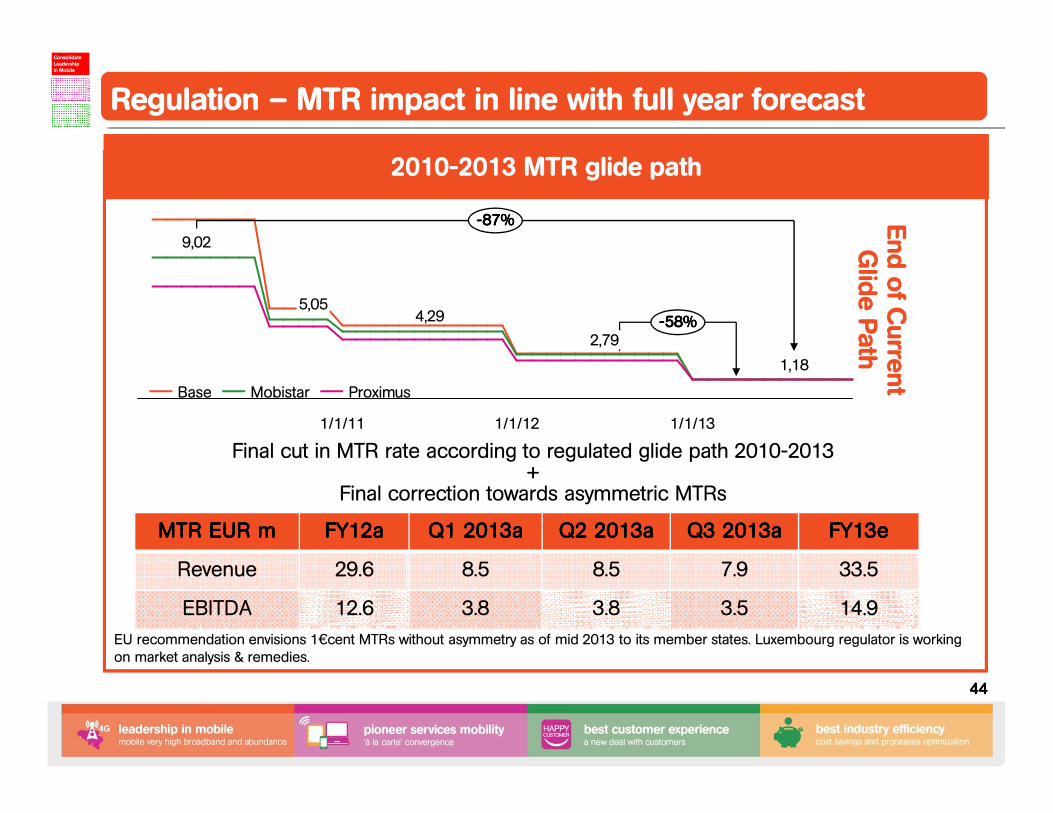
2010-2013 MTR glide path
----58%58%58%58%
----87%87%87%87%
1,18
1/1/13
2,79
1/1/12
4,29
1/1/11
5,05
9,02
ProximusMobistarBase
End ofCurrent
Glide Path
MTR EUR mMTR EUR mMTR EUR mMTR EUR m FY12aFY12aFY12aFY12a Q1 2013aQ1 2013aQ1 2013aQ1 2013a Q2 2013aQ2 2013aQ2 2013aQ2 2013a Q3 2013aQ3 2013aQ3 2013aQ3 2013a FY13eFY13eFY13eFY13e
Revenue 29.6 8.5 8.5 7.9 33.5
EBITDA 12.6 3.8 3.8 3.5 14.9
Final cut in MTR rate according to regulated glide path 2010-2013+
Final correction towards asymmetric MTRs
EU recommendation envisions 1€cent MTRs without asymmetry as of mid 2013 to its member states. Luxembourg regulator is working on market analysis & remedies.
Regulation – MTR impact in line with full year forecastBest-in-class Customer Experience
ConsolidateLeadershipin Mobile
Fixed-Mobile“à la carte” convergence
45454545
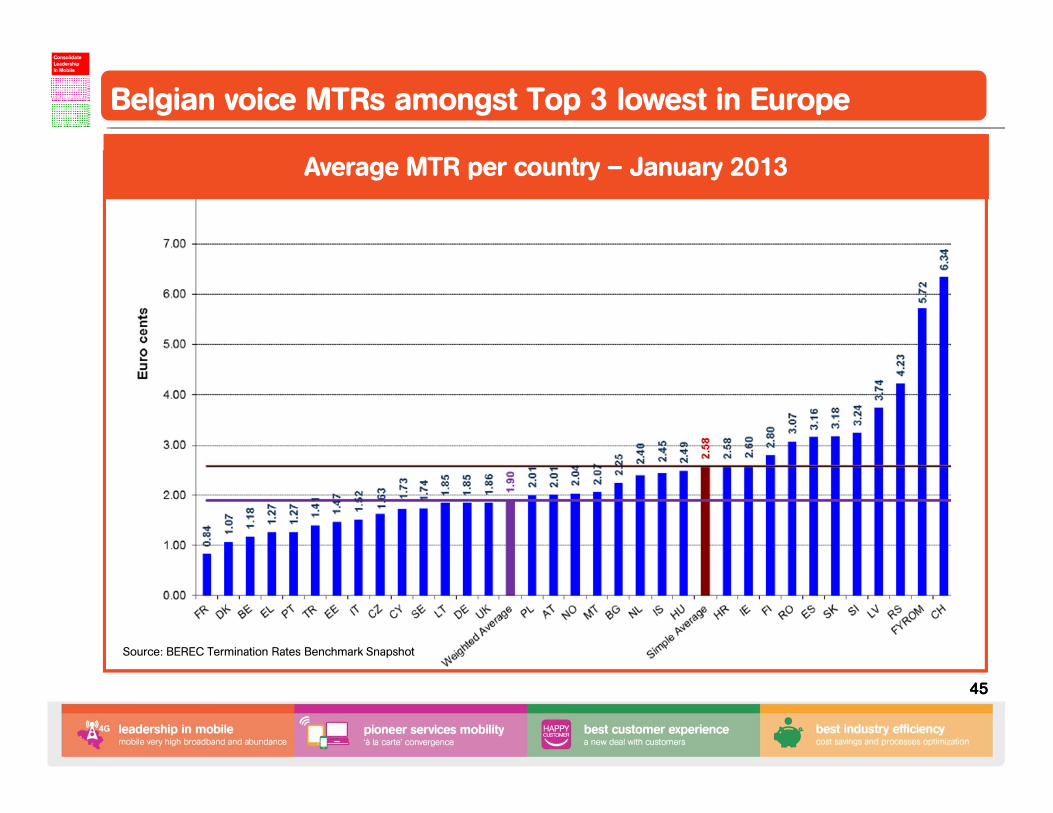
Average MTR per country – January 2013
Source: BEREC Termination Rates Benchmark Snapshot
Belgian voice MTRs amongst Top 3 lowest in EuropeBest-in-class Customer Experience
ConsolidateLeadershipin Mobile
Fixed-Mobile“à la carte” convergence
46464646
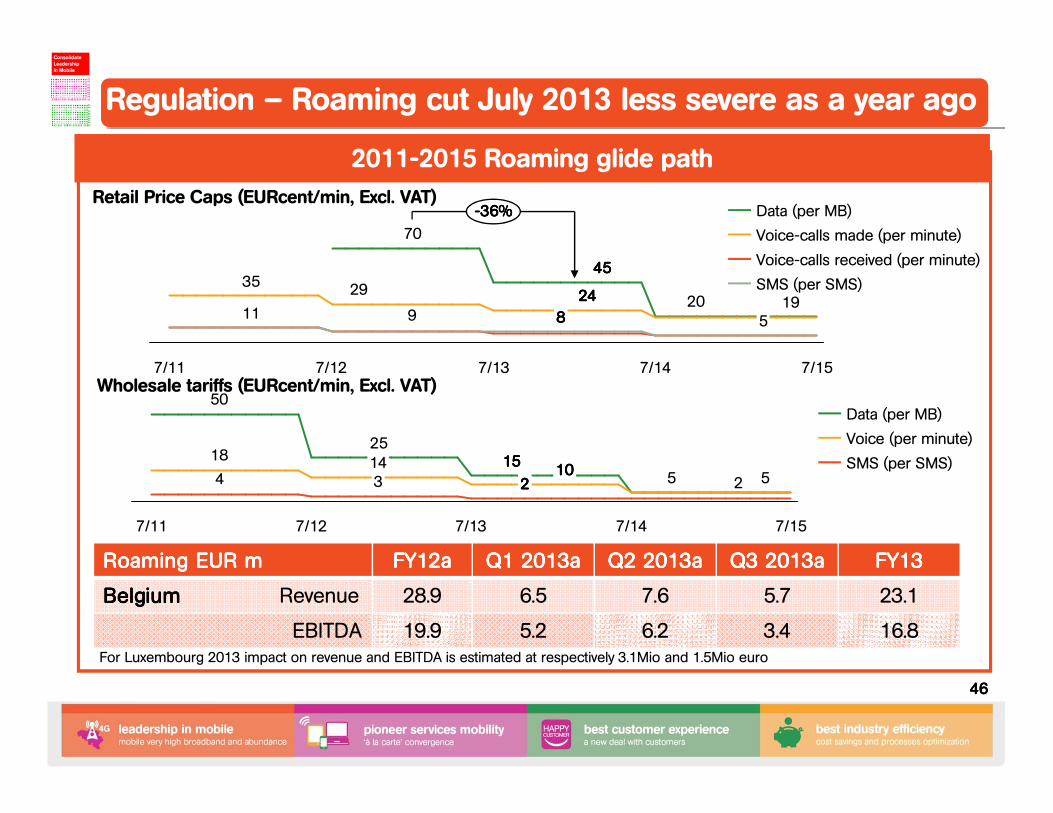
2011-2015 Roaming glide path
Roaming EURRoaming EURRoaming EURRoaming EUR mmmm FY12aFY12aFY12aFY12a Q1 2013aQ1 2013aQ1 2013aQ1 2013a Q2 2013aQ2 2013aQ2 2013aQ2 2013a Q3 2013aQ3 2013aQ3 2013aQ3 2013a FY13FY13FY13FY13
BelgiumBelgiumBelgiumBelgium Revenue 28.9 6.5 7.6 5.7 23.1
EBITDA 19.9 5.2 6.2 3.4 16.8
20
45454545
70
19242424242935
911
----36%36%36%36%
7/15
5
7/14
8888
7/137/127/11
SMS (per SMS)
Voice-calls received (per minute)
Voice-calls made (per minute)
Data (per MB)
515151515
25
50
5
18
24
7/157/14
101010102222
7/13
314
7/127/11
SMS (per SMS)
Voice (per minute)
Data (per MB)
Retail Price Caps (EURcent/min, Excl. VAT)
Wholesale tariffs (EURcent/min, Excl. VAT)
For Luxembourg 2013 impact on revenue and EBITDA is estimated at respectively 3.1Mio and 1.5Mio euro
Regulation – Roaming cut July 2013 less severe as a year agoBest-in-class Customer Experience
ConsolidateLeadershipin Mobile
Fixed-Mobile“à la carte” convergence
47474747
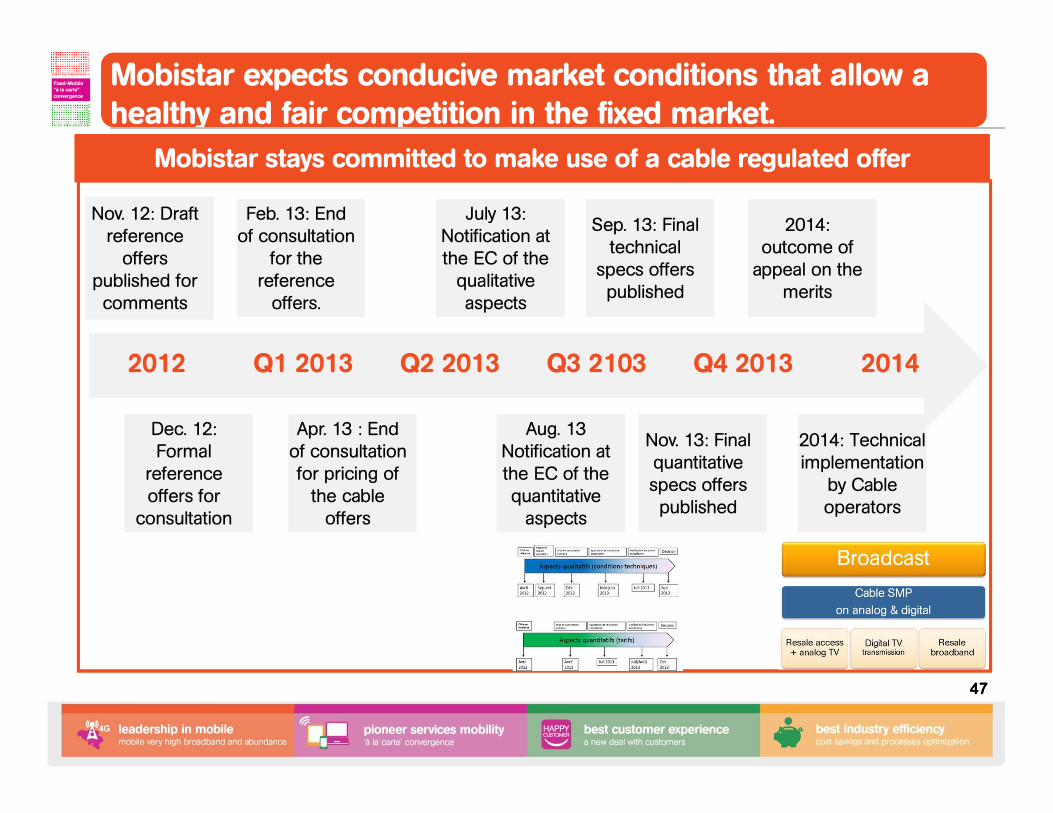
Mobistar expects conducive market conditions that allow a healthy and fair competition in the fixed market. Best-in-class
Customer Experience
ConsolidateLeadershipin Mobile
Fixed-Mobile“à la carte” convergence
Nov. 12: Draft reference
offers published for
comments
Nov. 12: Draft reference
offers published for
comments
Feb. 13: End of consultation
for the reference
offers.
Feb. 13: End of consultation
for the reference
offers.
July 13: Notification at the EC of the
qualitative aspects
July 13: Notification at the EC of the
qualitative aspects
Sep. 13: Final technical
specs offers published
Sep. 13: Final technical
specs offers published
2014: outcome of
appeal on the merits
2014: outcome of
appeal on the merits
Q3 2103 Q4 2013 20142012 Q1 2013 Q2 2013
Dec. 12: Formal
reference offers for
consultation
Dec. 12: Formal
reference offers for
consultation
Apr. 13 : End of consultation
for pricing of the cable
offers
Apr. 13 : End of consultation
for pricing of the cable
offers
Aug. 13 Notification at the EC of the
quantitative aspects
Aug. 13 Notification at the EC of the
quantitative aspects
Nov. 13: Final quantitative
specs offers published
Nov. 13: Final quantitative
specs offers published
2014: Technical implementation
by Cable operators
2014: Technical implementation
by Cable operators
Mobistar stays committed to make use of a cable regulated offer

48484848
Detailed cash flow analysis
FINANCIAL
PERFORMANCE
49494949
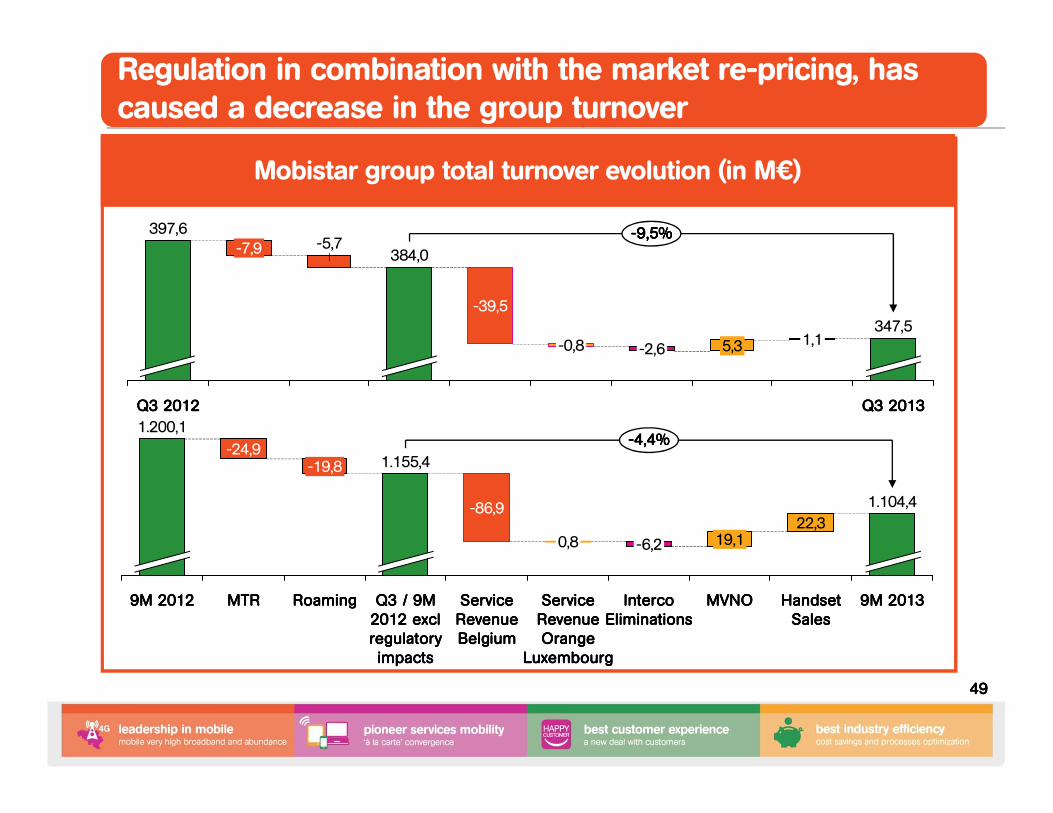
Regulation in combination with the market re-pricing, has caused a decrease in the group turnover
Mobistar group total turnover evolution (in M€)
1.200,1
-24,9
MTRMTRMTRMTR9M 20129M 20129M 20129M 2012
----4,4%4,4%4,4%4,4%
1.104,4
Handset Handset Handset Handset SalesSalesSalesSales
22,3
RoamingRoamingRoamingRoaming
-19,8
Q3 / 9M Q3 / 9M Q3 / 9M Q3 / 9M 2012 excl 2012 excl 2012 excl 2012 excl regulatory regulatory regulatory regulatory
impactsimpactsimpactsimpacts
1.155,4
-86,9
Service Service Service Service Revenue Revenue Revenue Revenue BelgiumBelgiumBelgiumBelgium
0,8
Service Service Service Service Revenue Revenue Revenue Revenue Orange Orange Orange Orange
LuxembourgLuxembourgLuxembourgLuxembourg
9M 20139M 20139M 20139M 2013
-6,2
Interco Interco Interco Interco EliminationsEliminationsEliminationsEliminations
19,1
MVNOMVNOMVNOMVNO
----9,5%9,5%9,5%9,5%397,6-5,7
Q3 2012Q3 2012Q3 2012Q3 2012
384,0
-39,5
-0,8 -2,6 5,3 1,1347,5
Q3 2013Q3 2013Q3 2013Q3 2013
-7,9
50505050
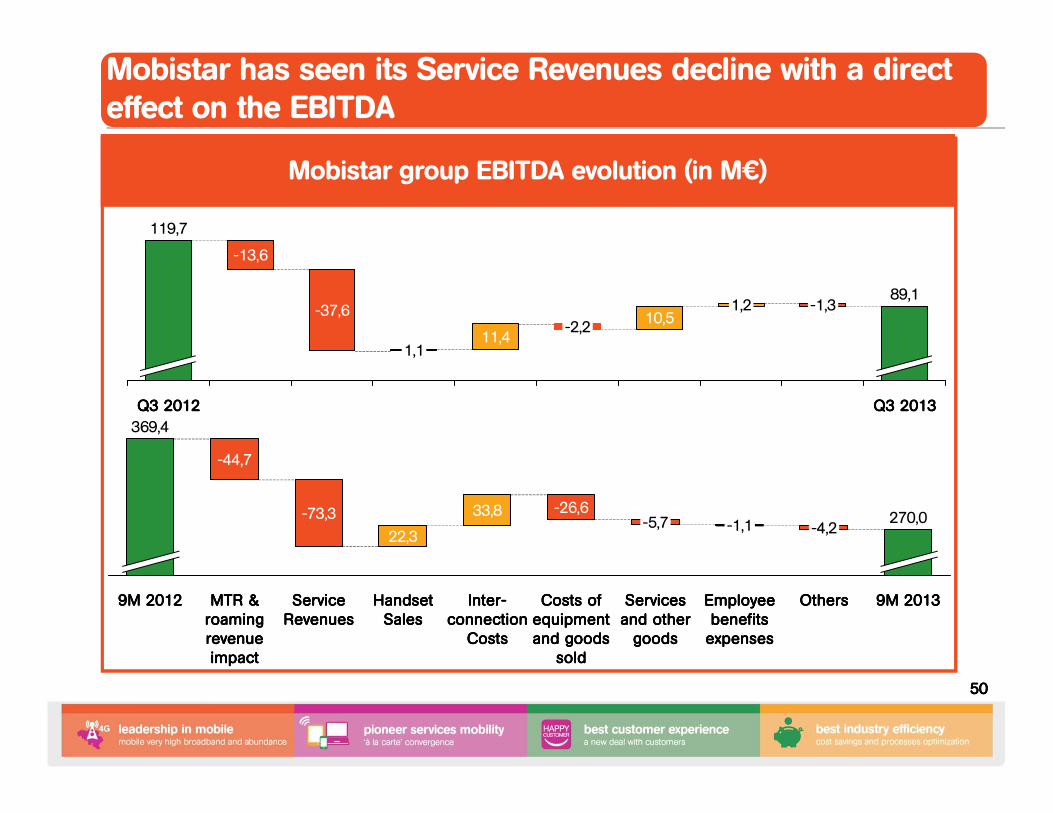
Mobistar has seen its Service Revenues decline with a direct effect on the EBITDA
Mobistar group EBITDA evolution (in M€)
9M 20139M 20139M 20139M 2013
270,0
OthersOthersOthersOthers
-4,2
Employee Employee Employee Employee benefits benefits benefits benefits
expensesexpensesexpensesexpenses
-1,1
Services Services Services Services and other and other and other and other
goodsgoodsgoodsgoods
-5,7
Costs of Costs of Costs of Costs of equipment equipment equipment equipment and goods and goods and goods and goods
soldsoldsoldsold
-26,6
InterInterInterInter----connection connection connection connection
CostsCostsCostsCosts
33,8
Handset Handset Handset Handset SalesSalesSalesSales
22,3
Service Service Service Service RevenuesRevenuesRevenuesRevenues
-73,3
MTR & MTR & MTR & MTR & roaming roaming roaming roaming revenue revenue revenue revenue impactimpactimpactimpact
-44,7
9M 20129M 20129M 20129M 2012
369,4
Q3 2013Q3 2013Q3 2013Q3 2013
89,1-1,31,2
10,5-2,2
11,41,1
-37,6
-13,6
Q3 2012Q3 2012Q3 2012Q3 2012
119,7
51515151
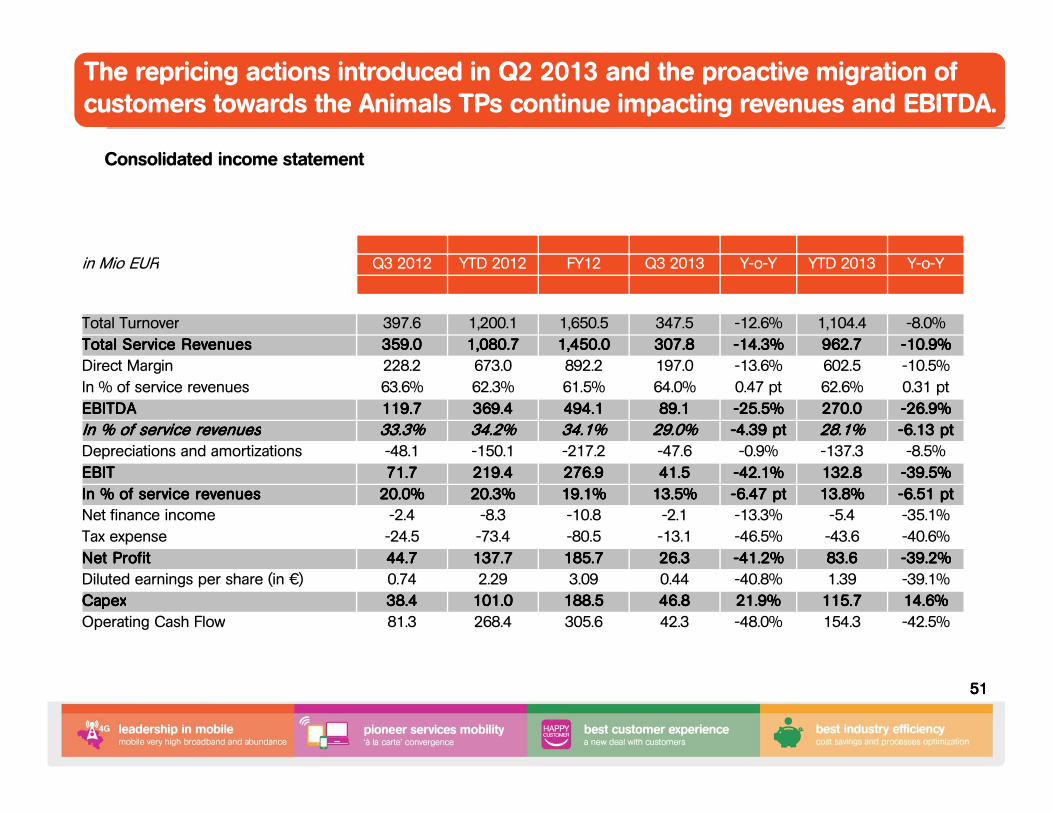
The repricing actions introduced in Q2 2013 and the proactive migration of customers towards the Animals TPs continue impacting revenues and EBITDA.
Consolidated income statement
in Mio EUR Q3 2012 YTD 2012 FY12 Q3 2013 Y-o-Y YTD 2013 Y-o-Y
Total Turnover 397.6 1,200.1 1,650.5 347.5 -12.6% 1,104.4 -8.0%
Total Service RevenuesTotal Service RevenuesTotal Service RevenuesTotal Service Revenues 359.0359.0359.0359.0 1,080.71,080.71,080.71,080.7 1,450.01,450.01,450.01,450.0 307.8307.8307.8307.8 ----14.3%14.3%14.3%14.3% 962.7962.7962.7962.7 ----10.9%10.9%10.9%10.9%
Direct Margin 228.2 673.0 892.2 197.0 -13.6% 602.5 -10.5%
In % of service revenues 63.6% 62.3% 61.5% 64.0% 0.47 pt 62.6% 0.31 pt
EBITDA EBITDA EBITDA EBITDA 119.7119.7119.7119.7 369.4369.4369.4369.4 494.1494.1494.1494.1 89.189.189.189.1 ----25.5%25.5%25.5%25.5% 270.0270.0270.0270.0 ----26.9%26.9%26.9%26.9%
In % of service revenuesIn % of service revenuesIn % of service revenuesIn % of service revenues 33.3%33.3%33.3%33.3% 34.2%34.2%34.2%34.2% 34.1%34.1%34.1%34.1% 29.0%29.0%29.0%29.0% ----4.39 pt4.39 pt4.39 pt4.39 pt 28.1%28.1%28.1%28.1% ----6.13 pt6.13 pt6.13 pt6.13 pt
Depreciations and amortizations -48.1 -150.1 -217.2 -47.6 -0.9% -137.3 -8.5%
EBITEBITEBITEBIT 71.771.771.771.7 219.4219.4219.4219.4 276.9276.9276.9276.9 41.541.541.541.5 ----42.1%42.1%42.1%42.1% 132.8132.8132.8132.8 ----39.5%39.5%39.5%39.5%
In % of service revenuesIn % of service revenuesIn % of service revenuesIn % of service revenues 20.0%20.0%20.0%20.0% 20.3%20.3%20.3%20.3% 19.1%19.1%19.1%19.1% 13.5%13.5%13.5%13.5% ----6.47 pt6.47 pt6.47 pt6.47 pt 13.8%13.8%13.8%13.8% ----6.51 pt6.51 pt6.51 pt6.51 pt
Net finance income -2.4 -8.3 -10.8 -2.1 -13.3% -5.4 -35.1%
Tax expense -24.5 -73.4 -80.5 -13.1 -46.5% -43.6 -40.6%
Net ProfitNet ProfitNet ProfitNet Profit 44.744.744.744.7 137.7137.7137.7137.7 185.7185.7185.7185.7 26.326.326.326.3 ----41.2%41.2%41.2%41.2% 83.683.683.683.6 ----39.2%39.2%39.2%39.2%
Diluted earnings per share (in €) 0.74 2.29 3.09 0.44 -40.8% 1.39 -39.1%
CapexCapexCapexCapex 38.438.438.438.4 101.0101.0101.0101.0 188.5188.5188.5188.5 46.846.846.846.8 21.9%21.9%21.9%21.9% 115.7115.7115.7115.7 14.6%14.6%14.6%14.6%
Operating Cash Flow 81.3 268.4 305.6 42.3 -48.0% 154.3 -42.5%
52525252
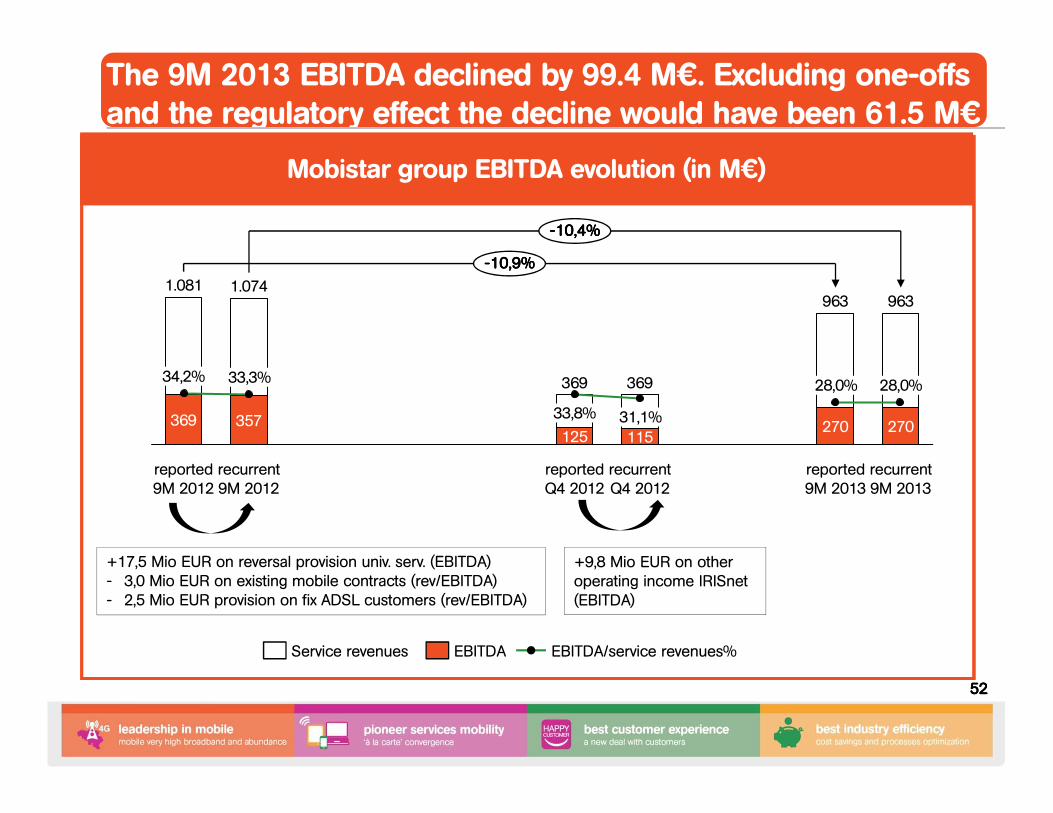
The 9M 2013 EBITDA declined by 99.4 M€. Excluding one-offs and the regulatory effect the decline would have been 61.5 M€euro
28,0%
125
1.074
270
reported 9M 2013
369
31,1%270
recurrent Q4 2012
reported Q4 2012
28,0%
115
33,8%
recurrent 9M 2012
----10,4%10,4%10,4%10,4%
369
recurrent 9M 2013
963
369
963
33,3%
357
reported 9M 2012
1.081
34,2%
----10,9%10,9%10,9%10,9%
EBITDA/service revenues%EBITDAService revenues
+17,5 Mio EUR on reversal provision univ. serv. (EBITDA)- 3,0 Mio EUR on existing mobile contracts (rev/EBITDA)- 2,5 Mio EUR provision on fix ADSL customers (rev/EBITDA)
+9,8 Mio EUR on other operating income IRISnet (EBITDA)
Mobistar group EBITDA evolution (in M€)
53535353
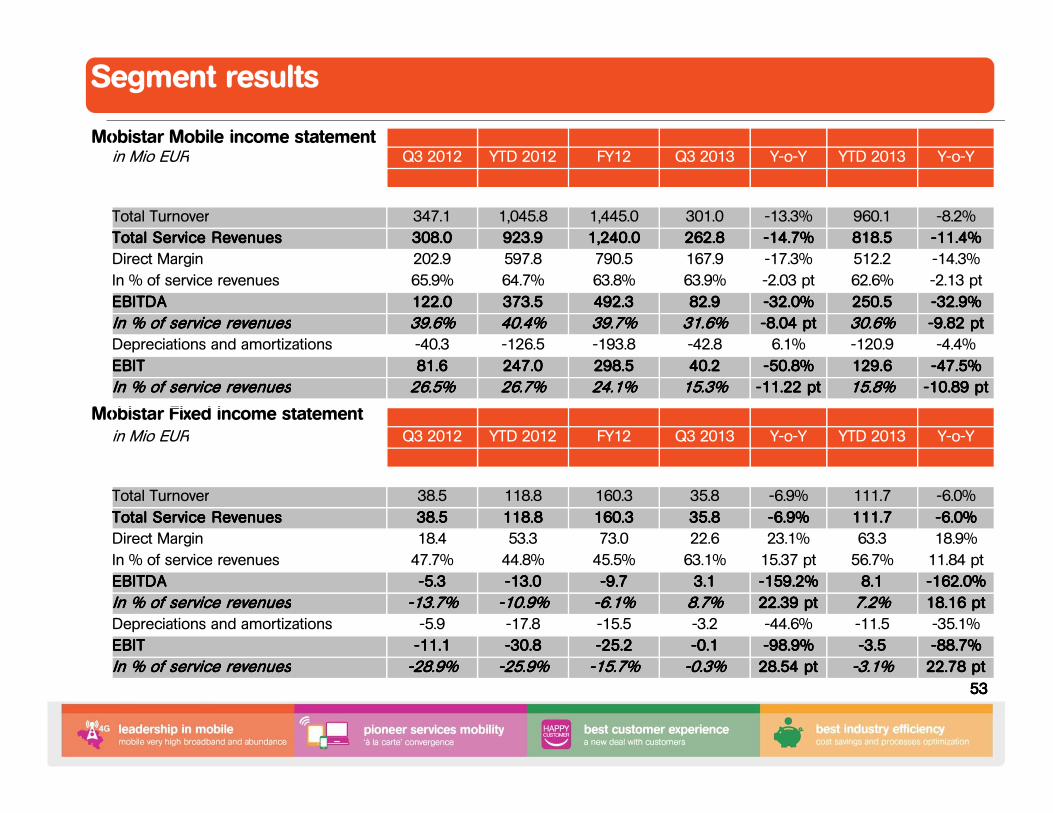
Segment results
Mobistar Mobile income statement
Mobistar Fixed income statement
in Mio EUR Q3 2012 YTD 2012 FY12 Q3 2013 Y-o-Y YTD 2013 Y-o-Y
Total Turnover 347.1 1,045.8 1,445.0 301.0 -13.3% 960.1 -8.2%
Total Service RevenuesTotal Service RevenuesTotal Service RevenuesTotal Service Revenues 308.0308.0308.0308.0 923.9923.9923.9923.9 1,240.01,240.01,240.01,240.0 262.8262.8262.8262.8 ----14.7%14.7%14.7%14.7% 818.5818.5818.5818.5 ----11.4%11.4%11.4%11.4%
Direct Margin 202.9 597.8 790.5 167.9 -17.3% 512.2 -14.3%
In % of service revenues 65.9% 64.7% 63.8% 63.9% -2.03 pt 62.6% -2.13 pt
EBITDA EBITDA EBITDA EBITDA 122.0122.0122.0122.0 373.5373.5373.5373.5 492.3492.3492.3492.3 82.982.982.982.9 ----32.0%32.0%32.0%32.0% 250.5250.5250.5250.5 ----32.9%32.9%32.9%32.9%
In % of service revenuesIn % of service revenuesIn % of service revenuesIn % of service revenues 39.6%39.6%39.6%39.6% 40.4%40.4%40.4%40.4% 39.7%39.7%39.7%39.7% 31.6%31.6%31.6%31.6% ----8.04 pt8.04 pt8.04 pt8.04 pt 30.6%30.6%30.6%30.6% ----9.82 pt9.82 pt9.82 pt9.82 pt
Depreciations and amortizations -40.3 -126.5 -193.8 -42.8 6.1% -120.9 -4.4%
EBITEBITEBITEBIT 81.681.681.681.6 247.0247.0247.0247.0 298.5298.5298.5298.5 40.240.240.240.2 ----50.8%50.8%50.8%50.8% 129.6129.6129.6129.6 ----47.5%47.5%47.5%47.5%
In % of service revenuesIn % of service revenuesIn % of service revenuesIn % of service revenues 26.5%26.5%26.5%26.5% 26.7%26.7%26.7%26.7% 24.1%24.1%24.1%24.1% 15.3%15.3%15.3%15.3% ----11.22 pt11.22 pt11.22 pt11.22 pt 15.8%15.8%15.8%15.8% ----10.89 10.89 10.89 10.89 ptptptpt
in Mio EUR Q3 2012 YTD 2012 FY12 Q3 2013 Y-o-Y YTD 2013 Y-o-Y
Total Turnover 38.5 118.8 160.3 35.8 -6.9% 111.7 -6.0%
Total Service RevenuesTotal Service RevenuesTotal Service RevenuesTotal Service Revenues 38.538.538.538.5 118.8118.8118.8118.8 160.3160.3160.3160.3 35.835.835.835.8 ----6.9%6.9%6.9%6.9% 111.7111.7111.7111.7 ----6.0%6.0%6.0%6.0%
Direct Margin 18.4 53.3 73.0 22.6 23.1% 63.3 18.9%
In % of service revenues 47.7% 44.8% 45.5% 63.1% 15.37 pt 56.7% 11.84 pt
EBITDA EBITDA EBITDA EBITDA ----5.35.35.35.3 ----13.013.013.013.0 ----9.79.79.79.7 3.13.13.13.1 ----159.2%159.2%159.2%159.2% 8.18.18.18.1 ----162.0%162.0%162.0%162.0%
In % of service revenuesIn % of service revenuesIn % of service revenuesIn % of service revenues ----13.7%13.7%13.7%13.7% ----10.9%10.9%10.9%10.9% ----6.1%6.1%6.1%6.1% 8.7%8.7%8.7%8.7% 22.39 pt22.39 pt22.39 pt22.39 pt 7.2%7.2%7.2%7.2% 18.16 pt18.16 pt18.16 pt18.16 pt
Depreciations and amortizations -5.9 -17.8 -15.5 -3.2 -44.6% -11.5 -35.1%
EBITEBITEBITEBIT ----11.111.111.111.1 ----30.830.830.830.8 ----25.225.225.225.2 ----0.10.10.10.1 ----98.9%98.9%98.9%98.9% ----3.53.53.53.5 ----88.7%88.7%88.7%88.7%
In % of service revenuesIn % of service revenuesIn % of service revenuesIn % of service revenues ----28.9%28.9%28.9%28.9% ----25.9%25.9%25.9%25.9% ----15.7%15.7%15.7%15.7% ----0.3%0.3%0.3%0.3% 28.54 pt28.54 pt28.54 pt28.54 pt ----3.1%3.1%3.1%3.1% 22.78 22.78 22.78 22.78 ptptptpt
54545454
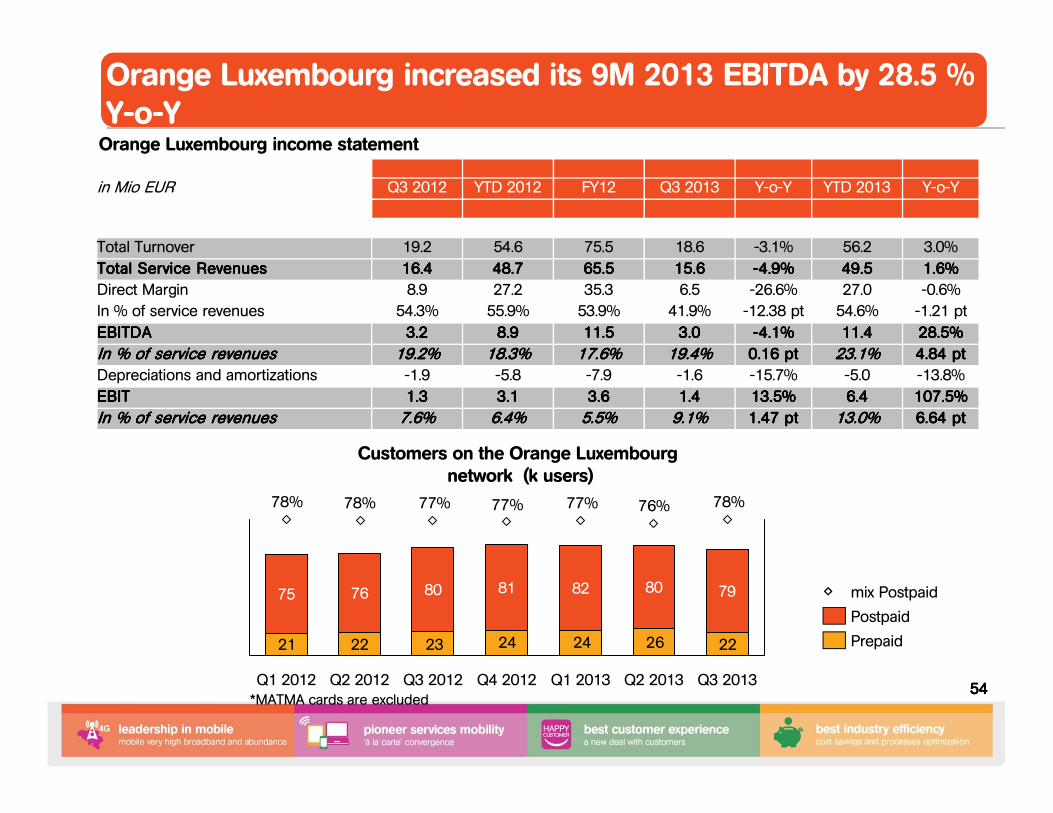
Orange Luxembourg increased its 9M 2013 EBITDA by 28.5 % Y-o-YOrange Luxembourg income statement
22262424232221
78%76%77%77%77%78%78%
80
Q1 2013
82
Q4 2012
81
Q3 2012
80
Q2 2012
76
Q1 2012
75
Q3 2013
79
Q2 2013
mix Postpaid
Prepaid
Postpaid
Customers on the Orange Luxembourg network (k users)
*MATMA cards are excluded
in Mio EUR Q3 2012 YTD 2012 FY12 Q3 2013 Y-o-Y YTD 2013 Y-o-Y
Total Turnover 19.2 54.6 75.5 18.6 -3.1% 56.2 3.0%
Total Service RevenuesTotal Service RevenuesTotal Service RevenuesTotal Service Revenues 16.416.416.416.4 48.748.748.748.7 65.565.565.565.5 15.615.615.615.6 ----4.9%4.9%4.9%4.9% 49.549.549.549.5 1.6%1.6%1.6%1.6%
Direct Margin 8.9 27.2 35.3 6.5 -26.6% 27.0 -0.6%
In % of service revenues 54.3% 55.9% 53.9% 41.9% -12.38 pt 54.6% -1.21 pt
EBITDA EBITDA EBITDA EBITDA 3.23.23.23.2 8.98.98.98.9 11.511.511.511.5 3.03.03.03.0 ----4.1%4.1%4.1%4.1% 11.411.411.411.4 28.5%28.5%28.5%28.5%
In % of service revenuesIn % of service revenuesIn % of service revenuesIn % of service revenues 19.2%19.2%19.2%19.2% 18.3%18.3%18.3%18.3% 17.6%17.6%17.6%17.6% 19.4%19.4%19.4%19.4% 0.16 pt0.16 pt0.16 pt0.16 pt 23.1%23.1%23.1%23.1% 4.84 pt4.84 pt4.84 pt4.84 pt
Depreciations and amortizations -1.9 -5.8 -7.9 -1.6 -15.7% -5.0 -13.8%
EBITEBITEBITEBIT 1.31.31.31.3 3.13.13.13.1 3.63.63.63.6 1.41.41.41.4 13.5%13.5%13.5%13.5% 6.46.46.46.4 107.5%107.5%107.5%107.5%
In % of service revenuesIn % of service revenuesIn % of service revenuesIn % of service revenues 7.6%7.6%7.6%7.6% 6.4%6.4%6.4%6.4% 5.5%5.5%5.5%5.5% 9.1%9.1%9.1%9.1% 1.47 pt1.47 pt1.47 pt1.47 pt 13.0%13.0%13.0%13.0% 6.64 6.64 6.64 6.64 ptptptpt
55555555
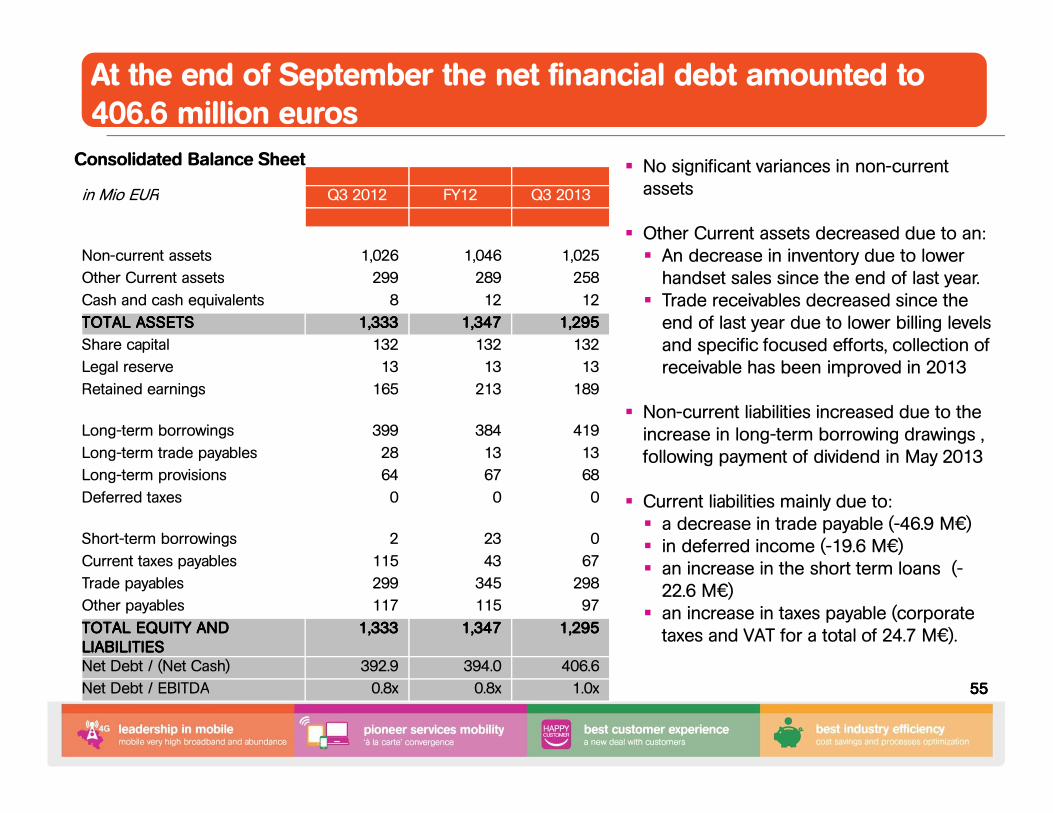
At the end of September the net financial debt amounted to 406.6 million euros
Consolidated Balance Sheet� No significant variances in non-current
assets
� Other Current assets decreased due to an:� An decrease in inventory due to lower
handset sales since the end of last year.� Trade receivables decreased since the
end of last year due to lower billing levels and specific focused efforts, collection of receivable has been improved in 2013
� Non-current liabilities increased due to the increase in long-term borrowing drawings , following payment of dividend in May 2013
� Current liabilities mainly due to:� a decrease in trade payable (-46.9 M€) � in deferred income (-19.6 M€) � an increase in the short term loans (-
22.6 M€) � an increase in taxes payable (corporate
taxes and VAT for a total of 24.7 M€).
in Mio EUR Q3 2012 FY12 Q3 2013
Non-current assets 1,026 1,046 1,025
Other Current assets 299 289 258
Cash and cash equivalents 8 12 12
TOTAL ASSETSTOTAL ASSETSTOTAL ASSETSTOTAL ASSETS 1,3331,3331,3331,333 1,3471,3471,3471,347 1,2951,2951,2951,295
Share capital 132 132 132
Legal reserve 13 13 13
Retained earnings 165 213 189
Long-term borrowings 399 384 419
Long-term trade payables 28 13 13
Long-term provisions 64 67 68
Deferred taxes 0 0 0
Short-term borrowings 2 23 0
Current taxes payables 115 43 67
Trade payables 299 345 298
Other payables 117 115 97
TOTAL EQUITY AND TOTAL EQUITY AND TOTAL EQUITY AND TOTAL EQUITY AND LIABILITIESLIABILITIESLIABILITIESLIABILITIES
1,3331,3331,3331,333 1,3471,3471,3471,347 1,2951,2951,2951,295
Net Debt / (Net Cash) 392.9 394.0 406.6
Net Debt / EBITDA 0.8x 0.8x 1.0x
56565656
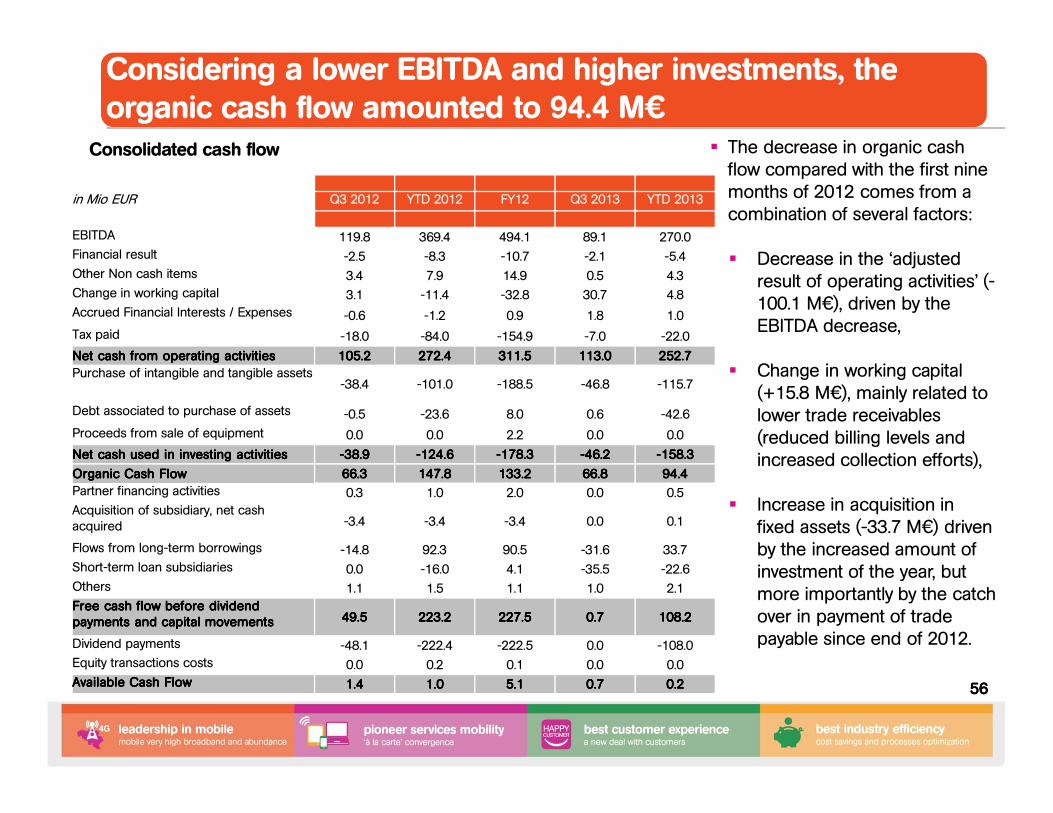
Considering a lower EBITDA and higher investments, the organic cash flow amounted to 94.4 M€
Consolidated cash flow � The decrease in organic cash flow compared with the first nine months of 2012 comes from acombination of several factors:
� Decrease in the ‘adjusted result of operating activities’ (-100.1 M€), driven by the EBITDA decrease,
� Change in working capital (+15.8 M€), mainly related to lower trade receivables (reduced billing levels and increased collection efforts),
� Increase in acquisition in fixed assets (-33.7 M€) driven by the increased amount of investment of the year, but more importantly by the catch over in payment of trade payable since end of 2012.
in Mio EUR Q3 2012 YTD 2012 FY12 Q3 2013 YTD 2013
EBITDA 119.8 369.4 494.1 89.1 270.0
Financial result -2.5 -8.3 -10.7 -2.1 -5.4
Other Non cash items 3.4 7.9 14.9 0.5 4.3
Change in working capital 3.1 -11.4 -32.8 30.7 4.8
Accrued Financial Interests / Expenses -0.6 -1.2 0.9 1.8 1.0
Tax paid -18.0 -84.0 -154.9 -7.0 -22.0
Net cash from operating activities Net cash from operating activities Net cash from operating activities Net cash from operating activities 105.2105.2105.2105.2 272.4272.4272.4272.4 311.5311.5311.5311.5 113.0113.0113.0113.0 252.7252.7252.7252.7
Purchase of intangible and tangible assets-38.4 -101.0 -188.5 -46.8 -115.7
Debt associated to purchase of assets -0.5 -23.6 8.0 0.6 -42.6
Proceeds from sale of equipment 0.0 0.0 2.2 0.0 0.0
Net cash used in investing activitiesNet cash used in investing activitiesNet cash used in investing activitiesNet cash used in investing activities ----38.938.938.938.9 ----124.6124.6124.6124.6 ----178.3178.3178.3178.3 ----46.246.246.246.2 ----158.3158.3158.3158.3
Organic Cash FlowOrganic Cash FlowOrganic Cash FlowOrganic Cash Flow 66.366.366.366.3 147.8147.8147.8147.8 133.2133.2133.2133.2 66.866.866.866.8 94.494.494.494.4
Partner financing activities 0.3 1.0 2.0 0.0 0.5
Acquisition of subsidiary, net cash acquired -3.4 -3.4 -3.4 0.0 0.1
Flows from long-term borrowings -14.8 92.3 90.5 -31.6 33.7
Short-term loan subsidiaries 0.0 -16.0 4.1 -35.5 -22.6
Others 1.1 1.5 1.1 1.0 2.1
Free cash flow before dividend Free cash flow before dividend Free cash flow before dividend Free cash flow before dividend payments and capital movementspayments and capital movementspayments and capital movementspayments and capital movements 49.549.549.549.5 223.2223.2223.2223.2 227.5227.5227.5227.5 0.70.70.70.7 108.2108.2108.2108.2
Dividend payments -48.1 -222.4 -222.5 0.0 -108.0
Equity transactions costs 0.0 0.2 0.1 0.0 0.0
Available Cash FlowAvailable Cash FlowAvailable Cash FlowAvailable Cash Flow 1.41.41.41.4 1.01.01.01.0 5.15.15.15.1 0.70.70.70.7 0.20.20.20.2

57575757
2013 Outlook
58585858
Operational cash flow **
EBITDA *
Total Turnover
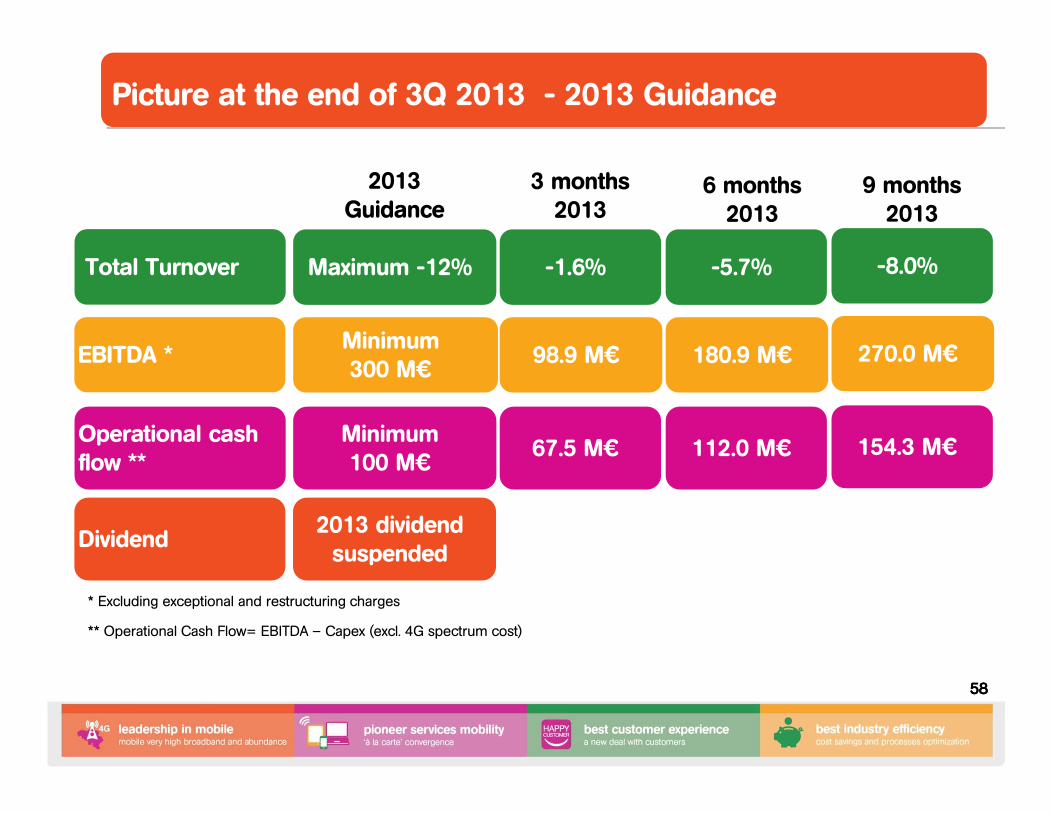
Picture at the end of 3Q 2013 - 2013 Guidance
-8.0%
154.3 M€
270.0 M€
2013 Guidance
* Excluding exceptional and restructuring charges
** Operational Cash Flow= EBITDA – Capex (excl. 4G spectrum cost)
Dividend
Maximum -12%
Minimum 100 M€
Minimum 300 M€
2013 dividend suspended
-1.6%
67.5 M€
98.9 M€
-5.7%
112.0 M€
180.9 M€
3 months 2013
6 months 2013
9 months 2013

59595959
Q&A
60606060
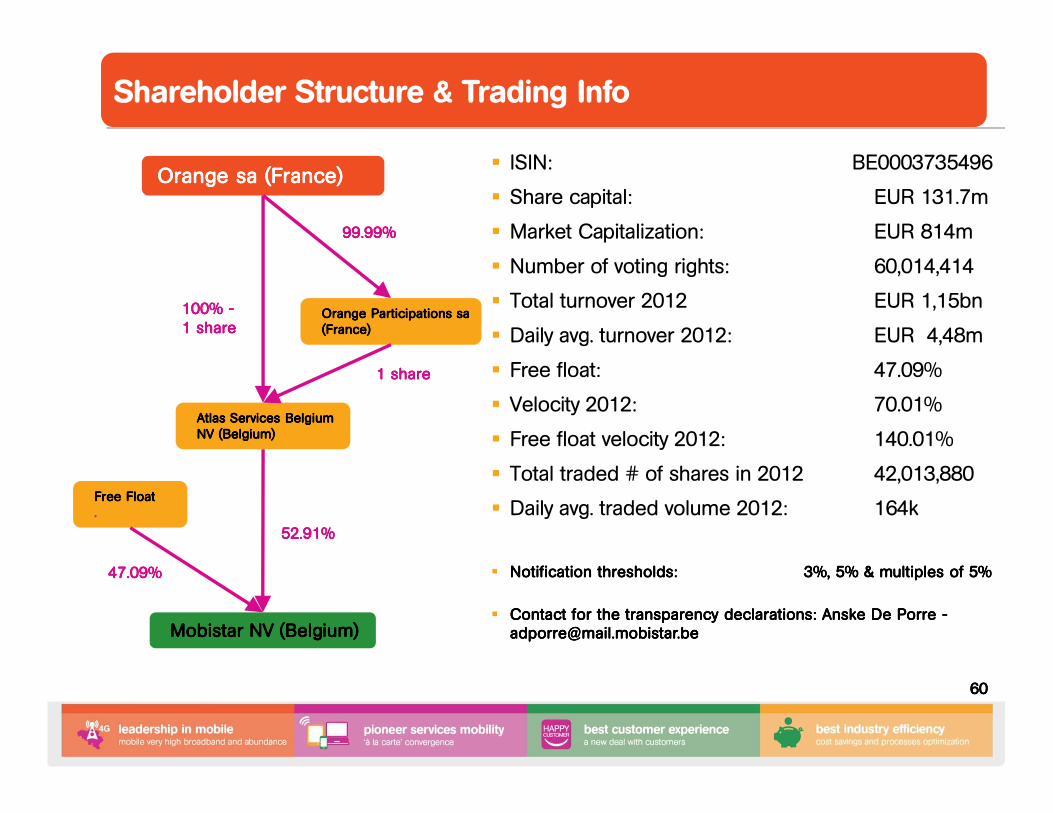
Shareholder Structure & Trading Info
Orange Orange Orange Orange sasasasa (France)(France)(France)(France)
Orange Participations Orange Participations Orange Participations Orange Participations sasasasa(France)(France)(France)(France)
Atlas Services Belgium Atlas Services Belgium Atlas Services Belgium Atlas Services Belgium NVNVNVNV (Belgium)(Belgium)(Belgium)(Belgium)
� ISIN: BE0003735496
� Share capital: EUR 131.7m
� Market Capitalization: EUR 814m
� Number of voting rights: 60,014,414
� Total turnover 2012 EUR 1,15bn
� Daily avg. turnover 2012: EUR 4,48m
� Free float: 47.09%
� Velocity 2012: 70.01%
� Free float velocity 2012: 140.01%
� Total traded # of shares in 2012 42,013,880
� Daily avg. traded volume 2012: 164k
� Notification thresholds: Notification thresholds: Notification thresholds: Notification thresholds: 3%, 5% & multiples of 5%3%, 5% & multiples of 5%3%, 5% & multiples of 5%3%, 5% & multiples of 5%
� Contact for the transparency declarations: Anske De Contact for the transparency declarations: Anske De Contact for the transparency declarations: Anske De Contact for the transparency declarations: Anske De PorrePorrePorrePorre [email protected]@[email protected]@mail.mobistar.be
Free Float Free Float Free Float Free Float . . . .
Mobistar NV (Belgium)Mobistar NV (Belgium)Mobistar NV (Belgium)Mobistar NV (Belgium)
52.91%52.91%52.91%52.91%
47.09%47.09%47.09%47.09%
99.99%99.99%99.99%99.99%
100% 100% 100% 100% ----1 share1 share1 share1 share
1 share1 share1 share1 share
61616161
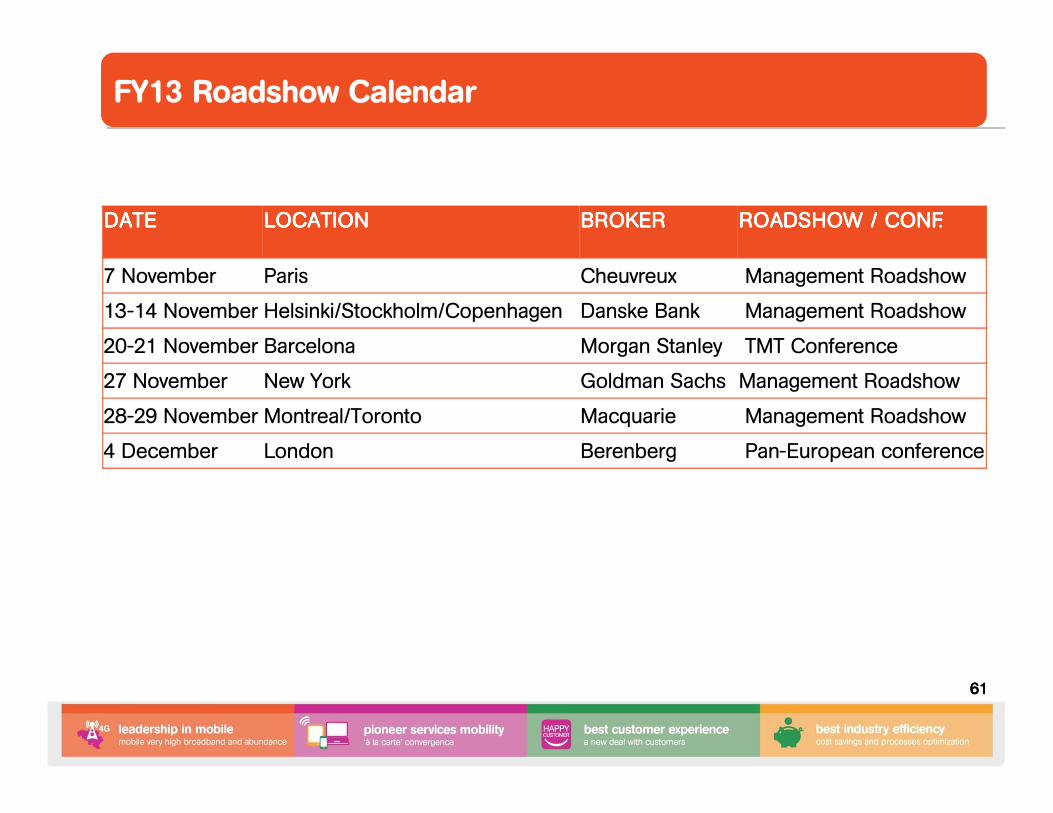
DATEDATEDATEDATE LOCATIONLOCATIONLOCATIONLOCATION BROKERBROKERBROKERBROKER ROADSHOW / ROADSHOW / ROADSHOW / ROADSHOW / CONF.CONF.CONF.CONF.
7 November Paris Cheuvreux Management Roadshow
13-14 November Helsinki/Stockholm/Copenhagen Danske Bank Management Roadshow
20-21 November Barcelona Morgan Stanley TMT Conference
27 November New York Goldman Sachs Management Roadshow
28-29 November Montreal/Toronto Macquarie Management Roadshow
4 December London Berenberg Pan-European conference
FY13 Roadshow Calendar

62626262
Visit our websites:• www.mobistar.be
• http://business.mobistar.be
• http://corporate.mobistar.be
For further questions please contact IR department
Investor Relations
Siddy JobeEmail: [email protected]
http://corporate.mobistar.be/go/en/financial_information.cfm