Embed Size (px)
Citation preview
Q3 17 Earnings Presentation
Bernard Charlès, Vice-Chairman of the Board of
Directors & CEO
Thibault de Tersant, Senior EVP, CFO
2
Forward Looking Information Statements herein that are not historical facts but express expectations or objectives for the future, including but not limited to statements
regarding the Company’s non-IFRS financial performance objectives, are forward-looking statements.
Such forward-looking statements are based on Dassault Systèmes management's current views and assumptions and involve known
and unknown risks and uncertainties. Actual results or performances may differ materially from those in such statements due to a range
of factors. The Company’s current outlook for 2017 takes into consideration, among other things, an uncertain global economic
environment. In light of the continuing uncertainties regarding economic, business, social and geopolitical conditions at the global level,
the Company’s revenue, net earnings and cash flows may grow more slowly, whether on an annual or quarterly basis. While the
Company makes every effort to take into consideration this uncertain macroeconomic outlook, the Company’s business results, however,
may not develop as anticipated. Further, there may be a substantial time lag between an improvement in global economic and business
conditions and an upswing in the Company’s business results. The Company’s actual results or performance may also be materially
negatively affected by numerous risks and uncertainties, as described in the “Risk Factors” section of the 2016 Document de Référence
(Annual Report) filed with the AMF (French Financial Markets Authority) on March 22, 2017, and also available on the Company’s website
www.3ds.com.
In preparing such forward-looking statements, the Company has in particular assumed an average US dollar to euro exchange rate of
US$1.20 per €1.00 for the 2017 fourth quarter and US$1.14 per €1.00 for the full year 2017 as well as an average Japanese yen to euro
exchange rate of JPY135 to €1.00 for the fourth quarter and JPY127.2 to €1.00 for the full year 2017 before hedging; however, currency
values fluctuate, and the Company’s results of operations may be significantly affected by changes in exchange rates.
3
Non-IFRS InformationReaders are cautioned that the supplemental non-IFRS information presented in this press release is subject to inherent limitations. It is
not based on any comprehensive set of accounting rules or principles and should not be considered as a substitute for IFRS
measurements. Also, the Company’s supplemental non-IFRS financial information may not be comparable to similarly titled non-IFRS
measures used by other companies. Further specific limitations for individual non-IFRS measures, and the reasons for presenting non-
IFRS financial information, are set forth in the Company’s 2016 Document de Référence filed with the AMF on March 22, 2017.
In the tables accompanying this press release the Company sets forth its supplemental non-IFRS figures for revenue, operating income,
operating margin, net income and diluted earnings per share, which exclude the effect of adjusting the carrying value of acquired
companies’ deferred revenue, share-based compensation expense and related social charges, the amortization of acquired intangible
assets, other operating income and expense, net, certain one-time items included in financial revenue and other, net, and the income tax
effect of the non-IFRS adjustments and certain one-time tax effects. The tables also set forth the most comparable IFRS financial
measure and reconciliations of this information with non-IFRS information.
This press release constitutes the quarterly financial information required by article L.451-1-2 IV of the French Monetary and Financial
Code (Code Monétaire et Financier).
4
Important NoticesThis communication is for informational purposes only and is neither a recommendation, an offer to purchase nor a solicitation of an offer
to sell securities. On October 12, 2017, Dassault Systèmes filed with the U.S. Securities Exchange Commission (the “SEC”) a tender
offer statement on Schedule TO regarding the tender offer described in this communication. Holders of shares of common stock of Exa
Corporation are urged to read the tender offer statement (as it may be updated and amended from time to time) filed by Dassault
Systèmes because it contains important information that holders of shares of common stock of Exa Corporation should consider before
making any decision regarding tendering their shares. The tender offer statement and other documents filed by Dassault Systèmes and
Exa Corporation with the SEC are available for free at the SEC’s website at www.sec.gov.
Forward-looking Statements
The foregoing communication may contain forward-looking statements. These forward-looking statements involve known and unknown
risks, uncertainties and other factors, many of which are outside of the control of Dassault Systèmes, are difficult to predict and may
cause actual outcomes to differ significantly from any future outcome expressed or implied in the forward looking statements in this
communication. While Dassault Systèmes believes that the assumptions made and the expectations reflected in this material are
reasonable, no assurance can be given that such assumptions or expectations will prove to have been correct and no guarantee of
whatsoever nature is assumed in this respect. The uncertainties include, inter alia, the risk of a change in general economic conditions
and government and regulatory actions. These known, unknown and uncertain factors are not exhaustive, and other factors, whether
known, unknown or unpredictable, could cause Dassault Systèmes’ actual results or ratings to differ materially from those assumed
hereinafter. Dassault Systèmes undertakes no obligation to update or revise the forward-looking statements in this material whether as a
result of new information, future events or otherwise.
5
Q3 2017 Highlights
Delivering software revenue, margin and EPS at the high-end of guidance
Recording double-digit new licenses growth exFX
Winning customer decisions with 3DEXPERIENCE Platform
By brand, performance driven by SOLIDWORKS, SIMULIA and GEOVIA
Industrial Equipment and High-Tech, Consumer Goods & Retail, Energy, Process & Utilities showing good
momentum
Accelerating strategy implementation with 2 acquisitions
Expanding SIMULIA with proposed acquisition of Exa Corporation for fluids simulation
Broadening CATIA with proposed No Magic acquisition to generalize systems engineering
Updating FY17 guidance for currencies and services while reconfirming FY17 new licenses
revenue growth range of +8-10% exFX

6
1
Q3 & YTD 17 Financial Highlights 2
Q3 & YTD 17 Business Review
3 Q4 & YTD 17 Financial Objectives
4 Financial Information Appendix
Agenda

7
Q3 17 Business Review
Q3 Performance
Customer Decisions | 3DEXPERIENCE Platform
Brand Highlights | SOLIDWORKS, GEOVIA
Industry Highlights | High-Tech
SIMULIA | Exa Corporation Proposed Acquisition
CATIA | No Magic Proposed Acquisition

8
€ millions Q3 17 YTD 17
Revenue 752.9 2,329.2
Growth +2% +7%
Growth exFX +6% +7%
Software Growth exFX +8% +7%
New Licenses Growth exFX +12% +9%
Operating Margin 32.0% 29.4%
EPS (€) 0.64 1.79
EPS Evolution +2% 5%
Q3 & YTD 17 Summary Performance Non-IFRS
Strong Q3 new licenses growth
driving top line growth
Q3 EPS up 8% exFX

9
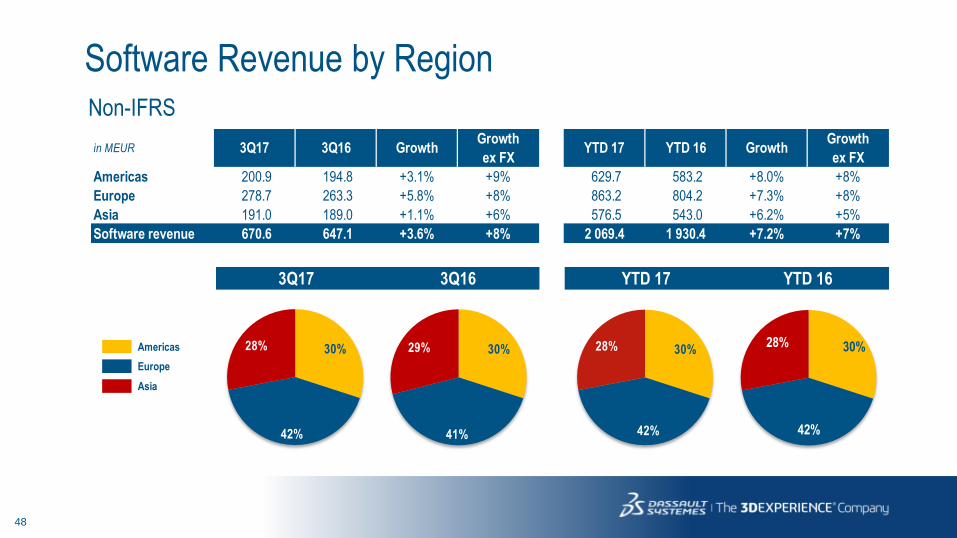
Software Revenue by Region Non-IFRS
Continued improvement in the Americas with
strong new licenses growth in North America
Europe led by Southern Europe and France
Weak performance in China – Good
performance in Korea and India
Q3 17 YTD 17
Americas +9% +8%
Europe +8% +8%
Asia +6% +5%
Software Revenue +8% +7%
Software Revenue Growth exFX by Region
10
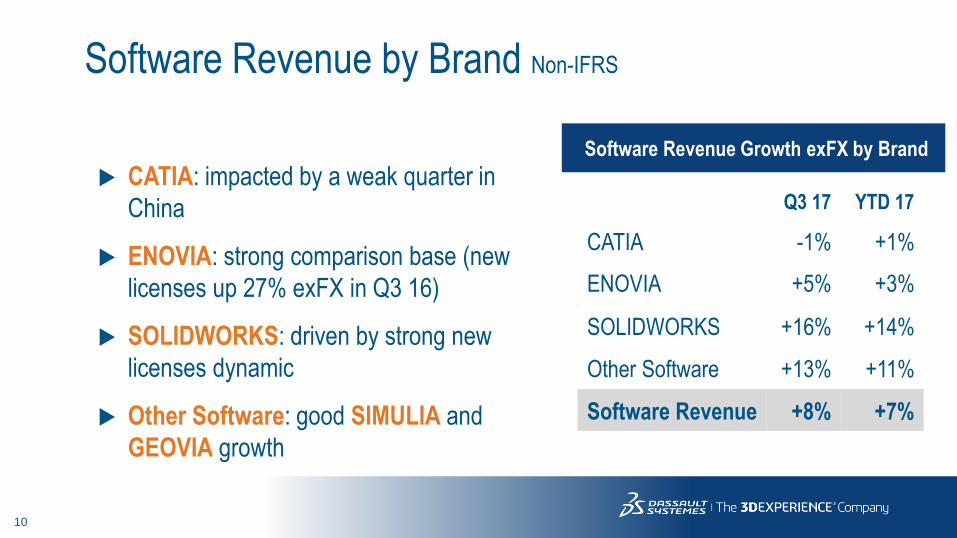
Software Revenue by Brand Non-IFRS
CATIA: impacted by a weak quarter in
China
ENOVIA: strong comparison base (new
licenses up 27% exFX in Q3 16)
SOLIDWORKS: driven by strong new
licenses dynamic
Other Software: good SIMULIA and
GEOVIA growth
Software Revenue Growth exFX by Brand
Q3 17 YTD 17
CATIA -1% +1%
ENOVIA +5% +3%
SOLIDWORKS +16% +14%
Other Software +13% +11%
Software Revenue +8% +7%
11
Q3 17 Business Review
Q3 Performance
Customer Decisions | 3DEXPERIENCE Platform
Brand Highlights | SOLIDWORKS, GEOVIA
Industry Highlights | High-Tech
SIMULIA | Exa Corporation Proposed Acquisition
CATIA | No Magic Proposed Acquisition

12
Leading manufacturer of heavy trucks and buses. Part of Volkswagen Truck and Bus
subsidiary.
SCANIA Adopts 3DEXPERIENCE Platform
SCANIA
Business Values:
Solution:
• 3DEXPERIENCE Platform with
Modular Glocal & Secure
Industry Solution Experience
“Scania’s renowned modular system requires a
comprehensive repository of designs that can be joined
together in building the applications of the customer’s
choice. The 3DEXPERIENCE platform will help improve
simulation for faster validation of our vehicles. It will also
enable digital continuity from design to manufacturing
throughout our unique virtual product development
processes.” Michael Thel, Engineering Director, Scania.
Ramp-up starting in 2018
13
Q3 17 Business Review
Q3 Performance
Customer Decisions | 3DEXPERIENCE Platform
Brand Highlights | SOLIDWORKS, GEOVIA
Industry Highlights | High-Tech
SIMULIA | Exa Corporation Proposed Acquisition
CATIA | No Magic Proposed Acquisition
14
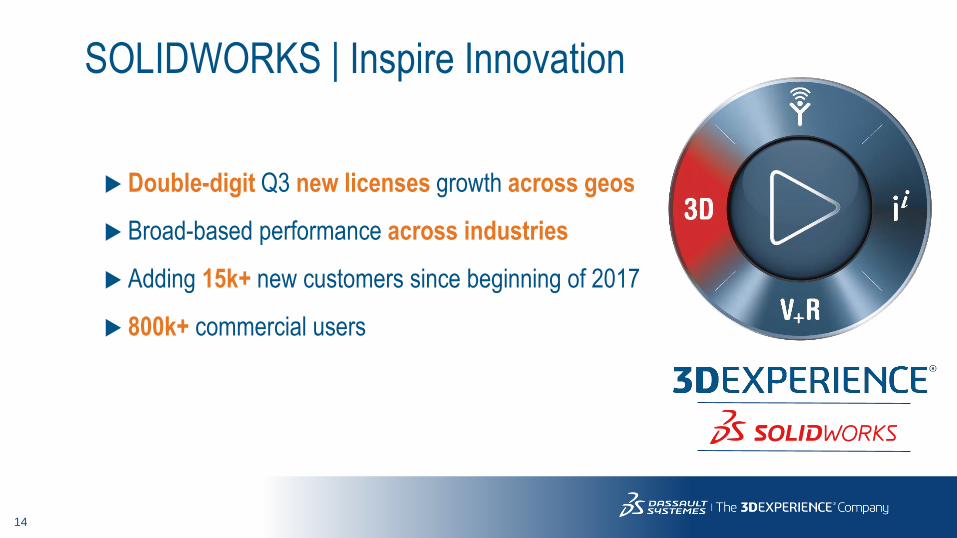
SOLIDWORKS | Inspire Innovation
Double-digit Q3 new licenses growth across geos
Broad-based performance across industries
Adding 15k+ new customers since beginning of 2017
800k+ commercial users

15
Investing in R&D with a New Release Every Year
Launching SOLIDWORKS 2018
Design to manufacture
Distributed data management
Designer to analyst
Electrical and IOT
Learn how the complete SOLIDWORKS 2018 portfolio can help you drive innovation to build your next great design:
https://launch.solidworks.com/homepage

16

17
GEOVIA | Virtual Planet
Q3 software revenue up 12% exFX
Performance driven by Natural Resources (mining)
Diversification to serve Architecture, Engineering &
Construction, Energy, Process & Utilities and
Cities

18
Six principal divisions: ferroalloys, iron ore, other non-ferrous (copper and cobalt), alumina and aluminum,
energy, logistics - www.erg.kz
Eurasian Resources Group Adopts GEOVIA
Eurasian Resources Group, Kazakhstan
Business Values:
Solution:
• GEOVIA
Optimizing mine exploitation
- Developing accurate 3D geological models of
mineral deposits
- Generating high level practical plans which can be
expanded into detailed mine designs that account for
geomechanical constraints

19
Q3 17 Business Review
Q3 Performance
Customer Decisions | 3DEXPERIENCE Platform
Brand Highlights | SOLIDWORKS, GEOVIA
Industry Highlights | High-Tech
SIMULIA | Exa Corporation Proposed Acquisition
CATIA | No Magic Proposed Acquisition

20
Q3 High-Tech Performance
Q3 software revenue up 26% exFX
Continued strong performance with Semiconductor companies
and key wins in North America, Korea, Europe and Japan
Important investments in Simulation by a key global player in
Consumer Electronics
Good dynamic in Automotive Electronics for mechatronics and
software collaborative product development Technology Suppliers
Consumer Electronics
Software, Computing &
Communication Equipment
Security & Control
Contract Manufacturing
Services
Semiconductors
High-Tech

21
HIGH-TECH | TRENDS & CHALLENGES
COMPLIANCE WITH QUALITY &
REGULATORY STANDARDS
Master increasing complexities of global product
development, while meeting stringent compliance
and quality targets
PRODUCT, REGULATORY
& PROCESS COMPLEXITY
Address competitive pressures on margin with
global efficiency, components re-use and reduced
cost of supply
INCREASING GLOBAL
COMPETITIVE PRESSURE
PROCESS EXECUTION EFFICIENCY,
COLLABORATION &
COST OPTIMIZATION
FAST EVOLVING TECHNOLOGY &
MARKET DEMAND
PRODUCT MODULARITY &
VARIABILITY
React to technological and global market
opportunities faster by increasing teams agility
22
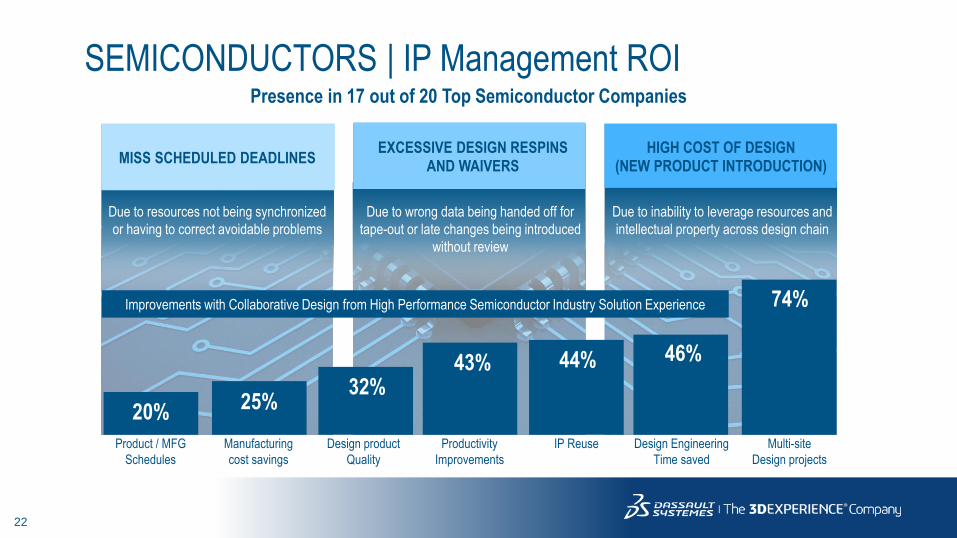
SEMICONDUCTORS | IP Management ROI Presence in 17 out of 20 Top Semiconductor Companies
Improvements with Collaborative Design from High Performance Semiconductor Industry Solution Experience
MISS SCHEDULED DEADLINESEXCESSIVE DESIGN RESPINS
AND WAIVERSHIGH COST OF DESIGN
(NEW PRODUCT INTRODUCTION)
20% 25%32%
43% 44% 46%
74%
Product / MFG
Schedules
Manufacturing
cost savings
Design product
Quality
Productivity
Improvements
IP Reuse Design Engineering
Time saved
Multi-site
Design projects
Due to resources not being synchronized
or having to correct avoidable problems
Due to wrong data being handed off for
tape-out or late changes being introduced
without review
Due to inability to leverage resources and
intellectual property across design chain
23
Q3 17 Business Review
Q3 Performance
Customer Decisions | 3DEXPERIENCE Platform
Brand Highlights | SOLIDWORKS, GEOVIA
Industry Highlights | High-Tech
SIMULIA | Exa Corporation Proposed Acquisition
CATIA | No Magic Proposed Acquisition

24
SIMULIA | Simulation for Product, Nature and Life
# 1 in Structural Simulation
# 1 in Electromagnetic* Simulation
Investing in Fluids Simulation
Important demand for Simulation in all industries
POWER’BY 3DEXPERIENCE
* High Frequency Electromagnetic Simulation

25
Multiphysics & ScienceOur Technology
Vision
Structures Thermal Fluids Chemical
Functional
Logical
Physical(Macroscale
Continuum)
Material
Sciences
Physical(Microscale
and Below
Non-Continuum)
GeophysicsElectromagnetics Controls
Mu
ltis
cale
…Biological

26
Transportation
Cities & Homes
Health
Mobility
Infrastructure
Energy
Fluids
Fluids Simulation is fundamental for
harmonizing Product, Nature and Life
Reservoir
27
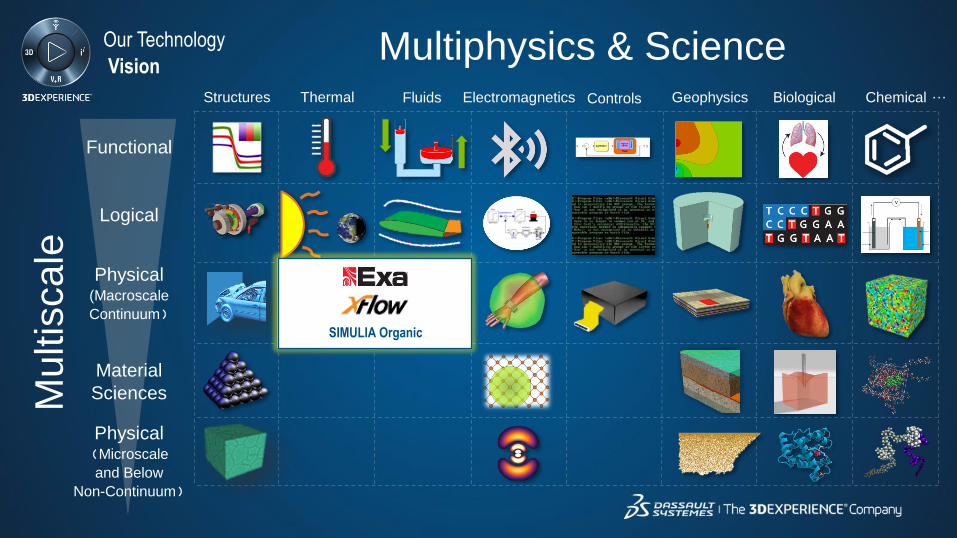
Multiphysics & ScienceOur Technology
Vision
Structures Thermal Fluids Chemical
Functional
Logical
Physical(Macroscale
Continuum)
Material
Sciences
Physical(Microscale
and Below
Non-Continuum)
GeophysicsElectromagnetics Controls
Mu
ltis
cale
…Biological
SIMULIA Organic

28
Multiphysics & ScienceOur Technology
Vision
Structures Thermal Fluids Chemical
Functional
Logical
Physical(Macroscale
Continuum)
Material
Sciences
Physical(Microscale
and Below
Non-Continuum)
GeophysicsElectromagnetics Controls
Mu
ltis
cale
…Biological
Mainstream Fluids
(Navier-Stokes)
High-fidelity Fluids
(Lattice Boltzmann)
Steady &
Mildly Unsteady
Unsteady &
Highly Dynamic
Broad
Range of
Addressable
Industry
Workflows
Fluids
29
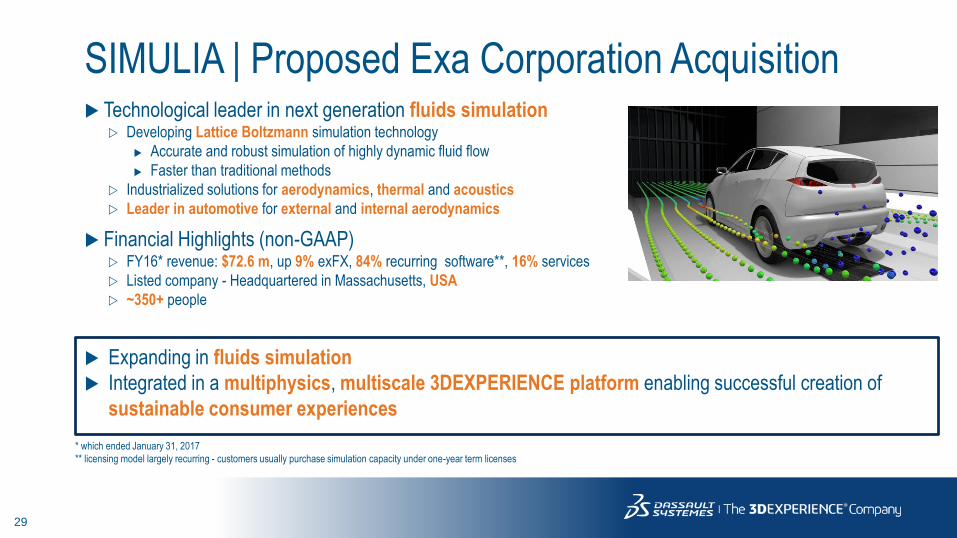
SIMULIA | Proposed Exa Corporation Acquisition Technological leader in next generation fluids simulation
Developing Lattice Boltzmann simulation technology
Accurate and robust simulation of highly dynamic fluid flow
Faster than traditional methods
Industrialized solutions for aerodynamics, thermal and acoustics
Leader in automotive for external and internal aerodynamics
Financial Highlights (non-GAAP) FY16* revenue: $72.6 m, up 9% exFX, 84% recurring software**, 16% services
Listed company - Headquartered in Massachusetts, USA
~350+ people
Expanding in fluids simulation
Integrated in a multiphysics, multiscale 3DEXPERIENCE platform enabling successful creation of
sustainable consumer experiences
* which ended January 31, 2017
** licensing model largely recurring - customers usually purchase simulation capacity under one-year term licenses
30
Q3 17 Business Review
Q3 Performance
Customer Decisions | 3DEXPERIENCE Platform
Brand Highlights | SOLIDWORKS, GEOVIA
Industry Highlights | High-Tech
SIMULIA | Exa Corporation Proposed Acquisition
CATIA | No Magic Proposed Acquisition

31
Broadening CATIA with Proposed No Magic
Acquisition to Generalize Systems Engineering
Systems
engineering
critical for the
realization of
autonomous
vehicles and
to the creation
of entirely new
customer
experiences
32
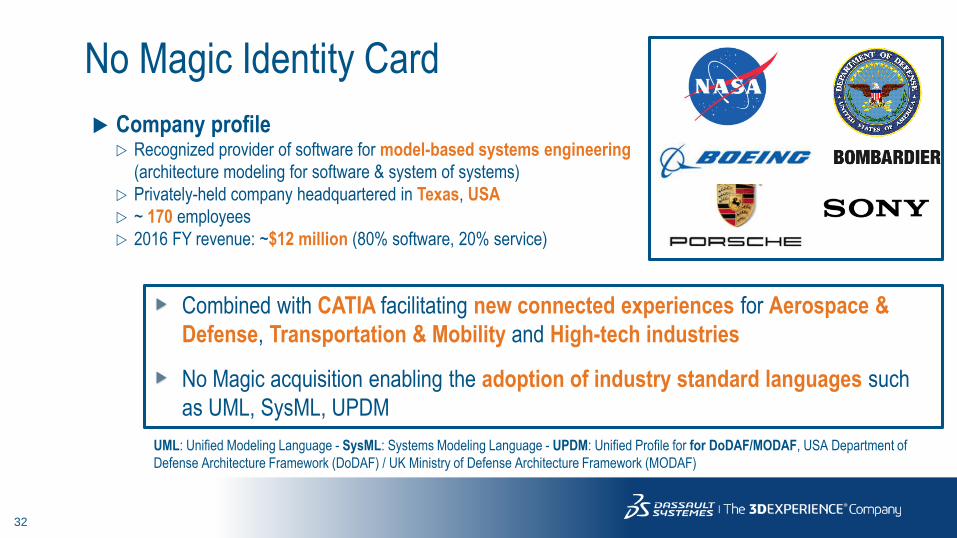
No Magic Identity Card
Company profile Recognized provider of software for model-based systems engineering
(architecture modeling for software & system of systems)
Privately-held company headquartered in Texas, USA
~ 170 employees
2016 FY revenue: ~$12 million (80% software, 20% service)
Combined with CATIA facilitating new connected experiences for Aerospace &
Defense, Transportation & Mobility and High-tech industries
No Magic acquisition enabling the adoption of industry standard languages such
as UML, SysML, UPDM
UML: Unified Modeling Language - SysML: Systems Modeling Language - UPDM: Unified Profile for for DoDAF/MODAF, USA Department of
Defense Architecture Framework (DoDAF) / UK Ministry of Defense Architecture Framework (MODAF)
33
1
Q3 & YTD 17 Financial Highlights2
Q3 & YTD 17 Business Review
3 Q4 & YTD 17 Financial Objectives
4 Financial Information Appendix
Agenda

34
2 183,02 329,2
735,5 752,9
-
500
1 000
1 500
2 000
2 500
YTD 16 YTD 17 3Q16 3Q17
Total Revenue Growth Non-IFRS
Organic revenue up 5% exFX in YTD 17
Total Revenue
in MEUR
+7% ex FX
+6.7%
+6% ex FX
+2.4%
35
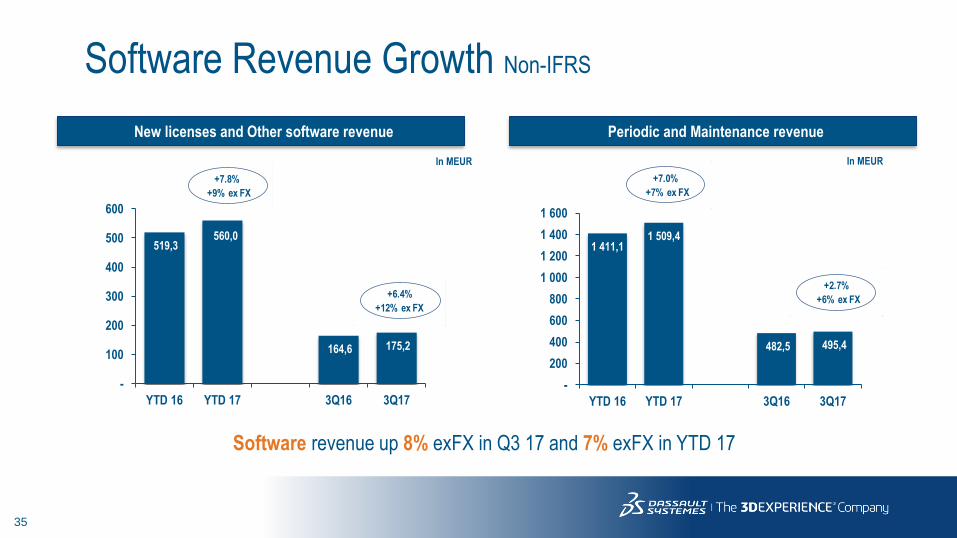
1 411,11 509,4
482,5 495,4
-
200
400
600
800
1 000
1 200
1 400
1 600
YTD 16 YTD 17 3Q16 3Q17
Software Revenue Growth Non-IFRS
Software revenue up 8% exFX in Q3 17 and 7% exFX in YTD 17
In MEUR In MEUR
New licenses and Other software revenue Periodic and Maintenance revenue
+9% ex FX
+7.8%
+12% ex FX
+6.4%
+7% ex FX
+7.0%
+6% ex FX
+2.7%
519,3560,0
164,6 175,2
-
100
200
300
400
500
600
YTD 16 YTD 17 3Q16 3Q17

36
Move to system integrators and a few delays in contracting
252,6 259,8
88,4 82,3
-
50
100
150
200
250
300
YTD 16 YTD 17 3Q16 3Q17
Services Revenue & Gross Margin Evolution Non-IFRS
Services Revenue
in MEUR
+3% ex FX
+2.9%
-3% ex FX
-6.9%
Serv. Gross Margin 9.2% 12.4% 15.8% 10.4%

37
Margin Evolution Non-IFRS
32.0% 32.0%
0.0%
-0.3%
+0.3%
31.0%
31.2%
31.4%
31.6%
31.8%
32.0%
32.2%
3Q16 Margin Currencies Activity Acquisitions 3Q17 Margin

38
1,711,79
0,63 0,64
-
0,20
0,40
0,60
0,80
1,00
1,20
1,40
1,60
1,80
2,00
YTD 16 YTD 17 3Q16 3Q17
in EUR
Diluted EPS
EPS Non-IFRS
Q3 EPS up 8% exFX
+2%
+5%
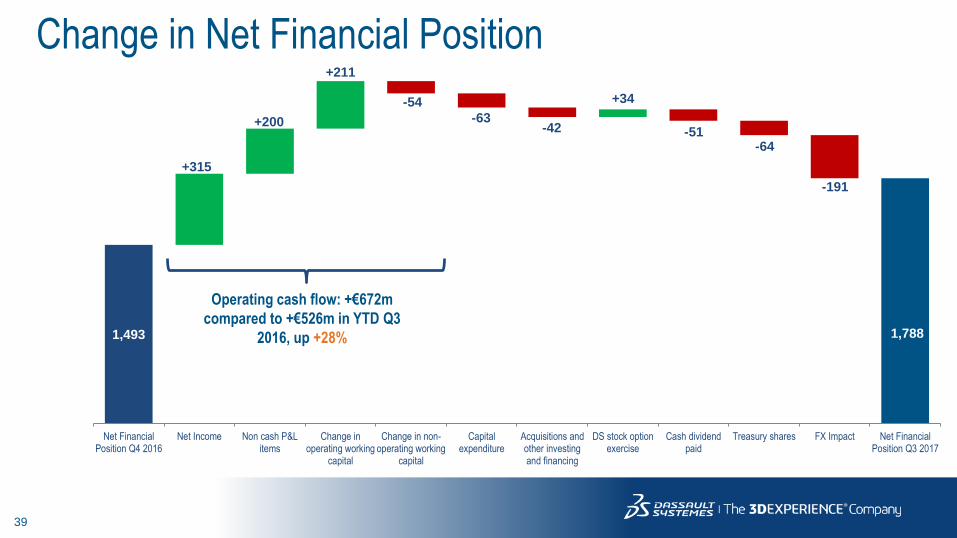
39
Operating cash flow: +€672m
compared to +€526m in YTD Q3
2016, up +28%
Change in Net Financial Position
1,493
+315
+200
+211
-54
-63-42 -51
+34
-64
-191
Net FinancialPosition Q4 2016
Net Income Non cash P&Litems
Change inoperating working
capital
Change in non-operating working
capital
Capitalexpenditure
Acquisitions andother investingand financing
DS stock optionexercise
Cash dividendpaid
Treasury shares FX Impact Net FinancialPosition Q3 2017
1,788
40
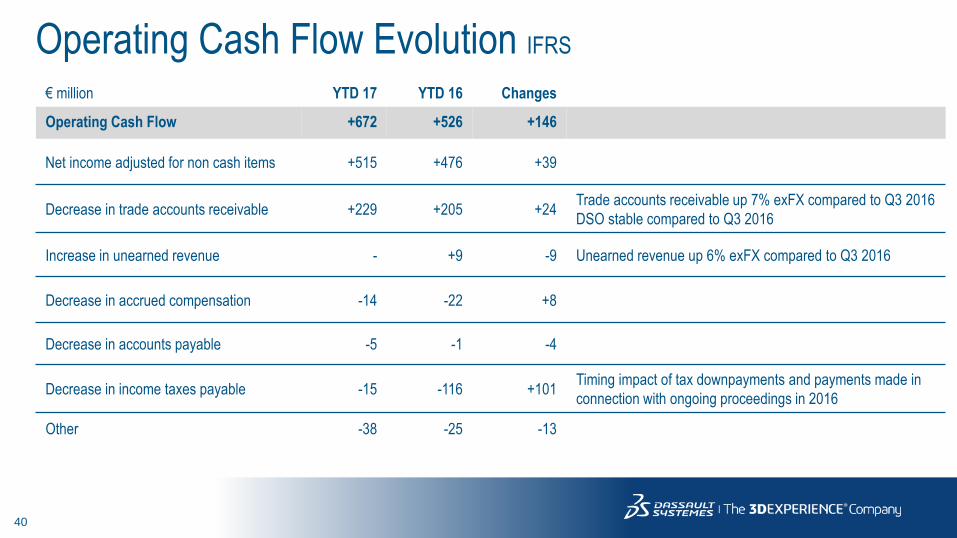
€ million YTD 17 YTD 16 Changes
Operating Cash Flow +672 +526 +146
Net income adjusted for non cash items +515 +476 +39
Decrease in trade accounts receivable +229 +205 +24Trade accounts receivable up 7% exFX compared to Q3 2016
DSO stable compared to Q3 2016
Increase in unearned revenue - +9 -9 Unearned revenue up 6% exFX compared to Q3 2016
Decrease in accrued compensation -14 -22 +8
Decrease in accounts payable -5 -1 -4
Decrease in income taxes payable -15 -116 +101Timing impact of tax downpayments and payments made in
connection with ongoing proceedings in 2016
Other -38 -25 -13
Operating Cash Flow Evolution IFRS

41
1
Q3 & YTD 17 Financial Highlights2
Q3 & YTD 17 Business Review
3 Q4 & YTD 17 Financial Objectives
4 Financial Information Appendix
Agenda

42
Merger agreement signed on September 28th, 2017
Tender offer launched on October 12th, 2017 for all issued and outstandingshares at $24.25 per share payable in cash upon completion of the offer (fullydiluted equity value of ~$400m)
Completion of the transaction is subject to Exa’ s stockholders tendering amajority of Exa’ s outstanding shares, receipt of certain regulatory approvalsand other customary closing conditions.
Assuming a completion of the acquisition in Q4 2017 adding Exa to ourfinancial objectives at Q4 earnings release in February, 2018 (accretive to ourearnings with no EPS dilution)
Key Events to Exa Corporation Timeline
43
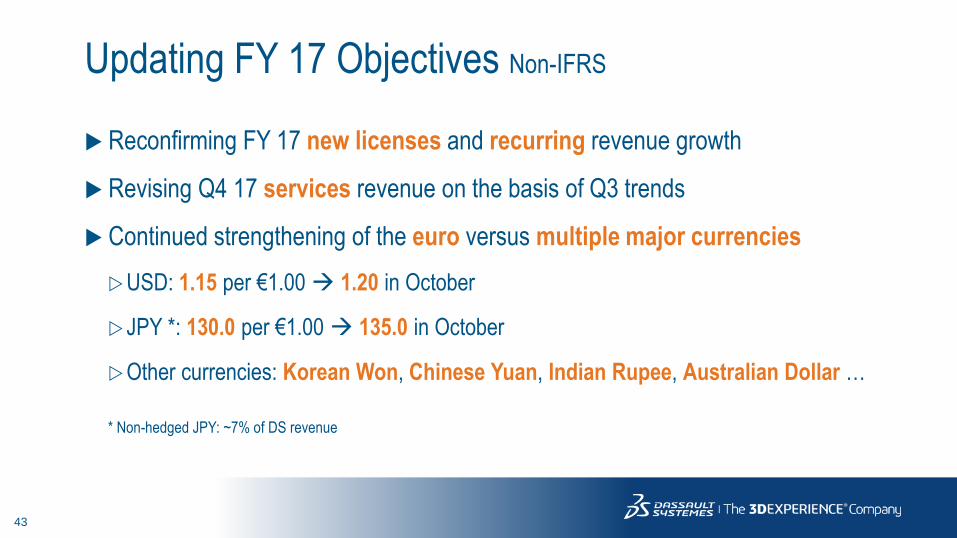
Updating FY 17 Objectives Non-IFRS
Reconfirming FY 17 new licenses and recurring revenue growth
Revising Q4 17 services revenue on the basis of Q3 trends
Continued strengthening of the euro versus multiple major currencies
USD: 1.15 per €1.00 1.20 in October
JPY *: 130.0 per €1.00 135.0 in October
Other currencies: Korean Won, Chinese Yuan, Indian Rupee, Australian Dollar …
* Non-hedged JPY: ~7% of DS revenue

44
3,240-3,265
3,185-3,205
-10
-24-9
-13 -4
3 000
3 050
3 100
3 150
3 200
3 250
3 300
InitialObj.
Q3 FX Q4 FX Q3Services
Q4Services
H2Recurring &
Other revenue
OctoberObj.
Objectives Changes from July to OctoberRevenue variation EPS variation
ex FX Growth: +6-7% ~+6%
2.62-2.662.57-2.61
-0.05
2,20
2,30
2,40
2,50
2,60
2,70
InitialObj.
FX OctoberObj.
Growth: +5-7% +3-5%
Further strengthening of
the euro versus multiple
currencies: -€34 mServices: -€22 m

45
Non-IFRS
Proposed Objectives
Q4 17:• Q4 new licenses revenue +7-13% exFX
• Q4 recurring revenue +4-5% exFX (+9% in Q4 16)
• Q4 services revenue -10% to -8% exFX
• Q4 EPS up +7-12% exFX
FY 17:• FY new licenses revenue up +8-10% exFX (unchanged)
• FY recurring revenue up +6% exFX (unchanged)
• FY services flat exFX
• FY EPS up +5-7% exFX
Q4 2017 FY 2017
Revenue (M€) 856-876 3,185-3,205
Growth -3 to -1% +4-5%
Growth ex FX +3-5% ~+6%
Operating Margin 36-37% 31-31.5%
Operating Margin Growth +1-2pts Stable
EPS (€) 0.78-0.82 2.57-2.61
EPS Growth +0-5% +3-5%
€/$ rates 1.20 1.14
€/¥ rates 135.0 127.2
46
1
Q3 & YTD 17 Financial Highlights2
Q3 & YTD 17 Business Review
3 Q4 & YTD 17 Financial Objectives
4 Financial Information Appendix
Agenda
47
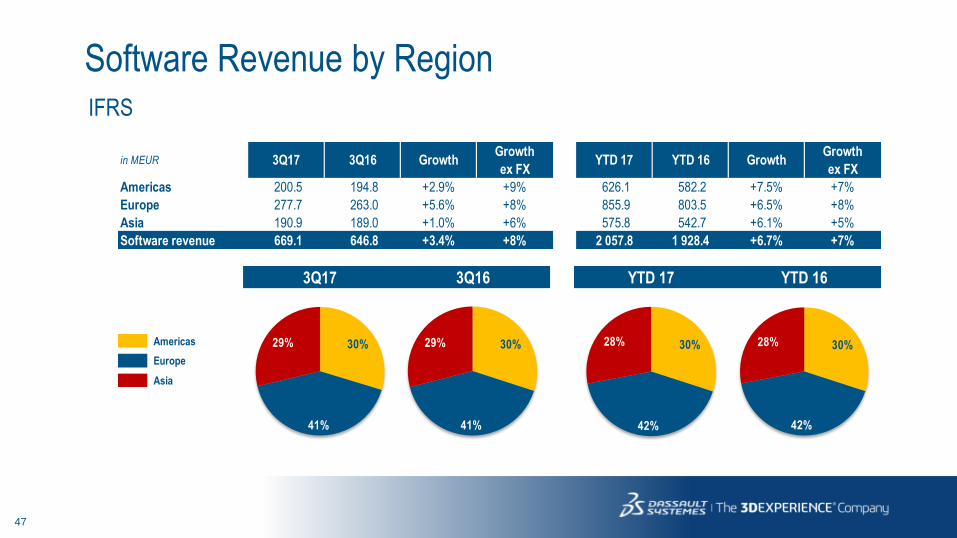
Software Revenue by RegionIFRS
Americas
Europe
Asia
in MEUR 3Q17 3Q16 GrowthGrowth
ex FXYTD 17 YTD 16 Growth
Growth
ex FX
Americas 200.5 194.8 +2.9% +9% 626.1 582.2 +7.5% +7%
Europe 277.7 263.0 +5.6% +8% 855.9 803.5 +6.5% +8%
Asia 190.9 189.0 +1.0% +6% 575.8 542.7 +6.1% +5%
Software revenue 669.1 646.8 +3.4% +8% 2 057.8 1 928.4 +6.7% +7%
3Q17 3Q16 YTD 17 YTD 16
30%
42%
28% 30%
42%
28%30%
41%
29% 30%
41%
29%
48
Software Revenue by RegionNon-IFRS
Americas
Europe
Asia
in MEUR 3Q17 3Q16 GrowthGrowth
ex FXYTD 17 YTD 16 Growth
Growth
ex FX
Americas 200.9 194.8 +3.1% +9% 629.7 583.2 +8.0% +8%
Europe 278.7 263.3 +5.8% +8% 863.2 804.2 +7.3% +8%
Asia 191.0 189.0 +1.1% +6% 576.5 543.0 +6.2% +5%
Software revenue 670.6 647.1 +3.6% +8% 2 069.4 1 930.4 +7.2% +7%
3Q17 3Q16 YTD 17 YTD 16
30%
42%
28% 30%
42%
28%30%
42%
28% 30%
41%
29%

49
Revenue by Product LineIFRS
CATIA SW
ENOVIA SW
SOLIDWORKS SW
Other SW
Services
in MEUR 3Q17 3Q16 GrowthGrowth
ex FXYTD 17 YTD 16 Growth
Growth
ex FX
CATIA SW 230.3 237.5 -3.0% -1% 716.4 703.0 +1.9% +1%
ENOVIA SW 77.6 77.0 +0.8% +5% 235.7 229.6 +2.7% +3%
SOLIDWORKS SW 166.2 152.2 +9.2% +16% 517.1 455.9 +13.4% +14%
Other SW 195.0 180.1 +8.3% +13% 588.6 539.9 +9.0% +9%
Services 82.3 88.4 -6.9% -3% 259.8 252.2 +3.0% +3%
Total revenue 751.4 735.2 +2.2% +6% 2 317.6 2 180.6 +6.3% +6%
3Q17 3Q16 YTD 17 YTD 16
32%
10%
22%
25%
11%
31%
11%
21%
25%
12%
31%
10%
22%
26%
11%
33%
10%
21%
24%
12%
50
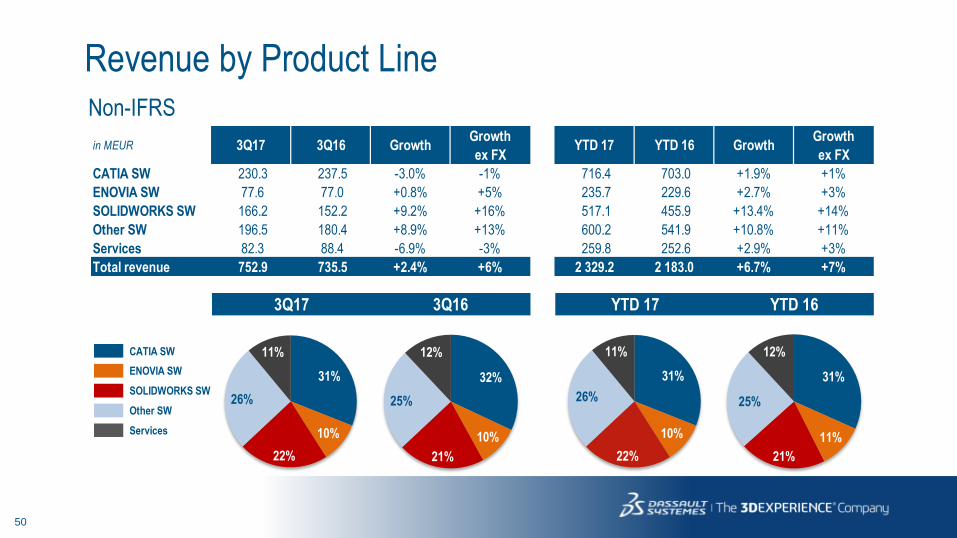
Revenue by Product LineNon-IFRS
CATIA SW
ENOVIA SW
SOLIDWORKS SW
Other SW
Services
in MEUR 3Q17 3Q16 GrowthGrowth
ex FXYTD 17 YTD 16 Growth
Growth
ex FX
CATIA SW 230.3 237.5 -3.0% -1% 716.4 703.0 +1.9% +1%
ENOVIA SW 77.6 77.0 +0.8% +5% 235.7 229.6 +2.7% +3%
SOLIDWORKS SW 166.2 152.2 +9.2% +16% 517.1 455.9 +13.4% +14%
Other SW 196.5 180.4 +8.9% +13% 600.2 541.9 +10.8% +11%
Services 82.3 88.4 -6.9% -3% 259.8 252.6 +2.9% +3%
Total revenue 752.9 735.5 +2.4% +6% 2 329.2 2 183.0 +6.7% +7%
3Q17 3Q16 YTD 17 YTD 16
31%
10%
22%
26%
11%
31%
10%
22%
26%
11%
31%
11%
21%
25%
12%
32%
10%
21%
25%
12%
51
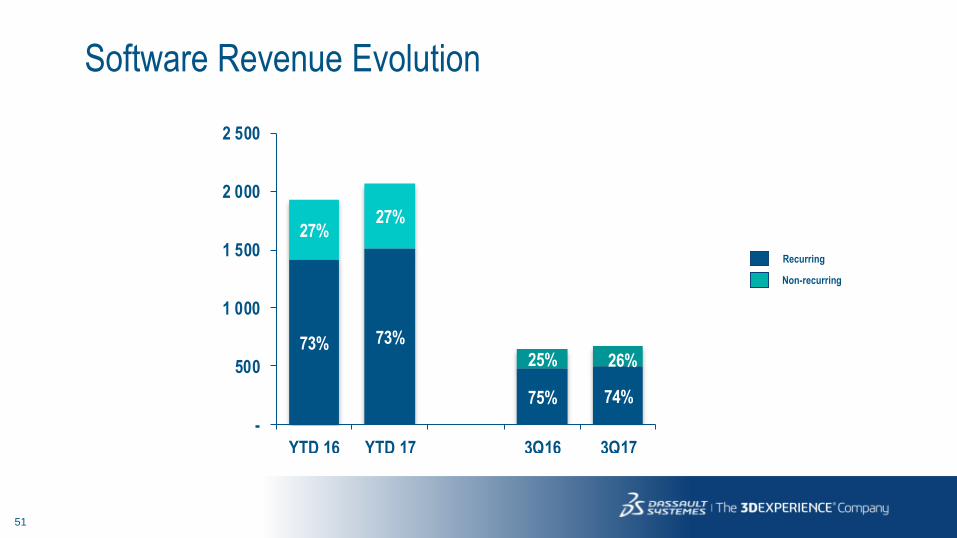
Software Revenue Evolution
Recurring
Non-recurring
73% 73%
75% 74%
27%27%
25% 26%
-
500
1 000
1 500
2 000
2 500
YTD 16 YTD 17 3Q16 3Q17

52
IFRS P&L Three months ended September 30, Nine months months ended September 30,
(In millions of €, except per share data) 2017 2016 YoY 2017 2016 YoY
Software revenue 669.1 646.8 +3.4% 2,057.8 1,928.4 +6.7%
New licenses and Other software revenue 175.2 164.6 +6.4% 560.0 518.7 +8.0%
Periodic and Maintenance revenue 493.9 482.2 +2.4% 1,497.8 1,409.7 +6.2%
Service and other revenue 82.3 88.4 -6.9% 259.8 252.2 +3.0%
Total revenue 751.4 735.2 +2.2% 2,317.6 2,180.6 +6.3%
Cost of Software revenue (38.0) (36.9) +3.0% (116.4) (112.1) +3.8%
Cost of Service and other revenue (72.7) (74.6) -2.5% (234.5) (230.4) +1.8%
Research and development (140.6) (131.8) +6.7% (446.5) (401.0) +11.3%
Marketing and sales (232.1) (224.1) +3.6% (750.4) (684.1) +9.7%
General and administrative (60.5) (56.3) +7.5% (182.3) (166.7) +9.4%
Amortization of acquired intangibles (39.1) (37.8) +3.4% (119.6) (115.2) +3.8%
Other operating income and expense, net (8.5) (12.8) -33.6% (19.1) (26.3) -27.4%
Total operating expenses (591.5) (574.3) +3.0% (1,868.8) (1,735.8) +7.7%
Operating income 159.9 160.9 -0.6% 448.8 444.8 +0.9%
Financial revenue and other, net (1.6) (0.8) +100.0% 20.9 (17.6) N/A
Income tax expense (52.1) (45.1) +15.5% (154.2) (118.6) +30.0%
Non-controlling interest 0.3 (1.9) N/A (1.0) (4.3) -76.7%
Net Income (to equity holders of the parent) 106.5 113.1 -5.8% 314.5 304.3 +3.4%
Diluted net income per share (EPS) 0.41 0.44 -6.8% 1.22 1.18 +3.4%
Average diluted shares (Million) 258.5 257.7 258.0 257.4
53
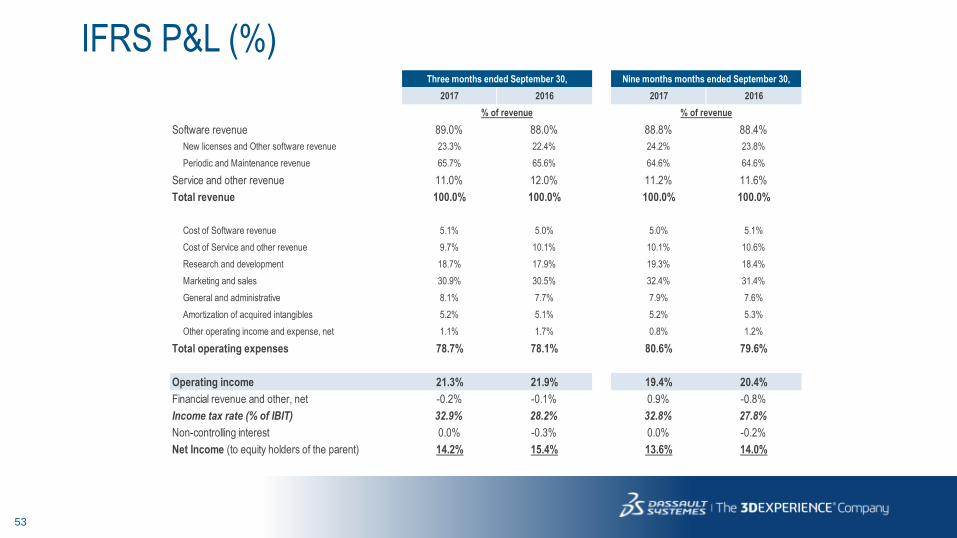
IFRS P&L (%) Three months ended September 30, Nine months months ended September 30,
2017 2016 2017 2016
% of revenue % of revenue
Software revenue 89.0% 88.0% 88.8% 88.4%
New licenses and Other software revenue 23.3% 22.4% 24.2% 23.8%
Periodic and Maintenance revenue 65.7% 65.6% 64.6% 64.6%
Service and other revenue 11.0% 12.0% 11.2% 11.6%
Total revenue 100.0% 100.0% 100.0% 100.0%
Cost of Software revenue 5.1% 5.0% 5.0% 5.1%
Cost of Service and other revenue 9.7% 10.1% 10.1% 10.6%
Research and development 18.7% 17.9% 19.3% 18.4%
Marketing and sales 30.9% 30.5% 32.4% 31.4%
General and administrative 8.1% 7.7% 7.9% 7.6%
Amortization of acquired intangibles 5.2% 5.1% 5.2% 5.3%
Other operating income and expense, net 1.1% 1.7% 0.8% 1.2%
Total operating expenses 78.7% 78.1% 80.6% 79.6%
Operating income 21.3% 21.9% 19.4% 20.4%
Financial revenue and other, net -0.2% -0.1% 0.9% -0.8%
Income tax rate (% of IBIT) 32.9% 28.2% 32.8% 27.8%
Non-controlling interest 0.0% -0.3% 0.0% -0.2%
Net Income (to equity holders of the parent) 14.2% 15.4% 13.6% 14.0%
54
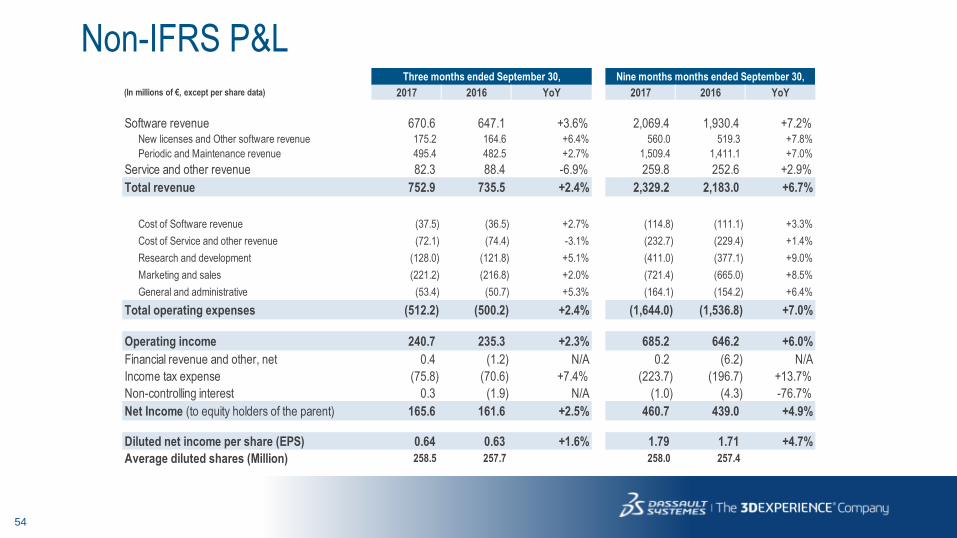
Non-IFRS P&L Three months ended September 30, Nine months months ended September 30,
(In millions of €, except per share data) 2017 2016 YoY 2017 2016 YoY
Software revenue 670.6 647.1 +3.6% 2,069.4 1,930.4 +7.2%New licenses and Other software revenue 175.2 164.6 +6.4% 560.0 519.3 +7.8%
Periodic and Maintenance revenue 495.4 482.5 +2.7% 1,509.4 1,411.1 +7.0%
Service and other revenue 82.3 88.4 -6.9% 259.8 252.6 +2.9%
Total revenue 752.9 735.5 +2.4% 2,329.2 2,183.0 +6.7%
Cost of Software revenue (37.5) (36.5) +2.7% (114.8) (111.1) +3.3%
Cost of Service and other revenue (72.1) (74.4) -3.1% (232.7) (229.4) +1.4%
Research and development (128.0) (121.8) +5.1% (411.0) (377.1) +9.0%
Marketing and sales (221.2) (216.8) +2.0% (721.4) (665.0) +8.5%
General and administrative (53.4) (50.7) +5.3% (164.1) (154.2) +6.4%
Total operating expenses (512.2) (500.2) +2.4% (1,644.0) (1,536.8) +7.0%
Operating income 240.7 235.3 +2.3% 685.2 646.2 +6.0%
Financial revenue and other, net 0.4 (1.2) N/A 0.2 (6.2) N/A
Income tax expense (75.8) (70.6) +7.4% (223.7) (196.7) +13.7%
Non-controlling interest 0.3 (1.9) N/A (1.0) (4.3) -76.7%
Net Income (to equity holders of the parent) 165.6 161.6 +2.5% 460.7 439.0 +4.9%
Diluted net income per share (EPS) 0.64 0.63 +1.6% 1.79 1.71 +4.7%
Average diluted shares (Million) 258.5 257.7 258.0 257.4
55
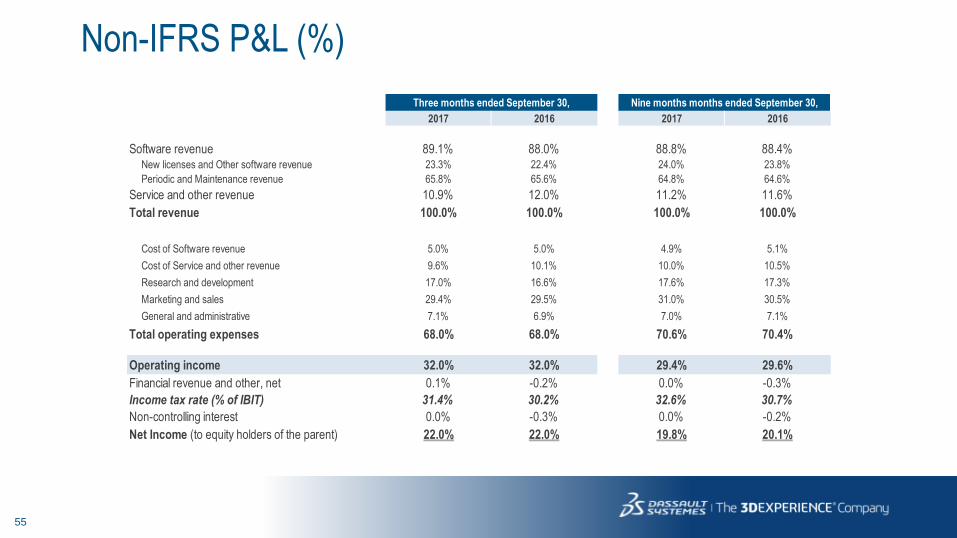
Non-IFRS P&L (%)
Three months ended September 30, Nine months months ended September 30,
2017 2016 2017 2016
Software revenue 89.1% 88.0% 88.8% 88.4%New licenses and Other software revenue 23.3% 22.4% 24.0% 23.8%
Periodic and Maintenance revenue 65.8% 65.6% 64.8% 64.6%
Service and other revenue 10.9% 12.0% 11.2% 11.6%
Total revenue 100.0% 100.0% 100.0% 100.0%
Cost of Software revenue 5.0% 5.0% 4.9% 5.1%
Cost of Service and other revenue 9.6% 10.1% 10.0% 10.5%
Research and development 17.0% 16.6% 17.6% 17.3%
Marketing and sales 29.4% 29.5% 31.0% 30.5%
General and administrative 7.1% 6.9% 7.0% 7.1%
Total operating expenses 68.0% 68.0% 70.6% 70.4%
Operating income 32.0% 32.0% 29.4% 29.6%
Financial revenue and other, net 0.1% -0.2% 0.0% -0.3%
Income tax rate (% of IBIT) 31.4% 30.2% 32.6% 30.7%
Non-controlling interest 0.0% -0.3% 0.0% -0.2%
Net Income (to equity holders of the parent) 22.0% 22.0% 19.8% 20.1%
56
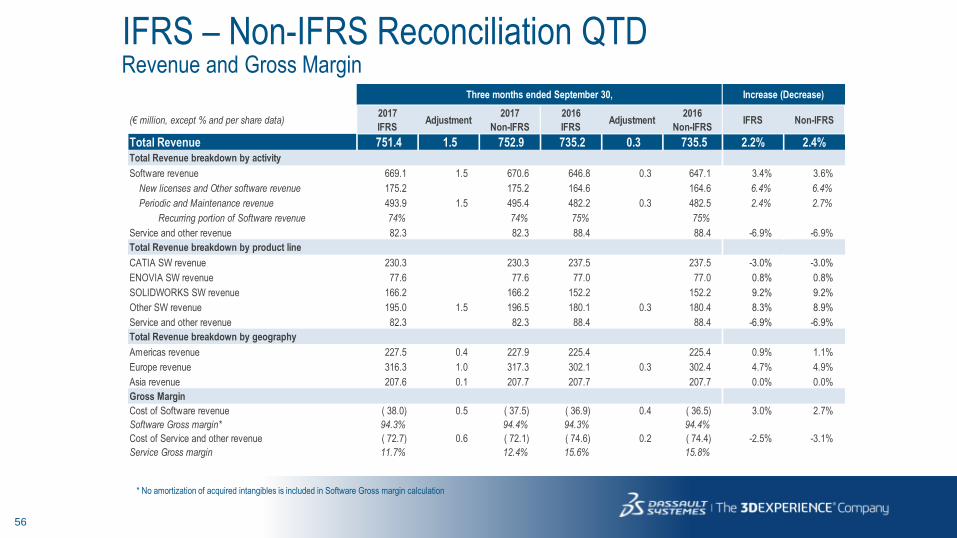
Revenue and Gross Margin
IFRS – Non-IFRS Reconciliation QTD
* No amortization of acquired intangibles is included in Software Gross margin calculation
(€ million, except % and per share data)2017
IFRSAdjustment
2017
Non-IFRS
2016
IFRSAdjustment
2016
Non-IFRSIFRS Non-IFRS
Total Revenue 751.4 1.5 752.9 735.2 0.3 735.5 2.2% 2.4%Total Revenue breakdown by activity
Software revenue 669.1 1.5 670.6 646.8 0.3 647.1 3.4% 3.6%
New licenses and Other software revenue 175.2 175.2 164.6 164.6 6.4% 6.4%
Periodic and Maintenance revenue 493.9 1.5 495.4 482.2 0.3 482.5 2.4% 2.7%
Recurring portion of Software revenue 74% 74% 75% 75%
Service and other revenue 82.3 82.3 88.4 88.4 -6.9% -6.9%
Total Revenue breakdown by product line
CATIA SW revenue 230.3 230.3 237.5 237.5 -3.0% -3.0%
ENOVIA SW revenue 77.6 77.6 77.0 77.0 0.8% 0.8%
SOLIDWORKS SW revenue 166.2 166.2 152.2 152.2 9.2% 9.2%
Other SW revenue 195.0 1.5 196.5 180.1 0.3 180.4 8.3% 8.9%
Service and other revenue 82.3 82.3 88.4 88.4 -6.9% -6.9%
Total Revenue breakdown by geography
Americas revenue 227.5 0.4 227.9 225.4 225.4 0.9% 1.1%
Europe revenue 316.3 1.0 317.3 302.1 0.3 302.4 4.7% 4.9%
Asia revenue 207.6 0.1 207.7 207.7 207.7 0.0% 0.0%
Gross Margin
Cost of Software revenue ( 38.0) 0.5 ( 37.5) ( 36.9) 0.4 ( 36.5) 3.0% 2.7%
Software Gross margin* 94.3% 94.4% 94.3% 94.4%
Cost of Service and other revenue ( 72.7) 0.6 ( 72.1) ( 74.6) 0.2 ( 74.4) -2.5% -3.1%
Service Gross margin 11.7% 12.4% 15.6% 15.8%
Three months ended September 30, Increase (Decrease)
57
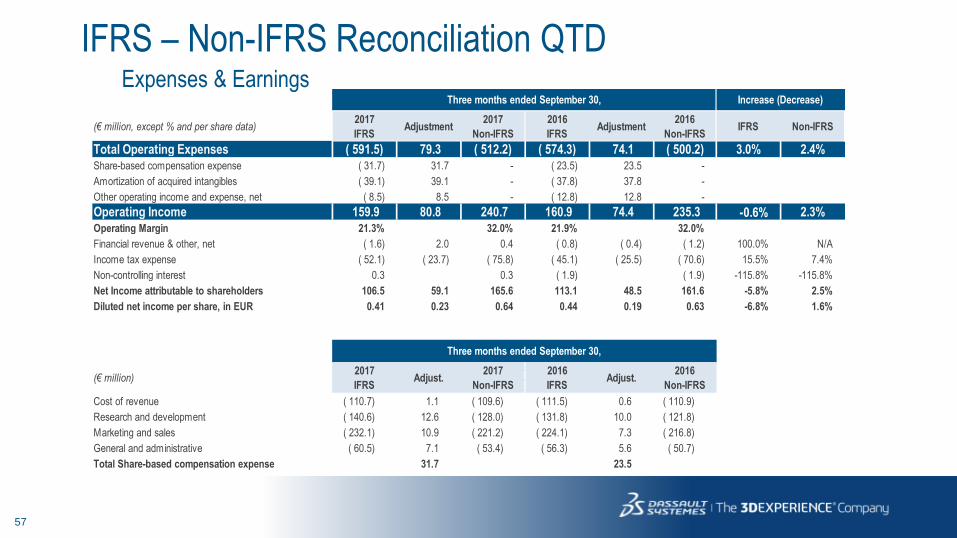
Expenses & Earnings
IFRS – Non-IFRS Reconciliation QTD
(€ million, except % and per share data)2017
IFRSAdjustment
2017
Non-IFRS
2016
IFRSAdjustment
2016
Non-IFRSIFRS Non-IFRS
Total Operating Expenses ( 591.5) 79.3 ( 512.2) ( 574.3) 74.1 ( 500.2) 3.0% 2.4%Share-based compensation expense ( 31.7) 31.7 - ( 23.5) 23.5 -
Amortization of acquired intangibles ( 39.1) 39.1 - ( 37.8) 37.8 -
Other operating income and expense, net ( 8.5) 8.5 - ( 12.8) 12.8 -
Operating Income 159.9 80.8 240.7 160.9 74.4 235.3 -0.6% 2.3%Operating Margin 21.3% 32.0% 21.9% 32.0%
Financial revenue & other, net ( 1.6) 2.0 0.4 ( 0.8) ( 0.4) ( 1.2) 100.0% N/A
Income tax expense ( 52.1) ( 23.7) ( 75.8) ( 45.1) ( 25.5) ( 70.6) 15.5% 7.4%
Non-controlling interest 0.3 0.3 ( 1.9) ( 1.9) -115.8% -115.8%
Net Income attributable to shareholders 106.5 59.1 165.6 113.1 48.5 161.6 -5.8% 2.5%
Diluted net income per share, in EUR 0.41 0.23 0.64 0.44 0.19 0.63 -6.8% 1.6%
(€ million)2017
IFRSAdjust.
2017
Non-IFRS
2016
IFRSAdjust.
2016
Non-IFRS
Cost of revenue ( 110.7) 1.1 ( 109.6) ( 111.5) 0.6 ( 110.9)
Research and development ( 140.6) 12.6 ( 128.0) ( 131.8) 10.0 ( 121.8)
Marketing and sales ( 232.1) 10.9 ( 221.2) ( 224.1) 7.3 ( 216.8)
General and administrative ( 60.5) 7.1 ( 53.4) ( 56.3) 5.6 ( 50.7)
Total Share-based compensation expense 31.7 23.5
Three months ended September 30, Increase (Decrease)
Three months ended September 30,

58
Revenue and Gross Margin
IFRS – Non-IFRS Reconciliation YTD
* No amortization of acquired intangibles is included in Software Gross margin calculation
(€ million, except % and per share data)2017
IFRSAdjustment
2017
Non-IFRS
2016
IFRSAdjustment
2016
Non-IFRSIFRS Non-IFRS
Total Revenue 2 317.6 11.6 2 329.2 2 180.6 2.4 2 183.0 6.3% 6.7%Total Revenue breakdown by activity
Software revenue 2 057.8 11.6 2 069.4 1 928.4 2.0 1 930.4 6.7% 7.2%
New licenses and Other software revenue 560.0 560.0 518.7 0.6 519.3 8.0% 7.8%
Periodic and Maintenance revenue 1 497.8 11.6 1 509.4 1 409.7 1.4 1 411.1 6.2% 7.0%
Recurring portion of Software revenue 73% 73% 73% 73%
Service and other revenue 259.8 259.8 252.2 0.4 252.6 3.0% 2.9%
Total Revenue breakdown by product line
CATIA SW revenue 716.4 716.4 703.0 703.0 1.9% 1.9%
ENOVIA SW revenue 235.7 235.7 229.6 229.6 2.7% 2.7%
SOLIDWORKS SW revenue 517.1 517.1 455.9 455.9 13.4% 13.4%
Other SW revenue 588.6 11.6 600.2 539.9 2.0 541.9 9.0% 10.8%
Service and other revenue 259.8 259.8 252.2 0.4 252.6 3.0% 2.9%
Total Revenue breakdown by geography
Americas revenue 718.2 3.5 721.7 673.6 1.2 674.8 6.6% 7.0%
Europe revenue 970.2 7.3 977.5 914.7 0.8 915.5 6.1% 6.8%
Asia revenue 629.2 0.8 630.0 592.3 0.4 592.7 6.2% 6.3%
Gross Margin
Cost of Software revenue ( 116.4) 1.6 ( 114.8) ( 112.1) 1.0 ( 111.1) 3.8% 3.3%
Software Gross margin* 94.3% 94.5% 94.2% 94.2%
Cost of Service and other revenue ( 234.5) 1.8 ( 232.7) ( 230.4) 1.0 ( 229.4) 1.8% 1.4%
Service Gross margin 9.7% 10.4% 8.6% 9.2%
Increase (Decrease)Nine months months ended September 30,
59
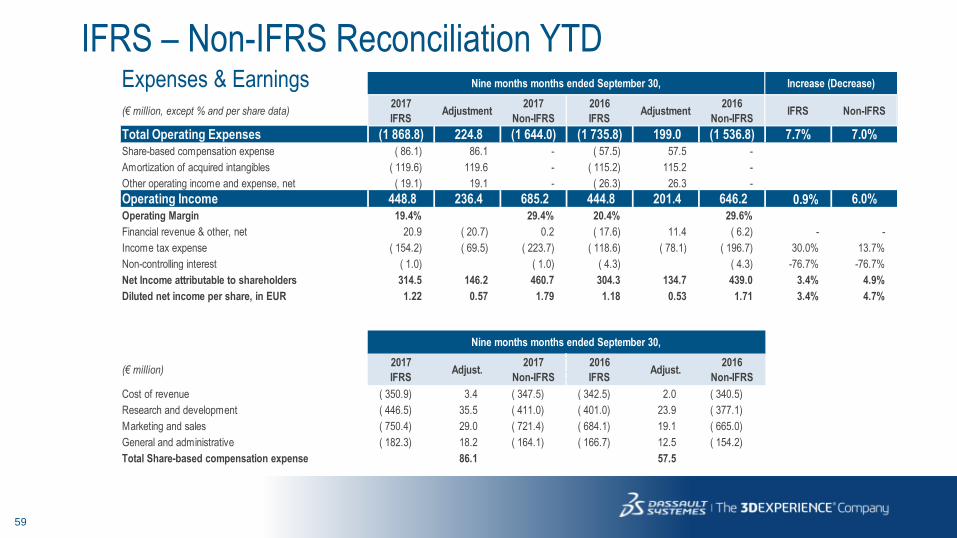
Expenses & Earnings
IFRS – Non-IFRS Reconciliation YTD
(€ million, except % and per share data)2017
IFRSAdjustment
2017
Non-IFRS
2016
IFRSAdjustment
2016
Non-IFRSIFRS Non-IFRS
Total Operating Expenses (1 868.8) 224.8 (1 644.0) (1 735.8) 199.0 (1 536.8) 7.7% 7.0%Share-based compensation expense ( 86.1) 86.1 - ( 57.5) 57.5 -
Amortization of acquired intangibles ( 119.6) 119.6 - ( 115.2) 115.2 -
Other operating income and expense, net ( 19.1) 19.1 - ( 26.3) 26.3 -
Operating Income 448.8 236.4 685.2 444.8 201.4 646.2 0.9% 6.0%Operating Margin 19.4% 29.4% 20.4% 29.6%
Financial revenue & other, net 20.9 ( 20.7) 0.2 ( 17.6) 11.4 ( 6.2) - -
Income tax expense ( 154.2) ( 69.5) ( 223.7) ( 118.6) ( 78.1) ( 196.7) 30.0% 13.7%
Non-controlling interest ( 1.0) ( 1.0) ( 4.3) ( 4.3) -76.7% -76.7%
Net Income attributable to shareholders 314.5 146.2 460.7 304.3 134.7 439.0 3.4% 4.9%
Diluted net income per share, in EUR 1.22 0.57 1.79 1.18 0.53 1.71 3.4% 4.7%
(€ million)2017
IFRSAdjust.
2017
Non-IFRS
2016
IFRSAdjust.
2016
Non-IFRS
Cost of revenue ( 350.9) 3.4 ( 347.5) ( 342.5) 2.0 ( 340.5)
Research and development ( 446.5) 35.5 ( 411.0) ( 401.0) 23.9 ( 377.1)
Marketing and sales ( 750.4) 29.0 ( 721.4) ( 684.1) 19.1 ( 665.0)
General and administrative ( 182.3) 18.2 ( 164.1) ( 166.7) 12.5 ( 154.2)
Total Share-based compensation expense 86.1 57.5
Nine months months ended September 30, Increase (Decrease)
Nine months months ended September 30,

60
Financial Revenue and Other Non-IFRS
MEUR 3Q17 3Q16 var YTD 17 YTD 16 var
Interest Income 7.6 3.9 3.7 18.6 12.8 5.8
Interest Expense (3.4) (3.3) (0.1) (10.1) (9.7) (0.4)
Financial net Income 4.2 0.6 3.6 8.5 3.1 5.4
Exchange Gain / (Loss) (3.5) (1.4) (2.1) (8.7) (9.5) 0.8
Other Income / (Loss) (0.3) (0.4) 0.1 0.4 0.2 0.2
Total 0.4 (1.2) 1.6 0.2 (6.2) 6.4
61
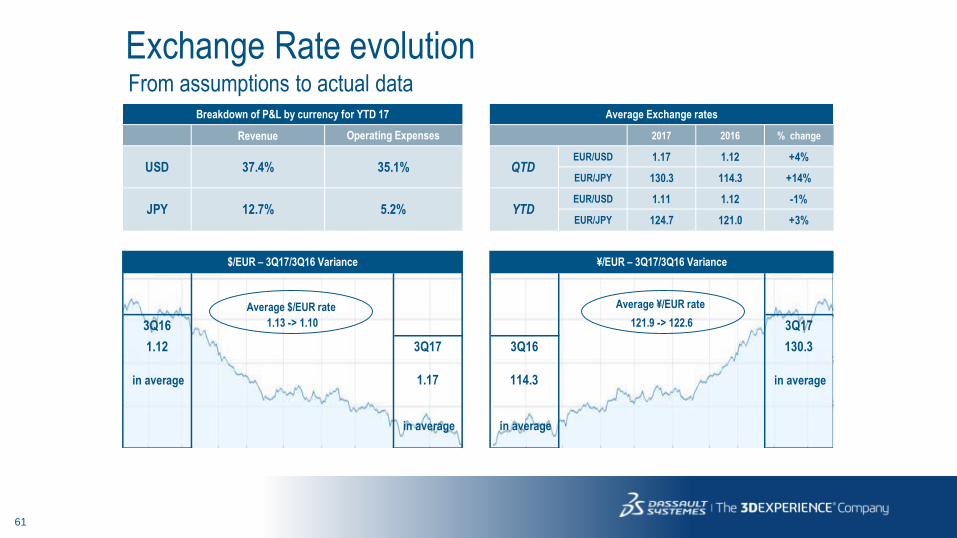
Revenue 2017 2016 % change
EUR/USD 1.17 1.12 +4%
EUR/JPY 130.3 114.3 +14%
EUR/USD 1.11 1.12 -1%
EUR/JPY 124.7 121.0 +3%
3Q16 3Q17
1.12 3Q17 3Q16 130.3
in average 1.17 114.3 in average
in average in average
Average ¥/EUR rate
1.13 -> 1.10 121.9 -> 122.6
Average $/EUR rate
Operating Expenses
35.1%
5.2%
$/EUR – 3Q17/3Q16 Variance ¥/EUR – 3Q17/3Q16 Variance
JPY
Average Exchange rates
YTD
37.4%USD
Breakdown of P&L by currency for YTD 17
QTD
12.7%
Exchange Rate evolutionFrom assumptions to actual data
62
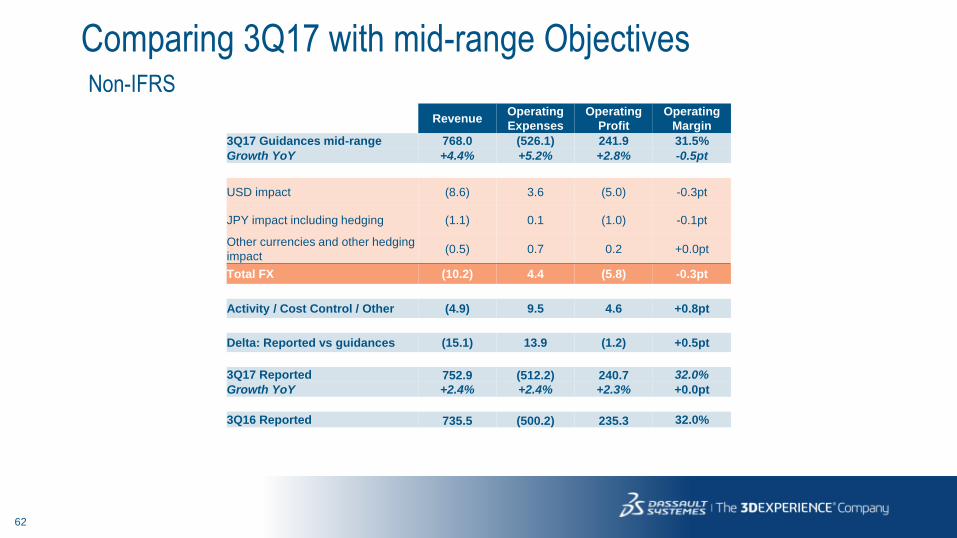
Non-IFRS
Comparing 3Q17 with mid-range Objectives
RevenueOperating
Expenses
Operating
Profit
Operating
Margin
3Q17 Guidances mid-range 768.0 (526.1) 241.9 31.5%
Growth YoY +4.4% +5.2% +2.8% -0.5pt
USD impact (8.6) 3.6 (5.0) -0.3pt
JPY impact including hedging (1.1) 0.1 (1.0) -0.1pt
Other currencies and other hedging
impact(0.5) 0.7 0.2 +0.0pt
Total FX (10.2) 4.4 (5.8) -0.3pt
Activity / Cost Control / Other (4.9) 9.5 4.6 +0.8pt
Delta: Reported vs guidances (15.1) 13.9 (1.2) +0.5pt
3Q17 Reported 752.9 (512.2) 240.7 32.0%
Growth YoY +2.4% +2.4% +2.3% +0.0pt
3Q16 Reported 735.5 (500.2) 235.3 32.0%

63
Non-IFRS
Estimated FX impact on 3Q17 Op. Results
€ millions QTDTotal
Revenue
Operating
Expenses
Operating
Income
Operating
Margin
3Q17 Reported 752.9 (512.2) 240.7 32.0%
3Q16 Reported 735.5 (500.2) 235.3 32.0%
Growth as reported +2.4% +2.4% +2.3% +0.0 pt
Impact of Actual Currency Rates
USD impact (18.3) 10.0 (8.3)JPY impact including hedging (5.0) 3.7 (1.3)Other currencies and other hedging
impact (4.2) 3.1 (1.1)
Total FX Impact adjustment (27.5) 16.8 (10.7)
3Q16 ex FX 708.0 (483.4) 224.6 31.7%
Growth exFX +6% +6% +7% +0.3 pt
64
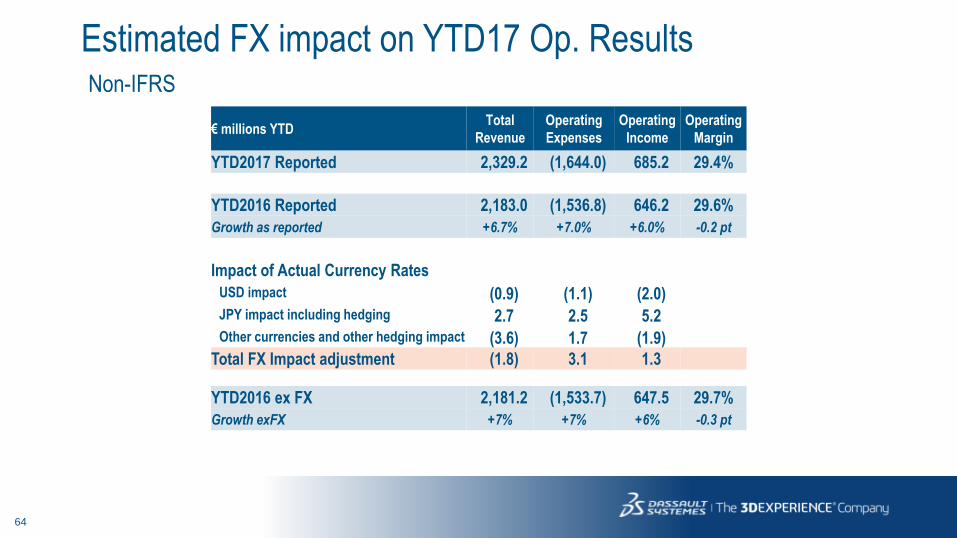
Non-IFRS
Estimated FX impact on YTD17 Op. Results
€ millions YTDTotal
Revenue
Operating
Expenses
Operating
Income
Operating
Margin
YTD2017 Reported 2,329.2 (1,644.0) 685.2 29.4%
YTD2016 Reported 2,183.0 (1,536.8) 646.2 29.6%
Growth as reported +6.7% +7.0% +6.0% -0.2 pt
Impact of Actual Currency Rates
USD impact (0.9) (1.1) (2.0)JPY impact including hedging 2.7 2.5 5.2 Other currencies and other hedging impact (3.6) 1.7 (1.9)
Total FX Impact adjustment (1.8) 3.1 1.3
YTD2016 ex FX 2,181.2 (1,533.7) 647.5 29.7%
Growth exFX +7% +7% +6% -0.3 pt

65
Consolidated Statement of Cash FlowsIFRS
(in millions of €)3Q17 3Q16 Variation 3Q17 YTD 3Q16 YTD Variation
Net income attributable to equity holders of the parent 106.5 113.1 (6.6) 314.5 304.3 10.2
Non-controlling interest (0.3) 1.9 (2.2) 1.0 4.3 (3.3)
Net income 106.2 115.0 (8.8) 315.5 308.6 6.9
Depreciation of property & equipment 13.9 10.1 3.8 36.8 31.5 5.3
Amortization of intangible assets 40.9 39.9 1.0 125.5 121.6 3.9
Other non-cash P&L items 27.1 22.2 4.9 37.5 13.4 24.1
Changes in working capital (108.7) (110.6) 1.9 156.5 50.6 105.9
Net Cash Provided by (Used in) Operating Activities (I) 79.4 76.6 2.8 671.8 525.7 146.1
Additions to property, equipment and intangibles (17.7) (13.6) (4.1) (63.5) (32.0) (31.5)
Payment for acquisition of businesses, net of cash acquired (2.8) (234.7) 231.9 (10.8) (245.9) 235.1
Sale (Purchase) of short-term investments, net (0.1) 0.7 (0.8) 3.6 20.5 (16.9)
Investments, loans and others 0.8 - 0.8 7.2 0.6 6.6
Net Cash Provided by (Used in) Investing Activities (II) (19.8) (247.6) 227.8 (63.5) (256.8) 193.3
Acquisition of non-controlling interests (23.4) - (23.4) (37.5) - (37.5)
(Purchase) Sale of treasury stock (19.2) (9.2) (10.0) (64.0) (52.5) (11.5)
Proceeds from exercise of stock-options 12.0 5.4 6.6 33.8 15.9 17.9
Cash dividend paid - - - (51.3) (101.9) 50.6
Net Cash Provided by (Used in) Financing Activities (III) (30.6) (3.8) (26.8) (119.0) (138.5) 19.5
Effect of exchange rate changes on cash and cash equivalents (IV) (56.3) (3.4) (52.9) (184.1) (3.3) (180.8)
Increase (Decrease) in Cash (V) = (I)+(II)+(III)+(IV) (27.3) (178.2) 150.9 305.2 127.1 178.1
Cash and cash equivalents at Beginning of Period 2,769.2 2,585.8 2,436.7 2,280.5
Cash and cash equivalents at End of Period 2,741.9 2,407.6 2,741.9 2,407.6
Cash and cash equivalents variation (27.3) (178.2) 305.2 127.1
66
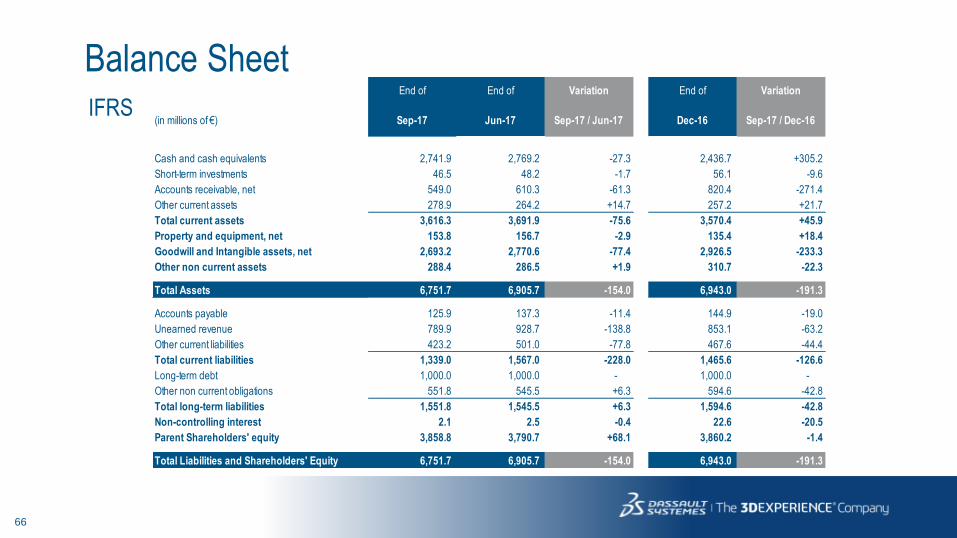
Balance SheetIFRS
End of End of Variation End of Variation Net Financial position
(in millions of €) Sep-17 Jun-17 Sep-17 / Jun-17 Dec-16 Sep-17 / Dec-16
Cash and cash equivalents 2,741.9 2,769.2 -27.3 2,436.7 +305.2
Short-term investments 46.5 48.2 -1.7 56.1 -9.6
Accounts receivable, net 549.0 610.3 -61.3 820.4 -271.4
Other current assets 278.9 264.2 +14.7 257.2 +21.7
Total current assets 3,616.3 3,691.9 -75.6 3,570.4 +45.9
Property and equipment, net 153.8 156.7 -2.9 135.4 +18.4
Goodwill and Intangible assets, net 2,693.2 2,770.6 -77.4 2,926.5 -233.3
Other non current assets 288.4 286.5 +1.9 310.7 -22.3
Total Assets 6,751.7 6,905.7 -154.0 6,943.0 -191.3
Accounts payable 125.9 137.3 -11.4 144.9 -19.0
Unearned revenue 789.9 928.7 -138.8 853.1 -63.2
Other current liabilities 423.2 501.0 -77.8 467.6 -44.4
Total current liabilities 1,339.0 1,567.0 -228.0 1,465.6 -126.6
Long-term debt 1,000.0 1,000.0 - 1,000.0 -
Other non current obligations 551.8 545.5 +6.3 594.6 -42.8
Total long-term liabilities 1,551.8 1,545.5 +6.3 1,594.6 -42.8
Non-controlling interest 2.1 2.5 -0.4 22.6 -20.5
Parent Shareholders' equity 3,858.8 3,790.7 +68.1 3,860.2 -1.4
Total Liabilities and Shareholders' Equity 6,751.7 6,905.7 -154.0 6,943.0 -191.3
67
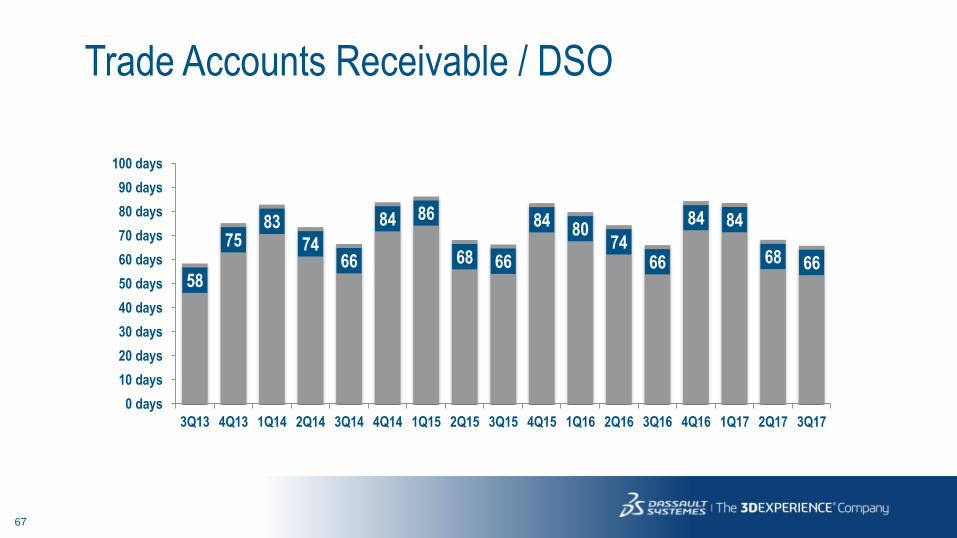
58
7583
7466
84 86
68 66
8480
7466
84 84
68 66
0 days
10 days
20 days
30 days
40 days
50 days
60 days
70 days
80 days
90 days
100 days
3Q13 4Q13 1Q14 2Q14 3Q14 4Q14 1Q15 2Q15 3Q15 4Q15 1Q16 2Q16 3Q16 4Q16 1Q17 2Q17 3Q17
Trade Accounts Receivable / DSO

68
Headcount by Destination
At Closing - TOTAL
3Q17 3Q16 % growth 2Q17 % growth
M&S + COR Ser 7,663 7,375 +4% 7,621 +1%
R&D + COR SW 6,459 6,235 +4% 6,463 -0%
G&A 1,440 1,311 +10% 1,372 +5%
Total 15,562 14,921 +4% 15,456 +1%

69
Accounting elements not included in the non-IFRS 2017 Objectives
IFRS 2017 Objectives
FY 2017 estimated deferred revenue write-down of ~€12m
FY 2017 estimated share-based compensation expenses, including related social charges: ~€108m
FY 2017 estimated amortization of acquired intangibles: ~€158m
The non-IFRS 2017 objectives do not include any impact from other operating income and expense, net
principally comprised of acquisition, integration and restructuring expenses, and from one-time items
included in financial revenue and one-time tax restructuring gains and losses
These estimates do not include any new stock option or share grants, or any new acquisitions or
restructurings completed after October 25, 2017.

70


![Allied Telesis Management Framework (AMF)forum.alliedtelesis.ru/MY/Presentations/2016/AlliedTelesis_AMF_Demo_ru.pdf · Allied Telesis Management Framework (AMF) [ ] AMF Member AMF](https://img.pdfslide.us/doc/110x75/5e88bb8ee2fad2109a7792f5/allied-telesis-management-framework-amfforum-allied-telesis-management-framework.jpg)