Embed Size (px)
Citation preview
0
Company No. 380410-P
Freight Management Holdings Bhd (Company No. 380410-P)
(Incorporated in Malaysia under the Companies Act, 1965)
Renounceable rights issue of up to 57,000,000 rights shares on the basis of 1
right share for every 3 existing FMHB shares held as at 5.00 pm on 17 MAY
2016, together with up to 19,000,000 warrants on the basis of 1 warrant for
every 3 rights shares subscribed for, at an issue price of RM0.89 per rights
share.
Principal Advisors
T- Journe Investment Berhad
Eloise Ewe Xiao Yun CEA 130015
Lim Whye Kiat CEA 130045
Najwa Anati Nazlan CEA 130057
Sim Hui Ling CEA 130081
IMPORTANT RELEVANT DATES AND TIMES: Entitlement Date : Tuesday, 17 May 2016 at 5:00 p.m. Last date and time for the sale of Provisional Allotments : Friday, 13 May 2016 at 5:00 p.m. Last date and time for the transfer of Provisional Allotments : Friday, 27 May 2016 at 4:00 p.m. Last date and time for acceptance and payment : Monday, 1 June 2016 at 5:00 p.m. Last date and time for application and payment for Excess Rights :Monday, 1 June 2016 at 5:00 p.m.
1
Company No. 380410-P
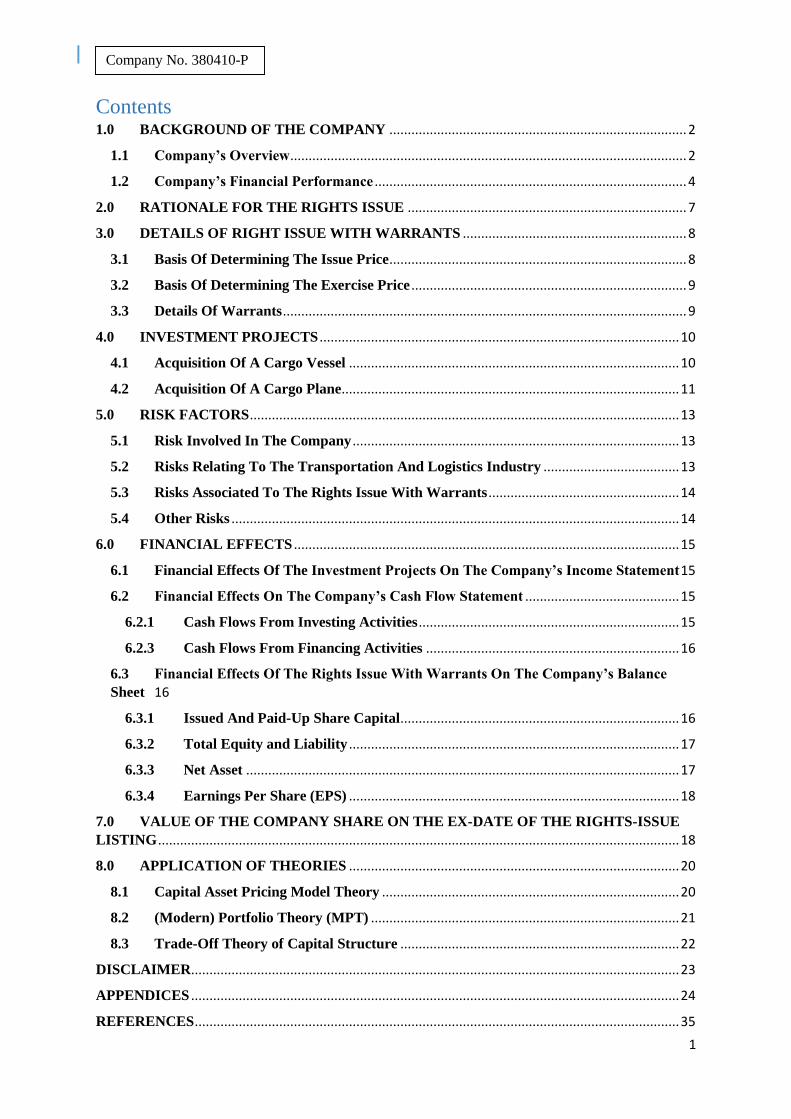
Contents
1.0 BACKGROUND OF THE COMPANY ................................................................................. 2
1.1 Company’s Overview ............................................................................................................ 2
1.2 Company’s Financial Performance ..................................................................................... 4
2.0 RATIONALE FOR THE RIGHTS ISSUE ............................................................................ 7
3.0 DETAILS OF RIGHT ISSUE WITH WARRANTS ............................................................. 8
3.1 Basis Of Determining The Issue Price ................................................................................. 8
3.2 Basis Of Determining The Exercise Price ........................................................................... 9
3.3 Details Of Warrants .............................................................................................................. 9
4.0 INVESTMENT PROJECTS .................................................................................................. 10
4.1 Acquisition Of A Cargo Vessel .......................................................................................... 10
4.2 Acquisition Of A Cargo Plane ............................................................................................ 11
5.0 RISK FACTORS ..................................................................................................................... 13
5.1 Risk Involved In The Company ......................................................................................... 13
5.2 Risks Relating To The Transportation And Logistics Industry ..................................... 13
5.3 Risks Associated To The Rights Issue With Warrants .................................................... 14
5.4 Other Risks .......................................................................................................................... 14
6.0 FINANCIAL EFFECTS ......................................................................................................... 15
6.1 Financial Effects Of The Investment Projects On The Company’s Income Statement 15
6.2 Financial Effects On The Company’s Cash Flow Statement .......................................... 15
6.2.1 Cash Flows From Investing Activities ....................................................................... 15
6.2.3 Cash Flows From Financing Activities ..................................................................... 16
6.3 Financial Effects Of The Rights Issue With Warrants On The Company’s Balance
Sheet 16
6.3.1 Issued And Paid-Up Share Capital ............................................................................ 16
6.3.2 Total Equity and Liability .......................................................................................... 17
6.3.3 Net Asset ...................................................................................................................... 17
6.3.4 Earnings Per Share (EPS) .......................................................................................... 18
7.0 VALUE OF THE COMPANY SHARE ON THE EX-DATE OF THE RIGHTS-ISSUE
LISTING .............................................................................................................................................. 18
8.0 APPLICATION OF THEORIES .......................................................................................... 20
8.1 Capital Asset Pricing Model Theory ................................................................................. 20
8.2 (Modern) Portfolio Theory (MPT) .................................................................................... 21
8.3 Trade-Off Theory of Capital Structure ............................................................................ 22
DISCLAIMER..................................................................................................................................... 23
APPENDICES ..................................................................................................................................... 24
REFERENCES .................................................................................................................................... 35
2
Company No. 380410-P
1.0 BACKGROUND OF THE COMPANY
1.1 Company’s Overview
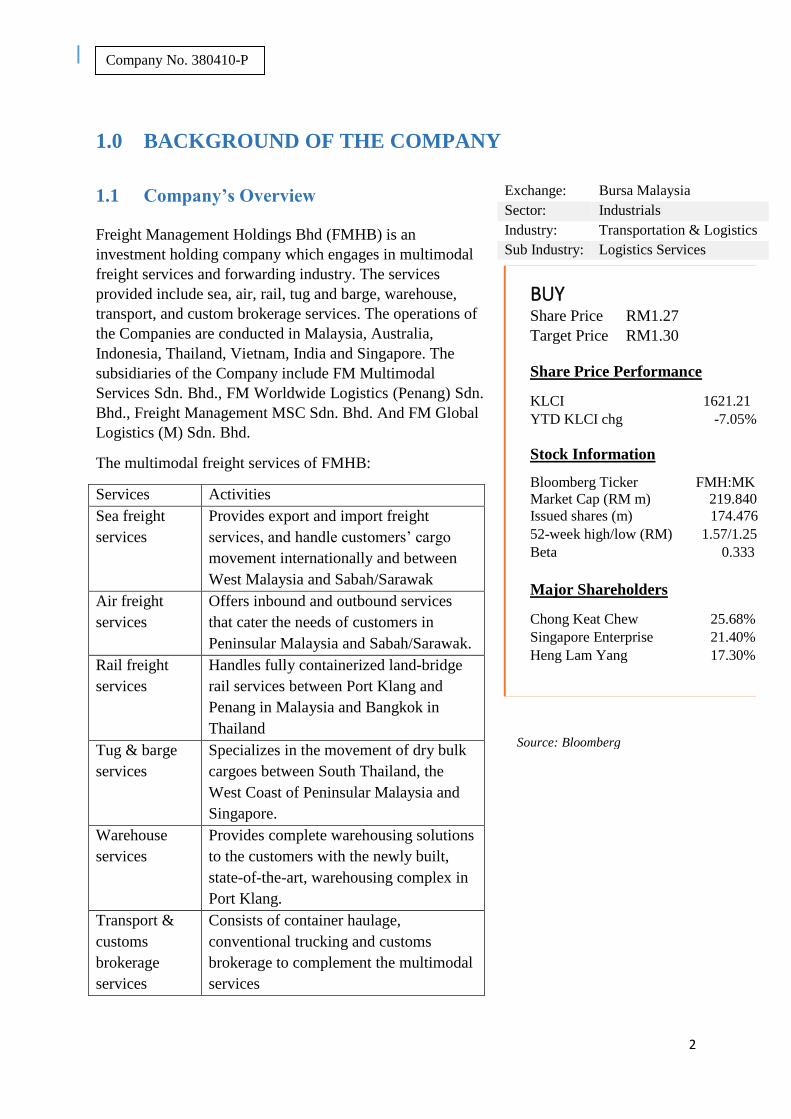
Freight Management Holdings Bhd (FMHB) is an
investment holding company which engages in multimodal
freight services and forwarding industry. The services
provided include sea, air, rail, tug and barge, warehouse,
transport, and custom brokerage services. The operations of
the Companies are conducted in Malaysia, Australia,
Indonesia, Thailand, Vietnam, India and Singapore. The
subsidiaries of the Company include FM Multimodal
Services Sdn. Bhd., FM Worldwide Logistics (Penang) Sdn.
Bhd., Freight Management MSC Sdn. Bhd. And FM Global
Logistics (M) Sdn. Bhd.
The multimodal freight services of FMHB:
Services Activities
Sea freight
services
Provides export and import freight
services, and handle customers’ cargo
movement internationally and between
West Malaysia and Sabah/Sarawak
Air freight
services
Offers inbound and outbound services
that cater the needs of customers in
Peninsular Malaysia and Sabah/Sarawak.
Rail freight
services
Handles fully containerized land-bridge
rail services between Port Klang and
Penang in Malaysia and Bangkok in
Thailand
Tug & barge
services
Specializes in the movement of dry bulk
cargoes between South Thailand, the
West Coast of Peninsular Malaysia and
Singapore.
Warehouse
services
Provides complete warehousing solutions
to the customers with the newly built,
state-of-the-art, warehousing complex in
Port Klang.
Transport &
customs
brokerage
services
Consists of container haulage,
conventional trucking and customs
brokerage to complement the multimodal
services
Exchange: Bursa Malaysia
Sector: Industrials
Industry: Transportation & Logistics
Sub Industry: Logistics Services
BUY Share Price RM1.27
Target Price RM1.30
Share Price Performance
KLCI 1621.21
YTD KLCI chg -7.05%
Stock Information
Bloomberg Ticker FMH:MK
Market Cap (RM m) 219.840
Issued shares (m) 174.476
52-week high/low (RM) 1.57/1.25
Beta 0.333
Major Shareholders
Chong Keat Chew 25.68%
Singapore Enterprise 21.40%
Heng Lam Yang 17.30%
Source: Bloomberg
3
Company No. 380410-P
Freight Management Company is an investment holding company which provides
multimodal freight services that includes rail, tug barge, sea, air, custom brokerage,
distribution container haulage, and conventional tracking. It also provides management
service to its subsidiary and associated companies. It was founded in 1988 and the
headquarter is in Port Klang, Malaysia. Corporate in 1996 under the Act, it was known as
Freight Management (Holdings) Sdn Bhd as a private limited company. It changed the nature
of the business to public limited company in 2004.
During 1988, Chew Chong Keat, Yang Heng Lam and Gan Siew Yong, namely as a
promoter of Freight Management Holding, operate the business of providing freight services
that only with 8 staffs at that time based on Port Klang, the maritime gateway of Malaysia.
The main focus at that time is to provide freight services to Singapore. At the very beginning,
Freight Management Holding had already 2 overseas independent agents in Hong Kong and
Singapore. In the next year, Freight Management Holding has expanded their company by
incorporate Freight Management (Penang) Sdn Bhd to cover the north region of West
Malaysia.
To establish the base of the corporation, the Promoters have introduced FM Airfreight
Sdn Bhd which is now known as FM-Hellman Worlwide Logistics Sdn Bhd at Subang
International Airport as air freight services in 1990. In 1991, in order to continue expand their
business to the stage that be proud of, Freight Management Holding has continuously offer
range of freight service by incorporate Citra Multimodal Services Sdn Bhd which previously
known as Citra Timuran Sdn Bhd to cover LCL consolidation and FCL services between East
and West Malaysia.
1993 remarks another change that been made by Freight Management Group by
expanding their business in Perak, to cover the marketing and sales of freight services in that
area, named Freight Management (Ipoh) Sdn Bhd. It is located in Kinta Valley. The
promoters also initiated Group’s first CFS operations in Port Klang. The following year,
Freight Management Group has incorporated FM Worldwide Logistics (Penang) Sdn Bhd
that previously named FM Airfreight (Penang) Sdn Bhd to cover the air freight business in
that respective area to continue expand the business.
In 1996, it creates another milestone of change to the business as they have obtained
their first ISO 9002 which rectify the business growing organization whether as for
qualitatively or quantitatively. They also have continue expanding in a purpose to cater the
southern region’s need of air freight business by incorporate Freight Management (Melaka)
Sdn Bhd. In the same year, they also commenced the operations of the then Logistar Sdn Bhd
which now known as Advanced Logistar Sdn Bhd to cover all the customs barrier related and
services to further complement this range of air freight services.
In order to complete this freight service offered, Freight Management Holding
provided rail service that cover from Port Klang to Bangkok in 1999. With this achievement,
Freight Management Holding has complete the requirement to be the multimodal freight
4
Company No. 380410-P
service that can cater the freight services range from air service, maritime and also through
railway. It also introduces the first bonded warehouse with 40,000 square feet to record their
future achievement in the same year.
In present, Freight Management is leading multimodal freight service that provides
various services range from sea, rail, air, custom brokerage and distribution service. Freight
Management can also be classified as successful company as it has 127 ports worldwide and
has 107 agents that globally represent Freight Management Holding. The logistic segments
which are operated in Malaysia, Australia, Indonesia, Thailand, Vietnam, and India offers
integrated freight and logistics service while the marine segment engage as operators and
charterer of barges and tugboats that operated by a company in Singapore. While the other
segment cover operation related to provision of management services, IT related services,
investment holdings and also support services.
1.2 Company’s Financial Performance
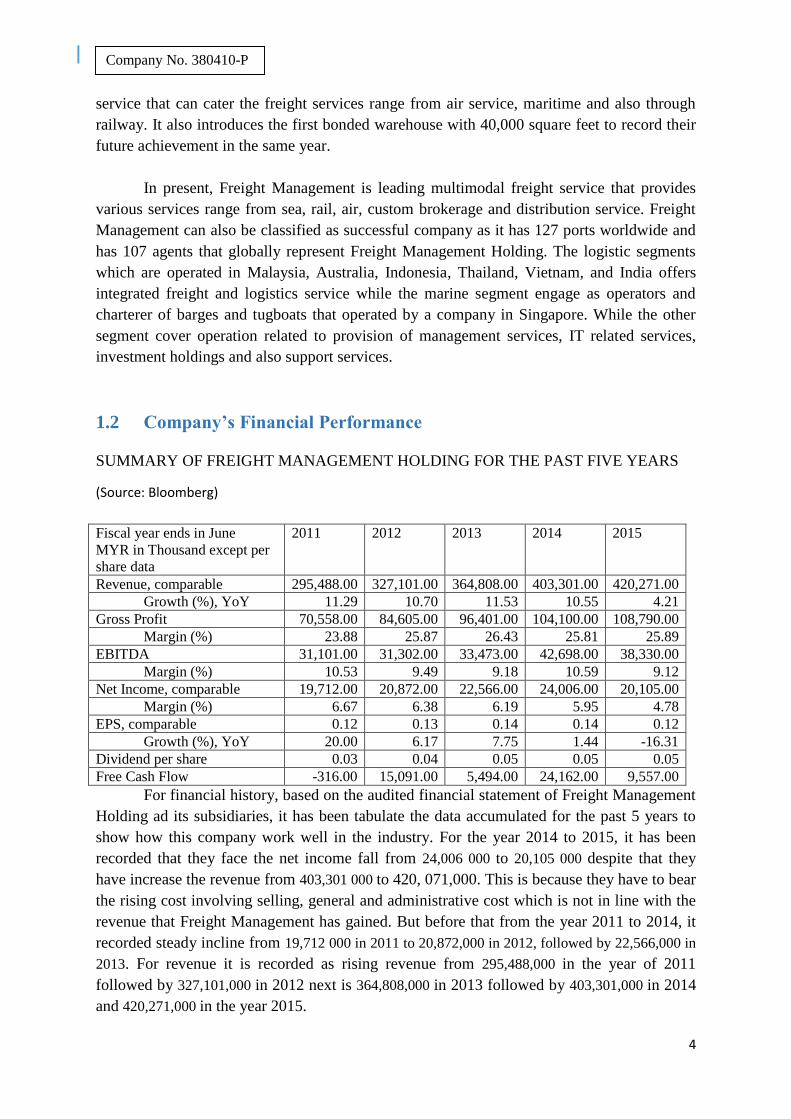
SUMMARY OF FREIGHT MANAGEMENT HOLDING FOR THE PAST FIVE YEARS
(Source: Bloomberg)
For financial history, based on the audited financial statement of Freight Management
Holding ad its subsidiaries, it has been tabulate the data accumulated for the past 5 years to
show how this company work well in the industry. For the year 2014 to 2015, it has been
recorded that they face the net income fall from 24,006 000 to 20,105 000 despite that they
have increase the revenue from 403,301 000 to 420, 071,000. This is because they have to bear
the rising cost involving selling, general and administrative cost which is not in line with the
revenue that Freight Management has gained. But before that from the year 2011 to 2014, it
recorded steady incline from 19,712 000 in 2011 to 20,872,000 in 2012, followed by 22,566,000 in
2013. For revenue it is recorded as rising revenue from 295,488,000 in the year of 2011
followed by 327,101,000 in 2012 next is 364,808,000 in 2013 followed by 403,301,000 in 2014
and 420,271,000 in the year 2015.
Fiscal year ends in June
MYR in Thousand except per
share data
2011 2012 2013 2014 2015
Revenue, comparable 295,488.00 327,101.00 364,808.00 403,301.00 420,271.00
Growth (%), YoY 11.29 10.70 11.53 10.55 4.21
Gross Profit 70,558.00 84,605.00 96,401.00 104,100.00 108,790.00
Margin (%) 23.88 25.87 26.43 25.81 25.89
EBITDA 31,101.00 31,302.00 33,473.00 42,698.00 38,330.00
Margin (%) 10.53 9.49 9.18 10.59 9.12
Net Income, comparable 19,712.00 20,872.00 22,566.00 24,006.00 20,105.00
Margin (%) 6.67 6.38 6.19 5.95 4.78
EPS, comparable 0.12 0.13 0.14 0.14 0.12
Growth (%), YoY 20.00 6.17 7.75 1.44 -16.31
Dividend per share 0.03 0.04 0.05 0.05 0.05
Free Cash Flow -316.00 15,091.00 5,494.00 24,162.00 9,557.00
5
Company No. 380410-P
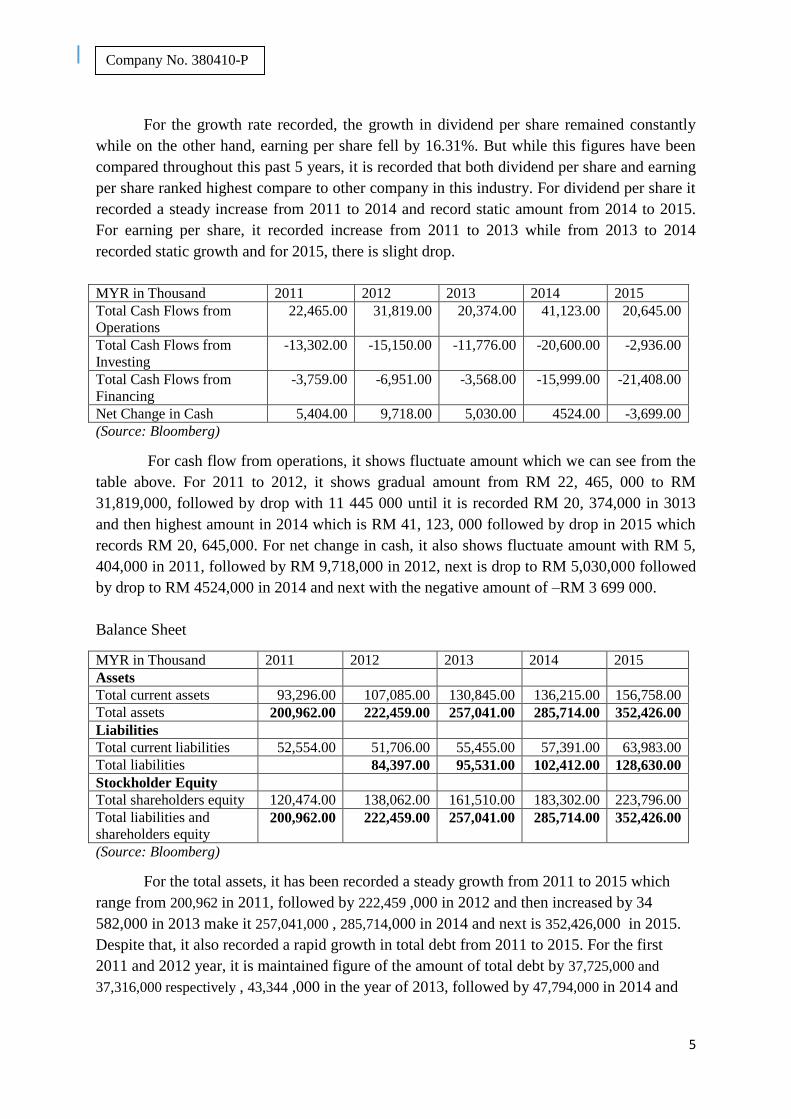
For the growth rate recorded, the growth in dividend per share remained constantly
while on the other hand, earning per share fell by 16.31%. But while this figures have been
compared throughout this past 5 years, it is recorded that both dividend per share and earning
per share ranked highest compare to other company in this industry. For dividend per share it
recorded a steady increase from 2011 to 2014 and record static amount from 2014 to 2015.
For earning per share, it recorded increase from 2011 to 2013 while from 2013 to 2014
recorded static growth and for 2015, there is slight drop.
MYR in Thousand 2011 2012 2013 2014 2015
Total Cash Flows from
Operations
22,465.00 31,819.00 20,374.00 41,123.00 20,645.00
Total Cash Flows from
Investing
-13,302.00 -15,150.00 -11,776.00 -20,600.00 -2,936.00
Total Cash Flows from
Financing
-3,759.00 -6,951.00 -3,568.00 -15,999.00 -21,408.00
Net Change in Cash 5,404.00 9,718.00 5,030.00 4524.00 -3,699.00
(Source: Bloomberg)
For cash flow from operations, it shows fluctuate amount which we can see from the
table above. For 2011 to 2012, it shows gradual amount from RM 22, 465, 000 to RM
31,819,000, followed by drop with 11 445 000 until it is recorded RM 20, 374,000 in 3013
and then highest amount in 2014 which is RM 41, 123, 000 followed by drop in 2015 which
records RM 20, 645,000. For net change in cash, it also shows fluctuate amount with RM 5,
404,000 in 2011, followed by RM 9,718,000 in 2012, next is drop to RM 5,030,000 followed
by drop to RM 4524,000 in 2014 and next with the negative amount of –RM 3 699 000.
Balance Sheet
MYR in Thousand 2011 2012 2013 2014 2015
Assets
Total current assets 93,296.00 107,085.00 130,845.00 136,215.00 156,758.00
Total assets 200,962.00 222,459.00 257,041.00 285,714.00 352,426.00
Liabilities
Total current liabilities 52,554.00 51,706.00 55,455.00 57,391.00 63,983.00
Total liabilities 84,397.00 95,531.00 102,412.00 128,630.00
Stockholder Equity
Total shareholders equity 120,474.00 138,062.00 161,510.00 183,302.00 223,796.00
Total liabilities and
shareholders equity 200,962.00 222,459.00 257,041.00 285,714.00 352,426.00
(Source: Bloomberg)
For the total assets, it has been recorded a steady growth from 2011 to 2015 which
range from 200,962 in 2011, followed by 222,459 ,000 in 2012 and then increased by 34
582,000 in 2013 make it 257,041,000 , 285,714,000 in 2014 and next is 352,426,000 in 2015.
Despite that, it also recorded a rapid growth in total debt from 2011 to 2015. For the first
2011 and 2012 year, it is maintained figure of the amount of total debt by 37,725,000 and
37,316,000 respectively , 43,344 ,000 in the year of 2013, followed by 47,794,000 in 2014 and
6
Company No. 380410-P
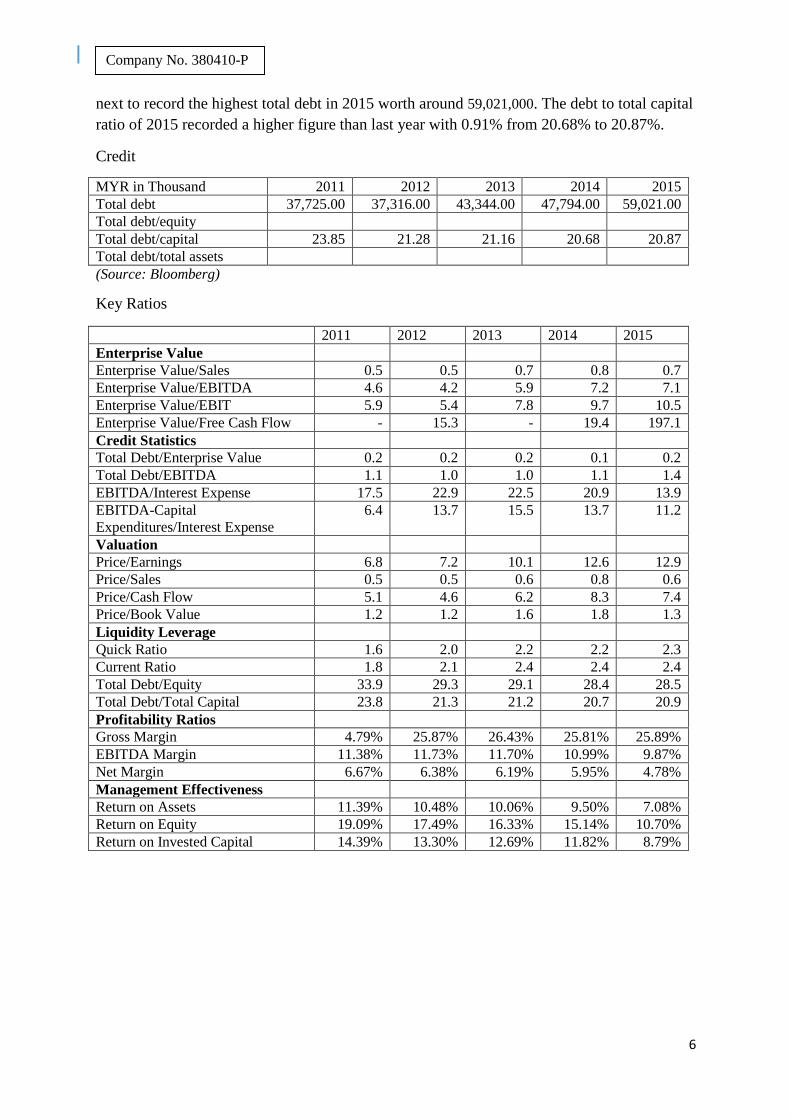
next to record the highest total debt in 2015 worth around 59,021,000. The debt to total capital
ratio of 2015 recorded a higher figure than last year with 0.91% from 20.68% to 20.87%.
Credit
MYR in Thousand 2011 2012 2013 2014 2015
Total debt 37,725.00 37,316.00 43,344.00 47,794.00 59,021.00
Total debt/equity
Total debt/capital 23.85 21.28 21.16 20.68 20.87
Total debt/total assets
(Source: Bloomberg)
Key Ratios
2011 2012 2013 2014 2015
Enterprise Value
Enterprise Value/Sales 0.5 0.5 0.7 0.8 0.7
Enterprise Value/EBITDA 4.6 4.2 5.9 7.2 7.1
Enterprise Value/EBIT 5.9 5.4 7.8 9.7 10.5
Enterprise Value/Free Cash Flow - 15.3 - 19.4 197.1
Credit Statistics
Total Debt/Enterprise Value 0.2 0.2 0.2 0.1 0.2
Total Debt/EBITDA 1.1 1.0 1.0 1.1 1.4
EBITDA/Interest Expense 17.5 22.9 22.5 20.9 13.9
EBITDA-Capital
Expenditures/Interest Expense
6.4 13.7 15.5 13.7 11.2
Valuation
Price/Earnings 6.8 7.2 10.1 12.6 12.9
Price/Sales 0.5 0.5 0.6 0.8 0.6
Price/Cash Flow 5.1 4.6 6.2 8.3 7.4
Price/Book Value 1.2 1.2 1.6 1.8 1.3
Liquidity Leverage
Quick Ratio 1.6 2.0 2.2 2.2 2.3
Current Ratio 1.8 2.1 2.4 2.4 2.4
Total Debt/Equity 33.9 29.3 29.1 28.4 28.5
Total Debt/Total Capital 23.8 21.3 21.2 20.7 20.9
Profitability Ratios
Gross Margin 4.79% 25.87% 26.43% 25.81% 25.89%
EBITDA Margin 11.38% 11.73% 11.70% 10.99% 9.87%
Net Margin 6.67% 6.38% 6.19% 5.95% 4.78%
Management Effectiveness
Return on Assets 11.39% 10.48% 10.06% 9.50% 7.08%
Return on Equity 19.09% 17.49% 16.33% 15.14% 10.70%
Return on Invested Capital 14.39% 13.30% 12.69% 11.82% 8.79%
7
Company No. 380410-P
2.0 RATIONALE FOR THE RIGHTS ISSUE
Our Group is in the opinion that the Rights Issue with Warrants is the most appropriate
funding option amongst others, the various funding option includes issuance of private debt
securities or making bank loans. The rights issue is undertaken for the following reasons:-
i. To raise adequate funds for the investment projects (approximately RM44 million) at a
lower cost without incurring additional finance costs, as compared to other funding
option such as bank borrowings;
ii. To optimise the capital structure and further improve the gearing levels of our Group;
iii. To provide the existing shareholders an opportunity to further participate in the
company’s equity and prospects of the Group
iv. The free warrants to be issued pursuant to the rights issue with warrants allow the
entitled shareholders to increase their equity participation in our company at a pre-
determined price over the tenure of the warrants. The entitled shareholders may also
benefit from any potential capital appreciation of the warrants. In addition, our
company would be able to raise further proceeds as and when any of the warrants are
exercised.
After taking those rationales into account, Our Board is of the opinion that Right Issue with
Warrants is the best way for fund-raising to satisfy the best interest of our Company and our
Shareholders.
8
Company No. 380410-P
3.0 DETAILS OF RIGHT ISSUE WITH WARRANTS
Freight Management Holding Bhd offers each of its shareholders the opportunity to subscribe
for new shares under a pro-rata renounceable rights issue offer. The rights issue with warrants
entails a provisional allotment of up to 57,000,000 rights shares together with up to
19,000,000 warrants.
Each shareholder is entitled to subscribe for one rights issued for every three shares held by
that shareholder as at the record date at an issue price of RM0.89 per rights. Each right is
entitled to subscription of one new share. For every three new shares subscribed for,
shareholders will receive one free warrant attached.
Based on this, an aggregate of up to RM 50,730,000 (no of rights x issued price) will be
raised from the Rights Issue with Warrants, and up to RM18,430,000 (no of warrants x
exercised price) will be raised, assuming the full exercise of the Warrants.
3.1 Basis Of Determining The Issue Price
The Issue Price of RM0.89 is determined by:
(i) A discount of 30% to the 5-Market Day VWAP of our Shares of RM1.27 up to
29th April 2016 *1, being the last market day immediately preceding the Price-
Fixing Date on 29th April 2016; and
(ii) Recent successful major right issue by peers in the same industry which listed on
Bursa Malaysia Securities. For instant, Hubline Berhad with 12.28% discount on
successful right issue , Malaysia Airport with 28.8% discount and Air Asia X with
50% discount that made up an approximate average of 30.36%.
(iii) The proceeds to be raised for investment projects as listed in Section 3.
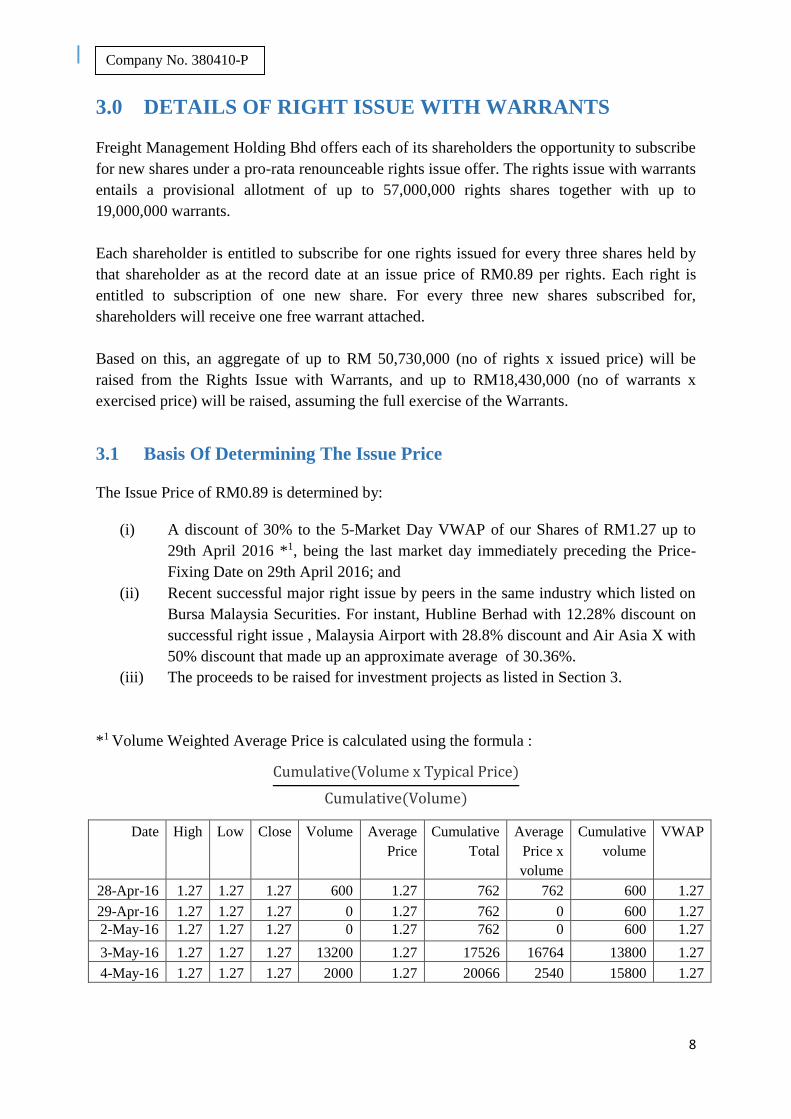
*1 Volume Weighted Average Price is calculated using the formula :
Cumulative(Volume x Typical Price)
Cumulative(Volume)
Date High Low Close Volume Average
Price
Cumulative
Total
Average
Price x
volume
Cumulative
volume
VWAP
28-Apr-16 1.27 1.27 1.27 600 1.27 762 762 600 1.27
29-Apr-16 1.27 1.27 1.27 0 1.27 762 0 600 1.27
2-May-16 1.27 1.27 1.27 0 1.27 762 0 600 1.27
3-May-16 1.27 1.27 1.27 13200 1.27 17526 16764 13800 1.27
4-May-16 1.27 1.27 1.27 2000 1.27 20066 2540 15800 1.27
9
Company No. 380410-P
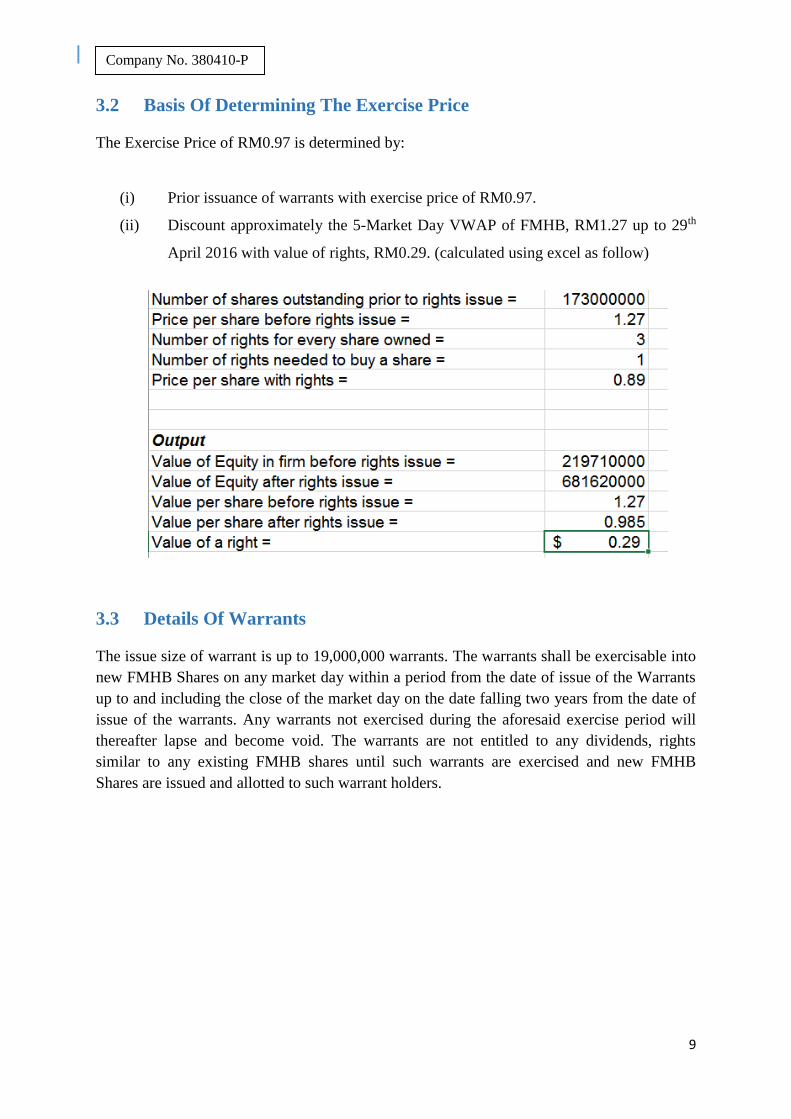
3.2 Basis Of Determining The Exercise Price
The Exercise Price of RM0.97 is determined by:
(i) Prior issuance of warrants with exercise price of RM0.97.
(ii) Discount approximately the 5-Market Day VWAP of FMHB, RM1.27 up to 29th
April 2016 with value of rights, RM0.29. (calculated using excel as follow)
3.3 Details Of Warrants
The issue size of warrant is up to 19,000,000 warrants. The warrants shall be exercisable into
new FMHB Shares on any market day within a period from the date of issue of the Warrants
up to and including the close of the market day on the date falling two years from the date of
issue of the warrants. Any warrants not exercised during the aforesaid exercise period will
thereafter lapse and become void. The warrants are not entitled to any dividends, rights
similar to any existing FMHB shares until such warrants are exercised and new FMHB
Shares are issued and allotted to such warrant holders.
10
Company No. 380410-P
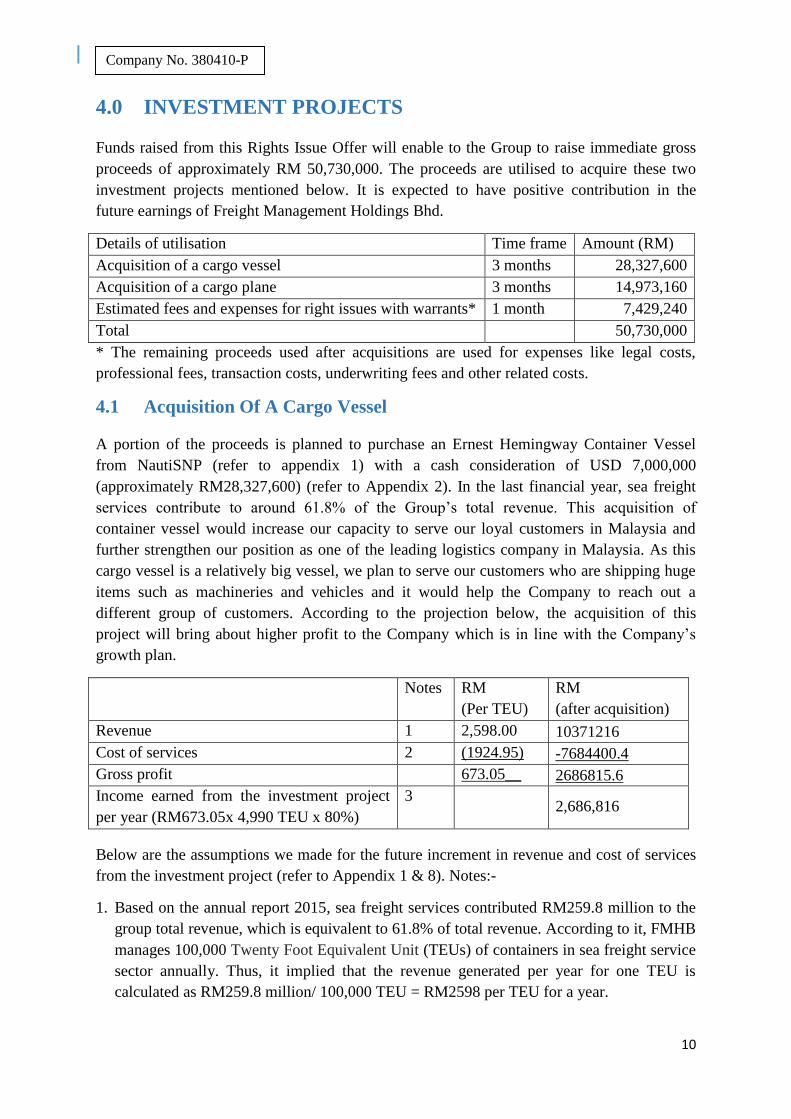
4.0 INVESTMENT PROJECTS
Funds raised from this Rights Issue Offer will enable to the Group to raise immediate gross
proceeds of approximately RM 50,730,000. The proceeds are utilised to acquire these two
investment projects mentioned below. It is expected to have positive contribution in the
future earnings of Freight Management Holdings Bhd.
Details of utilisation Time frame Amount (RM)
Acquisition of a cargo vessel 3 months 28,327,600
Acquisition of a cargo plane 3 months 14,973,160
Estimated fees and expenses for right issues with warrants* 1 month 7,429,240
Total 50,730,000
* The remaining proceeds used after acquisitions are used for expenses like legal costs,
professional fees, transaction costs, underwriting fees and other related costs.
4.1 Acquisition Of A Cargo Vessel
A portion of the proceeds is planned to purchase an Ernest Hemingway Container Vessel
from NautiSNP (refer to appendix 1) with a cash consideration of USD 7,000,000
(approximately RM28,327,600) (refer to Appendix 2). In the last financial year, sea freight
services contribute to around 61.8% of the Group’s total revenue. This acquisition of
container vessel would increase our capacity to serve our loyal customers in Malaysia and
further strengthen our position as one of the leading logistics company in Malaysia. As this
cargo vessel is a relatively big vessel, we plan to serve our customers who are shipping huge
items such as machineries and vehicles and it would help the Company to reach out a
different group of customers. According to the projection below, the acquisition of this
project will bring about higher profit to the Company which is in line with the Company’s
growth plan.
Notes RM
(Per TEU)
RM
(after acquisition)
Revenue 1 2,598.00 10371216
Cost of services 2 (1924.95) -7684400.4
Gross profit 673.05__ 2686815.6
Income earned from the investment project
per year (RM673.05x 4,990 TEU x 80%)
3 2,686,816
Below are the assumptions we made for the future increment in revenue and cost of services
from the investment project (refer to Appendix 1 & 8). Notes:-
1. Based on the annual report 2015, sea freight services contributed RM259.8 million to the
group total revenue, which is equivalent to 61.8% of total revenue. According to it, FMHB
manages 100,000 Twenty Foot Equivalent Unit (TEUs) of containers in sea freight service
sector annually. Thus, it implied that the revenue generated per year for one TEU is
calculated as RM259.8 million/ 100,000 TEU = RM2598 per TEU for a year.
11
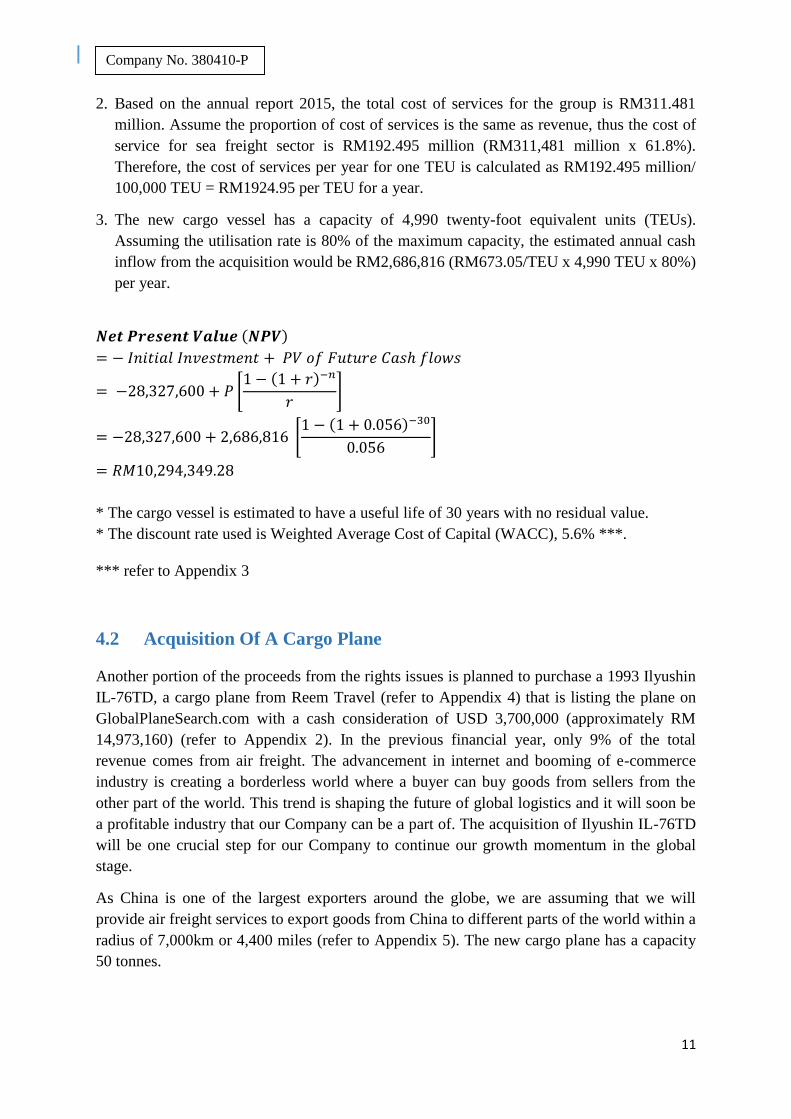
Company No. 380410-P
2. Based on the annual report 2015, the total cost of services for the group is RM311.481
million. Assume the proportion of cost of services is the same as revenue, thus the cost of
service for sea freight sector is RM192.495 million (RM311,481 million x 61.8%).
Therefore, the cost of services per year for one TEU is calculated as RM192.495 million/
100,000 TEU = RM1924.95 per TEU for a year.
3. The new cargo vessel has a capacity of 4,990 twenty-foot equivalent units (TEUs).
Assuming the utilisation rate is 80% of the maximum capacity, the estimated annual cash
inflow from the acquisition would be RM2,686,816 (RM673.05/TEU x 4,990 TEU x 80%)
per year.
𝑵𝒆𝒕 𝑷𝒓𝒆𝒔𝒆𝒏𝒕 𝑽𝒂𝒍𝒖𝒆 (𝑵𝑷𝑽)
= − 𝐼𝑛𝑖𝑡𝑖𝑎𝑙 𝐼𝑛𝑣𝑒𝑠𝑡𝑚𝑒𝑛𝑡 + 𝑃𝑉 𝑜𝑓 𝐹𝑢𝑡𝑢𝑟𝑒 𝐶𝑎𝑠ℎ 𝑓𝑙𝑜𝑤𝑠
= −28,327,600 + 𝑃 [1 − (1 + 𝑟)−𝑛
𝑟]
= −28,327,600 + 2,686,816 [1 − (1 + 0.056)−30
0.056]
= 𝑅𝑀10,294,349.28
* The cargo vessel is estimated to have a useful life of 30 years with no residual value.
* The discount rate used is Weighted Average Cost of Capital (WACC), 5.6% ***.
*** refer to Appendix 3
4.2 Acquisition Of A Cargo Plane
Another portion of the proceeds from the rights issues is planned to purchase a 1993 Ilyushin
IL-76TD, a cargo plane from Reem Travel (refer to Appendix 4) that is listing the plane on
GlobalPlaneSearch.com with a cash consideration of USD 3,700,000 (approximately RM
14,973,160) (refer to Appendix 2). In the previous financial year, only 9% of the total
revenue comes from air freight. The advancement in internet and booming of e-commerce
industry is creating a borderless world where a buyer can buy goods from sellers from the
other part of the world. This trend is shaping the future of global logistics and it will soon be
a profitable industry that our Company can be a part of. The acquisition of Ilyushin IL-76TD
will be one crucial step for our Company to continue our growth momentum in the global
stage.
As China is one of the largest exporters around the globe, we are assuming that we will
provide air freight services to export goods from China to different parts of the world within a
radius of 7,000km or 4,400 miles (refer to Appendix 5). The new cargo plane has a capacity
50 tonnes.
12
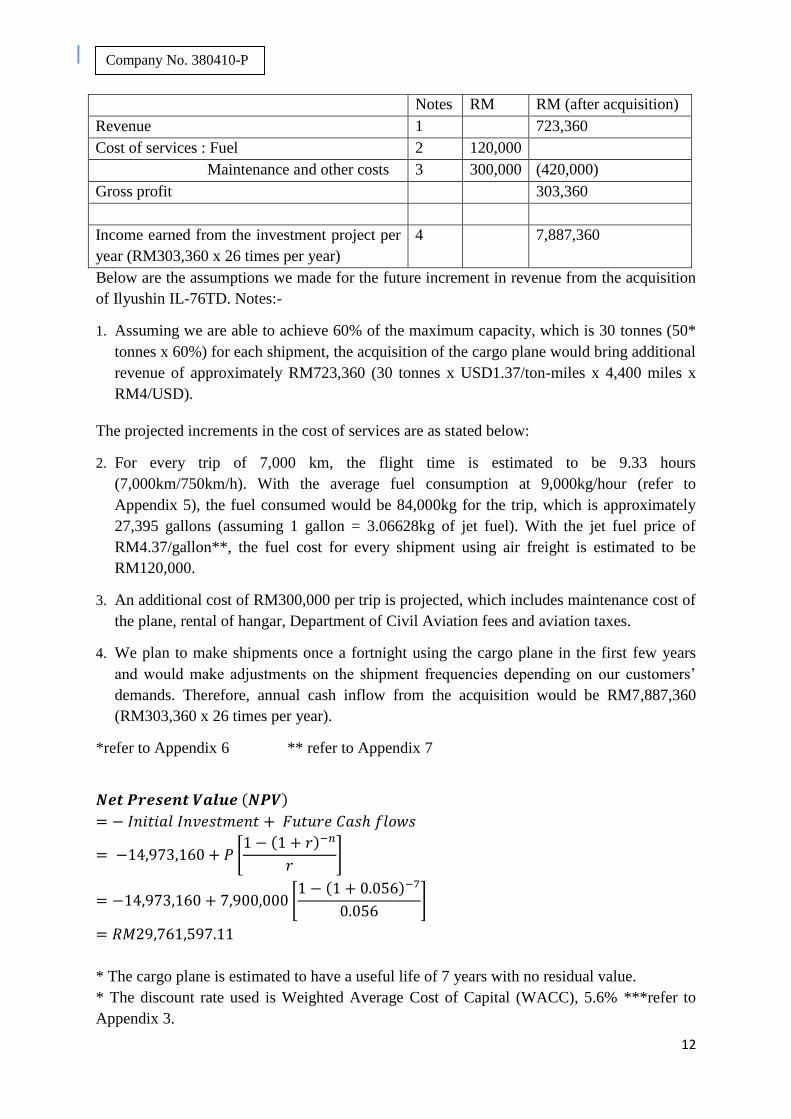
Company No. 380410-P
Notes RM RM (after acquisition)
Revenue 1 723,360
Cost of services : Fuel 2 120,000
Maintenance and other costs 3 300,000 (420,000)
Gross profit 303,360
Income earned from the investment project per
year (RM303,360 x 26 times per year)
4 7,887,360
Below are the assumptions we made for the future increment in revenue from the acquisition
of Ilyushin IL-76TD. Notes:-
1. Assuming we are able to achieve 60% of the maximum capacity, which is 30 tonnes (50*
tonnes x 60%) for each shipment, the acquisition of the cargo plane would bring additional
revenue of approximately RM723,360 (30 tonnes x USD1.37/ton-miles x 4,400 miles x
RM4/USD).
The projected increments in the cost of services are as stated below:
2. For every trip of 7,000 km, the flight time is estimated to be 9.33 hours
(7,000km/750km/h). With the average fuel consumption at 9,000kg/hour (refer to
Appendix 5), the fuel consumed would be 84,000kg for the trip, which is approximately
27,395 gallons (assuming 1 gallon = 3.06628kg of jet fuel). With the jet fuel price of
RM4.37/gallon**, the fuel cost for every shipment using air freight is estimated to be
RM120,000.
3. An additional cost of RM300,000 per trip is projected, which includes maintenance cost of
the plane, rental of hangar, Department of Civil Aviation fees and aviation taxes.
4. We plan to make shipments once a fortnight using the cargo plane in the first few years
and would make adjustments on the shipment frequencies depending on our customers’
demands. Therefore, annual cash inflow from the acquisition would be RM7,887,360
(RM303,360 x 26 times per year).
*refer to Appendix 6 ** refer to Appendix 7
𝑵𝒆𝒕 𝑷𝒓𝒆𝒔𝒆𝒏𝒕 𝑽𝒂𝒍𝒖𝒆 (𝑵𝑷𝑽)
= − 𝐼𝑛𝑖𝑡𝑖𝑎𝑙 𝐼𝑛𝑣𝑒𝑠𝑡𝑚𝑒𝑛𝑡 + 𝐹𝑢𝑡𝑢𝑟𝑒 𝐶𝑎𝑠ℎ 𝑓𝑙𝑜𝑤𝑠
= −14,973,160 + 𝑃 [1 − (1 + 𝑟)−𝑛
𝑟]
= −14,973,160 + 7,900,000 [1 − (1 + 0.056)−7
0.056]
= 𝑅𝑀29,761,597.11
* The cargo plane is estimated to have a useful life of 7 years with no residual value.
* The discount rate used is Weighted Average Cost of Capital (WACC), 5.6% ***refer to
Appendix 3.
13
Company No. 380410-P
5.0 RISK FACTORS
Prior to the Rights Shares and Warrants investment and subscription, prospective subscribers
and investors should pay particular attention to the following risk factors as the large extent
of our operations are not only governed by the legal, regulatory and business environment in
Malaysia, but other countries as well. There are also some uncontrollable factors involved in
our business. In addition, consideration should be paid to the other risk factors or future risks
which are not stated below, as those risks may impose material and adverse impacts on our
future business, financial condition and/or on our Shares.
5.1 Risk Involved In The Company
Our Company is an investment holding company, which is also known as one of the leading
freight forwarders in Malaysia. The main operation of FMHB is the intermediate agent
between importers/exporters and carriers. The business and operational risks arise from the
risk inherent in the logistics industry which includes, but not restrained to fluctuations of
charter rates, increases of labour costs, unforeseen breakdown of vessels, cargo planes, trains
and trucks, threat of rivalry, rise of port tariffs, lengthy quarantines and severe weather
phenomena at land and sea. Several strategies have been implemented to limit the risks, such
as delivering good services and develop good business relationship to maintain large client
base, close supervision of the transportation lines, controlling operation costs effectively, thus
there is no assurance that those factors will not affecting our Group’s business adversely.
Financing risk will be solved through the proceeds raised from the Rights Issue with
Warrants, to fund the working capital requirements if necessary. However, no assurance can
be given that there will be availability of necessary financing for our Group. Foreign currency
risks of our Group results from the transactions that are denominated in currencies other than
functional currencies of our Group, and in respect of the overseas investments in which the
risks arise from the fluctuation in foreign exchange.
5.2 Risks Relating To The Transportation And Logistics Industry
The transportation and logistics industry is highly and indirectly dependent on the fuel prices,
which constitute a large portion in the operating costs of this industry. The fluctuation of oil
prices might have adverse impact on the operating costs, which will indirectly cause the
cancellation of routes, transportation frequencies, and eventually lead to bankruptcy of some
companies. Thus, no assurance is provided that future revenue generated from our Group will
not be affected by the fuel prices.
The overall industry in general is subjected to terrorist attacks, natural disasters, epidemics
and social and political unrest. These threats may cause notable reduction in our services
demand, trip cancellations or delays which may results in operating costs increments.
Furthermore, for those events that are out of our control, may lead to decline in our services
demand and hike in operating costs, thus influence the financial condition and company’s
performance adversely.
14
Company No. 380410-P
5.3 Risks Associated To The Rights Issue With Warrants
The fluctuation of our Shares prices and trading volume is affected by various factors, such as
the prevailing market and stock market sentiment, instability of equity markets, fluctuation of
interest rate, future prospects of industry, demand and supply factors of our Shares.
Furthermore, the prices of FMHB Shares could be adversely influenced by external factors
including the conditions of economic, political and industry. Thus, no assurance can be given
that the market price of Rights Shares will trade above the current price or theoretical ex-
rights price that will meet the specific targets of the holders of the Right Shares, after
completing the Rights Issue with Warrants.
The risks of delay or cancellation of Rights Issue with Warrants may arise during the
implementation if the events or circumstances involved significant adverse change that are
beyond our control. In addition, there are conditions where the Managing Underwriter may
terminate the Underwriting Agreement on behalf of the Joint Underwriters if termination
events stated in the agreement happened. These events may have a negative impact on the
financial condition and prospect of our Company and therefore the Managing Underwriter
would be reluctant to proceed with the Right Issue with Warrants as documented in the
agreement. Hence, no assurance can be given. No assurance would be provided that the
events above will not cause a delay or abortion of the Rights Issue with Warrants. The
Company will return all monies that were received from the applicants without interest in
events where the Rights Issue with Warrants is cancelled.
Reduction of voting interest and proportionate ownership, may occur if the entitled
shareholders do not or unable to accept the Provisional Allotments. Accordingly, there will
be reduction in their shareholdings in FMHB regarding the percentage of enlarged issued and
paid-up capital share.
5.4 Other Risks
The assets of our Group are substantially located, and the operations are mainly conducted in
Malaysia. However, to further strengthen the expansion and growth of our businesses, we
have also conducted extensive worldwide coverage with the network of 200 independent
agents covering 145 ports in more than 53 countries. Therefore, our Group’s financial
performance and results of operations are very much dependent on the prevalent economic,
political, and regulatory environment in Malaysia and also other regional and/other countries
from time to time. We constantly seek to reduce the risks by adopting prudent management
and operating the procedures effectively, yet, no assurance can be provided that such risks
will not have material impact on our Group.
15
Company No. 380410-P
6.0 FINANCIAL EFFECTS
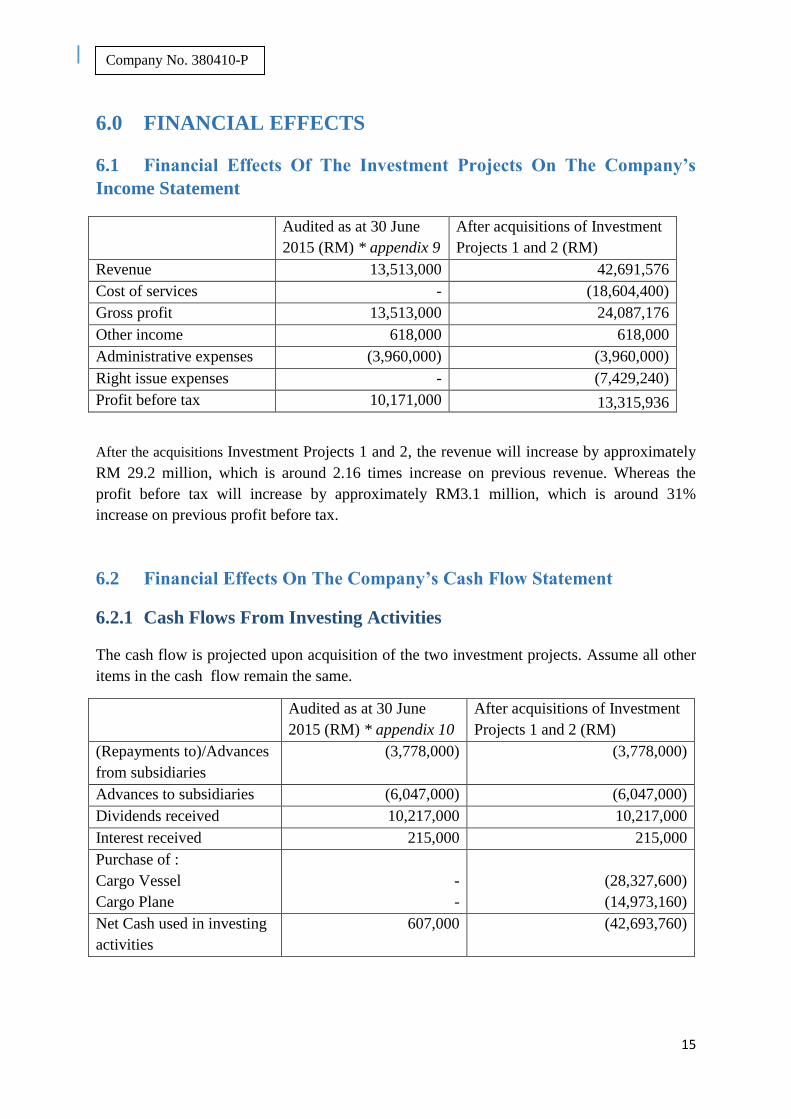
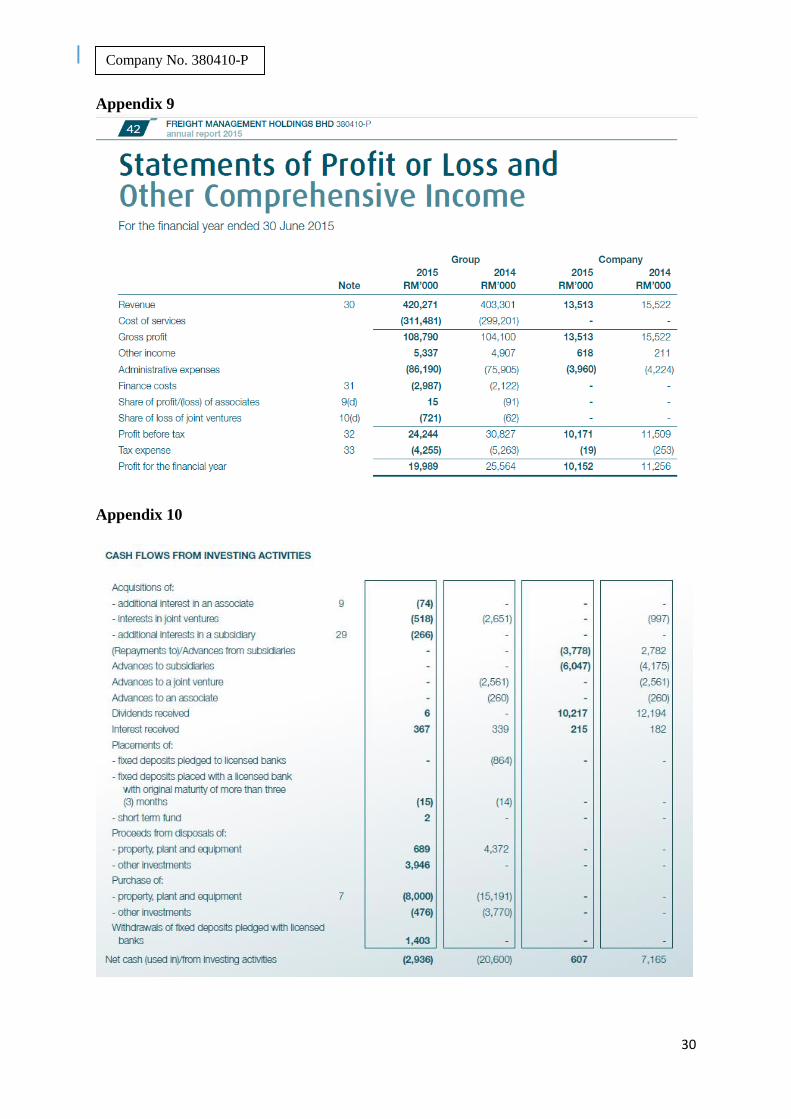
6.1 Financial Effects Of The Investment Projects On The Company’s
Income Statement
Audited as at 30 June
2015 (RM) * appendix 9
After acquisitions of Investment
Projects 1 and 2 (RM)
Revenue 13,513,000 42,691,576
Cost of services - (18,604,400)
Gross profit 13,513,000 24,087,176
Other income 618,000 618,000
Administrative expenses (3,960,000) (3,960,000)
Right issue expenses - (7,429,240)
Profit before tax 10,171,000 13,315,936
After the acquisitions Investment Projects 1 and 2, the revenue will increase by approximately
RM 29.2 million, which is around 2.16 times increase on previous revenue. Whereas the
profit before tax will increase by approximately RM3.1 million, which is around 31%
increase on previous profit before tax.
6.2 Financial Effects On The Company’s Cash Flow Statement
6.2.1 Cash Flows From Investing Activities
The cash flow is projected upon acquisition of the two investment projects. Assume all other
items in the cash flow remain the same.
Audited as at 30 June
2015 (RM) * appendix 10
After acquisitions of Investment
Projects 1 and 2 (RM)
(Repayments to)/Advances
from subsidiaries
(3,778,000) (3,778,000)
Advances to subsidiaries (6,047,000) (6,047,000)
Dividends received 10,217,000 10,217,000
Interest received 215,000 215,000
Purchase of :
Cargo Vessel
Cargo Plane
-
-
(28,327,600)
(14,973,160)
Net Cash used in investing
activities
607,000 (42,693,760)
16
Company No. 380410-P
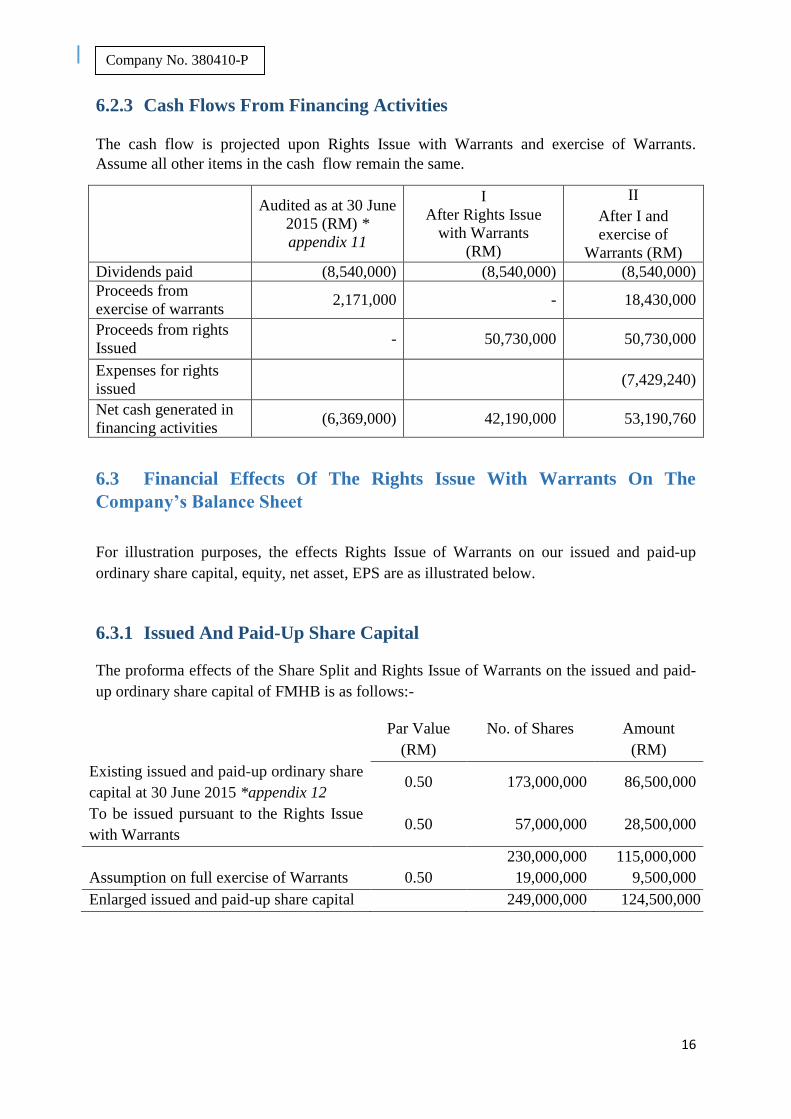
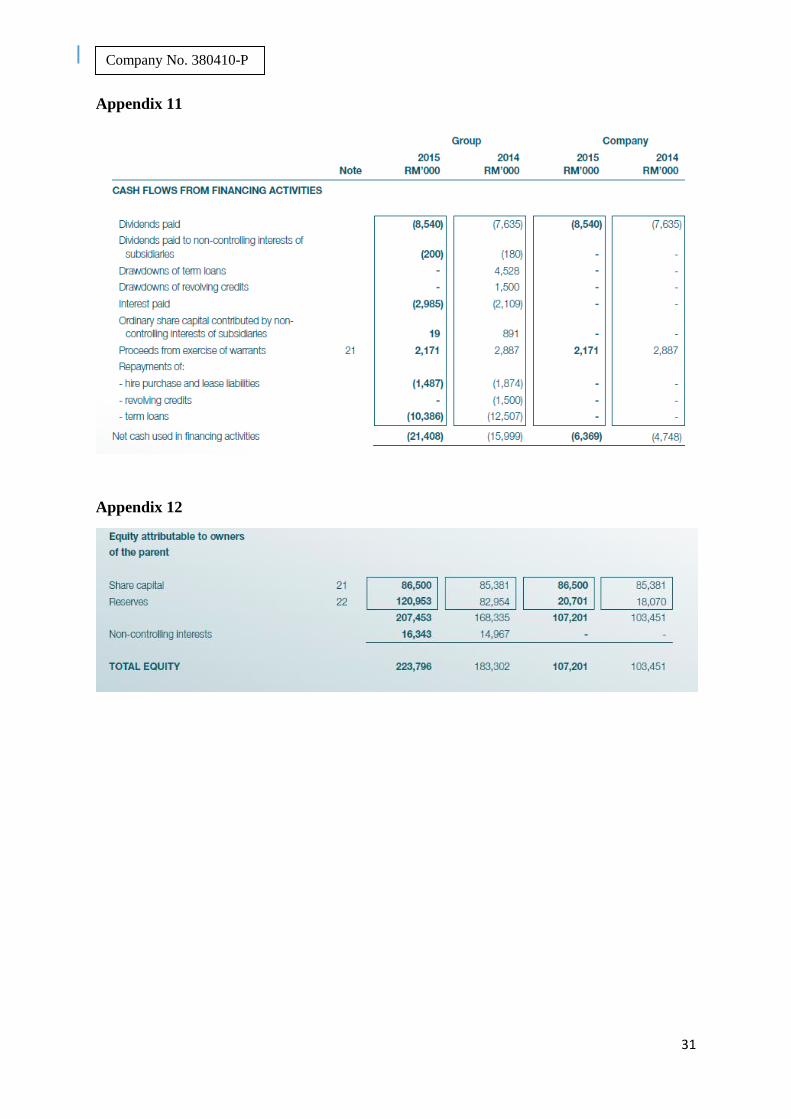
6.2.3 Cash Flows From Financing Activities
The cash flow is projected upon Rights Issue with Warrants and exercise of Warrants.
Assume all other items in the cash flow remain the same.
Audited as at 30 June
2015 (RM) *
appendix 11
I
After Rights Issue
with Warrants
(RM)
II
After I and
exercise of
Warrants (RM)
Dividends paid (8,540,000) (8,540,000) (8,540,000)
Proceeds from
exercise of warrants 2,171,000 - 18,430,000
Proceeds from rights
Issued - 50,730,000 50,730,000
Expenses for rights
issued (7,429,240)
Net cash generated in
financing activities (6,369,000) 42,190,000 53,190,760
6.3 Financial Effects Of The Rights Issue With Warrants On The
Company’s Balance Sheet
For illustration purposes, the effects Rights Issue of Warrants on our issued and paid-up
ordinary share capital, equity, net asset, EPS are as illustrated below.
6.3.1 Issued And Paid-Up Share Capital
The proforma effects of the Share Split and Rights Issue of Warrants on the issued and paid-
up ordinary share capital of FMHB is as follows:-
Par Value
(RM)
No. of Shares Amount
(RM)
Existing issued and paid-up ordinary share
capital at 30 June 2015 *appendix 12 0.50 173,000,000 86,500,000
To be issued pursuant to the Rights Issue
with Warrants 0.50 57,000,000 28,500,000
230,000,000 115,000,000
Assumption on full exercise of Warrants 0.50 19,000,000 9,500,000
Enlarged issued and paid-up share capital 249,000,000 124,500,000
17
Company No. 380410-P
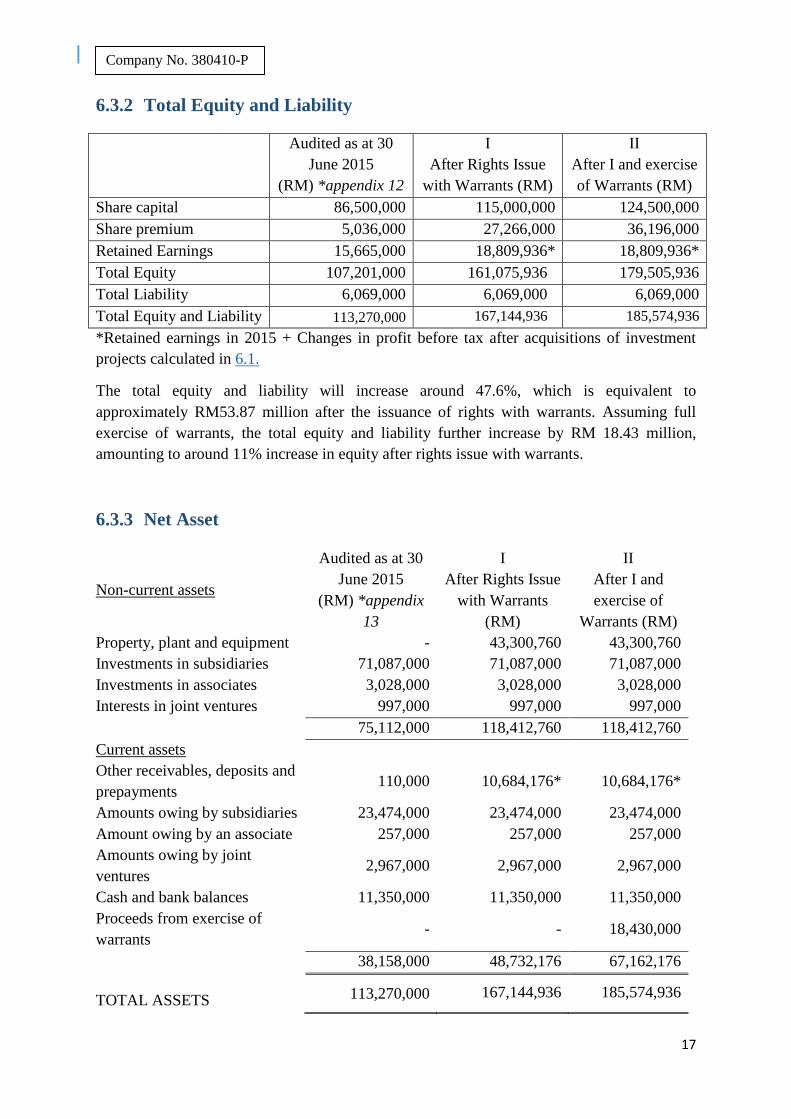
6.3.2 Total Equity and Liability
Audited as at 30
June 2015
(RM) *appendix 12
I
After Rights Issue
with Warrants (RM)
II
After I and exercise
of Warrants (RM)
Share capital 86,500,000 115,000,000 124,500,000
Share premium 5,036,000 27,266,000 36,196,000
Retained Earnings 15,665,000 18,809,936* 18,809,936*
Total Equity 107,201,000 161,075,936 179,505,936
Total Liability 6,069,000 6,069,000 6,069,000
Total Equity and Liability 113,270,000 167,144,936 185,574,936
*Retained earnings in 2015 + Changes in profit before tax after acquisitions of investment
projects calculated in 6.1.
The total equity and liability will increase around 47.6%, which is equivalent to
approximately RM53.87 million after the issuance of rights with warrants. Assuming full
exercise of warrants, the total equity and liability further increase by RM 18.43 million,
amounting to around 11% increase in equity after rights issue with warrants.
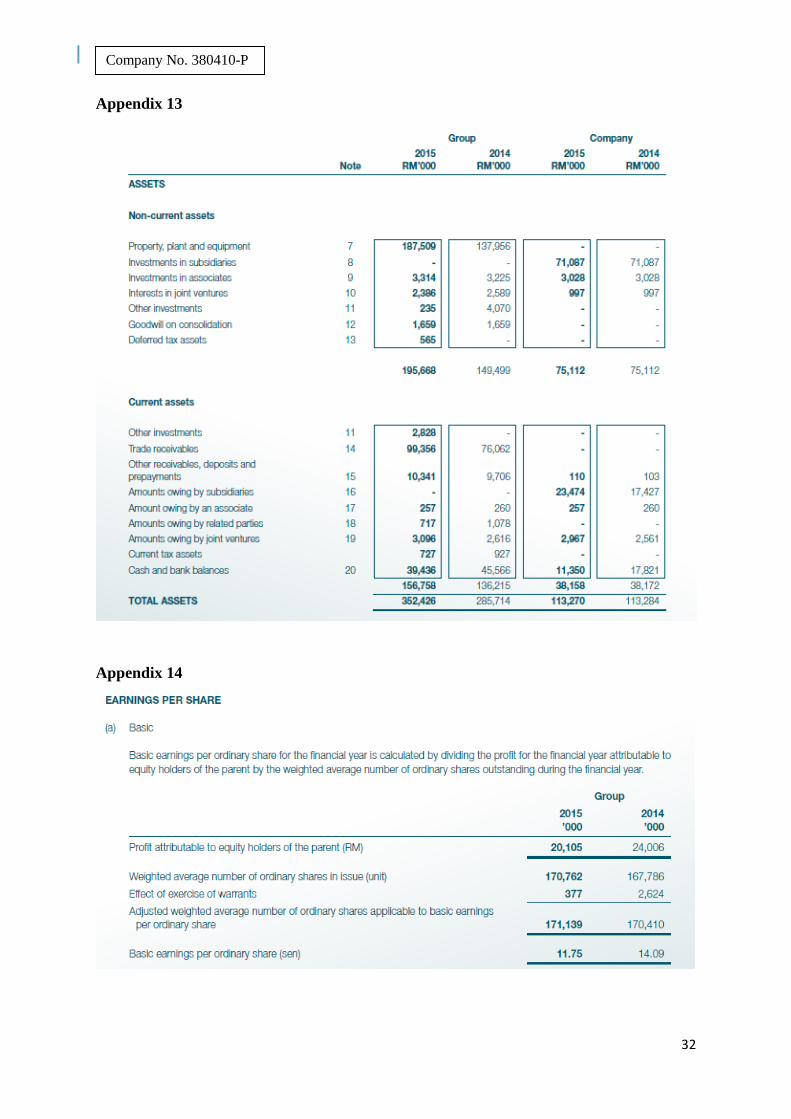
6.3.3 Net Asset
Non-current assets
Audited as at 30
June 2015
(RM) *appendix
13
I
After Rights Issue
with Warrants
(RM)
II
After I and
exercise of
Warrants (RM)
Property, plant and equipment - 43,300,760 43,300,760
Investments in subsidiaries 71,087,000 71,087,000 71,087,000
Investments in associates 3,028,000 3,028,000 3,028,000
Interests in joint ventures 997,000 997,000 997,000
75,112,000 118,412,760 118,412,760
Current assets
Other receivables, deposits and
prepayments 110,000 10,684,176* 10,684,176*
Amounts owing by subsidiaries 23,474,000 23,474,000 23,474,000
Amount owing by an associate 257,000 257,000 257,000
Amounts owing by joint
ventures 2,967,000 2,967,000 2,967,000
Cash and bank balances 11,350,000 11,350,000 11,350,000
Proceeds from exercise of
warrants - - 18,430,000
38,158,000 48,732,176 67,162,176
TOTAL ASSETS 113,270,000 167,144,936 185,574,936
18
Company No. 380410-P
* Other receivables, deposits and prepayments in 2015 + income generated from investment
projects as calculated in 6.1.
Assuming acquisition of investment projects are done once the rights are issued. The total
assets increased by RM53,874,936, which is around 47.6% after rights issue with warrants,
and further increased by RM18,430,000 after the full exercise of warrants assuming all other
items remain the same.
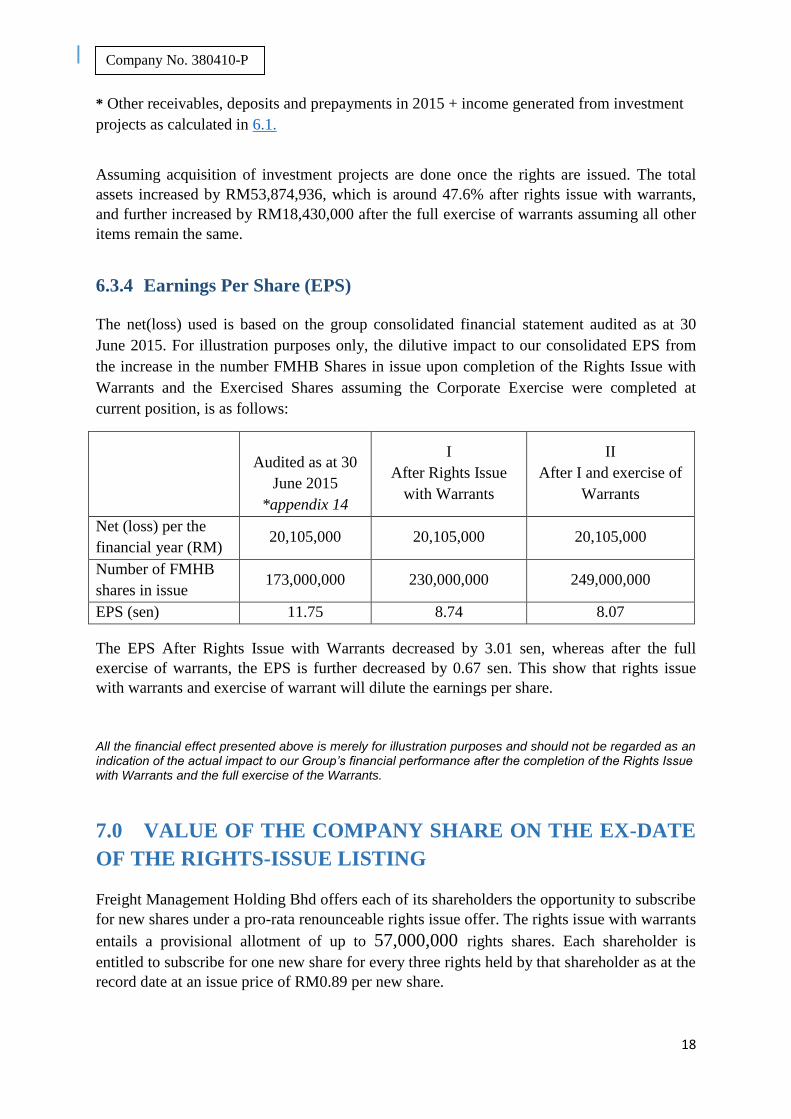
6.3.4 Earnings Per Share (EPS)
The net(loss) used is based on the group consolidated financial statement audited as at 30
June 2015. For illustration purposes only, the dilutive impact to our consolidated EPS from
the increase in the number FMHB Shares in issue upon completion of the Rights Issue with
Warrants and the Exercised Shares assuming the Corporate Exercise were completed at
current position, is as follows:
Audited as at 30
June 2015
*appendix 14
I
After Rights Issue
with Warrants
II
After I and exercise of
Warrants
Net (loss) per the
financial year (RM) 20,105,000 20,105,000 20,105,000
Number of FMHB
shares in issue 173,000,000 230,000,000 249,000,000
EPS (sen) 11.75 8.74 8.07
The EPS After Rights Issue with Warrants decreased by 3.01 sen, whereas after the full
exercise of warrants, the EPS is further decreased by 0.67 sen. This show that rights issue
with warrants and exercise of warrant will dilute the earnings per share.
All the financial effect presented above is merely for illustration purposes and should not be regarded as an indication of the actual impact to our Group’s financial performance after the completion of the Rights Issue with Warrants and the full exercise of the Warrants.
7.0 VALUE OF THE COMPANY SHARE ON THE EX-DATE
OF THE RIGHTS-ISSUE LISTING
Freight Management Holding Bhd offers each of its shareholders the opportunity to subscribe
for new shares under a pro-rata renounceable rights issue offer. The rights issue with warrants
entails a provisional allotment of up to 57,000,000 rights shares. Each shareholder is
entitled to subscribe for one new share for every three rights held by that shareholder as at the
record date at an issue price of RM0.89 per new share.
19
Company No. 380410-P
Theoretical Ex-Rights Price (TERP) measures the value of share of a company after rights
issue and it is also as a basis to calculate bonus element in EPS involving rights issue. TERP
assumes that all rights will be exercised in a single a day. After rights issue transaction occurs,
TERP is a deemed value which attributed to the share of the company. Since, shares under
rights issue are typically issued at a price much lower than market price, so TERP is always
lower than market value. However, TERP may differ with actual market price of the share
after rights-issue was listing, due to stock market imperfection and different perceptions of
market participants concerning the rights issue.
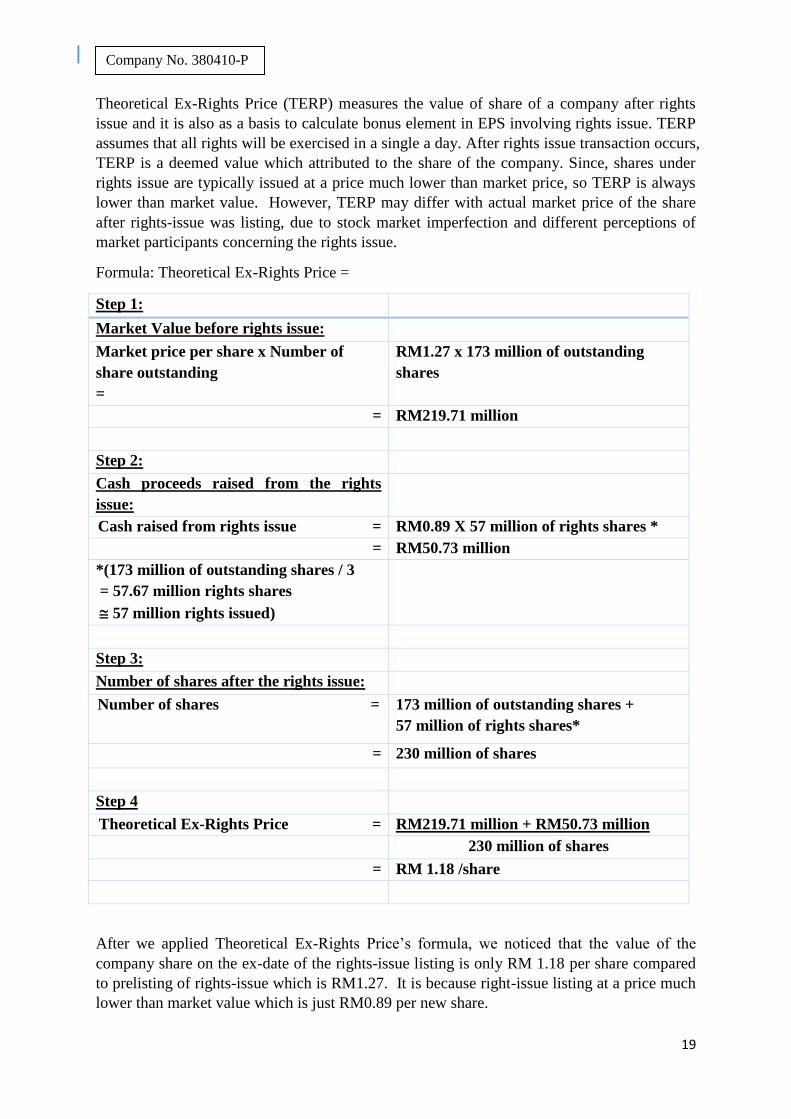
Formula: Theoretical Ex-Rights Price =
Step 1:
Market Value before rights issue:
Market price per share x Number of
share outstanding
=
RM1.27 x 173 million of outstanding
shares
= RM219.71 million
Step 2:
Cash proceeds raised from the rights
issue:
Cash raised from rights issue = RM0.89 X 57 million of rights shares *
= RM50.73 million
*(173 million of outstanding shares / 3
= 57.67 million rights shares
57 million rights issued)
Step 3:
Number of shares after the rights issue:
Number of shares = 173 million of outstanding shares +
57 million of rights shares*
= 230 million of shares
Step 4
Theoretical Ex-Rights Price = RM219.71 million + RM50.73 million
230 million of shares
= RM 1.18 /share
After we applied Theoretical Ex-Rights Price’s formula, we noticed that the value of the
company share on the ex-date of the rights-issue listing is only RM 1.18 per share compared
to prelisting of rights-issue which is RM1.27. It is because right-issue listing at a price much
lower than market value which is just RM0.89 per new share.
20
Company No. 380410-P
8.0 APPLICATION OF THEORIES
8.1 Capital Asset Pricing Model Theory
There are mainly 4 researchers who credited with CAPM development which are Markotwitz.
Sharpe, Lintner and Mossin. Markowitz explored the implication of introducing a risk free
asset. Sharpe is credited with development the Capital Asset Pricing Model (CAPM). In the
mid-20th century, Lintner and Mossin subsequently derived similar models. Generally, there
is no need for Covariance matrix because according to CAPM, stocks and investment can be
measured by using market benchmark also known as the market portfolio or returns.
Basically, there are a few assumptions made in CAPM Theory.
1. Investors are Efficient Investors
2. Investors can lend or borrow at risk free interest rate
3. Investors have homogeneous expectations for returns.
4. Capital markets are in equilibrium, No taxes or transaction cost, no changes in interest
rate and inflation.
Formula: 𝐸(𝑅𝑎) = 𝑟𝑓 + 𝛽𝑎(𝑅𝑚 − 𝑅𝑓)
Where,
𝑟𝑓 = Risk free rate
𝛽𝑎 = Beta of security
𝑅𝑚= Expected market return
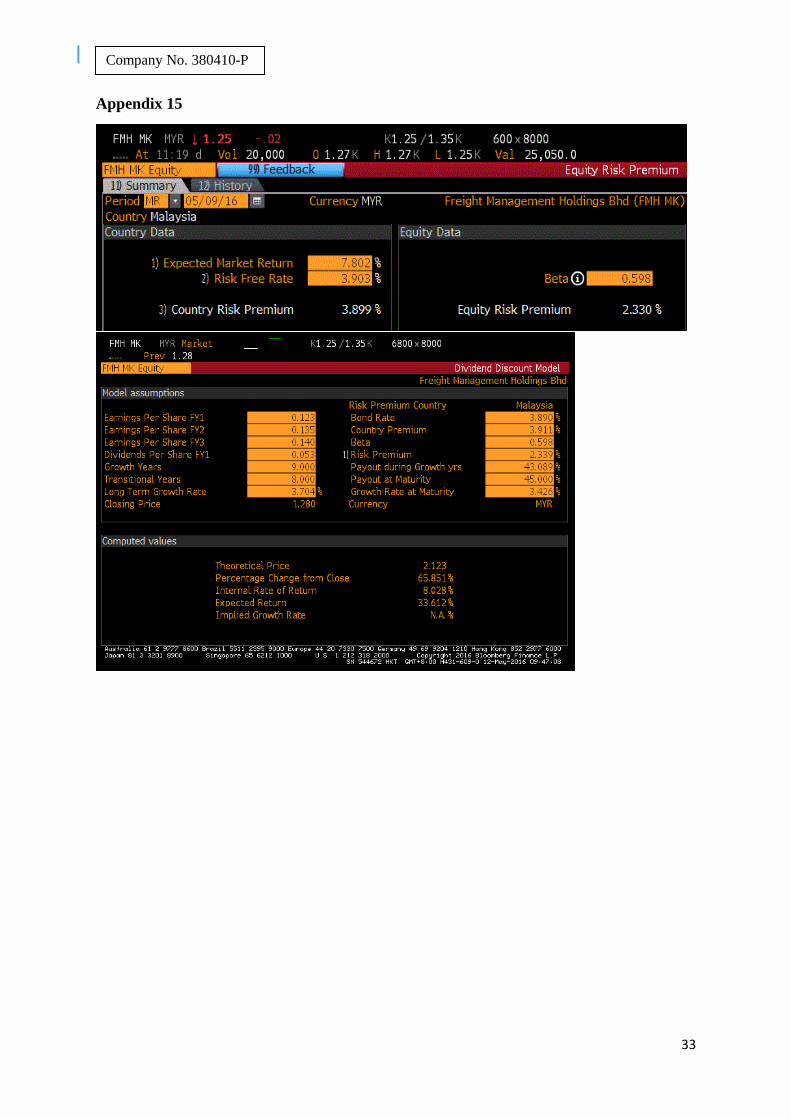
Then, we can apply this formula to calculate expected return of Freight Management Holding
Bhd. (*appendix 15)
CAPM = 3.903% + 0.598(7.802% - 3.903%)
= 6.2346%
Under CAPM, the initial expected return before rights issue is 6.24%
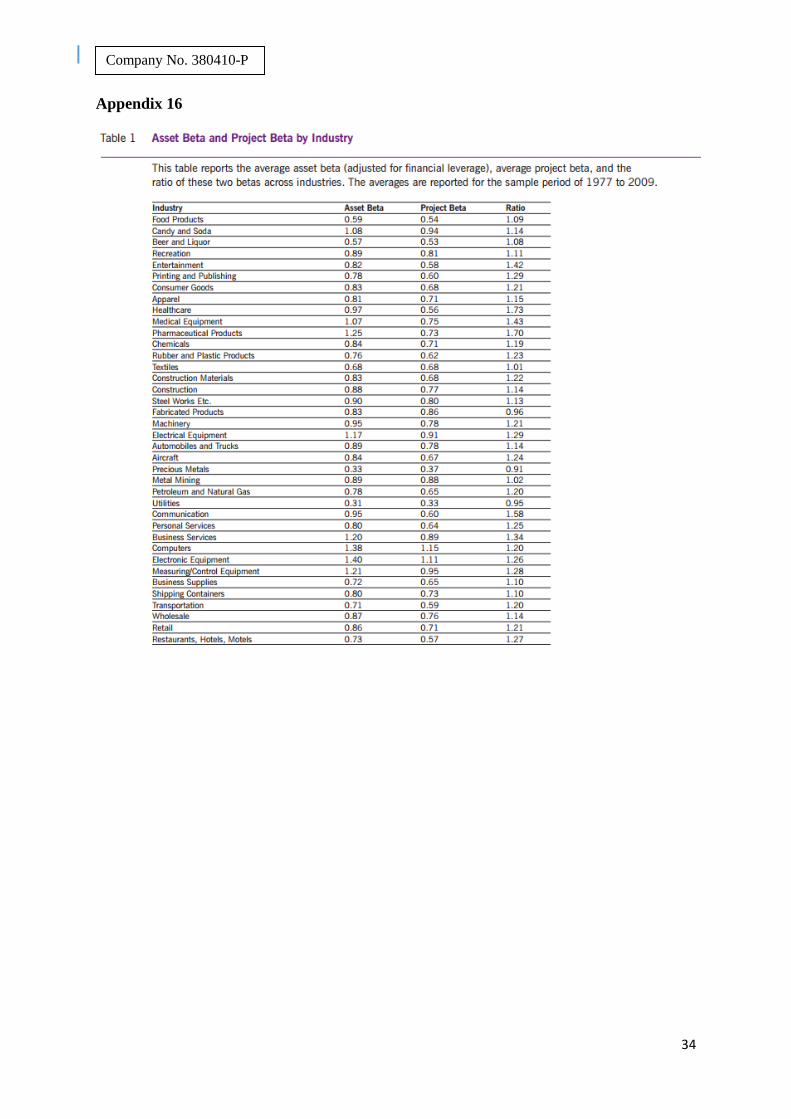
After the rights issued, the proceeds will be used to fund 2 new projects, which are
acquisition of cargo vessel and cargo plane. We assumed that project beta will increase to
0.73 due to risks; this beta is taken from a journal ‘Assessing Project Risk’ done by Antonio
E. Bernado and e.t.c, UCLA Andreson School of Management, Bhagwan
Chowdhry.(*appendix 16) We also make our assumption where there is no change in risk
free rate, but expected market return will increase to 8%)
CAPM = 3.903% + 0.73(8% - 3.903%)
= 6.89381%
The new expected return after the rights issued and the investment in new projects, we found
that the beta has slightly increased. However, it did contribute for the increasing of market
return from 6.24% to 6.89%. In conclusion, our group believes that the new projects are both
feasible and it did help FMH to achieve higher expected return.
21
Company No. 380410-P
8.2 (Modern) Portfolio Theory (MPT)
In1950s, Harry Markowitz has come out one of the most influential theories for financial and
investment. He developed Modern Portfolio Theory and published it in Journal of Finance.
Furthermore, efficient market hypothesis is the cornerstone of portfolio theory; securities
market is always competitive and efficient. Basically, the central tenet of portfolio theory is
markets are dominated by rational, risk adverse investors who seek for maximum possible
expected return. Investors are all being assumed as risk-averse under this theory. This means
that investors will choose the least risky portfolio with higher expected return.
In MPT, it stated that two components in the risk of individual stock returns which are
systematic risk and unsystematic risk. Systematic risk is called common, undiversifiable or
market risk which cannot be diversified away. For example, economic downturn, changes in
interest rate and others. Unsystematic risk is also called unique, diversifiable or firm-specific
risk. This risk can be diversified away by holding more number of stocks in your portfolio.
There are normally 2 types of news that will affect the stock price and dividend. Firm specific
news and market-wide news will cause the fluctuation of stock price and dividend. When we
combined many stocks in a large portfolio, the unsystematic risk will be diversified away due
to good news and bad news in the market that will affect different stocks. Thus, in the end
good and bad news will be relatively constant. However, systematic risk cannot be diversified
away because the stocks are simultaneously affected by the news, so it will directly affects
the entire portfolio.
Formula: E(𝑟𝑝) = 𝑤𝐷E(𝑟𝐷) + 𝑤𝐸 E(𝑟𝐸)
𝜎2𝑝 = 𝑊𝐷²𝜎𝐷² + 𝑊𝐸²𝜎𝐸² + 2𝑊𝐷𝑊𝐸𝐶𝑜𝑣(𝑟𝑑, 𝑟𝑒)
Sharpe ratio: 𝑅−𝑟𝑓
𝜎
Freight Management Holding Berhad will invest equally in both projects which are
acquisition of cargo vessel and cargo plane. According to various projects that have been
done by other companies within the same industry, we assumed the expected return of each
project will be 12% & 10% respectively. The standard deviations are 15% and 20%
accordingly. The portfolio has a correlation of 20%. Thus, now we can work out the formula.
Er = 0.50(0.25) + 0.50(0.20) = [email protected]%
σ = [0.50²0.15² + 0.50²0.20² + 2(0.5)(0.5)(0.20)(0.15)(0.20)]½ = 0.1365 @ 13.65%
Sharpe ratio = (22.5% - 3.903%) / 13.65% = 1.3624
This portfolio provides 11% of expected return and the volatility or risk is only 13.65%. Most
importantly, the Sharpe ratio is more than 1, 1.3624 is considering good. In other words, this
portfolio able to generate high return on a risk adjusted basis.
22
Company No. 380410-P
8.3 Trade-Off Theory of Capital Structure
According to this theory, it is an idea that how a company makes corporate finance decision
to choose how much debt and equity financing to maximize the value of the company. This
theory pointed that firms or companies are always financed by both debt and equity. It
normally deals with 2 concepts, agency costs and financial distress costs. Another important
objective of trade-off theory is offsetting the costs against benefits of debt. In other words,
tax shield is one of the benefits of debt. It can be used to against the financial distress costs
associated with leverage. Thus, the amount of debt that a firm should take in order to
maximize its value is depending on the benefits of leverage.
By referring to M&M theory, when the leverage is increase, it will cause the value of firm to
increase. The tax benefit of debt will actually be eroded if the cost of financial distress is too
significant, then the value of the firm will start to decrease, it will also lead to increase of the
likelihood of default. So, there is always an optimal debt level, at this level, the firm’s value
is maximized. Beyond the level aforesaid, the probability of default becomes higher and
higher, then the financial distress started to arise. The likelihood of firms cannot settle their
debt and therefore default is determined by the probability of financial distress.
Formula:
𝑉𝐿 = 𝑉𝑈 + 𝑃𝑉(Interest Tax Shield) − 𝑃𝑉(𝐹𝑖𝑛𝑎𝑛𝑐𝑖𝑎𝑙 𝐷𝑖𝑠𝑡𝑟𝑒𝑠𝑠 𝐶𝑜𝑠𝑡𝑠)
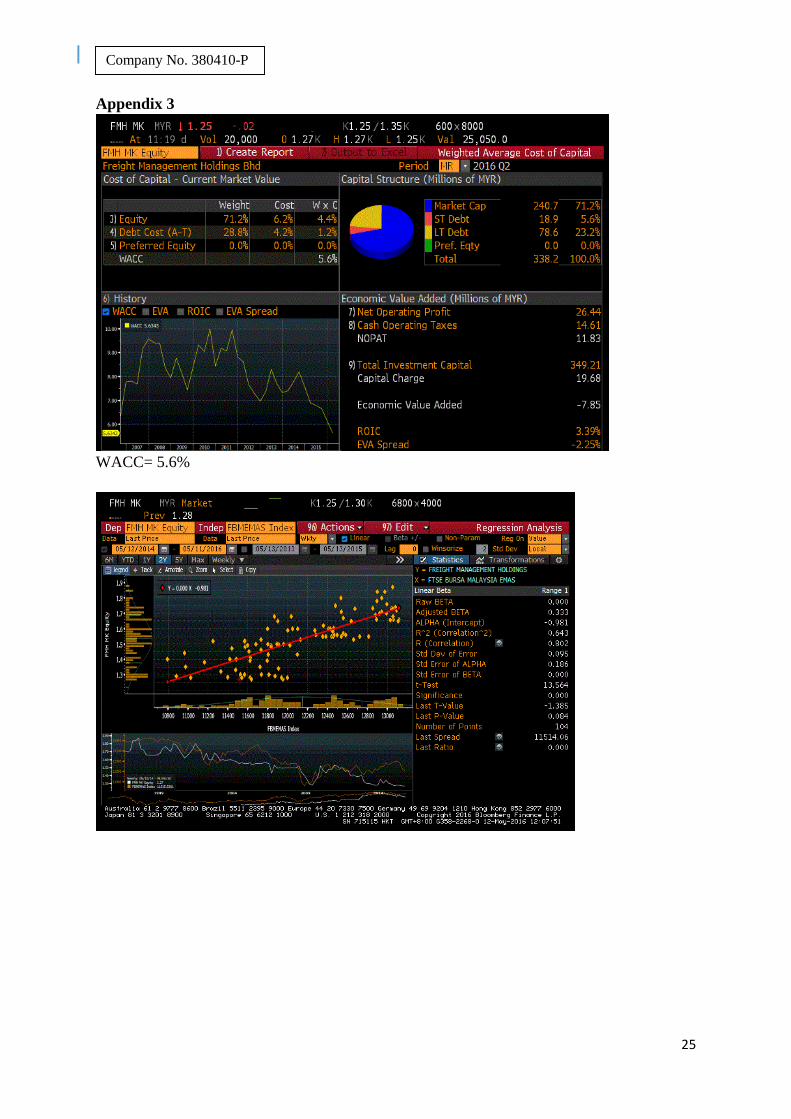
After Freight Management Holding Bhd (FMH) has decided to carry out 2 new investment
projects which are acquisition of cargo plane and cargo vessel. According to Bloomberg,
FMH debt to equity ratio is decreasing from 0.26379 to 0.2320, and has an equity cost of
capital of 6.2% and debt cost of capital of 4.2%. FMH’s corporate tax rate is 25%, and its
new market capitalization is RM250.44m, total new outstanding debt is RM59.02m. Pretax
WACC is 6.4%, FCF is expected to be RM 8m in 2016 and expected future growth rate per
year is 3.1% (*Appendix 3)
WACC = 1
1.232(6.2%) +
0.232
1.232(4.2%)(1 − 0.25) = 5.6%
𝑉𝐿 = 𝐸 + 𝐷 = RM250.44m + RM59.02m = RM309.46m
𝑉𝑢 =𝐹𝐶𝐹
𝑝𝑟𝑒𝑡𝑎𝑥 𝑊𝐴𝐶𝐶−𝑔=
𝑅𝑀8𝑚
6.4%−3.1% = RM242.42m
PV(Interest Tax Shield) = RM309.46m – RM242.42m = RM67.04m
Therefore, 𝑉𝐿𝑜𝑓 𝐹𝑀𝐻 = 𝑅𝑀242.42𝑚 + 𝑅𝑀67.04𝑚 = 𝑅𝑀309.46𝑚
We assumed that there is no any financial distress cost as Freight Management Holding Bhd
is still has enough financial means to settle their interest of out-standing debt. Also, FMH
new debt to equity ratio is only 0.2320, it also a signal to prove that their outstanding debt is
low and FMH has enough financial capability to increase their debt to get more interest tax
shield as it can maximize value of Freight Management Holding Bhd.
23
Company No. 380410-P
DISCLAIMER
The information set forth herein has been obtained or derived from sources generally
available to the public and believed by the author(s) to be reliable, but the author(s) does not
make any representation or warranty, express or implied, as to its accuracy or completeness.
The information and data contained in the report has been obtained from sources believed to
be reliable but have not been independently verified and consequently no representation is
made as to the accuracy or completeness of this report. For any direct or indirect losses that
arise from the reliance or use of the information and data in this analyst report are no liable
by anyone. There are subject to change for any information or recommendations that
contained in this report, without prior notice. This report may contain identifiable forward
looking statements and based on the information currently available and assumptions. Thus,
they are contained uncertainties and risks that could cause the difference between real results
and estimated results. This report should not be considered to be a recommendation by any
individual with regard to this company’s prospectus.
24
Company No. 380410-P
APPENDICES
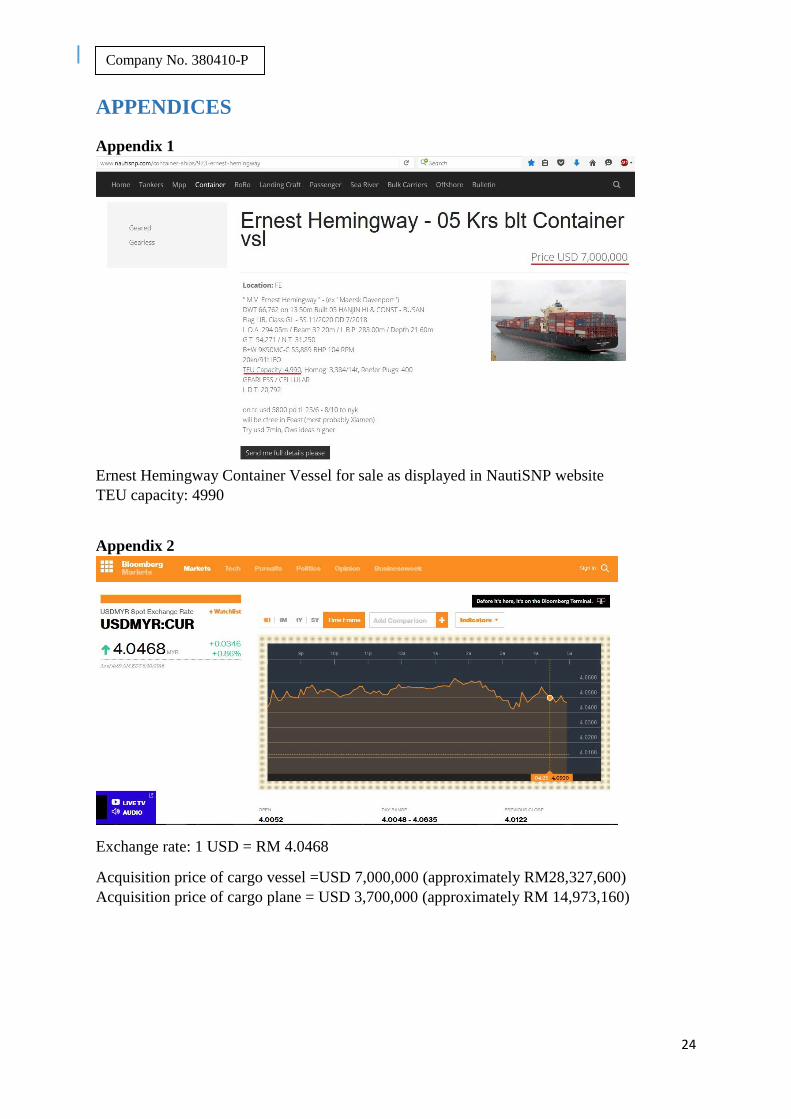
Appendix 1
Ernest Hemingway Container Vessel for sale as displayed in NautiSNP website
TEU capacity: 4990
Appendix 2
Exchange rate: 1 USD = RM 4.0468
Acquisition price of cargo vessel =USD 7,000,000 (approximately RM28,327,600)
Acquisition price of cargo plane = USD 3,700,000 (approximately RM 14,973,160)
25
Company No. 380410-P
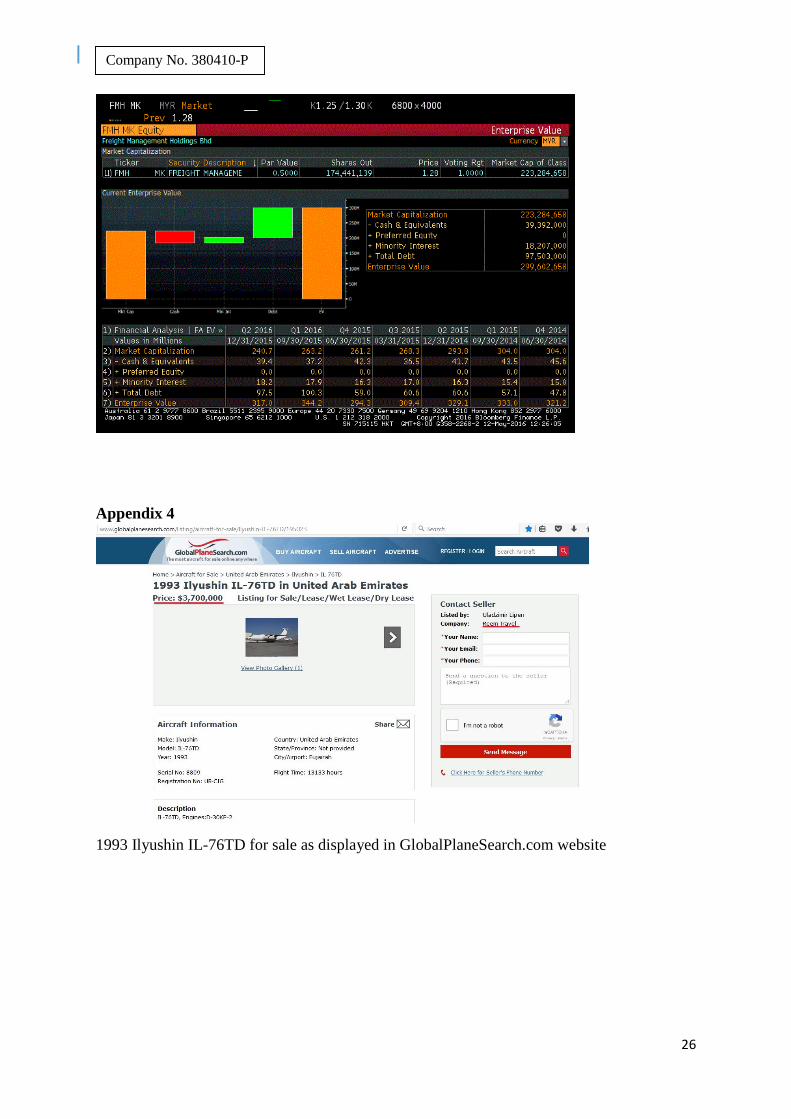
Appendix 3
WACC= 5.6%
26
Company No. 380410-P
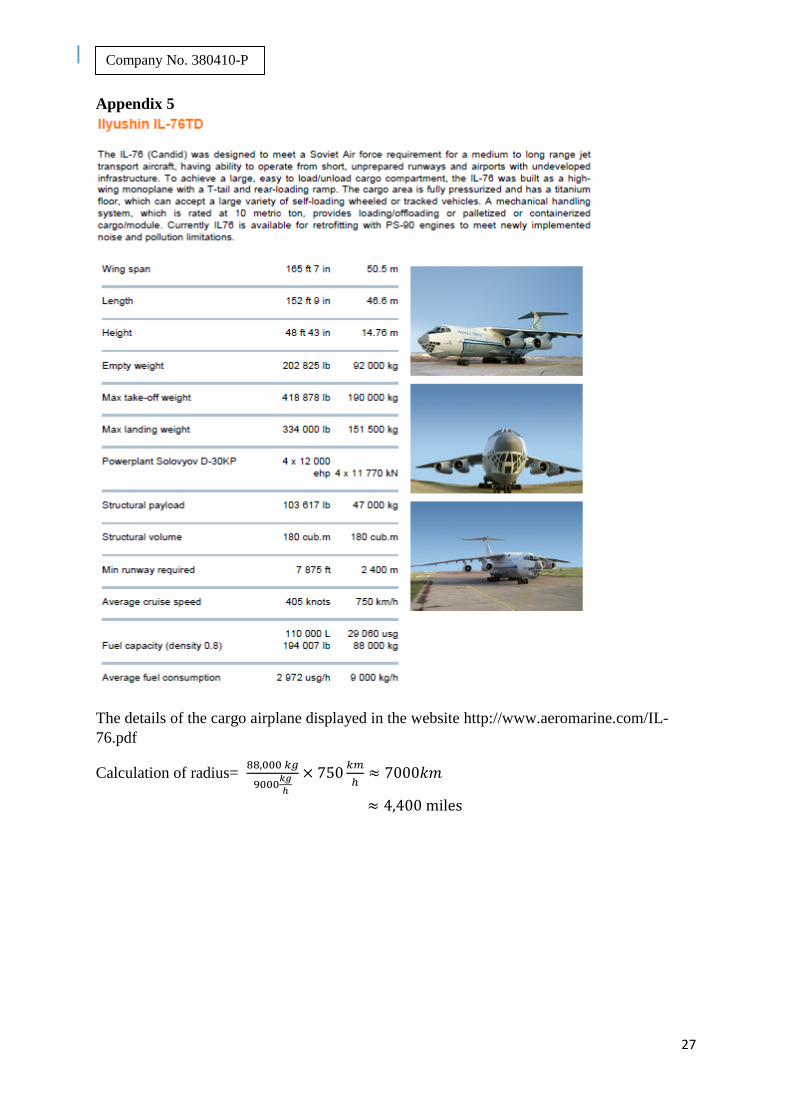
Appendix 4
1993 Ilyushin IL-76TD for sale as displayed in GlobalPlaneSearch.com website
27
Company No. 380410-P
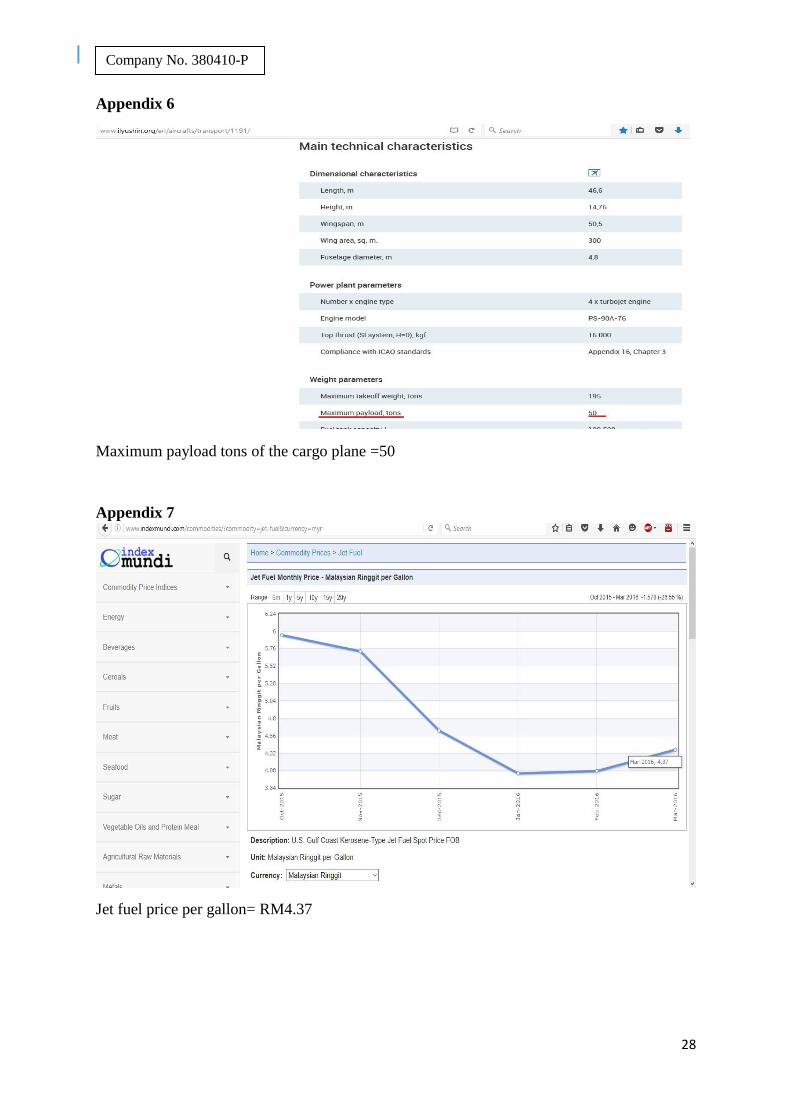
Appendix 5
The details of the cargo airplane displayed in the website http://www.aeromarine.com/IL-
76.pdf
Calculation of radius= 88,000 𝑘𝑔
9000𝑘𝑔
ℎ
× 750𝑘𝑚
ℎ≈ 7000𝑘𝑚
≈ 4,400 miles
28
Company No. 380410-P
Appendix 6
Maximum payload tons of the cargo plane =50
Appendix 7
Jet fuel price per gallon= RM4.37
29
Company No. 380410-P
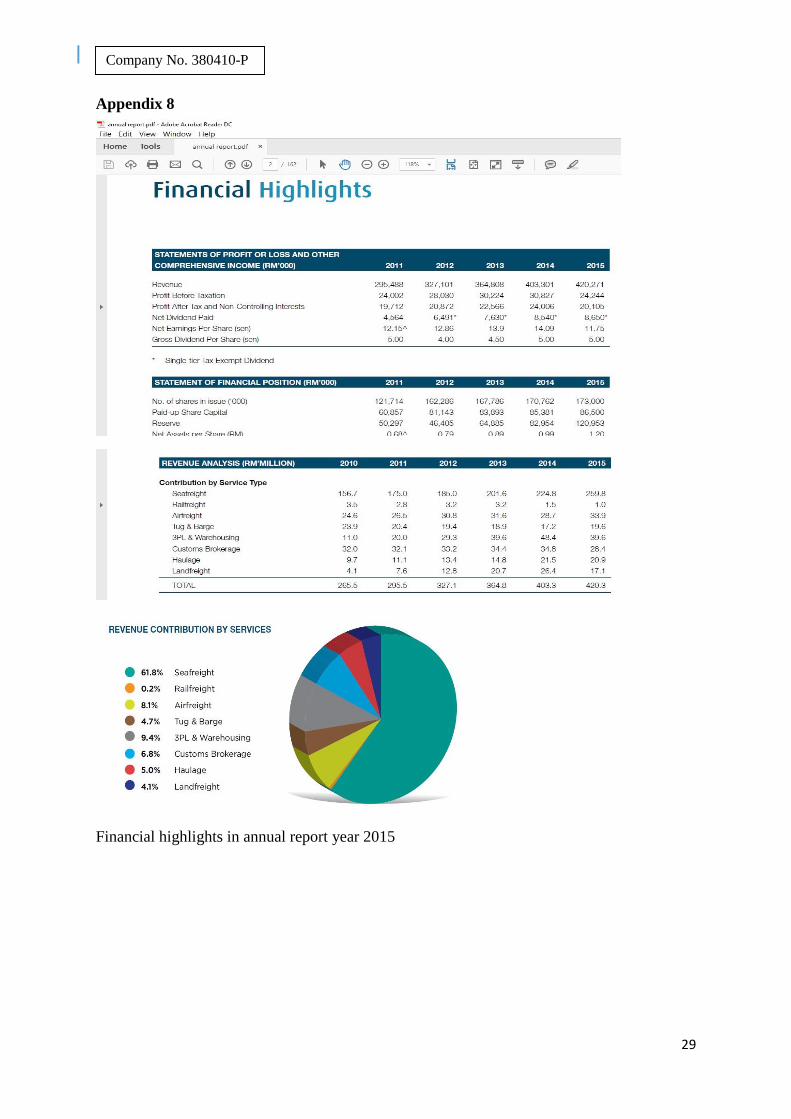
Appendix 8
Financial highlights in annual report year 2015
30
Company No. 380410-P
Appendix 9
Appendix 10
31
Company No. 380410-P
Appendix 11
Appendix 12
32
Company No. 380410-P
Appendix 13
Appendix 14
33
Company No. 380410-P
Appendix 15
34
Company No. 380410-P
Appendix 16
35
Company No. 380410-P
REFERENCES
T. P. (n.d.). What Happens to the Share Price When New Shares Are Issued? Retrieved May
15, 2016, from http://finance.zacks.com/happens-share-price-new-shares-issued-7922.html
Online, T. S. (2015, March 19). Malaysia Airports rights issue oversubscribed. Retrieved
May 3, 2016, from http://www.thestar.com.my/business/business-news/2015/03/19/malaysia-
airports-rights-issue-oversubscribed/
Online, T. S. (2015, December 21). Hubline rights shares fully subscribed. Retrieved May 3,
2016, from http://www.thestar.com.my/business/business-news/2015/12/21/hubline-rights-
fully-subscribed/
Freight Management Holdings Bhd. (n.d.). Retrieved May 7, 2016, from
http://www.fmmalaysia.com.my/i_finance.html
Finding Right Stock. (n.d.). Retrieved May 15, 2016, from
http://www.reuters.com/finance/stocks/MAHB.KL/key-developments/article/3142467
Equities. (n.d.). Retrieved May 15, 2016, from
http://markets.ft.com/research/Markets/Tearsheets/Financials?s=FREIGHT:KLS
Bernardo, A. E., Chowdhry, B., & Goyal, A. (2012). Assessing Project Risk. Journal of
Applied Corporate Finance, 24(3), 94-100. doi:10.1111/j.1745-6622.2012.00393.x
The Capital Asset Pricing Model (CAPM). (2012). Essential Mathematics for Market Risk
Management Hubbert/Essential, 91-99. doi:10.1002/9781118467213.ch7
Definition of "Capital asset pricing model (CAPM)" - NASDAQ Financial Glossary. (n.d.).
Retrieved May 12, 2016, from http://www.nasdaq.com/investing/glossary/c/capital-asset-
pricing-model
Modern Portfolio Theory: An Overview - JMHinternational.com. (n.d.). Retrieved May 12,
2016, from
http://www.jmhinternational.com/news/news/selectednews/files/2009/03/20090312_Investop
edia_ModernPortfolioTheory-An Overview.pdf
Smith, K. V., Elton, E. J., & Gruber, M. J. (1982). Modern Portfolio Theory and Investment
Analysis. The Journal of Finance, 37(5), 1317. doi:10.2307/2327857
Modern Portfolio Theory (MPT) Definition | Investopedia. (2003). Retrieved May 13, 2016,
from http://www.investopedia.com/terms/m/modernportfoliotheory.asp
The MM Capital Structure vs. The Tradeoff Theory of Leverage - CFA Level 1 |
Investopedia. (2008). Retrieved May 13, 2016, from http://www.investopedia.com/exam-
guide/cfa-level-1/corporate-finance/mm-capital-structure-versus-tradeoff-leverage.asp
36
Company No. 380410-P
Trade-off Theory of Capital Structure. (n.d.). Retrieved May 13, 2016, from
http://finance.mapsofworld.com/corporate-finance/hybrid-financing/trade-off-theory-capital-
structure.html
Zhao, T., & Susmel, R. (n.d.). Testing the Trade-Off Theory of Capital Structure: A Kalman
Filter Approach. SSRN Electronic Journal SSRN Journal. doi:10.2139/ssrn.1303209
Miglo, A. (n.d.). The Pecking Order, Trade-Off, Signaling, and Market-Timing Theories of
Capital Structure: A Review. SSRN Electronic Journal SSRN Journal.
doi:10.2139/ssrn.1629304