Embed Size (px)
Citation preview

Q2 & H1 2015 Results Review
July 29th, 2015

2
Safe Harbor Statement and Disclosures
Q2 & H1 2015 Results Review July 29th, 2015
All statements other than statements of historical fact contained in this conference call and accompanying materials including statements regarding our: competitive strengths; business strategy; future financial position or operating results; budgets; projections with respect to revenue, income, earnings (or loss) per share, capital expenditures, dividends, capital structure or other financial items; costs; and plans and objectives of management regarding operations and products, are forward-looking statements. They may also include financial measures that are not in conformance with generally accepted accounting principles in the United States (GAAP). These statements may include terminology such as “may”, “will”, “expect”, “could”, “should”, “intend”, “estimate”, “anticipate”, “believe”, “outlook”, “continue”, “remain”, “on track”, “design”, “target”, “objective”, “goal”, “forecast”, “projection”, “outlook”, “prospects”, “plan”, or similar terminology. Forward-looking statements are not guarantees of future performance. Rather, they are based on current views and assumptions and involve known and unknown risks, uncertainties and other factors, many of which are outside the Company’s control and are difficult to predict. If any of these risks and uncertainties materialize or other assumptions underlying any of the forward-looking statements prove to be incorrect, the actual results or developments may differ materially from any future results or developments expressed or implied by the forward-looking statements. Factors, risks, and uncertainties that could cause actual results to differ materially from those contemplated by the forward-looking statements including, among others: the many interrelated factors that affect consumer confidence and worldwide demand for capital goods and capital goods-related products; general economic conditions in each of the Company’s markets; changes in government policies regarding banking, monetary and fiscal policies; legislation, particularly relating to capital goods-related issues such as agriculture, the environment, debt relief and subsidy program policies, trade and commerce and infrastructure development; government policies on international trade and investment, including sanctions, import quotas, capital controls and tariffs; actions of competitors in the various industries in which the Company competes; development and use of new technologies and technological difficulties; compliance requirements imposed if additional engine emissions legislation and/or regulations are adopted; production difficulties, including capacity and supply constraints and excess inventory levels; labor relations; interest rates and currency exchange rates; inflation and deflation; energy prices; prices for agricultural commodities; housing starts and other construction activity; the Company’s ability to obtain financing or to refinance existing debt; a decline in the price of used vehicles; the resolution of pending litigation and investigations; the evolution of the Company’s alliance with Kobelco Construction Machinery Co., Ltd and Sumitomo (S.H.I.) Construction Machinery Co., Ltd.; the Company’s pension plans and other post-employment obligations; political and civil unrest; volatility and deterioration of capital and financial markets, including further deterioration of the Eurozone sovereign debt crisis and other similar risks and uncertainties; and the Company’s success in managing the risks involved in the foregoing. Further information concerning factors, risks, and uncertainties that could materially affect the Company’s financial results is included in our annual report on Form 20-F for the year ended December 31, 2014, prepared in accordance with U.S. GAAP and in our EU Annual Report at December 31, 2014, prepared in accordance with IFRS. Investors should refer to and consider the incorporated information on risks, factors, and uncertainties in addition to the information presented here. Investors should consider non-GAAP financial measures in addition to, and not as a substitute for, financial measures prepared in accordance with GAAP.
Forward-looking statements speak only as of the date on which such statements are made. Furthermore, in light of ongoing difficult macroeconomic conditions, both globally and in the industries in which CNH Industrial operates, it is particularly difficult to forecast results, and any estimates or forecasts of particular periods that are provided in this earnings release are uncertain. Accordingly, investors should not place undue reliance on such forward-looking statements. The Company can give no assurance that the expectations reflected in forward-looking statements will prove to be correct. Actual results could differ materially from those anticipated in such forward-looking statements. The Company’s outlook is based upon assumptions relating to the factors described in the earnings release, which are sometimes based upon estimates and data received from third parties. Such estimates and data are often revised. The Company undertakes no obligation to update or revise publicly its outlook or forward-looking statements, whether as a result of new developments or otherwise. Further information concerning the Company and its businesses, including factors that potentially could materially affect the Company’s financial results, is included in the Company’s reports and filings with the U.S. Securities and Exchange Commission, the Autoriteit Financiële Markten (“AFM”) and Commissione Nazionale per le Società e la Borsa (“CONSOB”).
All future written and oral forward-looking statements by the Company or persons acting on Company’s behalf are expressly qualified in their entirety by the cautionary statements contained herein or referred to above.

3
Financial Highlights

4
Q2 2015 Highlights
Consolidated
Industrial Activities
Net Sales at $6.6bn, down 10% on a constant currency basis (down 22.5% as reported)
Operating Profit at $401mn, down 37.9% on a constant currency basis (down 40.9% as reported) with margin at 6.0%
Net Industrial Debt as of June 30, 2015 at $3.0bn vs. $3.1bn at Mar. 31, 2015 and $2.7bn at Dec. 31, 2014
Net Industrial Cash Flow positive $519mn in Q2 2015 vs. positive $636mn in Q2 2014
Revenues at $7.0bn, down 10% on a constant currency basis (down 21.9% as reported)
Net income at $122mn, down $236mn vs. last year; Net income before restructuring and other exceptional items at $141mn
EPS at $0.09; EPS before restructuring and other exceptional items at $0.11
Available Liquidity as of June 30, 2015 at $7.8bn (inclusive of $2.8bn in undrawn committed facilities)
Q2 & H1 2015 Results Review July 29th, 2015

5
Q2 2015 From Operating Profit to Net Income
($mn) Q2 2015 Q2 2014 Δ
Industrial Activities Operating profit 401 678 (277)
Financial Services Operating profit 140 152 (12)
Elimination & Other (74) (94) 20
Operating Profit 467 736 (269)
Restructuring expenses (22) (30) 8
Interest expenses of Industrial Activities, net of interest income and eliminations (117) (158) 41
Other, net (93) (63) (30)
Income before income taxes and Equity in income of unconsolidated subsidiaries and affiliates 235 485 (250)
Income taxes (126) (158) 32
Equity in income of unconsolidated subsidiaries and affiliates 13 31 (18)
Net Income 122 358 (236)
Net Income / (Loss) attributable to non-controlling interest (2) 4 (6)
Net Income attributable to CNH Industrial N.V. 124 354 (230)
($)
EPS (basic) 0.09 0.26 (0.17)
EPS (diluted) 0.09 0.26 (0.17)
Basic EPS before restructuring and other exceptional items 0.11 0.28 (0.17)
Q2 & H1 2015 Results Review July 29th, 2015

6
Q2 2015 Cash Flow – Change in Net Industrial Debt
122 174
(61)
(3,016)
(136)
7
(279) (205)
MAR 31, 2015
NET INCOME
D&A CHANGE IN FUNDS & OTHERS
CHANGE IN WC
TANGIBLE & INTANGIBLE
CAPEX
CHANGE IN INVESTMENT,
SCOPE & OTHER
CAPITAL INCREASE, DIVIDENDS & EQUITY
TRANSACTION
FX TRANSLATION EFFECTS
JUN 30, 2015
CHANGE IN NET DEBT
35
($MN)
NET INDUSTRIAL CASH FLOW
519
(3,051)
413
Q2 & H1 2015 Results Review July 29th, 2015
Positive Change in Working Capital of $413mn, up $146mn vs. Q2 2014, driven by reduction in inventory primarily in Agricultural Equipment and the increase in demand for Commercial Vehicles in EMEA

Net Industrial Debt Cash from / (used in) operating activities and Change in Net Debt
Net Industrial Cash Flow of $519mn offset by dividend payment to shareholders and negative FX translation effects
CASH FROM / (USED IN) OPERATING ACTIVITIES
Q2 CHANGE IN NET DEBT
Cash absorption Cash generation
($BN)
($MN)
Q2 & H1 2015 Results Review
-3 -2 -1 0 1 2 3
Q1 '14
Q2 '14
Q3 '14
Q4 '14
Q1 '15
Q2 '15
(899)
1,655
(504)
832
(1,672)
Q2 '14
Q2 '15
Net Industrial Cash Flow Dividend & Others FX Translation Effect
(374) 636 70
July 29th, 2015 7
648
519 (279) (205)
($MN)
Net industrial cash flow at $519mn down $117mn vs. last year primarily
due to decline in AG row crop sector
Maintained a steady dividend distribution per common share (€0.20 in
2014 and 2015)

8
Q2 2015 Industrial Activities - Capex breakdown
BY CATEGORY
BY SEGMENT
Q2 2014 Q2 2015
200
-32%
136
42%
46%
12%
New Products & Technology
Maintenance & Other
Industrial Capacity Expansion < Investments
TOTAL CAPEX ($MN)
52%
6%
30%
12%
Agricultural Equipment
Construction Equipment
Commercial Vehicles
Powertrain
Delta % Q2 ’15 vs. Q2 ‘14
Q2 & H1 2015 Results Review July 29th, 2015

9
Q2 2015 Financial Services performance
KEY HIGHLIGHTS
NET INCOME
($MN)
(*) Including unconsolidated JVs
(**) RoA defined as: PBT / average managed assets annualized
Q2 2014 Q2 2015
105 98
-6.7%
Delta % Q2 ’15 vs. Q2 ‘14
Net income was $98mn, down 6.7% compared to Q2 2014
• Negative impact of currency translation partially offset by reduced SG&A expenses
Retail originations at $2.4bn, down $0.4bn compared to Q2 ’14 mainly due to decline in AG sales
Managed portfolio* at $25.4bn (of which retail 65% and wholesale 35%) up $0.2bn compared to March 31, 2015. Excluding currency impact, managed portfolio decreased $0.2bn compared to March 31, 2015.
• Delinquencies on-book over 30 days were 3.5%, down 1.0 p.p. vs. Q2 ’14
Q2 ’15 Profitability ratios:
• Gross Margin / Average Assets On-Book = 3.7%
• RoA ** = 2.1%
Q2 & H1 2015 Results Review July 29th, 2015

10
Q2 2015 Liquidity & Debt Maturity (June 30th, 2015)
COMPANY AVAILABLE LIQUIDITY
Available Liquidity ($bn)
Debt Maturity Schedule1 ($bn)
1 Represents cash portion of debt maturities as of 06/30/2015 2 Of which $0.7bn ABS related & Restricted Cash
Available liquidity at June 30, 2015 was $7.8bn, compared to
$7.2bn at March 31, 2015
• $5.0bn of cash 2
• $2.8bn undrawn under medium-term committed unsecured
credit lines
Cash generation from operating
activities
Dividend payment to
shareholders
Undrawn M/T Committed Lines Bank Debt
Capital Market
Cash
Other
Bank debt reduction Proceeds from the $600mn notes due
2018, issued by CNH Industrial Capital
LLC (at 3.875% coupon)
NET INTERSEGMENT BALANCE ($BN)
0,0
2,0
4,0
6,0
Dec. '12 Dec. '13 Dec. '14 Mar. '15 Jun. '15
(1.8)
• Net Intersegment balance at $1.8bn at June 30, 2015 (down $0.7bn from March 31, 2015)
Q2 & H1 2015 Results Review July 29th, 2015
As of Q12014
2015 2016 2017 2018 2018 Beyond
$7.8
$2.5 $2.6 $2.8 $3.4
$2.2
$1.1
As of 06/30/2015
6M 2015 2016 2017 2018 Beyond 2019

11
Industrial Activities Overview

12
Q2 2015 Industrial Activities (Net Sales and Operating Profit Composition)
Q2' 14 Organic Growth Q2 '15 @ constant
currency
FX Translation Q2 '15 as reported
2,704
931
4,436
1,250
3,025
794
3,384
1,164
2,470
740
3,035
947
6,634
7,711
Note: Net Sales: Including Other Activities, Unallocated Items & Adjustment & Eliminations
(853)
(1,077)
8,564
Agricultural Equipment Commercial Vehicles Powertrain Construction Equipment
NET SALES OPERATING PROFIT (US GAAP, $/mn)
NET SALES BY CURRENCY Q2 2015 FOREIGN EXCHANGE RATE (*)
Q1 ’14 Q2 ‘14 Q2 ’15 Impact on P&L Q2 ‘15 vs. Q2 ’14
June 30, 2015
$ / € 1.370 1.371 1.105 1.119
BRL / $ 2.366 2.231 3.074 3.101
$ / GBP 1.655 1.683 1.533 1.573
$ / AUD 0.897 0.933 0.778 0.769
(*) Quarterly average;
Q2 '14 Organic Growth Q2 '15 @ constant
currency
FX Translation Q2 '15 as reported
Industrial Activities
(37.9%) (2.9%)
401 421
678
(257) (20)
EUR; 43%
USD; 31%
BRL; 6%
CAD; 4%
GBP; 2%
AUD; 3%
Other; 11%
Note: Numbers may not add due to rounding
Q2 & H1 2015 Results Review July 29th, 2015
(10%) (12.5%)

Q2 2015 Industrial Activities (Net Sales & Operating Profit by Segment)
NET SALES ($MN)
AgriculturalEquipment
ConstructionEquipment
CommercialVehicles
Powertrain Eliminations &Other
IndustrialActivities
-31.6%
4,436
3,035
931 740
2,704 2,470
-20.5%
-22.5%
1,250 947
-24.2%
(757) (558)
-8.7%
Q2 2014 Q2 2015
8,564
6,634
AgriculturalEquipment
ConstructionEquipment
CommercialVehicles
Powertrain Eliminations &Other
IndustrialActivities
-58.4%
632
263
28 35
(21) 25%
n.m.
678
401
OPERATING PROFIT ($MN)
Q2 2014 Q2 2015
8.7%
14.2%
4.7%
3.0%
2.7% 5.6% 6.0%
(0.8%) 5.1% 7.9%
2015 Operating Margin 2014 Operating Margin
(23.7%) (14.8%) 11.9% (6.9%) (10%)
Y-o-Y % change at constant currency
13
67
-40.9%
64
-17.2%
(25) (17)
53
Q2 & H1 2015 Results Review July 29th, 2015

Agricultural Equipment Q2 2015 Financial Results
NET SALES BY REGION & PRODUCT ($)
Q2 '14 Volume /Mix
Pricing, net Prod. Cost SG&A R&D FX / Other Q2 '15
632
(373)
29 23
16 19
(83)
263
14.2%
8.7%
Operating Profit at $263mn, margin at 8.7%
Operating decremental margin at 26%
Positive pricing Volume & Mix (row crop sector primarily in NAFTA) including negative industrial absorption
Cost control actions including purchasing efficiencies
FX negative translation effect primarily on Euro and Brazilian Real with a one-time negative impact from prior year hedge positions on the Euro
OPERATING PROFIT WALK ($MN)
Net sales were $3.0bn down 23.7% on a constant currency basis
compared to Q2 2014 (down 31.6% as reported)
14
38%
39%
10%
13%
55%
21%
24%
NAFTA
LATAM
APAC
EMEA
Tractors
Other
Combines
Volumes (row crop sector primarily in NAFTA)
Net pricing across regions
Q2 & H1 2015 Results Review July 29th, 2015

Agricultural Equipment Inventory management (units of equipment) – Industry units
(*) Excluding Joint Ventures / Source: CNH Industrial Internal Data
Q2 2015 FY 2015E
0-40 HP 5% Flat
40-140 HP 2% Flat to 5%
140+ HP (31%) (20%) to (25%)
NAFTA 1% Flat to (5%)
EMEA (7%) Flat to (5%)
LATAM (26%) (15%) to (20%)
APAC (3%) (10%) to (15%)
Worldwide (4%) (5%) to (10%)
Industry Units
Q2 2015 FY 2015E
NAFTA (31%) (25%) to (30%)
EMEA (9%) (5%) to (10%)
LATAM (19%) (25%) to (30%)
APAC (17%) (15%) to (20%)
Worldwide (17%) (15%) to (20%)
Production and inventory levels down 33% and 14% respectively vs. Q2 2014
15
AGRICULTURAL EQUIPMENT
(MAJOR EQUIPMENT)
Q2 & H1 2015 Results Review July 29th, 2015
Second quarter underproduction vs. retail of 14%
Company inventory down 17% vs. Q1 ‘15 and down 21% vs. Q2 ‘14
Q2-13 Q3-13 Q4-13 Q1-14 Q2-14 Q3-14 Q4-14 Q1 -15 Q2-15
Company Inventory Dealer Inventory AG Retail Sales* AG Production*

Agricultural Equipment Management actions and Main Industry drivers
16
Delta % Q2 ’15 vs. Q2 ‘14
MANAGEMENT ACTIONS INDUSTRY DRIVERS
Q2 14 Q2 15
TOTAL ROW CROP PRODUCTION
(41%)
CNH INDUSTRIAL’S AUSTRIAN PLANT ACHIEVES REGION’S
FIRST WORLD CLASS MANUFACTURING SILVER DESIGNATION
Continuous y-o-y production slow down in row crop segment and cost containment actions in SG&A and R&D to offset negative absorption
While undertaking rigorous cost containment actions, company remains focused on achieving best-in-class WCM standards across plants
First plant (in AG segment) to receive a silver WCM designation in the EMEA region
Q2 & H1 2015 Results Review July 29th, 2015
AG SG&A EXPENSES ($ MN)
AG R&D EXPENSES ($ MN)
Q2 14 Q2 15
(18%)
Q2 14 Q2 15
(26%) $528
$355
$203 $167
$307
$210
$0
$200
$400
$600
$800
gen
-08
giu
-08
dic
-08
giu
-09
dic
-09
giu
-10
dic
-10
giu
-11
dic
-11
giu
-12
dic
-12
giu
-13
dic
-13
giu
-14
dic
-14
giu
-15
SOYBEANS CORN WHEAT Delta % y-o-y
(32%)
(32%)
(18%)
MONTHLY COMMODITY PRICE (US$ PER METRIC TON) *
(*) Source: IHS Global Insight; Commodity spot as per CME Group (**) Source: USDA June 30, 2015
US ACREAGE FORECAST (MN) **
90,6 88,9
83,7 85,1
56,8 56,1
40
50
60
70
80
90
100
110
2005 2006 2007 2008 2009 2010 2011 2012 2013 2014 2015E
CORN SOYBEANs WHEAT Delta % y-o-y
+1.7%
(1.3%)
(1.9%)

Construction Equipment Q2 2015 Financial Results
Net sales were $740mn down 14.8% on a constant currency basis
(down 20.5% as reported)
Q2 '14 Volume /Mix
Pricing, net Prod. Cost SG&A R&D FX / Other Q2 '15
28
3.0%
(23)
5
6 2
10
7 35
Operating Profit at $35mn vs. $28mn last year,
margin at 4.7% up 1.7 p.p.
NET SALES BY REGION & PRODUCT ($) OPERATING PROFIT WALK ($MN)
17
58%
20%
12%
10%
56%
43%
1%
NAFTA
LATAM
APAC
EMEA
Light
Other
Heavy
Volume (primarily LATAM) LATAM volume & mix Efficiency Program in SG&A
and R&D costs
Q2 & H1 2015 Results Review July 29th, 2015
4.7%

Construction Equipment Inventory management (units of equipment) – Industry units
Q2 2015 overproduction to in anticipation of Q3 holiday shutdown
Note: As of Q2 2014, industry volume data for Heavy Construction Equipment includes compaction equipment, which historically was not in the Light or Heavy Equipment definitions. Further, industry volume data for Heavy Construction Equipment no longer includes Dumpers as CNH Industrial is no longer active in this segment. The data for current and prior periods is updated to reflect this definition change
Industry Units
Q2 2015 FY 2015E
NAFTA 6% Flat to 5%
EMEA 1% Flat to 5%
LATAM (22%) (20%) to (25%)
APAC (11%) (10%) to (15%)
Worldwide (1%) Flat to (5%)
Q2 2015 FY 2015E
NAFTA (6%) Flat
EMEA (2%) Flat to (5%)
LATAM (43%) (30%) to (35%)
APAC (25%) (20%) to (25%)
Worldwide (18%) (10%) to (15%)
18
CONSTRUCTION EQUIPMENT
(LIGHT & HEAVY)
Q2 & H1 2015 Results Review July 29th, 2015
Second quarter overproduction vs. retail of 16%
Q2-13 Q3-13 Q4-13 Q1-14 Q2-14 Q3-14 Q4-14 Q1-15 Q2-15
Company Inventory Dealer Inventory CE Retail Sales* CE Production*

Commercial Vehicles Q2 2015 Financial Results
Operating Profit at $67mn up $88mn vs. last year, margin at 2.7%
Industrial efficiencies
Regulatory R&D
Q2 '14 Volume /Mix
Pricing, net Prod. Cost SG&A R&D FX / Other Q2 '15
(21)
56 21
(8)
16 5
(2)
67
(0.8%)
2.7%
NET SALES BY REGION & PRODUCT ($) OPERATING PROFIT WALK ($MN)
Q2 2015 Book to Bill at 1.06 up 0.16 vs. last year Q2 2015 order intake in EMEA Trucks up 49% (with strong double digit increase across segments)
77%
14%
9%
EMEA
APAC
LATAM Trucks
Specialty Vehicles
Buses
Net Sales at $2.5bn, up 11.9% on a constant currency basis (down 8.7% as
reported)
EMEA volumes (Trucks and Buses)
EMEA LATAM APAC TOTAL EMEA LATAM APAC TOTAL
25.6
31.4
(K units)
4.5 3.7 3.0 2.8
33.1 37.8
+14%
Q2 2014 Q2 2015
24.0
33.4
3.5 4.1 +32%
2.9 2.6
30.4
40.2
19
APAC volumes (Buses)
Q2 & H1 2015 Results Review July 29th, 2015
75%
16%
9%
LATAM (mainly in Brazil heavy truck) partially offset by recovery in Argentina
Volume & Mix in EMEA
Pricing in EMEA and LATAM

Commercial Vehicles Inventory management (units of equipment) – Industry units
COMMERCIAL VEHICLES
(ALL EQUIPMENT)
Second quarter overproduction vs. retail at 11% with EMEA up 13%
* Reflects aggregate for key markets where the Company competes: EMEA: 28 member countries of the European Union,; LATAM: Brazil, Argentina and Venezuela; APAC: Russia, Turkey, South East Asia, Australia, New Zealand
Overproduction in Q2 to build inventory to cover Q3 scheduled shutdowns
Industry Units
Q2 2015 FY 2015E
EMEA* 17.4% 10% to 15%
LATAM* (35.2%) (35%) to (40%)
APAC* (6.3%) ~ (10%)
20 Q2 & H1 2015 Results Review July 29th, 2015
Q1 '13 Q2 '13 Q3 '13 Q4 '13 Q1 '14 Q2'14 Q3 '14 Q4 14 Q1 15 Q2 15
Company Inventory Dealer Inventory
CVs Retail Sales* CVs Production*

Commercial Vehicles Focus on EMEA Trucks
21
• Light: leverage New Daily complete line-up, in particular the class exclusive
Hi-Matic automatic transmission, to improve pricing and grow share in
Premium North European markets
• Medium: expand leadership with double offering of upper end Daily 7.2T
and Eurocargo
• Heavy: capitalize on unique Euro VI Hi-SCR technology resonating well with
Best-in-Class TCO value-player positioning
Q2 & H1 2015 Results Review
Q2 '14 Q2 '15
EMEA Trucks up 49% vs. Q2 2014 (EU28 up 45% and AME up 96%)
• Light up 43% (EU28 up 41% and AME up 3.5x)
• Medium up 35% (EU28 up 35% and AME up 24%)
• Heavy up 67% (EU28 up 62% and AME up 85%)
EMEA TRUCKS – Q2 ’15 ORDER INTAKE (K/UNITS)
European Truck market share at 11.5% up 0.6 p.p. vs. Q2 2014
• Light at 11.5% up 0.6 p.p. vs. Q2 2014 (June at 12.0% up 1.6 p.p. vs. May)
• Medium at 31.7% up 3.7 p.p. vs. Q2 2014 (June at 30.7% up 4.8 p.p. vs. May )
• Heavy at 7.7% up 0.4 p.p. vs. Q2 2014 (June at 8.8% up 1.3 p.p. vs. May)
EU28 – Q2 ’15 MARKET SHARE (%)
Light Medium Heavy
July 29th, 2015
Q1 '14 Q2 '14 Q3 '14 Q4 '14 Q1 '15 Q2 '15
Q1 '14 Q2 '14 Q3 '14 Q4 '14 Q1 '15 Q2 '15
Q1 '14 Q2 '14 Q3 '14 Q4 '14 Q1 '15 Q2 '15
+49%
11.5%
31.7%
7.7%
EUROPEAN ROAD FREIGHT VOLUMES * (INDEXED LEVEL)
IVECO TRUCKS - EUROPEAN STRATEGY
* Sources: Rementum Research, European road authorities
20
40
60
80
100
120
1990 1992 1994 1996 1998 2000 2002 2004 2006 2008 2010 2012 2014 2016
European road freight volumes (Jan '07 = 100) 12-month avg.

Powertrain Q2 2015 Financial Results
Q2 2015 third party Net sales at 42% vs. 41% in Q2 2014
KEY HIGHLIGHTS
NET SALES BY REGION & PRODUCT ($)
Net sales were $947mn, down 6.9% on a constant currency basis
compared to 2014 (down 24.2% as reported), on lower volumes
due to decreased agricultural equipment demand and the 2014
wrap-up of Tier 4 final transition engine inventory for the off-road
segment
Operating profit of $53mn, substantially flat on a constant
currency basis (down $11mn as reported), with an operating
margin of 5.6% (up 0.5 p.p. vs. 2014)
Engines
Axles
Gearboxes
NAFTA
LATAM
APAC
EMEA
Industrial efficiencies including purchasing savings
22
Volumes
Q2 & H1 2015 Results Review July 29th, 2015
87%
2%
11%
3%
74%
8%
15%
Product Mix

Powertrain Units Sold (% change y-o-y)
ENGINES
TRANSMISSIONS
AXLES
Engines sold to third party at 51% vs. 46% in Q2 2014
KEY HIGHLIGHTS
Units sold by business line
• Engines down 16% to 134.8k units (CV 35%, AG 10%, CE
4% and 51% to external customers); third party sales at
69k units
• Transmissions up 14% to 20.9k units
• Axles up 17% at 51.8k units
Units Sold Q2 ’15 vs. Q2 ’14
(16%)
14%
17%
23 Q2 & H1 2015 Results Review July 29th, 2015

24
FY 2015E US GAAP Financial Targets

H2 2015E
25 Q2 & H1 2015 Results Review
WHAT IS EXPECTED FOR H2 2015E
Agricultural Equipment
• Further downward revision in demand to reflect protracted market weaknesses in the row crop segment in NAFTA and LATAM
Construction Equipment
• Depressed market conditions in LATAM demanding production adjustment of more than 50% in H2 in the region
• NAFTA and EMEA continues to show signs of recovery
Commercial Vehicles
• EMEA recovery ahead of initial expectation
• LATAM depressed scenario on lower subsidy availability
Preliminary view
July 29th, 2015
H1 2014 H1 2015 H2 2014 H2 2015E
AG Unit Production
(28%) (12%)
CE Unit Production (2%) (18%)
H1 2014 H1 2015 H2 2014 H2 2015E
CV Unit Production
H1 2014 H1 2015 H2 2014 H2 2015E
+12% +15%
Continuous tight control on structural and discretionary costs to mitigate negative volume absorption
Δ H2 ’15E vs. H2 ’14 Δ H1 ‘15 vs. H1 ‘14 FY 2014 Average FY 2015E Average
Δ H2 ’15E vs. H2 ’14 Δ H1 ‘15 vs. H1 ‘14 FY 2014 Average FY 2015E Average
Δ H2 ’15E vs. H2 ’14 Δ H1 ‘15 vs. H1 ‘14 FY 2014 Average FY 2015E Average
FY Average (Δ)
NEW OLD
(21%) (14%)
FY Average (Δ)
NEW OLD
(10%) +4%
FY Average (Δ)
NEW OLD
+15% +15%

FY 2015E US GAAP Financial Targets
As a result of continued demand weakness in the agricultural row crop sector and in order to foster additional clearing of
finished goods inventory, primarily in the North American and LATAM markets, the Company will adjust production
accordingly in the second half of 2015
Full year guidance is therefore updated as follows to reflect the negative impact on operating margin and the positive
impact on working capital due to these production adjustments:
Net sales of Industrial Activities in the range of $26-27 billion, with an operating margin of Industrial Activities
between 5.6% and 6.0%;
Net industrial debt at the end of 2015 between $2.0 billion and $2.2 billion
26
Note: Guidance – FX $/€ assumed at 1.10 – BRL/$ assumed at 3.10
Q2 & H1 2015 Results Review July 29th, 2015

27
Appendix

28
Q2 2015 Results highlights (IFRS $ & US GAAP $) – delta with previous year
($MN) REVENUES Trading Profit Operating Profit MARGIN
(IFRS) Δ (US GAAP) Δ (IFRS) Δ (US GAAP) Δ (IFRS) (US GAAP)
Agricultural Equipment 3,035 (1,401) 3,035 (1,401) 211 (400) 263 (369) 7.0% 8.7%
Construction Equipment 740 (191) 740 (191) 19 (15) 35 7 2.6% 4.7%
Commercial Vehicles 2,531 (225) 2,470 (234) 56 95 67 88 2.2% 2.7%
Powertrain 949 (303) 947 (303) 50 (15) 53 (11) 5.3% 5.6%
Other Activities, Unallocated Items, Elim. & Other (558) 199 (558) 199 (17) (1) (17) 8
Industrial Activities 6,697 (1,921) 6,634 (1,930) 319 (336) 401 (277) 4.8% 6.0%
Financial Services 491 (37) 423 (45) 138 (8) 140 (12) 28.1% 33.1%
Eliminations (128) 10 (99) 22 - - (74) 20
Group 7,060 (1,948) 6,958 (1,953) 457 (344) 467 (269) 6.5% 6.7%
NET PROFIT / (LOSS) EPS (Basic)
(IFRS) Δ (US GAAP) Δ (IFRS) Δ (US GAAP) Δ
Attributable to CNH Industrial N.V. 178 (221) 124 (230) 0.13 (0.16) 0.09 (0.17)
Attributable to non-controlling interest (1) (5) (2) (6)
Group 177 (226) 122 (236)
($MN) ($)
Q2 & H1 2015 Results Review July 29th, 2015

29
H1 2015 Results highlights (IFRS $ & US GAAP $) – delta with previous year
($MN) REVENUES Trading Profit Operating Profit MARGIN
(IFRS) Δ (US GAAP) Δ (IFRS) Δ (US GAAP) Δ (IFRS) (US GAAP)
Agricultural Equipment 5,612 (2,530) 5,612 (2,530) 368 (685) 467 (629) 6.6% 8.3%
Construction Equipment 1,342 (363) 1,342 (363) 15 (20) 35 4 1.1% 2.6%
Commercial Vehicles 4,622 (488) 4,507 (505) 34 147 68 159 0.7% 1.5%
Powertrain 1,853 (604) 1,848 (603) 78 (17) 89 (9) 4.2% 4.8%
Other Activities, Unallocated Items, Elim. & Other (1,050) 483 (1,050) 483 (36) (1) (35) 9
Industrial Activities 12,379 (3,502) 12,259 (3,518) 459 (576) 624 (466) 3.7% 5.1%
Financial Services 985 (52) 836 (72) 265 (11) 269 (17) 26.9% 32.2%
Eliminations (237) 29 (177) 57 - - (142) 32
Group 13,127 (3,525) 12,918 (3,533) 724 (587) 751 (451) 5.5% 5.8%
NET PROFIT / (LOSS) EPS (Basic)
(IFRS) Δ (US GAAP) Δ (IFRS) Δ (US GAAP) Δ
Attributable to CNH Industrial N.V. 206 (338) 146 (308) 0.15 (0.25) 0.11 (0.22)
Attributable to non-controlling interest 1 (4) (1) (6)
Group 207 (342) 145 (314)
($MN) ($)
Q2 & H1 2015 Results Review July 29th, 2015

30
Q2 2015 Efficiency Program – update
Q2 2015 Program to date
Total charges $21mn * $217mn
Agricultural Equipment $3mn $52mn
Construction Equipment - $39mn
Commercial Vehicles $18mn $126mn
Q2 & H1 2015 Results Review July 29th, 2015
* $1mn restructuring charge referring to FS excluded from the Efficiency Program

31
H1 2015 From Operating Profit to Net Income
($mn) H1 2015 H1 2014 Δ
Industrial Activities Operating profit 624 1,090 (466)
Financial Services Operating profit 269 286 (17)
Elimination & Other (142) (174) 32
Operating Profit 751 1,202 (451)
Restructuring expenses (34) (42) 8
Interest expenses of Industrial Activities, net of interest income and eliminations (223) (299) 76
Other, net (168) (157) (11)
Income before income taxes and Equity in income of unconsolidated subsidiaries and affiliates 326 704 (378)
Income taxes (203) (301) 98
Equity in income of unconsolidated subsidiaries and affiliates 22 56 (34)
Net Income 145 459 (314)
Net Income / (Loss) attributable to non-controlling interest (1) 5 (6)
Net Income attributable to CNH Industrial N.V. 146 454 (308)
($)
EPS (basic) 0.11 0.33 (0.22)
EPS (diluted) 0.11 0.33 (0.22)
Basic EPS before restructuring and other exceptional items 0.13 0.41 (0.28)
Q2 & H1 2015 Results Review July 29th, 2015

32
Q2 & H1 2015 Net Income / (Loss) to Net Income and basic EPS before Restructuring and Exceptional Items (US GAAP)
Q2 & H1 2015 Results Review
Second Quarter First Half
2015 2014 2015 2014
Net Income 122 358 145 459
Restructuring expenses, net of tax 19 24 29 36
Other exceptional items, net of tax - - - 64
Net Income before restructuring and other exceptional items 141 382 174 559
Net Income before restructuring and other exceptional items attributable to CNH Industrial N.V.
143 378 175 554
Weighted average shares outstanding 1,361 1,354 1,360 1,353
Basic EPS before restructuring and exceptional items 0.11 0.28 0.13 0.41
($MN)
July 29th, 2015
33
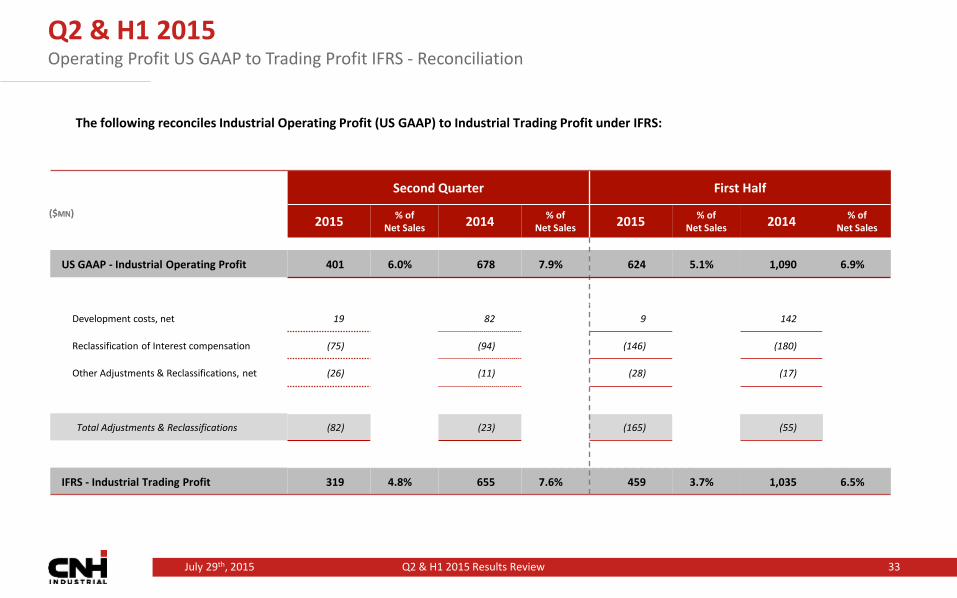
Q2 & H1 2015 Operating Profit US GAAP to Trading Profit IFRS - Reconciliation
The following reconciles Industrial Operating Profit (US GAAP) to Industrial Trading Profit under IFRS:
Q2 & H1 2015 Results Review
Second Quarter First Half
2015 % of
Net Sales 2014 % of
Net Sales 2015 % of
Net Sales 2014 % of
Net Sales
US GAAP - Industrial Operating Profit 401 6.0% 678 7.9% 624 5.1% 1,090 6.9%
Development costs, net 19 82 9 142
Reclassification of Interest compensation (75) (94) (146) (180)
Other Adjustments & Reclassifications, net (26) (11) (28) (17)
Total Adjustments & Reclassifications (82) (23) (165) (55)
IFRS - Industrial Trading Profit 319 4.8% 655 7.6% 459 3.7% 1,035 6.5%
($MN)
July 29th, 2015

34
Q2 & H1 2015 Net Income / (Loss) US GAAP to Profit / (Loss) under IFRS - Reconciliation
The following reconciles Net Income / (Loss) in US GAAP to Profit / (Loss) under IFRS:
Q2 & H1 2015 Results Review
Second Quarter First Half
2015 EPS 2014 EPS 2015 EPS 2014 EPS
Net Income attributable to CNH Industrial N.V. 124 0.09 354 0.26 146 0.13 454 0.33
Plus: Net Income attributable to non-controlling interest (2) 4 (1) 5
Net Income in accordance with US GAAP 122 358 145 459
Development costs, net 19 82 9 142
Others, net 15 9 38 (4)
Taxes 21 (46) 15 (48)
Total adjustment 55 45 62 90
Profit/(loss) in accordance with IFRS 177 403 207 549
Less: Profit/(Loss) attributable to non-controlling interest (1) 4 1 5
Profit/(Loss) attributable to CNH Industrial N.V. 178 0.13 399 0.29 206 0.15 544 0.40
($MN)
July 29th, 2015

35
June 30, 2015 Total Equity – US GAAP to IFRS Reconciliation
Jun. 30, 2015 Dec. 31, 2014
Total Equity in accordance with US GAAP 4,838 4,961
(a) Development costs, net 2,655 2,819
(b) Goodwill and other intangible assets (117) (122)
(c) Defined benefit plans (33) (6)
(d) Restructuring provision (8) (12)
(e) Other adjustments (2) (16)
(f) Tax impact on adjustments (773) (815)
(g) Deferred tax assets and tax contingencies recognition 806 768
Total adjustment 2,528 2,616
Total Equity in accordance with IFRS 7,366 7,577
($MN)
Q2 & H1 2015 Results Review July 29th, 2015

36
Q2 & H1 2015 Cash Flow – Change in Net Industrial Debt (US GAAP)
(*) Excluding assets sold under buy-back commitments and assets under operating lease
Q2 & H1 2015 Results Review
(US$/mn) Q2 2015 Q2 2014 Δ H1 2015 H1 2014 Δ
Net Debt of Industrial Activities at the beginning of period (3,051) (4,024) 973 (2,691) (2,214) (477)
Net income 122 358 (236) 145 459 (314)
Amortization and depreciation (*) 174 183 (9) 346 358 (12)
Change in provision and similar, and item related to assets sold under buy-back commitments and asset under operating lease
(61) 24 (85) (116) 87 (203)
Change in working capital 413 267 146 (626) (1,744) 1.118
Investments in property, plant and equipment and intangible assets (*) (136) (200) 64 (224) (342) 118
Other changes 7 4 3 2 24 (22)
Net Industrial cash flow 519 636 (117) (473) (1,158) 685
Capital increases, dividends (279) (374) 95 (277) (373) 96
Currency translation differences (205) 70 (275) 425 53 372
Change in Net debt of Industrial Activities 35 332 (297) (325) (1,478) 1,153
Net Debt of Industrial Activities at the end of period (3,016) (3,692) 676 (3,016) (3,692) 676
July 29th, 2015

37
Q2 2015 Gross Debt - Breakdown
MARCH 31, 2015 JUNE 30, 2015
Q2 & H1 2015 Results Review July 29th, 2015
Industrial Financial Services Industrial Financial Services
3.2 2.3 Bank Debt 2.8 2.5
4.9 3.5 Capital Market 5.0 4.1
0.2 0.1 Other Debt 0.2 0.1
8.3 5.9 Cash Maturities 8.0 6.6
0.0 10.0 ABS / Securitization 0.0 10.3
0.0 1.1 Warehouse Facilities 0.0 0.8
0.0 1.4 Sale of Receivables 0.0 1.6
0.0 12.5 Securitization and Sale of Receivables (on book) 0.0 12.7
0.8 3.3 Intersegment Financial Payables 0.8 2.7
9.1 21.6 Total Debt 8.8 22.0
3.3 0.8 Intersegment Financial Receivables 2.7 0.8
2.7 1.8 Cash & Mkt Securities 3.1 1.9
3.1 19.0 Net Debt 3.0 19.3
Note: Numbers may not add due to rounding

38
Q2 2015 Debt Maturity Schedule - Breakdown
Outstanding June 30, 2015
6M 2015 2016 2017 2018 2019 Beyond
5.2 Bank Debt 1.3 1.7 0.7 0.8 0.5 0.2
9.1 Capital Market 1.1 0.9 2.1 2.6 1.7 0.8
0.2 Other Debt 0.1 0.0 0.0 0.0 0.0 0.1
14.6 Cash Portion of Debt Maturities 2.5 2.6 2.8 3.4 2.2 1.1
(5.0) Cash & Marketable Securities
(0.7) of which ABS related
(2.8) Undrawn committed credit lines
(7.8) Total Available Liquidity
($BN)
Note: Numbers may not add due to rounding
Q2 & H1 2015 Results Review July 29th, 2015

39
Geographic Information
Consistent with the organization structure, certain financial and market information in this presentation has been presented separately by geographic area. CNH Industrial defines its geographic areas as
NAFTA: United States, Canada and Mexico
LATAM: Central and South America, and the Caribbean Islands
APAC: Continental Asia (including Turkey and Russia), Oceania and member countries of the Commonwealth of Independent States (excluding Ukraine)
EMEA: 28 member countries of the European Union, European Free Trade Association, Ukraine, Balkans, African continent, and Middle East (excluding Turkey)
Market Share / Market Position Data
Certain industry and market share information in this report has been presented on a worldwide basis which includes all countries.
In this report, management estimates of market share information are generally based on retail unit data in North America, on registrations of equipment in most of Europe, Brazil, and various APAC markets, and on retail and shipment unit data collected by a central information bureau appointed by equipment manufacturers associations, including the Association of Equipment Manufacturers’ in North America, the Committee for European Construction Equipment in Europe, the ANFAVEA in Brazil, the Japan Construction Equipment Manufacturers Association, and the Korea Construction Equipment Manufacturers Association, as well as on other shipment data collected by an independent service bureau.
Not all agricultural or construction equipment is registered, and registration data may thus underestimate, perhaps substantially, actual retail industry unit sales demand, particularly for local manufacturers in China, Southeast Asia, Eastern Europe, Russia, Turkey, Brazil, and any country where local shipments are not reported.
For Commercial Vehicles regions are defined for both market share and TIV as: Europe (28 countries reflecting key market where the segment competes); LATAM (Brazil, Argentina and Venezuela) and APAC (Russia, Turkey, South East Asia, Australia, New Zealand)
In addition, there may also be a period of time between the shipment, delivery, sale and/or registration of a unit, which must be estimated, in making any adjustments to the shipment, delivery, sale, or registration data to determine our estimates of retail unit data in any period
Q2 & H1 2015 Results Review July 29th, 2015

40
Non-GAAP Financial Measures
CNH Industrial monitors its operations through the use of several non-GAAP financial measures. CNH Industrial believes that these non-GAAP financial measures provide useful and relevant information regarding its results and enhance the reader’s ability to assess CNH Industrial’s financial performance and financial position. They provide measures which facilitate management’s ability to identify operational trends, as well as make decisions regarding future spending, resource allocations and other operational decisions. These and similar measures are widely used in the industries in which the Company operates. These financial measures may not be comparable to other similarly titled measures of other companies and are not intended to be substitutes for measures of financial performance and financial position as prepared in accordance with US GAAP and/or IFRS. CNH Industrial non-GAAP financial measures are defined as follows: Operating Profit under US GAAP Operating Profit of Industrial Activities is defined as net sales less cost of goods sold, selling, general and administrative expenses and research and development expenses. Operating Profit of Financial Services is defined as revenues, less selling, general and administrative expenses, interest expenses and certain other operating expenses. Trading Profit under IFRS Trading Profit is derived from financial information prepared in accordance with IFRS and is defined as income before restructuring, gains/(losses) on disposal of investments and other unusual items, interest expense of Industrial Activities, income taxes, equity in income (loss) of unconsolidated subsidiaries and affiliates, non-controlling interests. Net income (loss) before restructuring and exceptional items Net income (loss) before restructuring and exceptional items is Net income (loss), less restructuring charges and exceptional items, after tax Net Debt and Net Debt of Industrial Activities (or Net Industrial Debt) CNH Industrial provides the reconciliation of Net Debt to Total Debt, which is the most directly comparable measure included in the consolidated balance sheets. Due to different sources of cash flows used for the repayment of the debt between Industrial Activities and Financial Services (by cash from operations for Industrial Activities and by collection of financing receivables for Financial Services), management separately evaluates the cash flow performance of Industrial Activities using Net Debt of Industrial Activities. Working Capital Working capital is defined as trade receivables and financing receivables related to sales, net, plus inventories, less trade payables, plus other assets (liabilities), net Constant Currency Basis CNH Industrial discusses the fluctuations in revenues and certain non-GAAP financial measures on a constant currency basis by applying the prior-year exchange rates to current year’s values expressed in local currency in order to eliminate the impact of foreign exchange rate fluctuations.
Q2 & H1 2015 Results Review July 29th, 2015

Investor Relations Team
Federico Donati – Head of Investor Relations +39 (011) 00 - 62756
Noah Weiss – Investor Relations North America +1 (630) 887 - 3745
e-mail: [email protected]
website: www.cnhindustrial.com
41
Contacts
Q2 & H1 2015 Results Review July 29th, 2015


![Investor Update Q2 FY16 / H1 FY16 [Company Update]](https://img.pdfslide.us/doc/110x75/577ca80a1a28abea748caad0/investor-update-q2-fy16-h1-fy16-company-update.jpg)