Embed Size (px)
Citation preview

A CUSHMAN & WAKEFIELD QUARTERLY RESEARCH PUBLICATION
Q2 ASIA PACIFIC OFFICE OVERVIEW
A p r i l - J u n e | 2 0 1 7
INSIGHTS INTO
ACTION
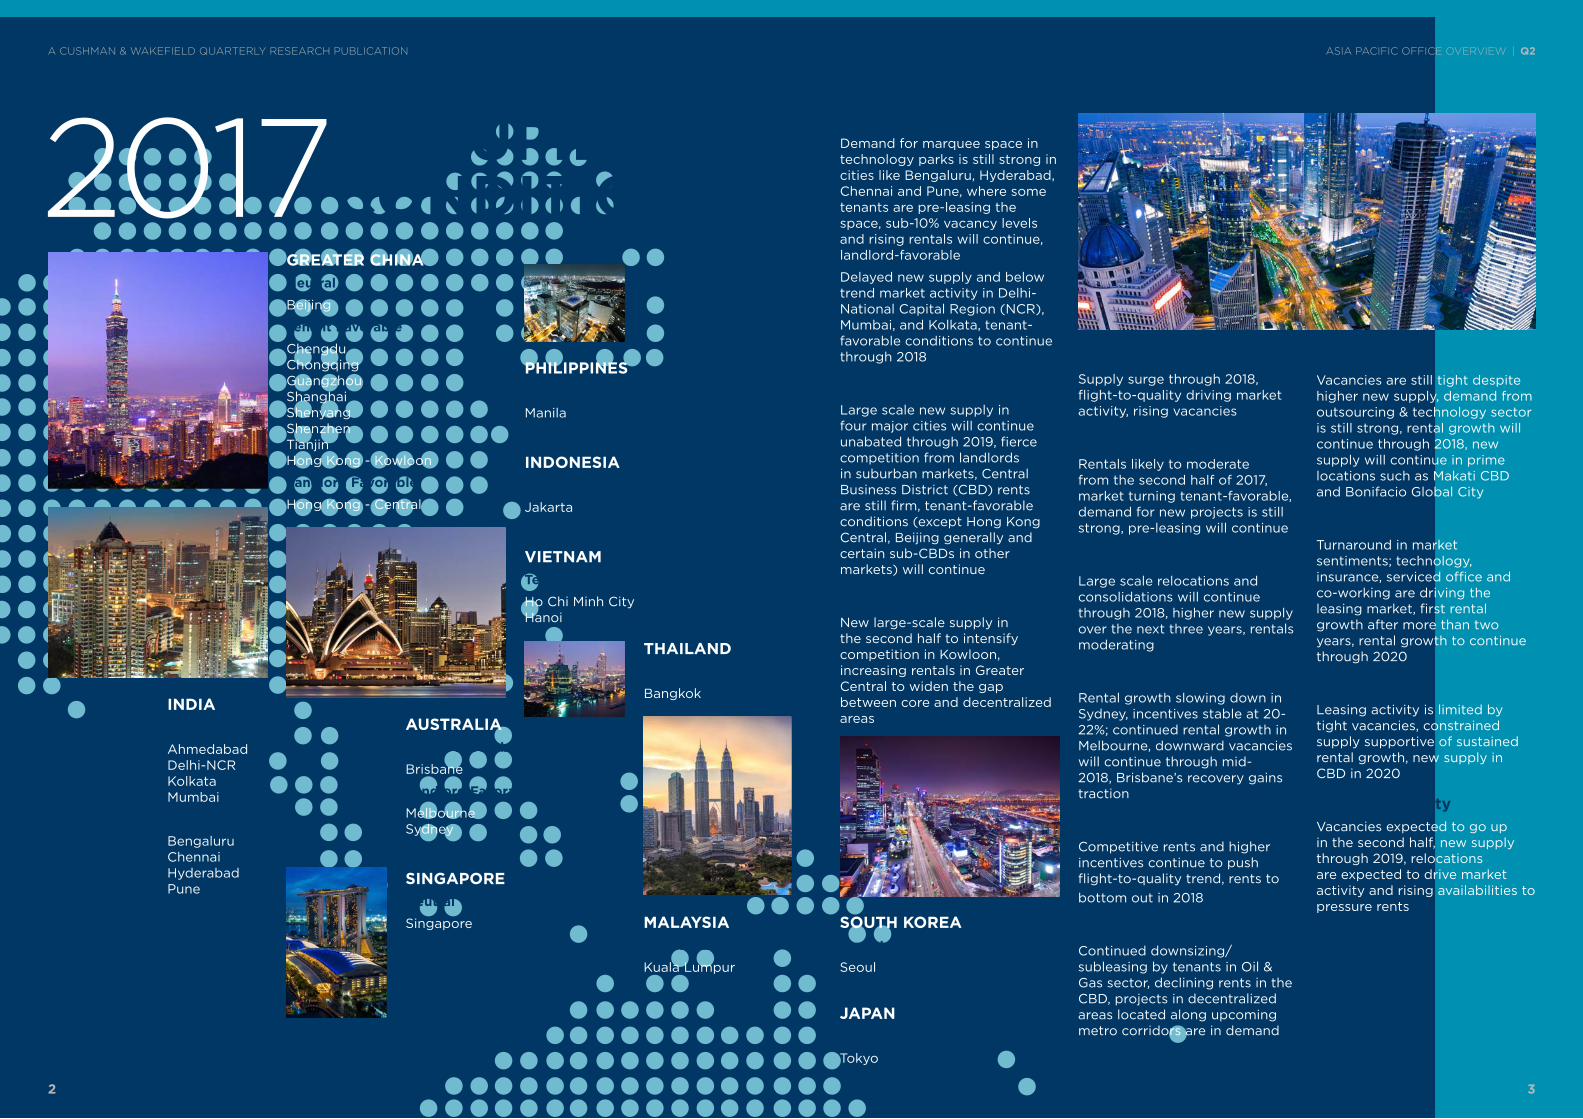
IndiaDemand for marquee space in technology parks is still strong in cities like Bengaluru, Hyderabad, Chennai and Pune, where some tenants are pre-leasing the space, sub-10% vacancy levels and rising rentals will continue, landlord-favorable
Delayed new supply and below trend market activity in Delhi-National Capital Region (NCR), Mumbai, and Kolkata, tenant-favorable conditions to continue through 2018
ChinaLarge scale new supply in four major cities will continue unabated through 2019, fierce competition from landlords in suburban markets, Central Business District (CBD) rents are still firm, tenant-favorable conditions (except Hong Kong Central, Beijing generally and certain sub-CBDs in other markets) will continue
Hong KongNew large-scale supply in the second half to intensify competition in Kowloon, increasing rentals in Greater Central to widen the gap between core and decentralized areas
TaiwanSupply surge through 2018, flight-to-quality driving market activity, rising vacancies
JapanRentals likely to moderate from the second half of 2017, market turning tenant-favorable, demand for new projects is still strong, pre-leasing will continue
South KoreaLarge scale relocations and consolidations will continue through 2018, higher new supply over the next three years, rentals moderating
AustraliaRental growth slowing down in Sydney, incentives stable at 20-22%; continued rental growth in Melbourne, downward vacancies will continue through mid-2018, Brisbane’s recovery gains traction
JakartaCompetitive rents and higher incentives continue to push flight-to-quality trend, rents to bottom out in 2018
Kuala LumpurContinued downsizing/subleasing by tenants in Oil & Gas sector, declining rents in the CBD, projects in decentralized areas located along upcoming metro corridors are in demand
ManilaVacancies are still tight despite higher new supply, demand from outsourcing & technology sector is still strong, rental growth will continue through 2018, new supply will continue in prime locations such as Makati CBD and Bonifacio Global City
SingaporeTurnaround in market sentiments; technology, insurance, serviced office and co-working are driving the leasing market, first rental growth after more than two years, rental growth to continue through 2020
BangkokLeasing activity is limited by tight vacancies, constrained supply supportive of sustained rental growth, new supply in CBD in 2020
Ho Chi Minh CityVacancies expected to go up in the second half, new supply through 2019, relocations are expected to drive market activity and rising availabilities to pressure rents
VIETNAMTenant Favorable
Ho Chi Minh City Hanoi
SOUTH KOREATenant Favorable
Seoul
JAPANNeutral
Tokyo
AUSTRALIATenant Favorable
Brisbane
Landlord Favorable
Melbourne Sydney
SINGAPORENeutral
Singapore
INDONESIATenant Favorable
Jakarta
MALAYSIATenant Favorable
Kuala Lumpur
THAILANDLandlord Favorable
Bangkok
PHILIPPINESNeutral
Manila
INDIATenant Favorable
Ahmedabad Delhi-NCR Kolkata Mumbai
Landlord Favorable
Bengaluru Chennai Hyderabad Pune
GREATER CHINANeutral
Beijing
Tenant Favorable
ChengduChongqingGuangzhouShanghaiShenyangShenzhenTianjinHong Kong - Kowloon
Landlord Favorable
Hong Kong - Central
2017 OCCUPIER CONDITIONS
2 3
ASIA PACIFIC OFFICE OVERVIEW | Q2A CUSHMAN & WAKEFIELD QUARTERLY RESEARCH PUBLICATION

KEY TAKEAWAYSSustaining the momentumEconomic activity in first half of 2017 has been generally healthy across most countries in the region. Asia Pacific was able to sustain the positive momentum witnessed early this year, thanks to robust consumption, resur-gence in external demand and infrastructure spending. India is strong at more than 7% and is rolling out its biggest tax reform to further strengthen its econo-my. Similarly, Japan has posted positive economic growth for the fifth quarter in a row. Growth in Southeast Asia is stable with the Philippines and Vietnam being the star performers. Meanwhile, India’s central bank has cut the policy rate to a more than six-year low.
Steady improvement in leasing activity, rental gains moderated by new supplyAcross the region, leasing activ-ity has been primarily driven by the banking, financial services, and insurance (BFSI) and tech-nology sectors, as economic growth underpins corporate expansions. The banking indus-try’s revival has been particularly evident from large-scale trans-actions in Hong Kong, Singa-pore, and India over the past 12 months. Several global and regional BFSI tenants such as JP Morgan, AIA, ANZ, Wells Fargo, Prudential, DBS and Deutsche Bank have leased spaces mea-suring more than 50,000 square feet (sf) to ramp up business activities across the region.
In India however, there is more focus on ramping up back-end facilities that would support global operations. For exam-ple, clients like JP Morgan have leased more than 300,000 sf in Hyderabad during this period. Despite industry-wide concerns, the technology sector continues to drive the market activity in India. While some large tech-nology clients have focused on consolidations and selective expansions, demand for marquee space in technology parks re-mained strong in cities like Ben-galuru, Hyderabad, Chennai, and Pune, where some tenants are pre-leasing the space as needed.
In Singapore, rental values rose for the first time in two years. Average rents in Tokyo were also higher, but a looming supply influx could provide tenants with more leverage going forward. In Australia, rental growth in Syd-ney slowed after a strong perfor-mance in 2016, and across most emerging markets, new office supply has impacted vacancies. In Manila, sustained demand from the technology industry and healthy take-up from emerg-ing sectors such as online gam-ing and serviced offices have helped to support rentals.
On the supply side, the region is on track to witness its re-cord-high office supply this year with Tier 1 cities in China, India, Manila, and Jakarta leading the new projects.
India’s Goods and Services TaxAfter a 14-year long journey, India has finally rolled out its Goods and Services Tax (GST) starting July. Touted as “one nation, one tax”, it is the biggest tax reform the country has ever implemented. The proposed leg-islation is expected to remove the cascading effect of taxes and push Gross Domestic Prod-uct (GDP) growth above 8%, as projected by the International Monetary Fund (IMF). It is a four-tiered tax structure ranging from 0-28%, with lower rates for es-sential items and the highest for luxury goods. As for real estate, the warehousing and logistics sector could be the biggest ben-eficiary as it would ease the sup-ply of goods and services across the country, making it a unified market and leading to econo-mies of scale and efficiencies in the supply chain. The tax imple-mentation will also spur opera-tional benefits for retail, another big positive for the economy as currently more than two-thirds of the sector is still unorganized. When combined with the recent-ly introduced Real Estate Reg-ulatory Act (RERA), GST could make the residential sector more organized over the next three to four years. Foreign investments in the service sector are ex-pected to grow multi-fold in the longer run despite discrepancies and anomalies in the beginning as it will enforce higher account-ability and transparency. In sum-mary, the new law is a milestone for the country but still a work in progress. The whole process of uniting a complex and fractured tax system and bringing the na-tion on board will continue over the next two to three years. In the longer run, Indian businesses can become more competitive on the global stage which will translate to more opportunities for the nation.
ASIA PACIFIC OVERVIEW STATISTICS
OCCUPANCY COSTSRanking
Q2 2016
Q1 2017
Q2 2017
US$/sf/mo
1 1 1 Hong Kong 11.69
2 2 2 Tokyo 9.07
4 3 3 Delhi - CBD 6.55
3 4 4 Singapore 6.21
5 6 5 Beijing 5.36
6 5 6 Sydney 5.29
7 7 7 Ho Chi Minh City 4.45
9 8 8 Mumbai - SBD 4.30
8 9 9 Shanghai 3.81
10 10 10 Shenzhen 3.67
11 11 11 Mumbai - CBD 3.63
12 12 12 Seoul 3.42
13 13 13 Melbourne 2.98
15 14 14 Hanoi 2.73
14 15 15 Jakarta 2.67
16 16 16 Brisbane 2.62
18 17 17 Bangkok 2.58
17 18 18 Guangzhou 2.35
19 19 19 Taipei 2.32
20 20 20 Gurgaon - CBD 2.15
21 21 21 Canberra 2.05
23 22 22 Manila 1.75
22 23 23 Kuala Lumpur 1.68
24 24 24 Chengdu 1.46
26 26 25 Bengaluru 1.14
25 25 26 Pune 1.13
28 27 27 Chennai 1.01
29 28 28 Hyderabad 0.92
27 29 29 Kolkata 0.88
30 30 30 Ahmedabad 0.67
VACANCY RATESRanking
Q2 2016
Q1 2017
Q2 2017
%
5 3 1 Ho Chi Minh City 2.8%
1 1 2 Manila 2.9%
3 2 3 Tokyo 3.7%
6 4 4 Gurgaon - CBD 3.8%
14 6 5 Hyderabad 5.7%
7 8 6 Hong Kong 5.8%
8 12 7 Sydney 5.8%
9 9 8 Melbourne 6.1%
2 5 9 Singapore 6.1%
4 11 10 Bangkok 6.5%
12 7 11 Bengaluru 6.6%
10 10 12 Beijing 7.2%
20 13 13 Taipei 8.4%
15 15 14 Chennai 8.5%
11 14 15 Mumbai - CBD 8.7%
19 16 16 Pune 9.0%
17 17 17 Canberra 9.4%
21 18 18 Seoul 11.3%
22 19 19 Brisbane 11.7%
13 20 20 Guangzhou 11.9%
16 23 21 Shenzhen 13.1%
25 24 22 Kuala Lumpur 15.0%
23 25 23 Delhi - CBD 15.3%
24 21 24 Hanoi 15.7%
18 22 25 Shanghai 15.9%
27 26 26 Mumbai - SBD 20.3%
26 27 27 Jakarta 23.2%
29 29 28 Chengdu 32.2%
28 28 29 Kolkata 33.4%
30 30 30 Ahmedabad 37.5%
4 5
ASIA PACIFIC OFFICE OVERVIEW | Q2A CUSHMAN & WAKEFIELD QUARTERLY RESEARCH PUBLICATION

Vacancy Rates
C O R E M A R K E T S A V E R A G E
8.3%
E M E R G I N G M A R K E T S A V E R A G E
15.9%
Tokyo
Hong Kong
Sydney
Melbourne
Singapore
Beijing
Taipei
Canberra
Seoul
Brisbane
Shanghai
Ho Chi Minh City
Manila
Hyderabad
Bangkok
Bengaluru
Chennai
Pune
Guangzhou
Shenzhen
Kuala Lumpur
Hanoi
Mumbai
Jakarta
NCR
Chengdu
Kolkata
Ahmedabad
CORE MARKETS
EMERGING MARKETS
0 25 50
Occupancy Costs
C O R E M A R K E T S A V E R A G E
59.80 US$/SF/YEAR
E M E R G I N G M A R K E T S A V E R A G E
23.07 US$/SF/YEAR
Hong Kong
Tokyo
Singapore
Beijing
Sydney
Shanghai
Seoul
Melbourne
Brisbane
Taipei
Canberra
Ho Chi Minh City
Shenzhen
Hanoi
Jakarta
Bangkok
Guangzhou
Mumbai
Manila
Kuala Lumpur
Chengdu
NCR
Bengaluru
Pune
Chennai
Hyderabad
Kolkata
Ahmedabad
CORE MARKETS
0 25 150
EMERGING MARKETS
DECREASING STABLE INCREASINGJakarta
Kolkata
Kuala Lumpur
Shanghai
Singapore
Ahmedabad
Beijing
Delhi-NCR
Mumbai
Pune
Taipei
Tokyo
Bangkok
Bengaluru
Brisbane
Canberra
Chengdu
Chennai
Guangzhou
Hanoi
Ho Chi Minh City
Hong Kong
Hyderabad
Manila
Melbourne
Seoul
Shenzhen
Sydney
*Markets are arranged in alphabetical order
Rental Growth (YOY)
TOP 10 MARKETS BOTTOM 10 MARKETS
Ranking Ranking
Q2 2016
Q1 2017
Q2 2017 sf
Q2 2016
Q1 2017
Q2 2017 sf
2 1 1 Shenzhen 92,255,815 18 18 19 Kolkata 4,089,860
1 2 2 Beijing 74,556,950 25 22 20 Melbourne 3,472,434
3 3 3 Shanghai 71,954,131 21 19 21 Taipei 3,319,614
4 5 4 Manila 35,609,907 16 20 22 Kuala Lumpur 3,305,819
7 4 5 Guangzhou 35,458,515 24 23 23 Hanoi 2,523,061
5 7 6 Ahmedabad 27,198,600 23 24 24 Ho Chi Minh City 1,986,577
8 6 7 Bengaluru 26,881,675 22 25 25 Sydney 1,721,083
11 8 8 Delhi-NCR 25,539,240 27 26 26 Bangkok 909,220
9 9 9 Pune 22,465,000 26 27 27 Brisbane 516,667
13 11 10 Tokyo 17,893,409 28 28 28 Canberra 330,527
Under Construction
QUARTERLY TRAILING 12 MONTHS ENDING
Ranking Ranking
Q2 2016
Q1 2017
Q2 2017 sf
JUN 2015
JUN 2016
JUN 2017 sf
2 1 1 Shanghai 7,138,984 2 1 1 Shanghai 20,819,439
1 4 2 Beijing 2,287,060 1 4 2 Bengaluru 11,507,199
14 6 3 Bengaluru 2,267,034 13 11 3 Shenzhen 10,539,494
5 15 4 Hyderabad 1,460,606 4 2 4 Beijing 9,828,377
15 3 5 Manila 1,292,265 16 6 5 Guangzhou 9,347,746
23 24 6 Singapore 1,219,000 7 8 6 Manila 5,588,596
9 16 7 Guangzhou 1,130,210 5 12 7 Mumbai 3,330,000
22 9 8 Jakarta 1,092,537 15 5 8 Jakarta 2,847,054
16 10 9 NCR 715,000 10 14 9 Hyderabad 2,767,814
8 13 10 Pune 687,500 21 27 10 Singapore 2,671,210
*All figures for Australian markets are half-yearly.
Construction Completions
0 25 50
Manila
Ho Chi Minh City
Hyderabad
Bengaluru
Bangkok
Chennai
Pune
Guangzhou
Hanoi
Shenzhen
Kuala Lumpur
Mumbai
Jakarta
NCR
Kolkata
Chengdu
Ahmedabad
EMERGING MARKETS
Shanghai
Brisbane
Seoul
Canberra
Taipei
Beijing
Singapore
Melbourne
Sydney
Hong Kong
Tokyo
CORE MARKETS
6 7
ASIA PACIFIC OFFICE OVERVIEW | Q2A CUSHMAN & WAKEFIELD QUARTERLY RESEARCH PUBLICATION
Disclaimer:
Cushman & Wakefield (C&W) is known the world-over as an industry knowledge leader. Through the delivery of timely, accurate, high-quality research reports on the leading trends, markets around the world and business issues of the day, we aim to assist our clients in making property decisions that meet their objectives and enhance their competitive position. In addition to producing regular reports such as global rankings and local quarterly updates available on a regular basis, C&W also provides customized studies to meet specific information needs of owners, occupiers and investors.
Cushman & Wakefield is a leading global real estate services firm that helps clients transform the way people work, shop, and live. Our 45,000 employees in more than 70 countries help occupiers and investors optimize the value of their real estate by combining our global perspective and deep local knowledge with an impressive platform of real estate solutions. Cushman & Wakefield is among the largest commercial real estate services firms with revenue of $6 billion across core services of agency leasing, asset services, capital markets, facility services (C&W Services), global occupier services, investment & asset management (DTZ Investors), project & development services, tenant representation, and valuation & advisory. 2017 marks the 100-year anniversary of the Cushman & Wakefield brand. 100 years of taking our clients’ ideas and putting them into action. To learn more, visit www.cushwakecentennial.com, www.cushmanwakefield.com or follow @CushWake on Twitter.
©2017 Cushman & Wakefield, Inc. All rights reserved.
Cushman & Wakefield, Singapore3 Church Street#09-03 Samsung HubSingapore 049483www.cushmanwakefield.com
For more information about C&W Research, contact:
SIGRID ZIALCITA Managing Director, Research, Asia Pacific +(65) 6232 0875 [email protected]
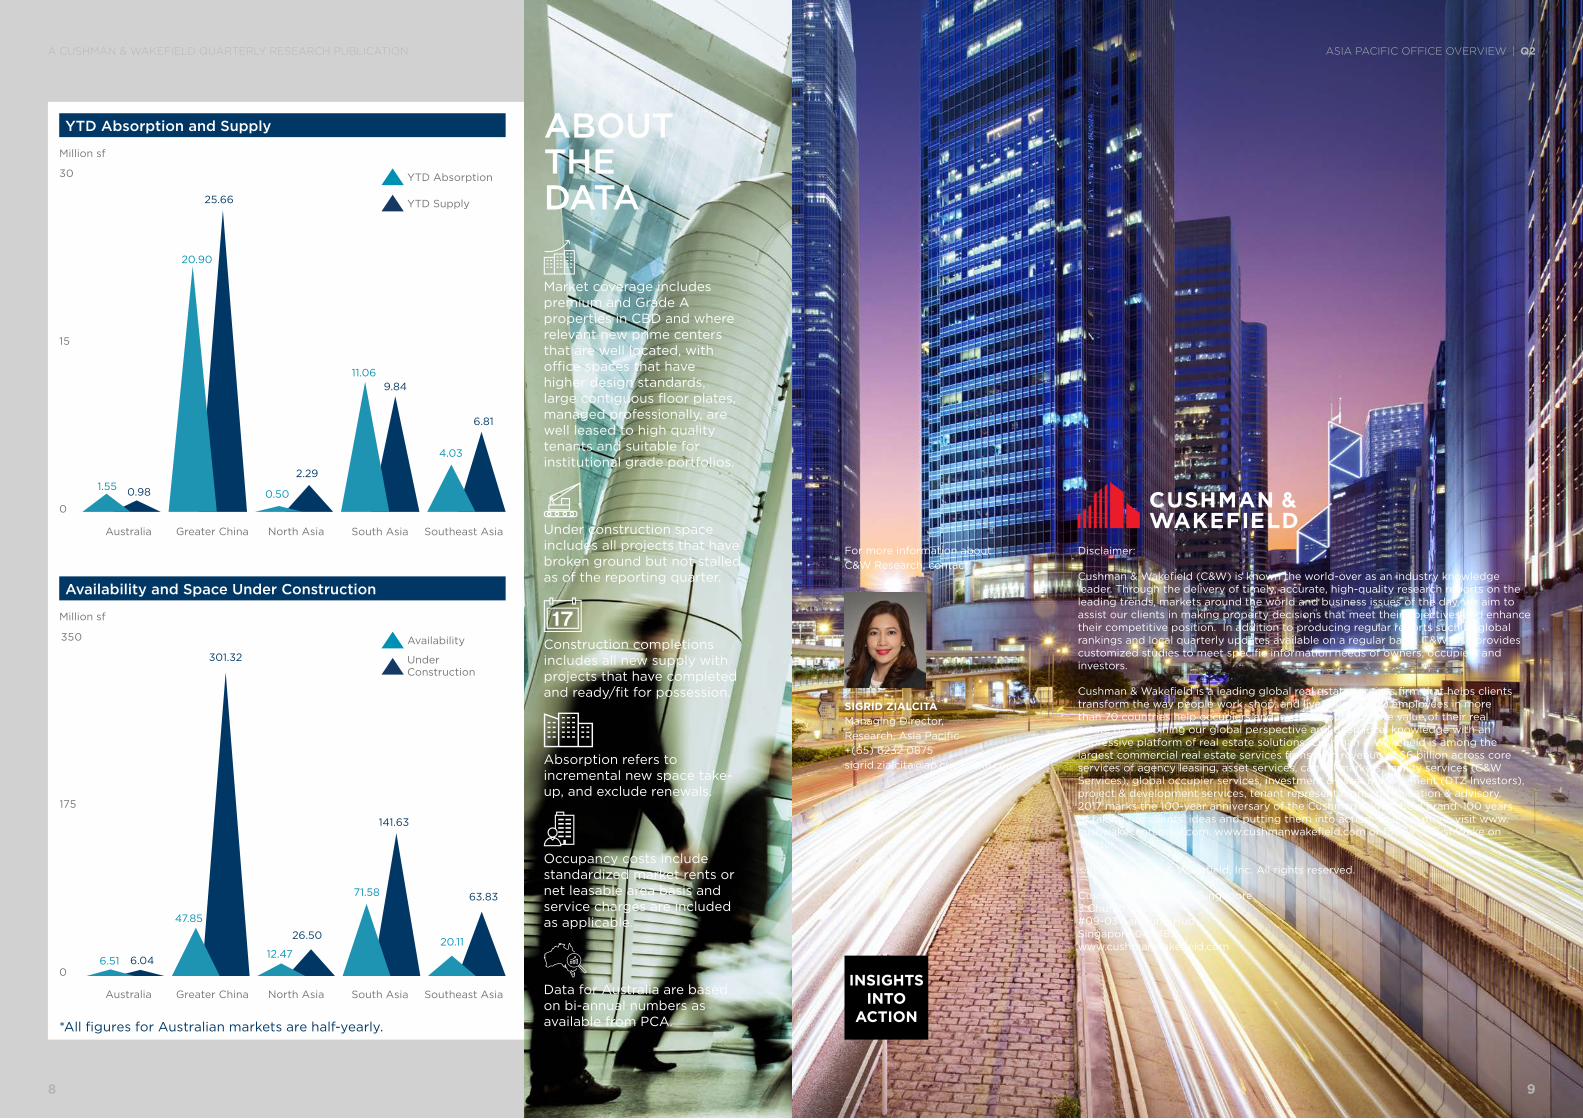
*All figures for Australian markets are half-yearly.
YTD Absorption and Supply
Million sf
YTD Absorption
YTD Supply
Availability
UnderConstruction
0
15
30
Availability and Space Under Construction
Million sf
0
175
350
Australia Greater China South AsiaNorth Asia Southeast Asia
Australia Greater China South AsiaNorth Asia Southeast Asia
1.55 0.98
20.90
25.66
0.50
2.29
11.069.84
4.03
6.81
6.51 6.04
301.32
26.50
141.63
63.83
47.85
12.47
71.58
20.11
Market coverage includes premium and Grade A properties in CBD and where relevant new prime centers that are well located, with office spaces that have higher design standards, large contiguous floor plates, managed professionally, are well leased to high quality tenants and suitable for institutional grade portfolios.
Under construction space includes all projects that have broken ground but not stalled as of the reporting quarter.
Construction completions includes all new supply with projects that have completed and ready/fit for possession.
Absorption refers to incremental new space take-up, and exclude renewals.
Occupancy costs include standardized market rents or net leasable area basis and service charges are included as applicable.
Data for Australia are based on bi-annual numbers as available from PCA.
ABOUT THE DATA
INSIGHTS INTO
ACTION
8 9
ASIA PACIFIC OFFICE OVERVIEW | Q2A CUSHMAN & WAKEFIELD QUARTERLY RESEARCH PUBLICATION

This report has been prepared solely for information purposes. It does not purport to be a complete description of the markets or developments contained in this material. The information on which this report is based has been obtained from sources we believe to be reliable, but we have not independently verified such information and we do not guarantee that the information is accurate or complete. Published by Corporate Communications.
Cushman & Wakefield, Singapore 3 Church Street Samsung Hub #09-03 Singapore 049483 www.cushmanwakefield.com
©2017 Cushman & Wakefield, Inc. All rights reserved.
Q2 ASIA PACIFIC OFFICE OVERVIEW
INSIGHTS INTO
ACTION