Embed Size (px)
Citation preview
1
3DS
.CO
M ©
Das
saul
t Sys
tèm
es
| Q2
2013
Ear
ning
s P
rese
ntat
ion
3D
S.C
OM
© D
assa
ult S
ystè
mes
| Q
2 20
13 E
arni
ngs
Pre
sent
atio
n
Analysts Meeting Q2 & H1 2013
Bernard Charlès, President and CEO
Thibault de Tersant, Senior EVP, CFO
2
3DS
.CO
M ©
Das
saul
t Sys
tèm
es
| Q2
2013
Ear
ning
s P
rese
ntat
ion
Statements herein that are not historical facts but express expectations or objectives for the future, including but not limited to statements
regarding the Company’s non-IFRS financial performance objectives, are forward-looking statements.
Such forward-looking statements are based on Dassault Systèmes management's current views and assumptions and involve known and
unknown risks and uncertainties. Actual results or performances may differ materially from those in such statements due to a range of
factors. If global economic and business conditions continue to be volatile or deteriorate, the Company’s business results may not develop
as currently anticipated and may decline below their earlier levels for an extended period of time. Furthermore, due to factors affecting
sales of the Company’s products and services, there may be a substantial time lag between any change in global economic and business
conditions and its impact on the Company’s business results.
In preparing such forward-looking statements, the Company has in particular assumed an average US dollar to euro exchange rate of
US$1.35 per €1.00 and US$1.33 per €1.00 as well as an average Japanese yen to euro exchange rate of JPY130 to €1.00 and JPY128 to
€1.00 for the 2013 third quarter and full year, respectively; however, currency values fluctuate, and the Company’s results of operations
may be significantly affected by changes in exchange rates. The Company’s actual results or performance may also be materially
negatively affected by numerous risks and uncertainties as described in the “Risk Factors” section of 2012 Document de Référence, filed
with the AMF on April 3, 2013, and also available on the Company’s website www.3ds.com.
Forward Looking Information
3
3DS
.CO
M ©
Das
saul
t Sys
tèm
es
| Q2
2013
Ear
ning
s P
rese
ntat
ion
Readers are cautioned that the supplemental non-IFRS information presented in this press release is subject to inherent limitations. It is not based on any comprehensive set of accounting rules or principles and should not be considered as a substitute for IFRS measurements. Also, the Company’s supplemental non-IFRS financial information may not be comparable to similarly titled non-IFRS measures used by other companies. Further specific limitations for individual non-IFRS measures, and the reasons for presenting non-IFRS financial information, are set forth in the Company’s annual report for the year ended December 31, 2012 included in the Company’s 2012 Document de Référence filed with the AMF on April 3, 2013.
In the tables accompanying this press release the Company sets forth its supplemental non-IFRS figures for revenue, operating income, operating margin, net income and diluted earnings per share, which exclude the effect of adjusting the carrying value of acquired companies’ deferred revenue, stock-based compensation expense, the expenses for the amortization of acquired intangible assets, other income and expense, net, certain one-time items included in financial revenue and other, net, and the income tax effect of the non-IFRS adjustments. The tables also set forth the most comparable IFRS financial measure and reconciliations of this information with non-IFRS information.
When the Company believes it would be helpful for understanding trends in its business, the Company provides percentage increases or decreases in its revenue (in both IFRS as well as non-IFRS) to eliminate the effect of changes in currency values, particularly the U.S. dollar and the Japanese yen, relative to the euro. When trend information is expressed herein "in constant currencies", the results of the "prior" period have first been recalculated using the average exchange rates of the comparable period in the current year, and then compared with the results of the comparable period in the current year.
Forward Looking Information
4
3DS
.CO
M ©
Das
saul
t Sys
tèm
es
| Q2
2013
Ear
ning
s P
rese
ntat
ion
New licenses revenue returning to growth in Q2
Further strengthening positions in Asia
Confirming strong dynamic of DELMIA and entering into Manufacturing Operations
Management with Apriso acquisition
Deploying V6 and introducing groundbreaking V6 R2014 release for 3DEXPERIENCE
Upgrading FY13 objectives
Q2 2013 Highlights
5
3DS
.CO
M ©
Das
saul
t Sys
tèm
es
| Q2
2013
Ear
ning
s P
rese
ntat
ion
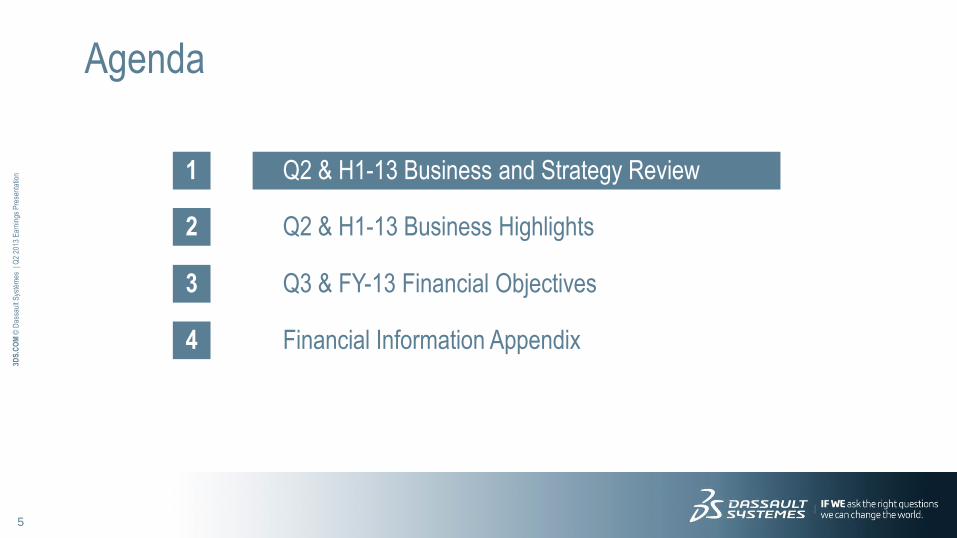
1 Q2 & H1-13 Business and Strategy Review
2 Q2 & H1-13 Business Highlights
3 Q3 & FY-13 Financial Objectives
4 Financial Information Appendix
Agenda
6
3DS
.CO
M ©
Das
saul
t Sys
tèm
es
| Q2
2013
Ear
ning
s P
rese
ntat
ion
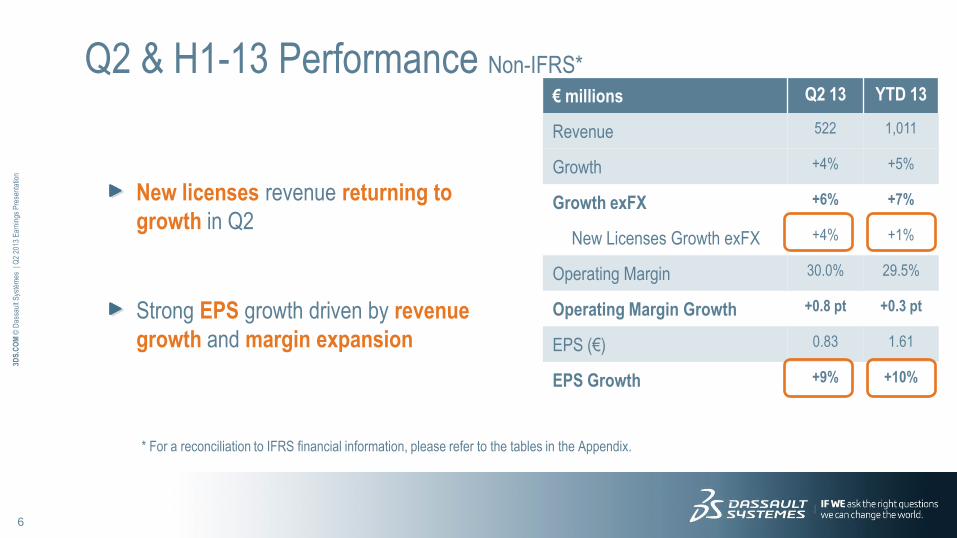
Q2 & H1-13 Performance Non-IFRS*
* For a reconciliation to IFRS financial information, please refer to the tables in the Appendix.
New licenses revenue returning to
growth in Q2
Strong EPS growth driven by revenue
growth and margin expansion
€ millions Q2 13 YTD 13
Revenue 522 1,011
Growth +4% +5%
Growth exFX +6% +7%
New Licenses Growth exFX +4% +1%
Operating Margin 30.0% 29.5%
Operating Margin Growth +0.8 pt +0.3 pt
EPS (€) 0.83 1.61
EPS Growth +9% +10%
7
3DS
.CO
M ©
Das
saul
t Sys
tèm
es
| Q2
2013
Ear
ning
s P
rese
ntat
ion
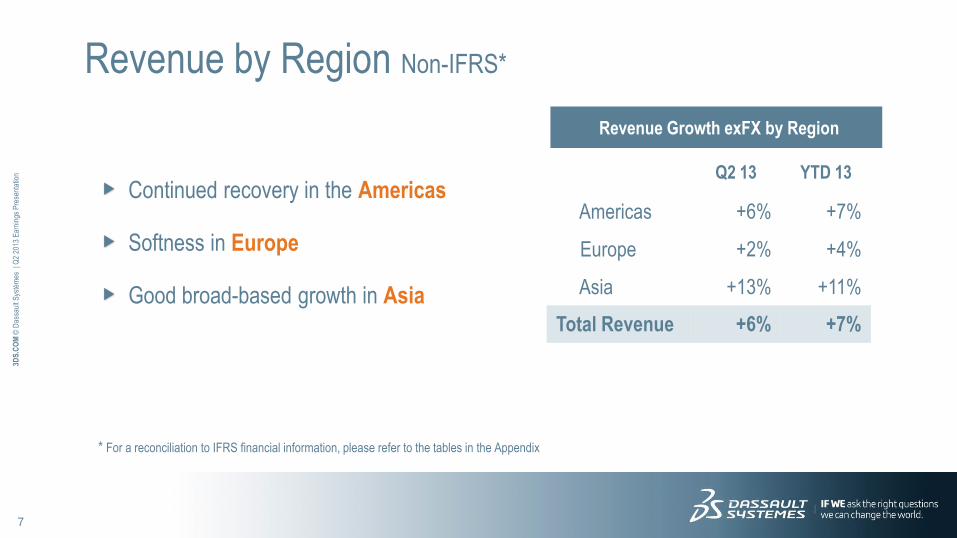
Revenue by Region Non-IFRS*
Q2 13 YTD 13
Americas +6% +7%
Europe +2% +4%
Asia +13% +11%
Total Revenue +6% +7%
Revenue Growth exFX by Region
* For a reconciliation to IFRS financial information, please refer to the tables in the Appendix
Continued recovery in the Americas
Softness in Europe
Good broad-based growth in Asia
8
3DS
.CO
M ©
Das
saul
t Sys
tèm
es
| Q2
2013
Ear
ning
s P
rese
ntat
ion
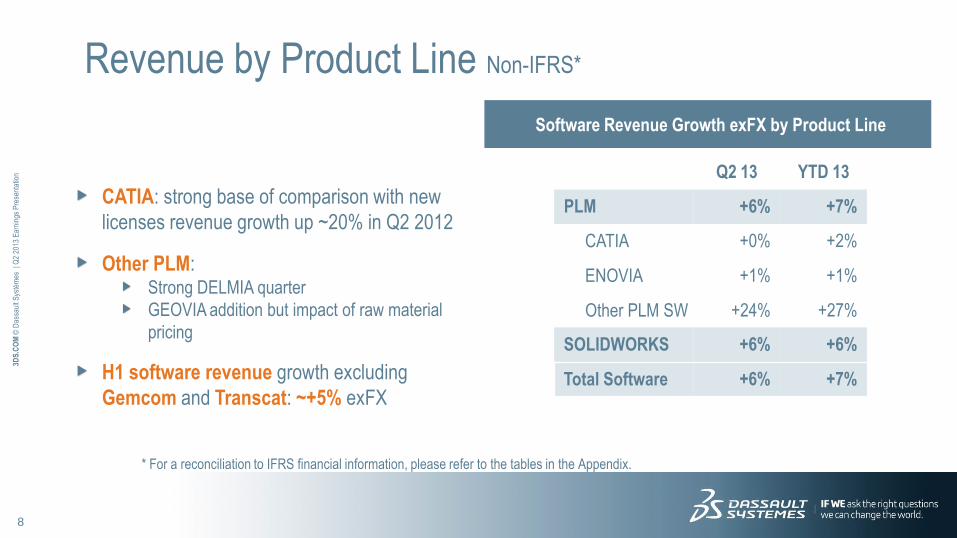
Revenue by Product Line Non-IFRS*
Q2 13 YTD 13
PLM +6% +7%
CATIA +0% +2%
ENOVIA +1% +1%
Other PLM SW +24% +27%
SOLIDWORKS +6% +6%
Total Software +6% +7%
Software Revenue Growth exFX by Product Line
* For a reconciliation to IFRS financial information, please refer to the tables in the Appendix.
CATIA: strong base of comparison with new
licenses revenue growth up ~20% in Q2 2012
Other PLM: Strong DELMIA quarter
GEOVIA addition but impact of raw material
pricing
H1 software revenue growth excluding
Gemcom and Transcat: ~+5% exFX

9
3DS
.CO
M ©
Das
saul
t Sys
tèm
es
| Q2
2013
Ear
ning
s P
rese
ntat
ion
1. Asia
2. DELMIA
3. Apriso Closing
4. SFE Acquisition
5. V6 Deployments
6. V6 R2014
Business and Strategy Review
10
3DS
.CO
M ©
Das
saul
t Sys
tèm
es
| Q2
2013
Ear
ning
s P
rese
ntat
ion
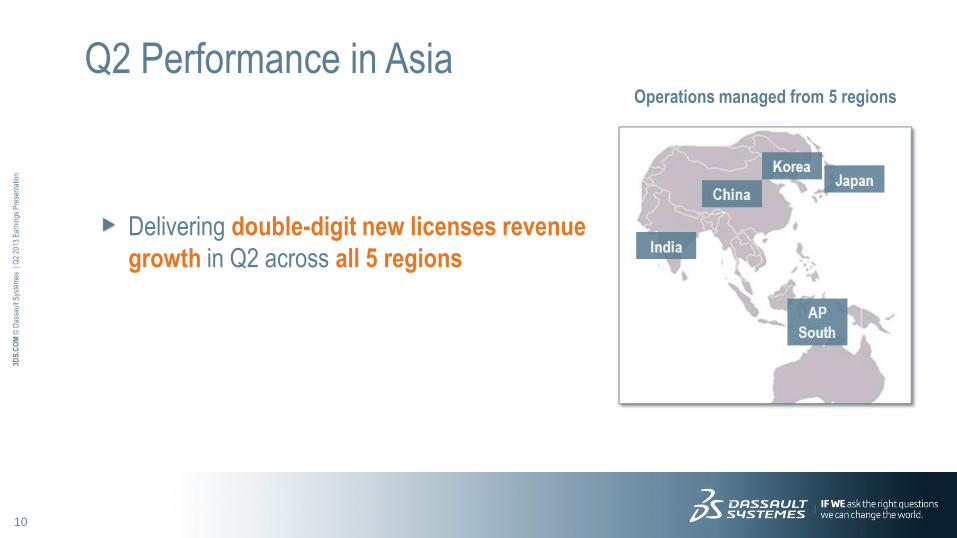
Delivering double-digit new licenses revenue
growth in Q2 across all 5 regions
Q2 Performance in Asia
Operations managed from 5 regions
11
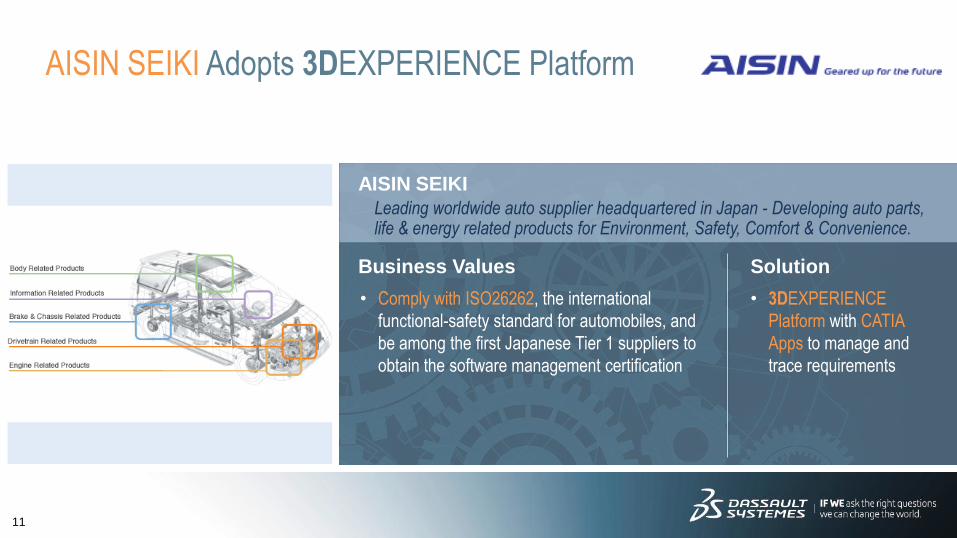
AISIN SEIKI
Business Values Solution
AISIN SEIKI Adopts 3DEXPERIENCE Platform
• Comply with ISO26262, the international
functional-safety standard for automobiles, and
be among the first Japanese Tier 1 suppliers to
obtain the software management certification
Leading worldwide auto supplier headquartered in Japan - Developing auto parts, life & energy related products for Environment, Safety, Comfort & Convenience.
• 3DEXPERIENCE
Platform with CATIA
Apps to manage and
trace requirements
12
3DS
.CO
M ©
Das
saul
t Sys
tèm
es
| Q2
2013
Ear
ning
s P
rese
ntat
ion
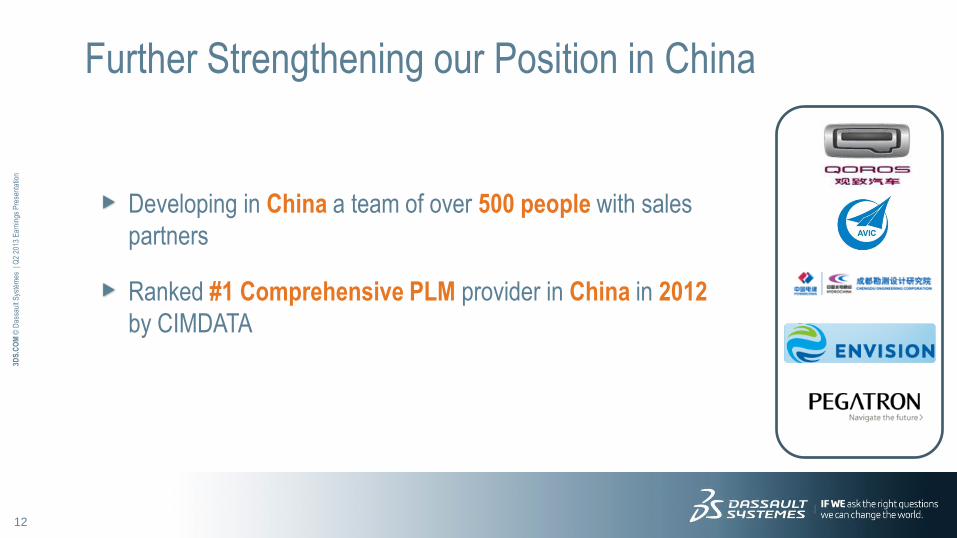
Developing in China a team of over 500 people with sales
partners
Ranked #1 Comprehensive PLM provider in China in 2012
by CIMDATA
Further Strengthening our Position in China
13
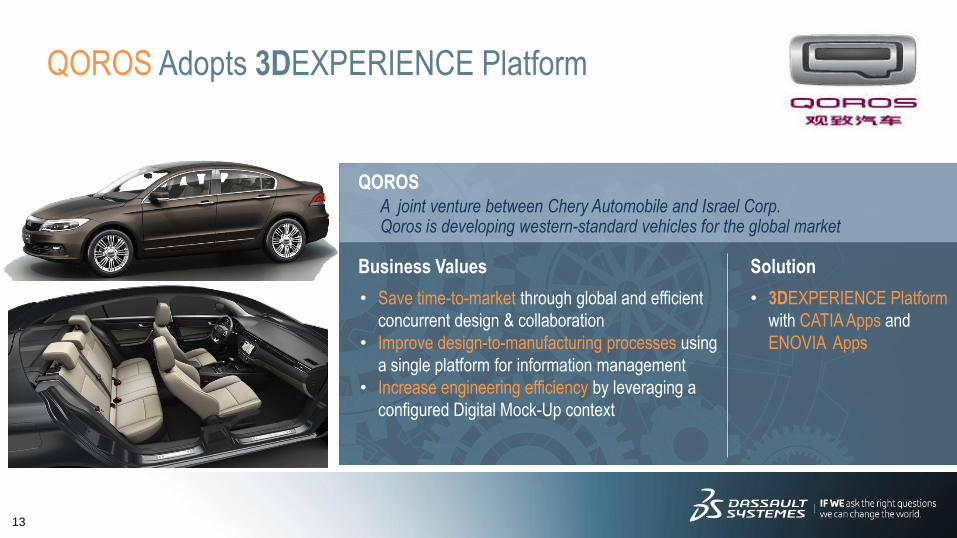
QOROS
Business Values Solution
QOROS Adopts 3DEXPERIENCE Platform
• Save time-to-market through global and efficient
concurrent design & collaboration
• Improve design-to-manufacturing processes using
a single platform for information management
• Increase engineering efficiency by leveraging a
configured Digital Mock-Up context
A joint venture between Chery Automobile and Israel Corp. Qoros is developing western-standard vehicles for the global market
• 3DEXPERIENCE Platform
with CATIA Apps and
ENOVIA Apps

14
3DS
.CO
M ©
Das
saul
t Sys
tèm
es
| Q2
2013
Ear
ning
s P
rese
ntat
ion
1. Asia
2. DELMIA
3. Apriso Closing
4. SFE Acquisition
5. V6 Deployments
6. V6 R2014
Business and Strategy Review
15
3DS
.CO
M ©
Das
saul
t Sys
tèm
es
| Q2
2013
Ear
ning
s P
rese
ntat
ion
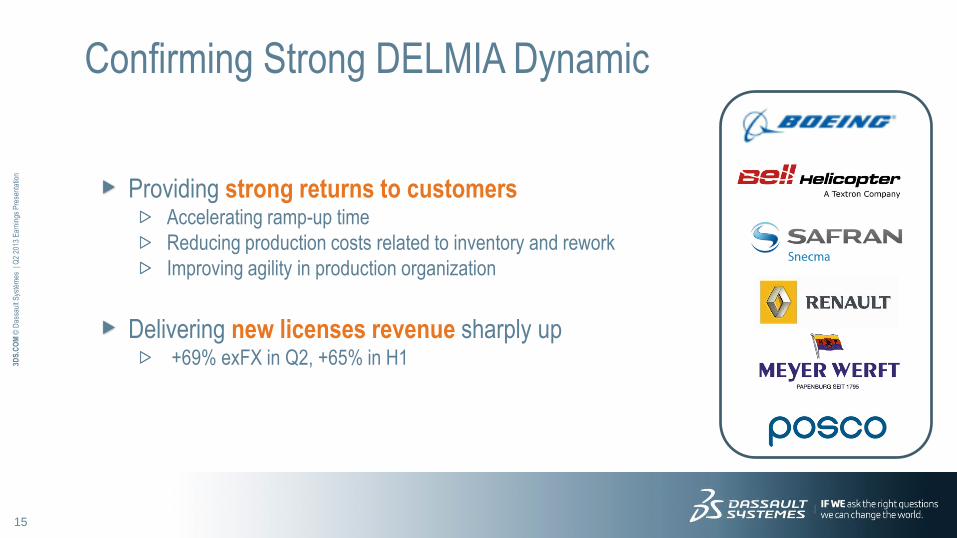
Providing strong returns to customers Accelerating ramp-up time
Reducing production costs related to inventory and rework
Improving agility in production organization
Delivering new licenses revenue sharply up +69% exFX in Q2, +65% in H1
Confirming Strong DELMIA Dynamic
16
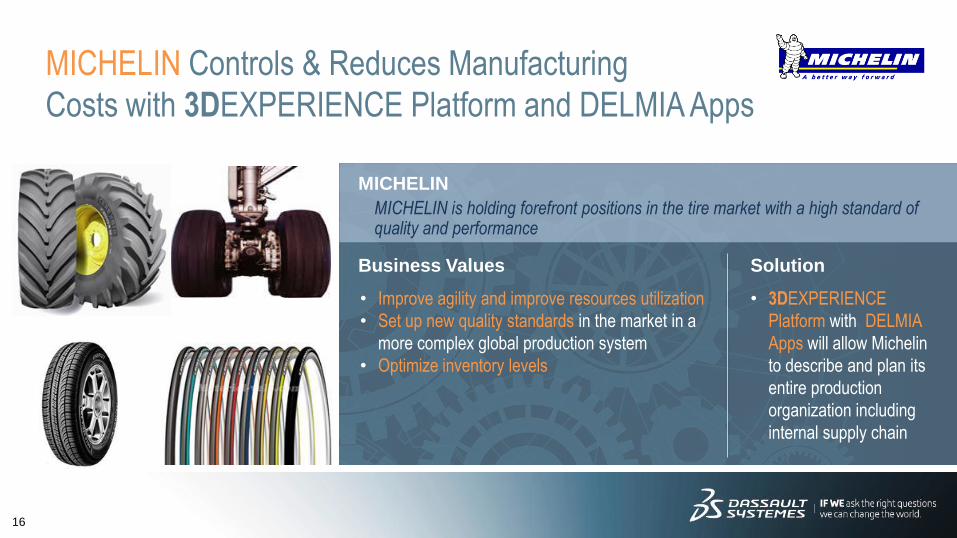
MICHELIN
Business Values Solution
MICHELIN Controls & Reduces Manufacturing
Costs with 3DEXPERIENCE Platform and DELMIA Apps
• Improve agility and improve resources utilization
• Set up new quality standards in the market in a
more complex global production system
• Optimize inventory levels
MICHELIN is holding forefront positions in the tire market with a high standard of quality and performance
• 3DEXPERIENCE
Platform with DELMIA
Apps will allow Michelin
to describe and plan its
entire production
organization including
internal supply chain
17
3DS
.CO
M ©
Das
saul
t Sys
tèm
es
| Q2
2013
Ear
ning
s P
rese
ntat
ion
1. Asia
2. DELMIA
3. Apriso Closing
4. SFE Acquisition
5. V6 Deployments
6. V6 R2014
Business and Strategy Review
18
3DS
.CO
M ©
Das
saul
t Sys
tèm
es
| Q2
2013
Ear
ning
s P
rese
ntat
ion
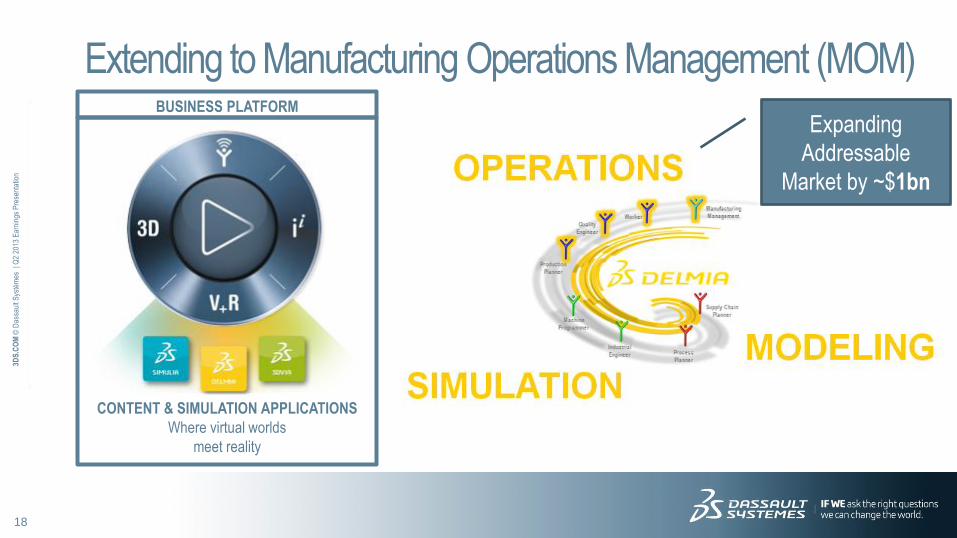
Extending to Manufacturing Operations Management (MOM)
CONTENT & SIMULATION APPLICATIONS
Where virtual worlds
meet reality
BUSINESS PLATFORM
Expanding
Addressable
Market by ~$1bn
19
3DS
.CO
M ©
Das
saul
t Sys
tèm
es
| Q2
2013
Ear
ning
s P
rese
ntat
ion
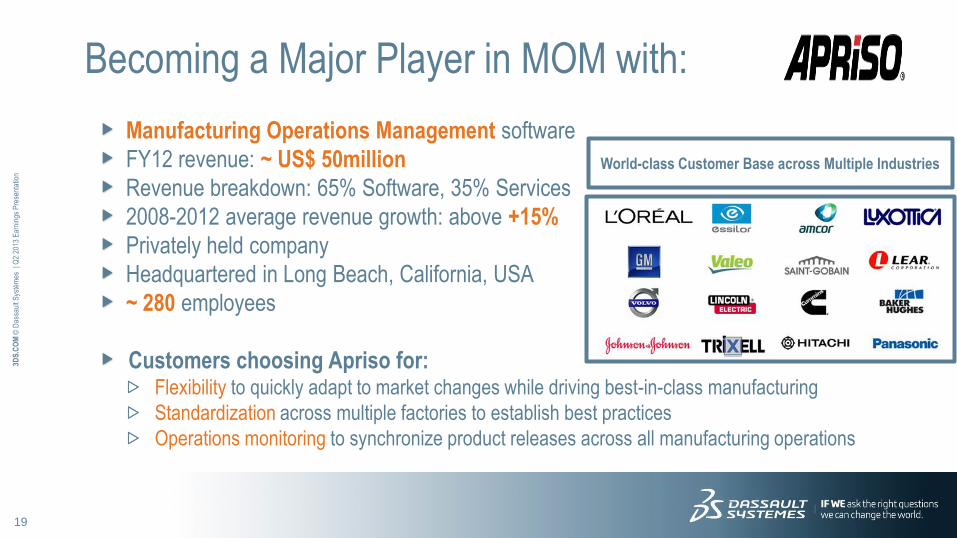
Becoming a Major Player in MOM with:
Manufacturing Operations Management software
FY12 revenue: ~ US$ 50million
Revenue breakdown: 65% Software, 35% Services
2008-2012 average revenue growth: above +15%
Privately held company
Headquartered in Long Beach, California, USA
~ 280 employees
Customers choosing Apriso for: Flexibility to quickly adapt to market changes while driving best-in-class manufacturing
Standardization across multiple factories to establish best practices
Operations monitoring to synchronize product releases across all manufacturing operations
World-class Customer Base across Multiple Industries
20
3DS
.CO
M ©
Das
saul
t Sys
tèm
es
| Q2
2013
Ear
ning
s P
rese
ntat
ion
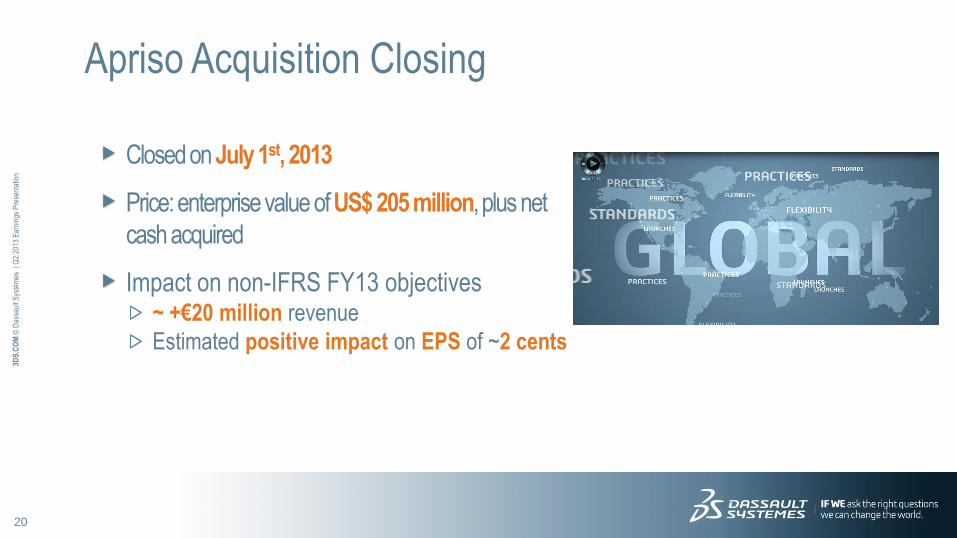
Closed on July 1st, 2013
Price: enterprise value of US$ 205 million, plus net
cash acquired
Impact on non-IFRS FY13 objectives ~ +€20 million revenue
Estimated positive impact on EPS of ~2 cents
Apriso Acquisition Closing
21
3DS
.CO
M ©
Das
saul
t Sys
tèm
es
| Q2
2013
Ear
ning
s P
rese
ntat
ion
1. Asia
2. DELMIA
3. Apriso Closing
4. SFE Acquisition
5. V6 Deployments
6. V6 R2014
Business and Strategy Review
22
3DS
.CO
M ©
Das
saul
t Sys
tèm
es
| Q2
2013
Ear
ning
s P
rese
ntat
ion
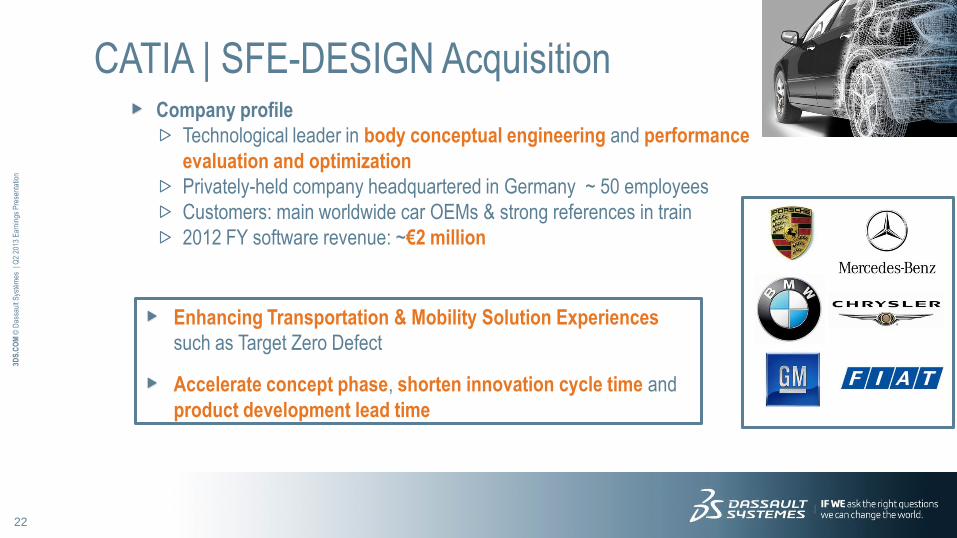
Company profile
Technological leader in body conceptual engineering and performance
evaluation and optimization
Privately-held company headquartered in Germany ~ 50 employees
Customers: main worldwide car OEMs & strong references in train
2012 FY software revenue: ~€2 million
CATIA | SFE-DESIGN Acquisition
Enhancing Transportation & Mobility Solution Experiences
such as Target Zero Defect
Accelerate concept phase, shorten innovation cycle time and
product development lead time

23
3DS
.CO
M ©
Das
saul
t Sys
tèm
es
| Q2
2013
Ear
ning
s P
rese
ntat
ion
1. Asia
2. DELMIA
3. Apriso Closing
4. SFE Acquisition
5. V6 Deployments
6. V6 R2014
Business and Strategy Review
24
3DS
.CO
M ©
Das
saul
t Sys
tèm
es
| Q2
2013
Ear
ning
s P
rese
ntat
ion
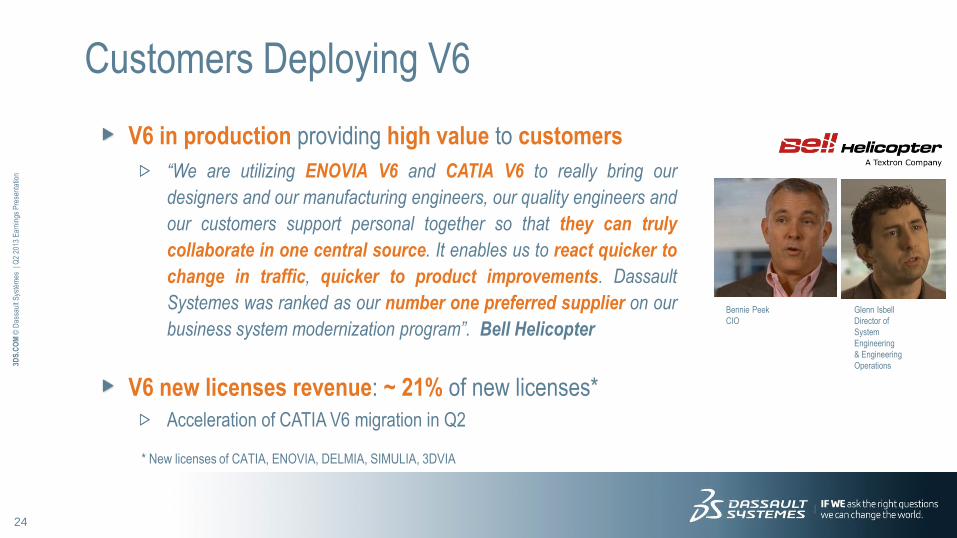
V6 in production providing high value to customers
“We are utilizing ENOVIA V6 and CATIA V6 to really bring our
designers and our manufacturing engineers, our quality engineers and
our customers support personal together so that they can truly
collaborate in one central source. It enables us to react quicker to
change in traffic, quicker to product improvements. Dassault
Systemes was ranked as our number one preferred supplier on our
business system modernization program”. Bell Helicopter
V6 new licenses revenue: ~ 21% of new licenses*
Acceleration of CATIA V6 migration in Q2
Customers Deploying V6
Glenn Isbell
Director of
System
Engineering
& Engineering
Operations
Bennie Peek
CIO
* New licenses of CATIA, ENOVIA, DELMIA, SIMULIA, 3DVIA
25
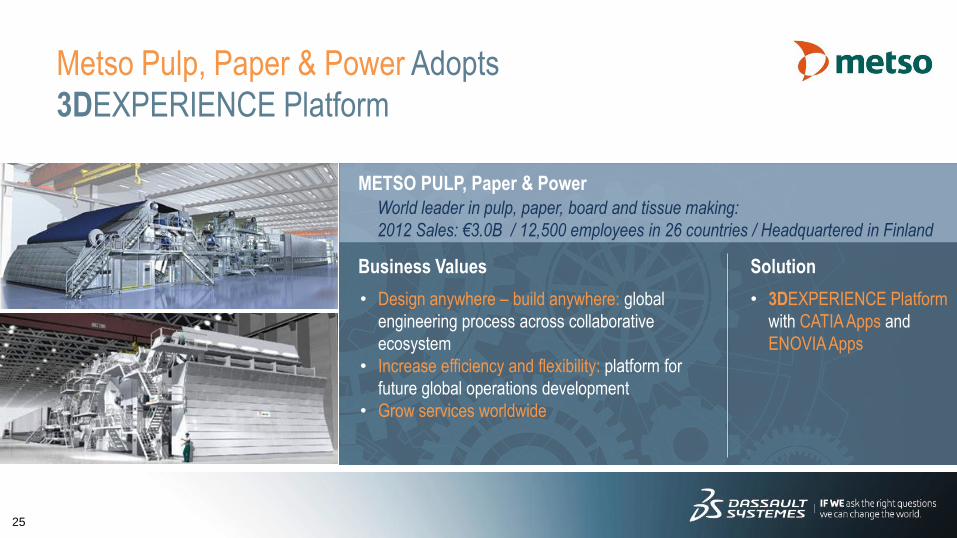
METSO PULP, Paper & Power
Business Values Solution
Metso Pulp, Paper & Power Adopts
3DEXPERIENCE Platform
• Design anywhere – build anywhere: global
engineering process across collaborative
ecosystem
• Increase efficiency and flexibility: platform for
future global operations development
• Grow services worldwide
World leader in pulp, paper, board and tissue making:
2012 Sales: €3.0B / 12,500 employees in 26 countries / Headquartered in Finland
• 3DEXPERIENCE Platform
with CATIA Apps and
ENOVIA Apps
26
SMITH & NEPHEW
Business Values Solution
Licensed to Cure for Medical Device
• Common regulatory submission system for the
planning, tracking, authoring, review, approval,
assembly, export, and long-term management of
the product registrations
• Harmonization of regulatory processes across
business units
A global medical technology business with leadership positions in Orthopaedic Reconstruction, Advanced Wound Management, Sports Medicine and Trauma
• 3DEXPERIENCE
Platform based solution:
Licensed to Cure for
Medical Device

27
Zhengzhou Yutong
Business Values Solution
Partner
Zhengzhou Yutong Adopts 3DEXPERIENCE Platform
• Reducing product development cycle
• Improving business management processes
• Rationalizing use of existing enterprise resources
Leading Chinese Bus Manufacturer
• 3DEXPERIENCE Platform
with ENOVIA Apps

28
3DS
.CO
M ©
Das
saul
t Sys
tèm
es
| Q2
2013
Ear
ning
s P
rese
ntat
ion
1. Asia
2. DELMIA
3. Apriso Closing
4. SFE Acquisition
5. V6 Deployments
6. V6 R2014
Business and Strategy Review
29
3DS
.CO
M ©
Das
saul
t Sys
tèm
es
| Q2
2013
Ear
ning
s P
rese
ntat
ion
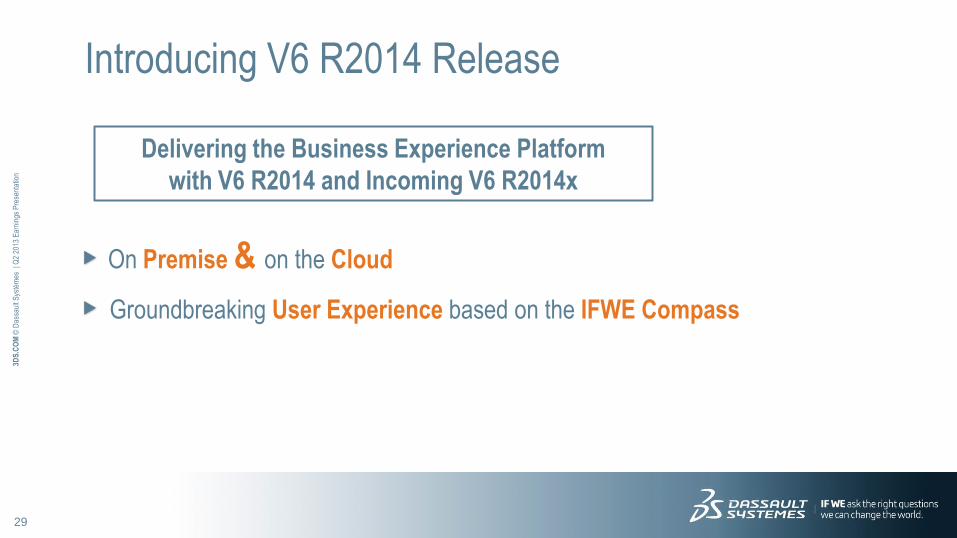
On Premise & on the Cloud
Groundbreaking User Experience based on the IFWE Compass
Introducing V6 R2014 Release
Delivering the Business Experience Platform
with V6 R2014 and Incoming V6 R2014x
30
3DS
.CO
M ©
Das
saul
t Sys
tèm
es
| Q2
2013
Ear
ning
s P
rese
ntat
ion
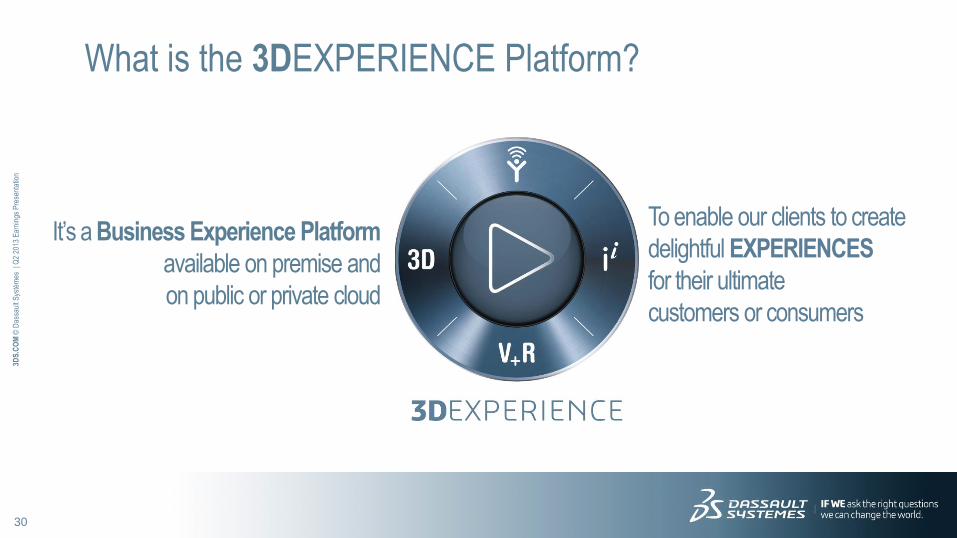
What is the 3DEXPERIENCE Platform?
To enable our clients to create
delightful EXPERIENCES
for their ultimate
customers or consumers
It’s a Business Experience Platform
available on premise and
on public or private cloud
31
3DS
.CO
M ©
Das
saul
t Sys
tèm
es
| Q2
2013
Ear
ning
s P
rese
ntat
ion
Why a Business Experience Platform?
INNOVATION via break-through technology
is NOT a SUSTAINABLE ECONOMIC MODEL
HOLISTIC VALUE drives business
Products are NO LONGER ENOUGH
We are in the EXPERIENCE ECONOMY
Commodities
Product
Services
Experience
32
3DS
.CO
M ©
Das
saul
t Sys
tèm
es
| Q2
2013
Ear
ning
s P
rese
ntat
ion
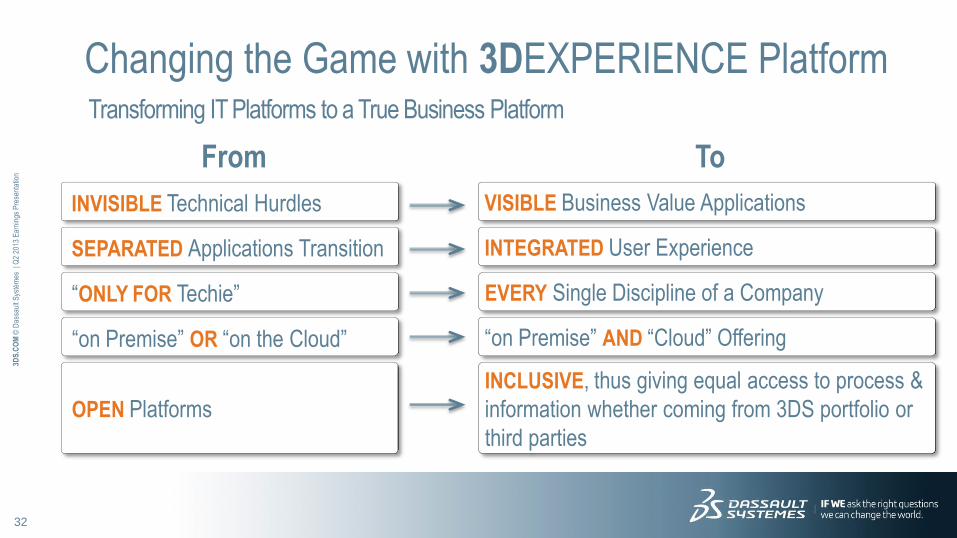
INVISIBLE Technical Hurdles
“ONLY FOR Techie”
“on Premise” OR “on the Cloud”
OPEN Platforms
SEPARATED Applications Transition
Changing the Game with 3DEXPERIENCE Platform Transforming IT Platforms to a True Business Platform
VISIBLE Business Value Applications
EVERY Single Discipline of a Company
“on Premise” AND “Cloud” Offering
INCLUSIVE, thus giving equal access to process &
information whether coming from 3DS portfolio or
third parties
INTEGRATED User Experience
From To
33
3DS
.CO
M ©
Das
saul
t Sys
tèm
es
| Q2
2013
Ear
ning
s P
rese
ntat
ion
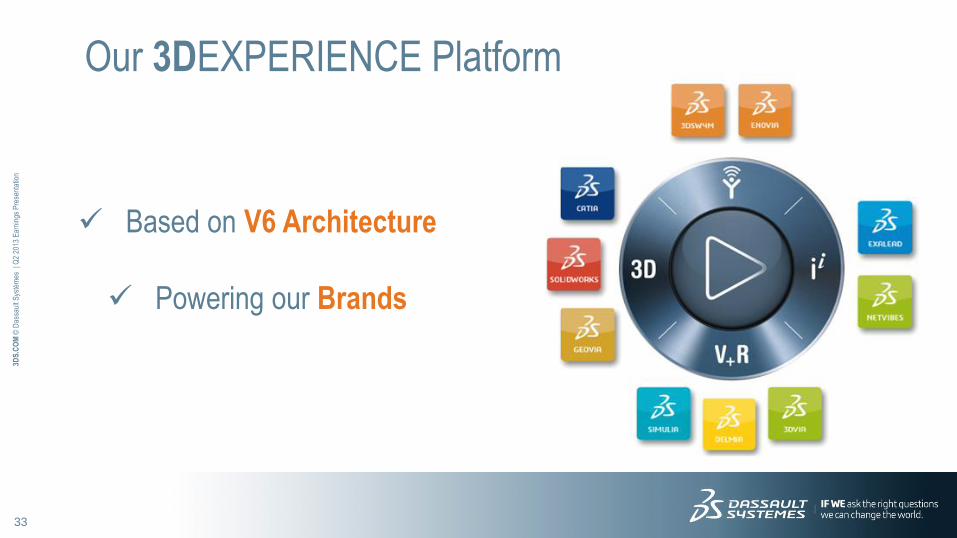
Our 3DEXPERIENCE Platform
Based on V6 Architecture
Powering our Brands

34
3DS
.CO
M ©
Das
saul
t Sys
tèm
es
| Q2
2013
Ear
ning
s P
rese
ntat
ion
Let’s navigate the platform together!
35
3DS
.CO
M ©
Das
saul
t Sys
tèm
es
| Q2
2013
Ear
ning
s P
rese
ntat
ion
1 Q2 & H1-13 Business and Strategy Review
2 Q2 & H1-13 Business Highlights
3 Q3 & FY-13 Financial Objectives
4 Financial Information Appendix
Agenda
36
3DS
.CO
M ©
Das
saul
t Sys
tèm
es
| Q2
2013
Ear
ning
s P
rese
ntat
ion
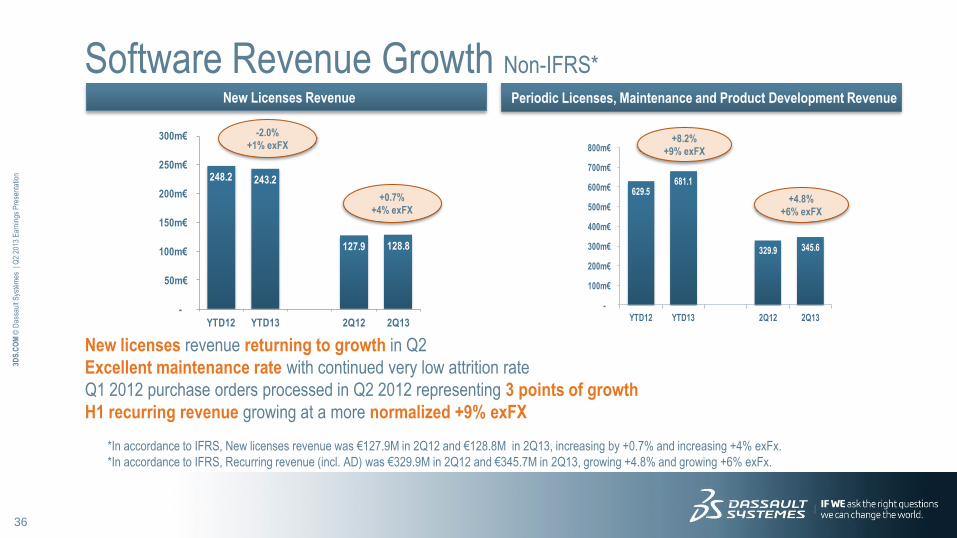
Software Revenue Growth Non-IFRS*
New Licenses Revenue Periodic Licenses, Maintenance and Product Development Revenue
New licenses revenue returning to growth in Q2
Excellent maintenance rate with continued very low attrition rate
Q1 2012 purchase orders processed in Q2 2012 representing 3 points of growth
H1 recurring revenue growing at a more normalized +9% exFX
248.2 243.2
127.9 128.8
-
50m€
100m€
150m€
200m€
250m€
300m€
YTD12 YTD13 2Q12 2Q13
+0.7%
+4% exFX
-2.0%
+1% exFX
629.5681.1
329.9 345.6
-
100m€
200m€
300m€
400m€
500m€
600m€
700m€
800m€
YTD12 YTD13 2Q12 2Q13
+4.8%
+6% exFX
+8.2%
+9% exFX
*In accordance to IFRS, New licenses revenue was €127.9M in 2Q12 and €128.8M in 2Q13, increasing by +0.7% and increasing +4% exFx.
*In accordance to IFRS, Recurring revenue (incl. AD) was €329.9M in 2Q12 and €345.7M in 2Q13, growing +4.8% and growing +6% exFx.
37
3DS
.CO
M ©
Das
saul
t Sys
tèm
es
| Q2
2013
Ear
ning
s P
rese
ntat
ion
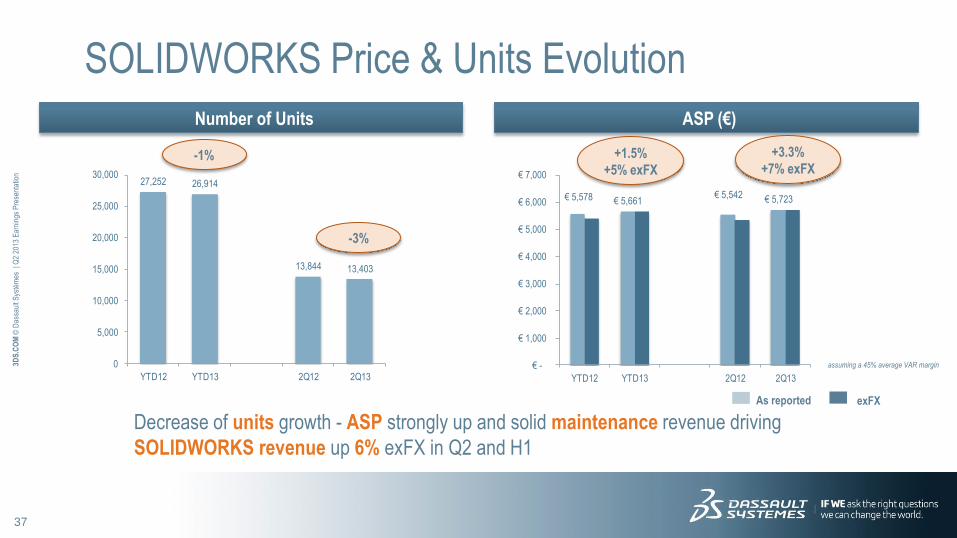
€ 5,578 € 5,661 € 5,542 € 5,723
€ -
€ 1,000
€ 2,000
€ 3,000
€ 4,000
€ 5,000
€ 6,000
€ 7,000
YTD12 YTD13 2Q12 2Q13
Decrease of units growth - ASP strongly up and solid maintenance revenue driving
SOLIDWORKS revenue up 6% exFX in Q2 and H1
SOLIDWORKS Price & Units Evolution
Number of Units ASP (€)
As reported exFX
27,252 26,914
13,844 13,403
0
5,000
10,000
15,000
20,000
25,000
30,000
YTD12 YTD13 2Q12 2Q13
+3.3%
+7% exFX
-3%
-1% +1.5%
+5% exFX
assuming a 45% average VAR margin
38
3DS
.CO
M ©
Das
saul
t Sys
tèm
es
| Q2
2013
Ear
ning
s P
rese
ntat
ion
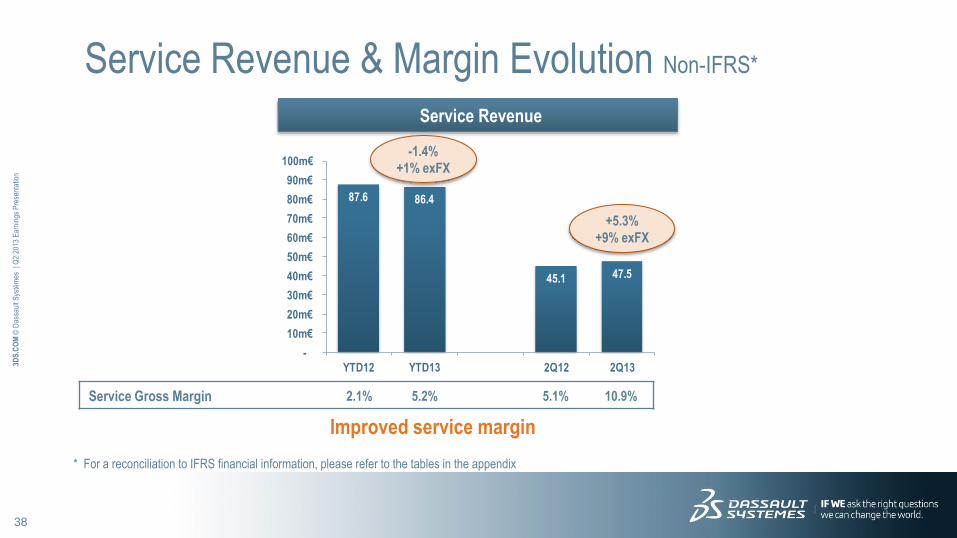
Service Revenue & Margin Evolution Non-IFRS*
Service Revenue
* For a reconciliation to IFRS financial information, please refer to the tables in the appendix
Service Gross Margin 2.1% 5.2% 5.1% 10.9%
Improved service margin
87.6 86.4
45.1 47.5
-
10m€
20m€
30m€
40m€
50m€
60m€
70m€
80m€
90m€
100m€
YTD12 YTD13 2Q12 2Q13
-1.4%
+1% exFX
+5.3%
+9% exFX
39
3DS
.CO
M ©
Das
saul
t Sys
tèm
es
| Q2
2013
Ear
ning
s P
rese
ntat
ion
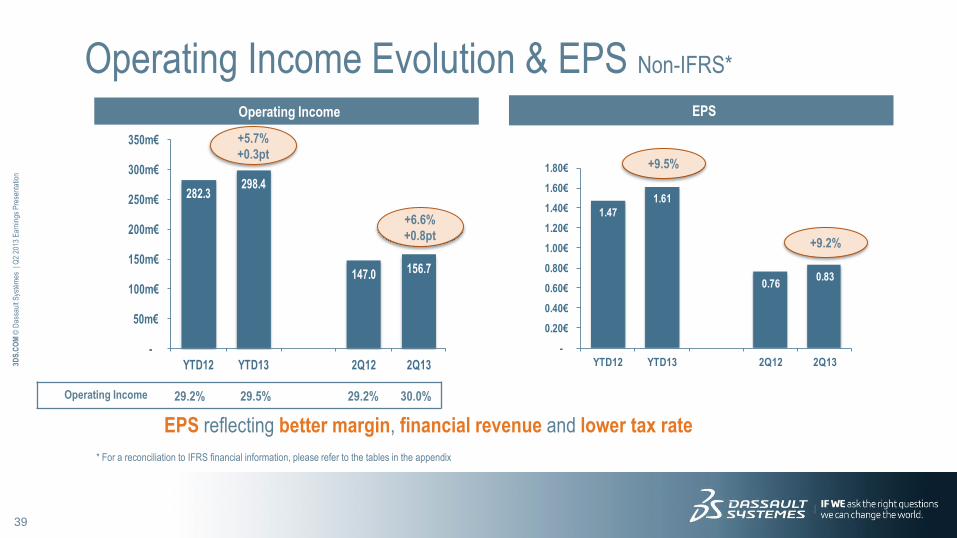
Operating Income Evolution & EPS Non-IFRS*
Operating Income EPS
EPS reflecting better margin, financial revenue and lower tax rate
* For a reconciliation to IFRS financial information, please refer to the tables in the appendix
282.3298.4
147.0 156.7
-
50m€
100m€
150m€
200m€
250m€
300m€
350m€
YTD12 YTD13 2Q12 2Q13
+6.6%
+0.8pt
+5.7%
+0.3pt
1.47
1.61
0.760.83
-
0.20€
0.40€
0.60€
0.80€
1.00€
1.20€
1.40€
1.60€
1.80€
YTD12 YTD13 2Q12 2Q13
+9.2%
+9.5%
Operating Income 29.2% 29.5% 29.2% 30.0%
40
3DS
.CO
M ©
Das
saul
t Sys
tèm
es
| Q2
2013
Ear
ning
s P
rese
ntat
ion
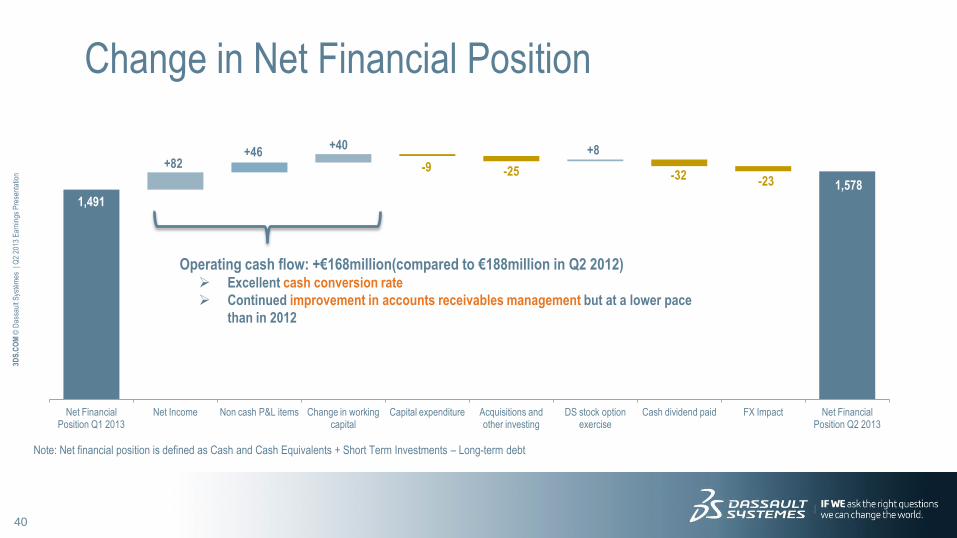
Change in Net Financial Position
Note: Net financial position is defined as Cash and Cash Equivalents + Short Term Investments – Long-term debt
+82 +46
+40
-9
+8
-32 1,578
1,491
-25 -23
Net Financial Position Q1 2013
Net Income Non cash P&L items Change in working capital
Capital expenditure Acquisitions and other investing
DS stock option exercise
Cash dividend paid FX Impact Net Financial Position Q2 2013
Operating cash flow: +€168million(compared to €188million in Q2 2012) Excellent cash conversion rate
Continued improvement in accounts receivables management but at a lower pace
than in 2012
41
3DS
.CO
M ©
Das
saul
t Sys
tèm
es
| Q2
2013
Ear
ning
s P
rese
ntat
ion
1 Q2 & H1-13 Business and Strategy Review
2 Q2 & H1-13 Business Highlights
3 Q3 & FY-13 Financial Objectives
4 Financial Information Appendix
Agenda
42
3DS
.CO
M ©
Das
saul
t Sys
tèm
es
| Q2
2013
Ear
ning
s P
rese
ntat
ion
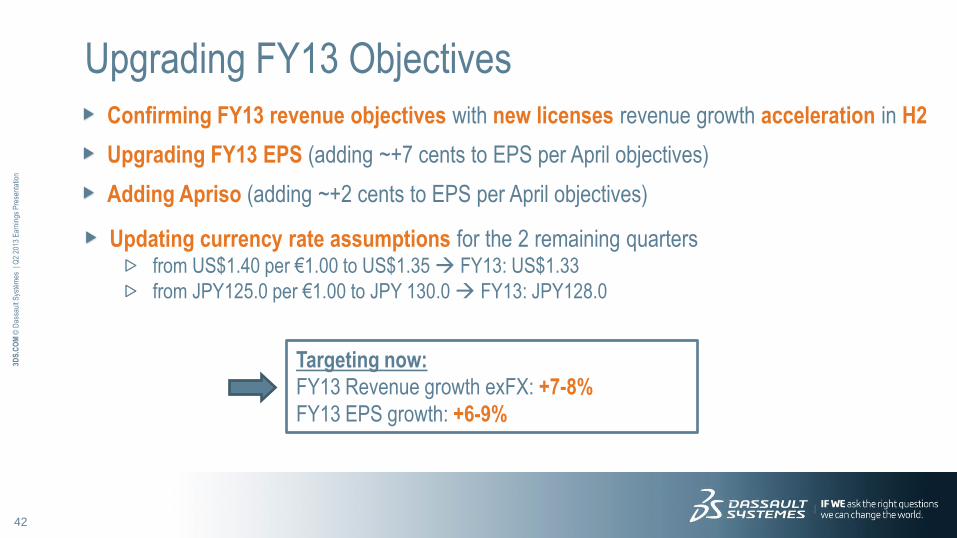
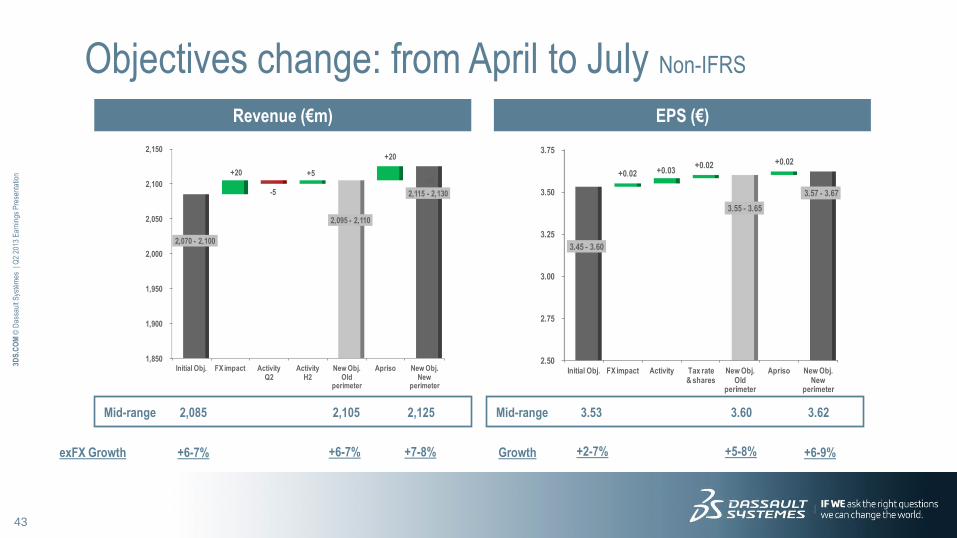
Upgrading FY13 Objectives
Confirming FY13 revenue objectives with new licenses revenue growth acceleration in H2
Upgrading FY13 EPS (adding ~+7 cents to EPS per April objectives)
Adding Apriso (adding ~+2 cents to EPS per April objectives)
Updating currency rate assumptions for the 2 remaining quarters from US$1.40 per €1.00 to US$1.35 FY13: US$1.33
from JPY125.0 per €1.00 to JPY 130.0 FY13: JPY128.0
Targeting now:
FY13 Revenue growth exFX: +7-8%
FY13 EPS growth: +6-9%
43
3DS
.CO
M ©
Das
saul
t Sys
tèm
es
| Q2
2013
Ear
ning
s P
rese
ntat
ion
Objectives change: from April to July Non-IFRS
Mid-range 2,085 2,105 2,125
Revenue (€m) EPS (€)
Mid-range 3.53 3.60 3.62
exFX Growth +6-7% +7-8% Growth +2-7% +6-9%
1,850
1,900
1,950
2,000
2,050
2,100
2,150
Initial Obj. FX impact Activity Q2
ActivityH2
New Obj. Old
perimeter
Apriso New Obj. New
perimeter
2,070 - 2,100
2,095 - 2,110
2,115 - 2,130
+20
-5
-10+5
+20
2.50
2.75
3.00
3.25
3.50
3.75
Initial Obj. FX impact Activity Tax rate& shares
New Obj. Old
perimeter
Apriso New Obj. New
perimeter
3.45 - 3.60
3.55 - 3.65
3.57 - 3.67
+0.02 +0.03+0.02 +0.02
+6-7% +5-8%
44
3DS
.CO
M ©
Das
saul
t Sys
tèm
es
| Q2
2013
Ear
ning
s P
rese
ntat
ion
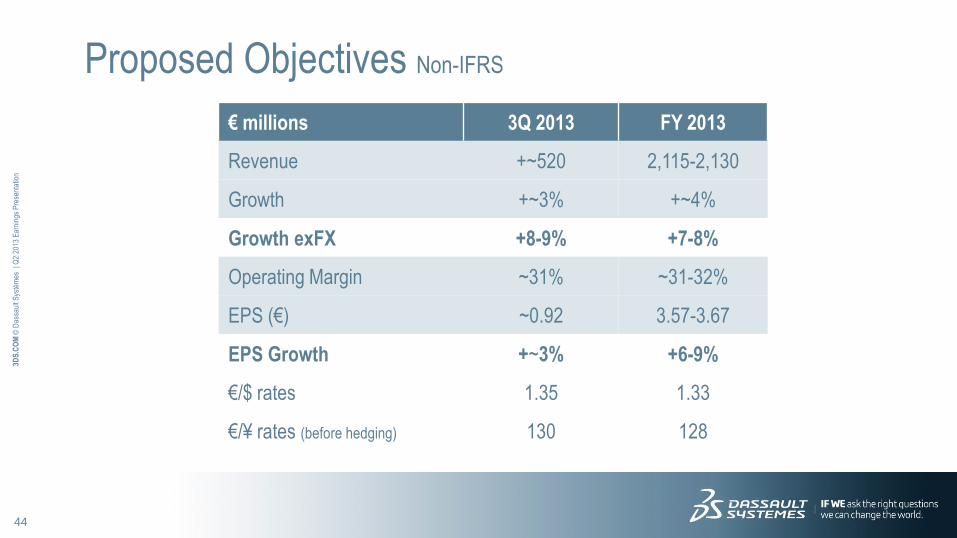
Proposed Objectives Non-IFRS
€ millions 3Q 2013 FY 2013
Revenue +~520 2,115-2,130
Growth +~3% +~4%
Growth exFX +8-9% +7-8%
Operating Margin ~31% ~31-32%
EPS (€) ~0.92 3.57-3.67
EPS Growth +~3% +6-9%
€/$ rates 1.35 1.33
€/¥ rates (before hedging) 130 128
45
3DS
.CO
M ©
Das
saul
t Sys
tèm
es
| Q2
2013
Ear
ning
s P
rese
ntat
ion
1 Q2 & H1-13 Business and Strategy Review
2 Q2 & H1-13 Business Highlights
3 Q3 & FY-13 Financial Objectives
4 Financial Information Appendix
Agenda
46
3DS
.CO
M ©
Das
saul
t Sys
tèm
es
| Q2
2013
Ear
ning
s P
rese
ntat
ion
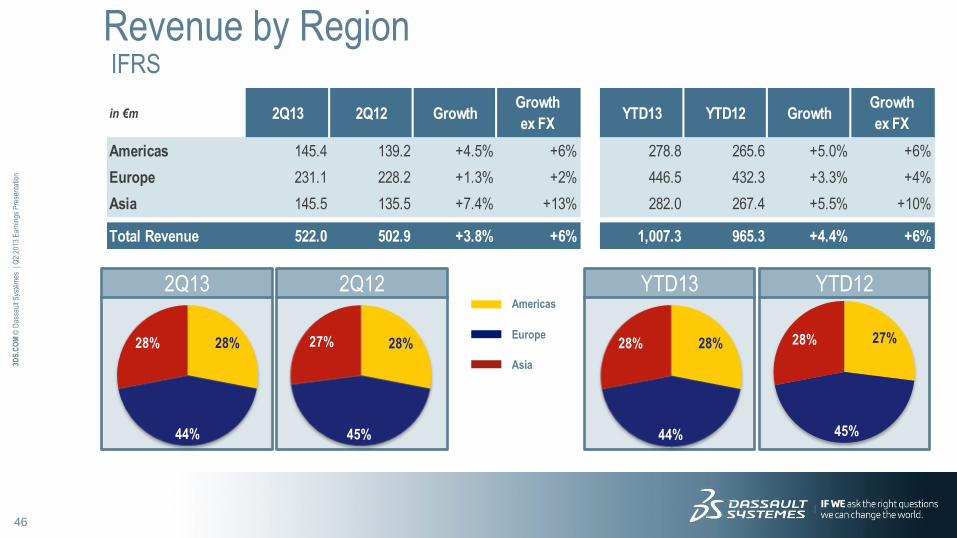
Revenue by Region IFRS
Americas
Europe
Asia
2Q12 2Q13
in €m 2Q13 2Q12 GrowthGrowth
ex FXYTD13 YTD12 Growth
Growth
ex FX
Americas 145.4 139.2 +4.5% +6% 278.8 265.6 +5.0% +6%
Europe 231.1 228.2 +1.3% +2% 446.5 432.3 +3.3% +4%
Asia 145.5 135.5 +7.4% +13% 282.0 267.4 +5.5% +10%
Total Revenue 522.0 502.9 +3.8% +6% 1,007.3 965.3 +4.4% +6%
YTD12 YTD13
28%
44%
28% 28%
45%
27% 28%
44%
28% 27%
45%
28%
47
3DS
.CO
M ©
Das
saul
t Sys
tèm
es
| Q2
2013
Ear
ning
s P
rese
ntat
ion
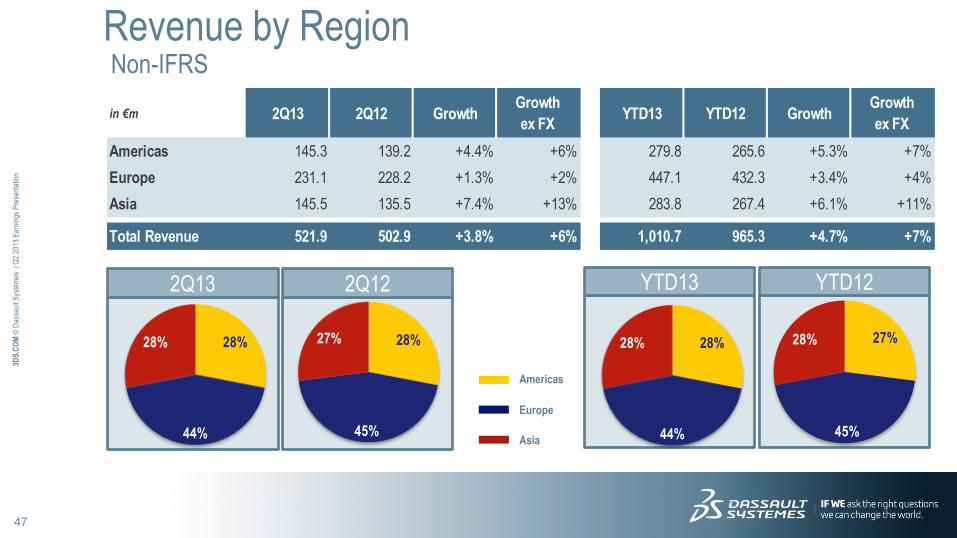
Revenue by Region Non-IFRS
Americas
Europe
Asia
2Q12 2Q13
28%
44%
28%
in €m 2Q13 2Q12 GrowthGrowth
ex FXYTD13 YTD12 Growth
Growth
ex FX
Americas 145.3 139.2 +4.4% +6% 279.8 265.6 +5.3% +7%
Europe 231.1 228.2 +1.3% +2% 447.1 432.3 +3.4% +4%
Asia 145.5 135.5 +7.4% +13% 283.8 267.4 +6.1% +11%
Total Revenue 521.9 502.9 +3.8% +6% 1,010.7 965.3 +4.7% +7%
YTD12 YTD13
28%
44%
28%28%
45%
27% 27%
45%
28%
48
3DS
.CO
M ©
Das
saul
t Sys
tèm
es
| Q2
2013
Ear
ning
s P
rese
ntat
ion
Revenue by Product Line IFRS
2Q12 2Q13 CATIA SW
ENOVIA SW
Other PLM SW
SOLIDWORKS SW
Services
in €m 2Q13 2Q12 GrowthGrowth
ex FXYTD13 YTD12 Growth
Growth
ex FX
PLM SW 369.6 356.3 +3.7% +6% 713.4 677.8 +5.3% +7%
CATIA SW 208.0 208.5 -0.2% +0% 405.6 398.4 +1.8% +2%
ENOVIA SW 64.7 65.8 -1.7% +1% 121.1 123.9 -2.3% +1%
Other PLM SW 96.9 82.0 +18.2% +24% 186.7 155.5 +20.1% +25%
SOLIDWORKS SW 104.9 101.5 +3.3% +6% 207.5 199.9 +3.8% +6%
Services 47.5 45.1 +5.3% +9% 86.4 87.6 -1.4% +1%
Total Revenue 522.0 502.9 +3.8% +6% 1,007.3 965.3 +4.4% +6%
YTD12 YTD13
42%
13%
16%
20%
9%
41%
13%
16%
21%
9%
40%
12%18%
21%
9%
40%
12%19%
20%
9%
49
3DS
.CO
M ©
Das
saul
t Sys
tèm
es
| Q2
2013
Ear
ning
s P
rese
ntat
ion
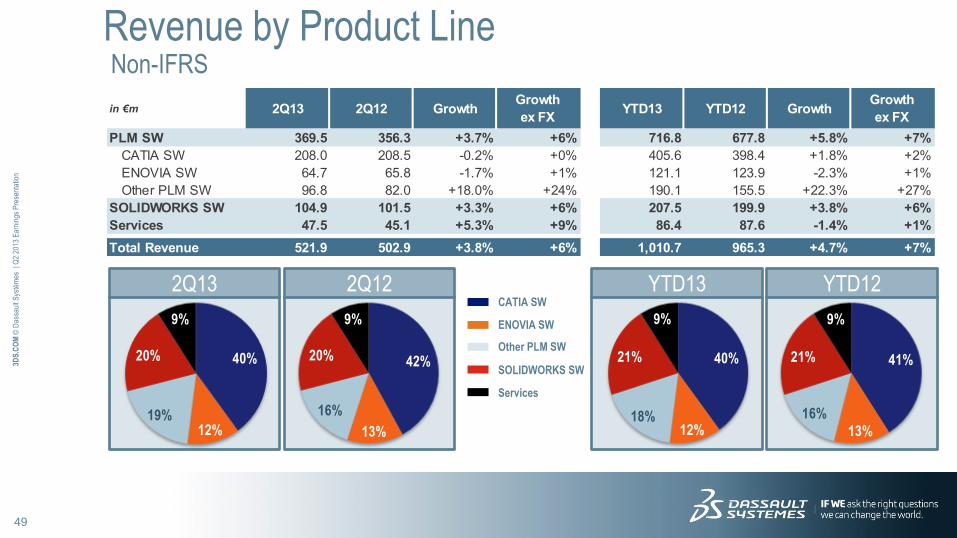
Revenue by Product Line Non-IFRS
CATIA SW
ENOVIA SW
Other PLM SW
SOLIDWORKS SW
Services
2Q12 2Q13 YTD12 YTD13
42%
13%
16%
20%
9%
41%
13%
16%
21%
9%
in €m 2Q13 2Q12 GrowthGrowth
ex FXYTD13 YTD12 Growth
Growth
ex FX
PLM SW 369.5 356.3 +3.7% +6% 716.8 677.8 +5.8% +7%
CATIA SW 208.0 208.5 -0.2% +0% 405.6 398.4 +1.8% +2%
ENOVIA SW 64.7 65.8 -1.7% +1% 121.1 123.9 -2.3% +1%
Other PLM SW 96.8 82.0 +18.0% +24% 190.1 155.5 +22.3% +27%
SOLIDWORKS SW 104.9 101.5 +3.3% +6% 207.5 199.9 +3.8% +6%
Services 47.5 45.1 +5.3% +9% 86.4 87.6 -1.4% +1%
Total Revenue 521.9 502.9 +3.8% +6% 1,010.7 965.3 +4.7% +7%
40%
12%18%
21%
9%
40%
12%19%
20%
9%
50
3DS
.CO
M ©
Das
saul
t Sys
tèm
es
| Q2
2013
Ear
ning
s P
rese
ntat
ion
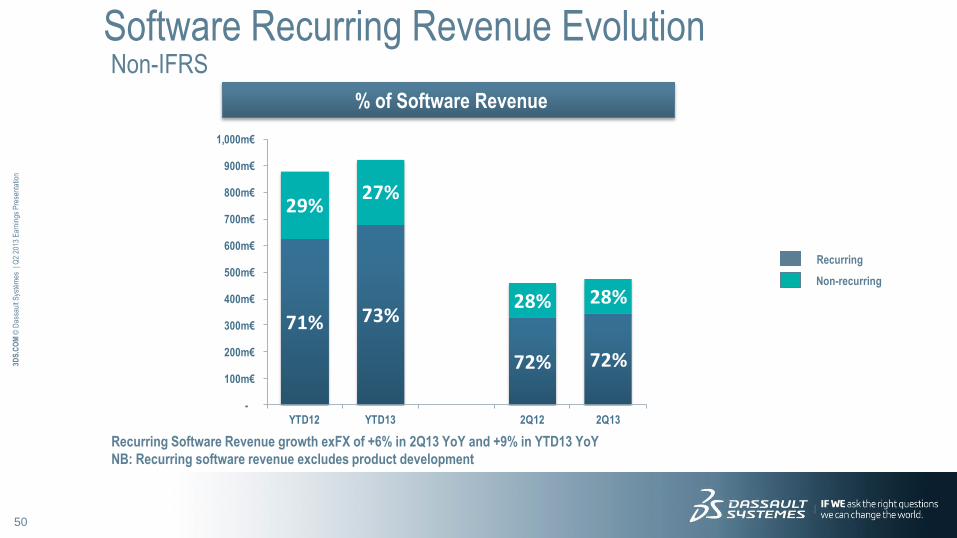
Software Recurring Revenue Evolution Non-IFRS
% of Software Revenue
Recurring Software Revenue growth exFX of +6% in 2Q13 YoY and +9% in YTD13 YoY
NB: Recurring software revenue excludes product development
Recurring
Non-recurring
71% 73%
72% 72%
29%27%
-
28% 28%
-
100m€
200m€
300m€
400m€
500m€
600m€
700m€
800m€
900m€
1,000m€
YTD12 YTD13 2Q12 2Q13
51
3DS
.CO
M ©
Das
saul
t Sys
tèm
es
| Q2
2013
Ear
ning
s P
rese
ntat
ion
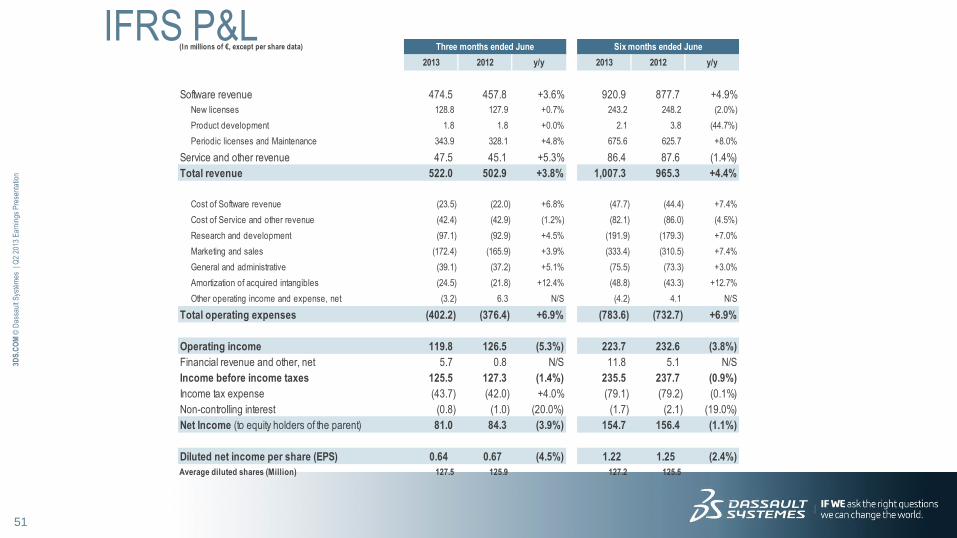
IFRS P&L (In millions of €, except per share data) Three months ended June Six months ended June
2013 2012 y/y 2013 2012 y/y
Software revenue 474.5 457.8 +3.6% 920.9 877.7 +4.9%
New licenses 128.8 127.9 +0.7% 243.2 248.2 (2.0%)
Product development 1.8 1.8 +0.0% 2.1 3.8 (44.7%)
Periodic licenses and Maintenance 343.9 328.1 +4.8% 675.6 625.7 +8.0%
Service and other revenue 47.5 45.1 +5.3% 86.4 87.6 (1.4%)
Total revenue 522.0 502.9 +3.8% 1,007.3 965.3 +4.4%
Cost of Software revenue (23.5) (22.0) +6.8% (47.7) (44.4) +7.4%
Cost of Service and other revenue (42.4) (42.9) (1.2%) (82.1) (86.0) (4.5%)
Research and development (97.1) (92.9) +4.5% (191.9) (179.3) +7.0%
Marketing and sales (172.4) (165.9) +3.9% (333.4) (310.5) +7.4%
General and administrative (39.1) (37.2) +5.1% (75.5) (73.3) +3.0%
Amortization of acquired intangibles (24.5) (21.8) +12.4% (48.8) (43.3) +12.7%
Other operating income and expense, net (3.2) 6.3 N/S (4.2) 4.1 N/S
Total operating expenses (402.2) (376.4) +6.9% (783.6) (732.7) +6.9%
Operating income 119.8 126.5 (5.3%) 223.7 232.6 (3.8%)
Financial revenue and other, net 5.7 0.8 N/S 11.8 5.1 N/S
Income before income taxes 125.5 127.3 (1.4%) 235.5 237.7 (0.9%)
Income tax expense (43.7) (42.0) +4.0% (79.1) (79.2) (0.1%)
Non-controlling interest (0.8) (1.0) (20.0%) (1.7) (2.1) (19.0%)
Net Income (to equity holders of the parent) 81.0 84.3 (3.9%) 154.7 156.4 (1.1%)
Diluted net income per share (EPS) 0.64 0.67 (4.5%) 1.22 1.25 (2.4%)
Average diluted shares (Million) 127.5 125.9 127.2 125.5
52
3DS
.CO
M ©
Das
saul
t Sys
tèm
es
| Q2
2013
Ear
ning
s P
rese
ntat
ion
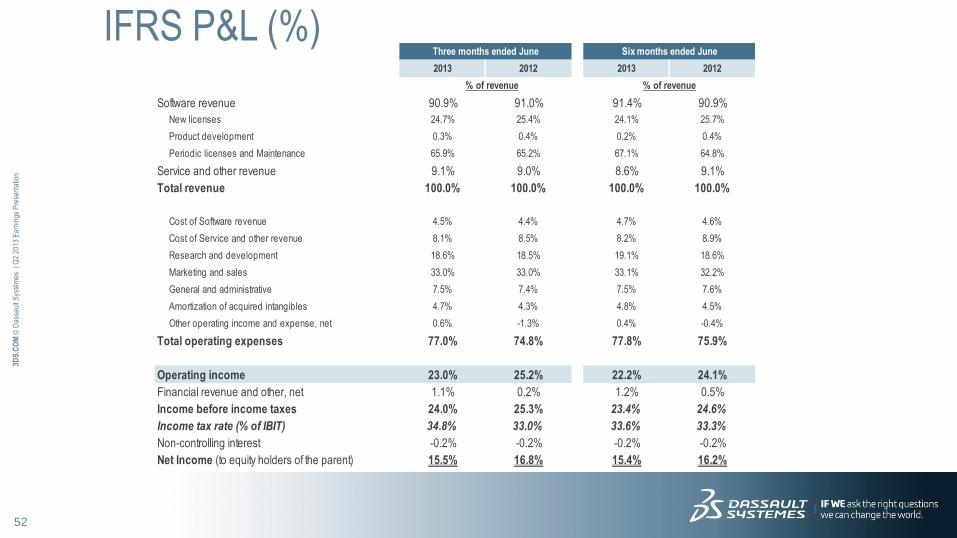
IFRS P&L (%) Three months ended June Six months ended June
2013 2012 2013 2012
% of revenue % of revenue
Software revenue 90.9% 91.0% 91.4% 90.9%
New licenses 24.7% 25.4% 24.1% 25.7%
Product development 0.3% 0.4% 0.2% 0.4%
Periodic licenses and Maintenance 65.9% 65.2% 67.1% 64.8%
Service and other revenue 9.1% 9.0% 8.6% 9.1%
Total revenue 100.0% 100.0% 100.0% 100.0%
Cost of Software revenue 4.5% 4.4% 4.7% 4.6%
Cost of Service and other revenue 8.1% 8.5% 8.2% 8.9%
Research and development 18.6% 18.5% 19.1% 18.6%
Marketing and sales 33.0% 33.0% 33.1% 32.2%
General and administrative 7.5% 7.4% 7.5% 7.6%
Amortization of acquired intangibles 4.7% 4.3% 4.8% 4.5%
Other operating income and expense, net 0.6% -1.3% 0.4% -0.4%
Total operating expenses 77.0% 74.8% 77.8% 75.9%
Operating income 23.0% 25.2% 22.2% 24.1%
Financial revenue and other, net 1.1% 0.2% 1.2% 0.5%
Income before income taxes 24.0% 25.3% 23.4% 24.6%
Income tax rate (% of IBIT) 34.8% 33.0% 33.6% 33.3%
Non-controlling interest -0.2% -0.2% -0.2% -0.2%
Net Income (to equity holders of the parent) 15.5% 16.8% 15.4% 16.2%
53
3DS
.CO
M ©
Das
saul
t Sys
tèm
es
| Q2
2013
Ear
ning
s P
rese
ntat
ion
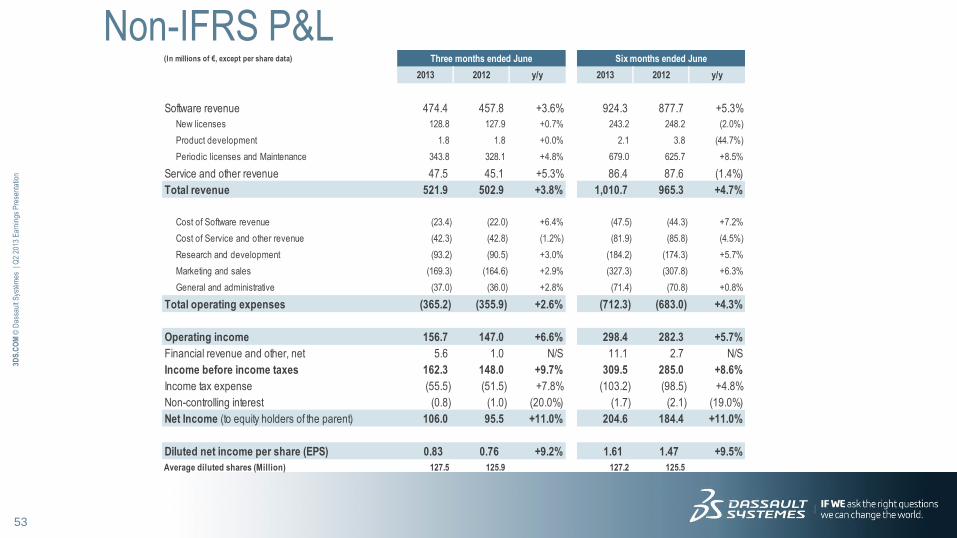
Non-IFRS P&L (In millions of €, except per share data) Three months ended June Six months ended June
2013 2012 y/y 2013 2012 y/y
Software revenue 474.4 457.8 +3.6% 924.3 877.7 +5.3%
New licenses 128.8 127.9 +0.7% 243.2 248.2 (2.0%)
Product development 1.8 1.8 +0.0% 2.1 3.8 (44.7%)
Periodic licenses and Maintenance 343.8 328.1 +4.8% 679.0 625.7 +8.5%
Service and other revenue 47.5 45.1 +5.3% 86.4 87.6 (1.4%)
Total revenue 521.9 502.9 +3.8% 1,010.7 965.3 +4.7%
Cost of Software revenue (23.4) (22.0) +6.4% (47.5) (44.3) +7.2%
Cost of Service and other revenue (42.3) (42.8) (1.2%) (81.9) (85.8) (4.5%)
Research and development (93.2) (90.5) +3.0% (184.2) (174.3) +5.7%
Marketing and sales (169.3) (164.6) +2.9% (327.3) (307.8) +6.3%
General and administrative (37.0) (36.0) +2.8% (71.4) (70.8) +0.8%
Total operating expenses (365.2) (355.9) +2.6% (712.3) (683.0) +4.3%
Operating income 156.7 147.0 +6.6% 298.4 282.3 +5.7%
Financial revenue and other, net 5.6 1.0 N/S 11.1 2.7 N/S
Income before income taxes 162.3 148.0 +9.7% 309.5 285.0 +8.6%
Income tax expense (55.5) (51.5) +7.8% (103.2) (98.5) +4.8%
Non-controlling interest (0.8) (1.0) (20.0%) (1.7) (2.1) (19.0%)
Net Income (to equity holders of the parent) 106.0 95.5 +11.0% 204.6 184.4 +11.0%
Diluted net income per share (EPS) 0.83 0.76 +9.2% 1.61 1.47 +9.5%
Average diluted shares (Million) 127.5 125.9 127.2 125.5
54
3DS
.CO
M ©
Das
saul
t Sys
tèm
es
| Q2
2013
Ear
ning
s P
rese
ntat
ion
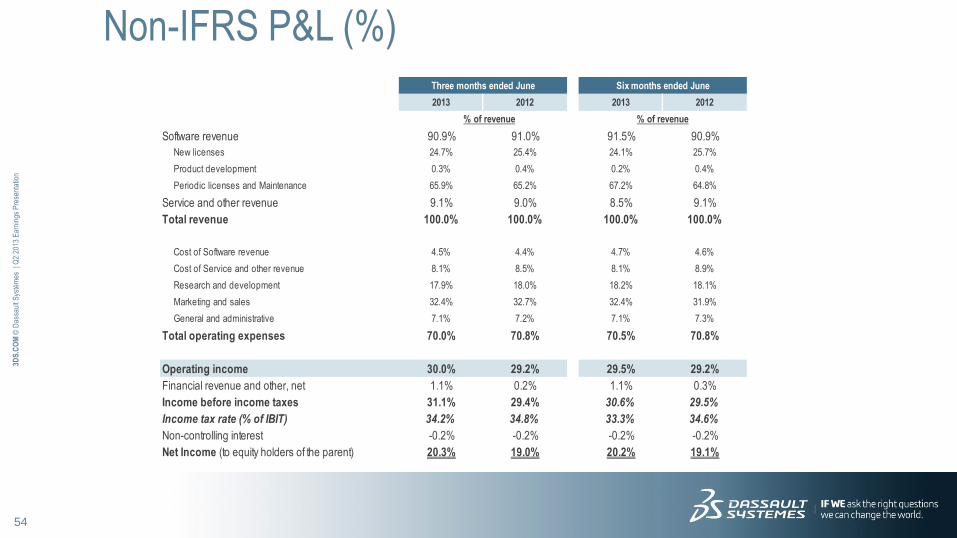
Non-IFRS P&L (%) Three months ended June Six months ended June
2013 2012 2013 2012
% of revenue % of revenue
Software revenue 90.9% 91.0% 91.5% 90.9%
New licenses 24.7% 25.4% 24.1% 25.7%
Product development 0.3% 0.4% 0.2% 0.4%
Periodic licenses and Maintenance 65.9% 65.2% 67.2% 64.8%
Service and other revenue 9.1% 9.0% 8.5% 9.1%
Total revenue 100.0% 100.0% 100.0% 100.0%
Cost of Software revenue 4.5% 4.4% 4.7% 4.6%
Cost of Service and other revenue 8.1% 8.5% 8.1% 8.9%
Research and development 17.9% 18.0% 18.2% 18.1%
Marketing and sales 32.4% 32.7% 32.4% 31.9%
General and administrative 7.1% 7.2% 7.1% 7.3%
Total operating expenses 70.0% 70.8% 70.5% 70.8%
Operating income 30.0% 29.2% 29.5% 29.2%
Financial revenue and other, net 1.1% 0.2% 1.1% 0.3%
Income before income taxes 31.1% 29.4% 30.6% 29.5%
Income tax rate (% of IBIT) 34.2% 34.8% 33.3% 34.6%
Non-controlling interest -0.2% -0.2% -0.2% -0.2%
Net Income (to equity holders of the parent) 20.3% 19.0% 20.2% 19.1%
55
3DS
.CO
M ©
Das
saul
t Sys
tèm
es
| Q2
2013
Ear
ning
s P
rese
ntat
ion
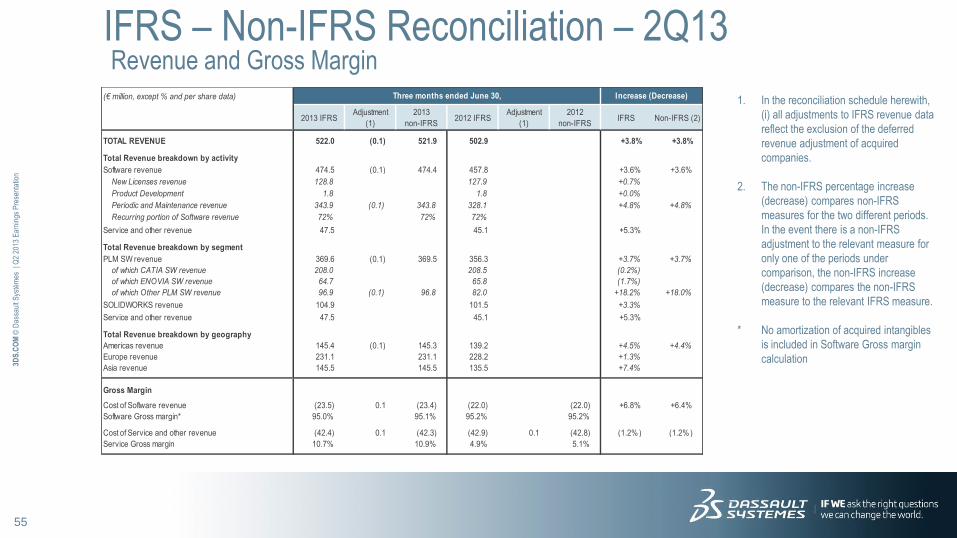
IFRS – Non-IFRS Reconciliation – 2Q13 Revenue and Gross Margin
1. In the reconciliation schedule herewith,
(i) all adjustments to IFRS revenue data
reflect the exclusion of the deferred
revenue adjustment of acquired
companies.
2. The non-IFRS percentage increase
(decrease) compares non-IFRS
measures for the two different periods.
In the event there is a non-IFRS
adjustment to the relevant measure for
only one of the periods under
comparison, the non-IFRS increase
(decrease) compares the non-IFRS
measure to the relevant IFRS measure.
* No amortization of acquired intangibles
is included in Software Gross margin
calculation
(€ million, except % and per share data)
2013 IFRSAdjustment
(1)
2013
non-IFRS2012 IFRS
Adjustment
(1)
2012
non-IFRSIFRS Non-IFRS (2)
TOTAL REVENUE 522.0 (0.1) 521.9 502.9 +3.8% +3.8%
Total Revenue breakdown by activity
Software revenue 474.5 (0.1) 474.4 457.8 +3.6% +3.6%
New Licenses revenue 128.8 127.9 +0.7%
Product Development 1.8 1.8 +0.0%
Periodic and Maintenance revenue 343.9 (0.1) 343.8 328.1 +4.8% +4.8%
Recurring portion of Software revenue 72% 72% 72%
Service and other revenue 47.5 45.1 +5.3%
Total Revenue breakdown by segment
PLM SW revenue 369.6 (0.1) 369.5 356.3 +3.7% +3.7%
of which CATIA SW revenue 208.0 208.5 (0.2%)
of which ENOVIA SW revenue 64.7 65.8 (1.7%)
of which Other PLM SW revenue 96.9 (0.1) 96.8 82.0 +18.2% +18.0%
SOLIDWORKS revenue 104.9 101.5 +3.3%
Service and other revenue 47.5 45.1 +5.3%
Total Revenue breakdown by geography
Americas revenue 145.4 (0.1) 145.3 139.2 +4.5% +4.4%
Europe revenue 231.1 231.1 228.2 +1.3%
Asia revenue 145.5 145.5 135.5 +7.4%
Gross Margin
Cost of Software revenue (23.5) 0.1 (23.4) (22.0) (22.0) +6.8% +6.4%
Software Gross margin* 95.0% 95.1% 95.2% 95.2%
Cost of Service and other revenue (42.4) 0.1 (42.3) (42.9) 0.1 (42.8) (1.2%) (1.2% )
Service Gross margin 10.7% 10.9% 4.9% 5.1%
Increase (Decrease)Three months ended June 30,
56
3DS
.CO
M ©
Das
saul
t Sys
tèm
es
| Q2
2013
Ear
ning
s P
rese
ntat
ion
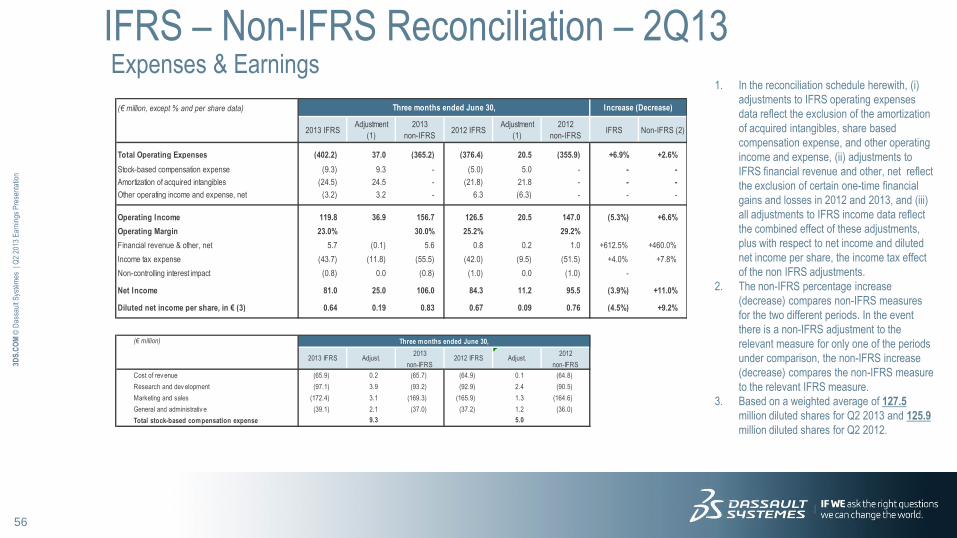
IFRS – Non-IFRS Reconciliation – 2Q13 Expenses & Earnings
1. In the reconciliation schedule herewith, (i)
adjustments to IFRS operating expenses
data reflect the exclusion of the amortization
of acquired intangibles, share based
compensation expense, and other operating
income and expense, (ii) adjustments to
IFRS financial revenue and other, net reflect
the exclusion of certain one-time financial
gains and losses in 2012 and 2013, and (iii)
all adjustments to IFRS income data reflect
the combined effect of these adjustments,
plus with respect to net income and diluted
net income per share, the income tax effect
of the non IFRS adjustments.
2. The non-IFRS percentage increase
(decrease) compares non-IFRS measures
for the two different periods. In the event
there is a non-IFRS adjustment to the
relevant measure for only one of the periods
under comparison, the non-IFRS increase
(decrease) compares the non-IFRS measure
to the relevant IFRS measure.
3. Based on a weighted average of 127.5
million diluted shares for Q2 2013 and 125.9
million diluted shares for Q2 2012.
(€ million, except % and per share data)
2013 IFRSAdjustment
(1)
2013
non-IFRS2012 IFRS
Adjustment
(1)
2012
non-IFRSIFRS Non-IFRS (2)
Total Operating Expenses (402.2) 37.0 (365.2) (376.4) 20.5 (355.9) +6.9% +2.6%
Stock-based compensation expense (9.3) 9.3 - (5.0) 5.0 - - -
Amortization of acquired intangibles (24.5) 24.5 - (21.8) 21.8 - - -
Other operating income and expense, net (3.2) 3.2 - 6.3 (6.3) - - -
Operating Income 119.8 36.9 156.7 126.5 20.5 147.0 (5.3%) +6.6%
Operating Margin 23.0% 30.0% 25.2% 29.2%
Financial revenue & other, net 5.7 (0.1) 5.6 0.8 0.2 1.0 +612.5% +460.0%
Income tax expense (43.7) (11.8) (55.5) (42.0) (9.5) (51.5) +4.0% +7.8%
Non-controlling interest impact (0.8) 0.0 (0.8) (1.0) 0.0 (1.0) -
Net Income 81.0 25.0 106.0 84.3 11.2 95.5 (3.9%) +11.0%
Diluted net income per share, in € (3) 0.64 0.19 0.83 0.67 0.09 0.76 (4.5%) +9.2%
(€ million)
Cost of rev enue (65.9) 0.2 (65.7) (64.9) 0.1 (64.8)
Research and dev elopment (97.1) 3.9 (93.2) (92.9) 2.4 (90.5)
Marketing and sales (172.4) 3.1 (169.3) (165.9) 1.3 (164.6)
General and administrativ e (39.1) 2.1 (37.0) (37.2) 1.2 (36.0)
Total stock-based compensation expense 9.3 5.0
2012 IFRS2012
non-IFRS
2013
non-IFRS
Increase (Decrease)Three months ended June 30,
Adjust.
Three months ended June 30,
2013 IFRS Adjust.
57
3DS
.CO
M ©
Das
saul
t Sys
tèm
es
| Q2
2013
Ear
ning
s P
rese
ntat
ion
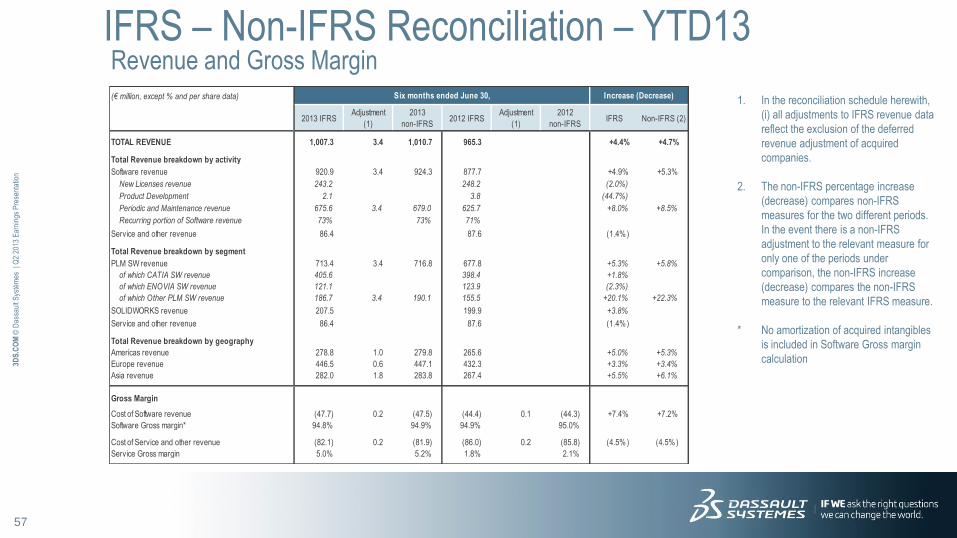
IFRS – Non-IFRS Reconciliation – YTD13 Revenue and Gross Margin
1. In the reconciliation schedule herewith,
(i) all adjustments to IFRS revenue data
reflect the exclusion of the deferred
revenue adjustment of acquired
companies.
2. The non-IFRS percentage increase
(decrease) compares non-IFRS
measures for the two different periods.
In the event there is a non-IFRS
adjustment to the relevant measure for
only one of the periods under
comparison, the non-IFRS increase
(decrease) compares the non-IFRS
measure to the relevant IFRS measure.
* No amortization of acquired intangibles
is included in Software Gross margin
calculation
(€ million, except % and per share data)
2013 IFRSAdjustment
(1)
2013
non-IFRS2012 IFRS
Adjustment
(1)
2012
non-IFRSIFRS Non-IFRS (2)
TOTAL REVENUE 1,007.3 3.4 1,010.7 965.3 +4.4% +4.7%
Total Revenue breakdown by activity
Software revenue 920.9 3.4 924.3 877.7 +4.9% +5.3%
New Licenses revenue 243.2 248.2 (2.0%)
Product Development 2.1 3.8 (44.7%)
Periodic and Maintenance revenue 675.6 3.4 679.0 625.7 +8.0% +8.5%
Recurring portion of Software revenue 73% 73% 71%
Service and other revenue 86.4 87.6 (1.4% )
Total Revenue breakdown by segment
PLM SW revenue 713.4 3.4 716.8 677.8 +5.3% +5.8%
of which CATIA SW revenue 405.6 398.4 +1.8%
of which ENOVIA SW revenue 121.1 123.9 (2.3%)
of which Other PLM SW revenue 186.7 3.4 190.1 155.5 +20.1% +22.3%
SOLIDWORKS revenue 207.5 199.9 +3.8%
Service and other revenue 86.4 87.6 (1.4% )
Total Revenue breakdown by geography
Americas revenue 278.8 1.0 279.8 265.6 +5.0% +5.3%
Europe revenue 446.5 0.6 447.1 432.3 +3.3% +3.4%
Asia revenue 282.0 1.8 283.8 267.4 +5.5% +6.1%
Gross Margin
Cost of Software revenue (47.7) 0.2 (47.5) (44.4) 0.1 (44.3) +7.4% +7.2%
Software Gross margin* 94.8% 94.9% 94.9% 95.0%
Cost of Service and other revenue (82.1) 0.2 (81.9) (86.0) 0.2 (85.8) (4.5% ) (4.5%)
Service Gross margin 5.0% 5.2% 1.8% 2.1%
Six months ended June 30, Increase (Decrease)
58
3DS
.CO
M ©
Das
saul
t Sys
tèm
es
| Q2
2013
Ear
ning
s P
rese
ntat
ion
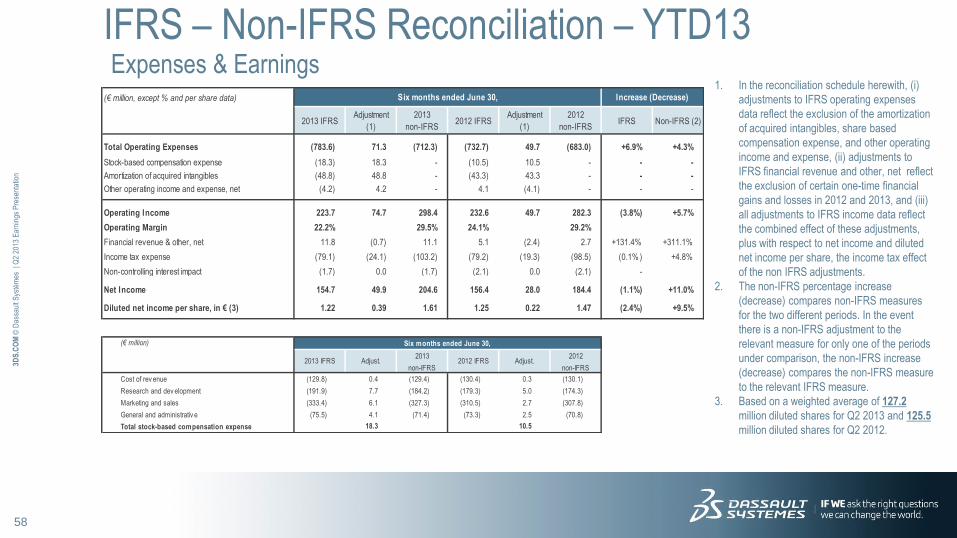
IFRS – Non-IFRS Reconciliation – YTD13 Expenses & Earnings
1. In the reconciliation schedule herewith, (i)
adjustments to IFRS operating expenses
data reflect the exclusion of the amortization
of acquired intangibles, share based
compensation expense, and other operating
income and expense, (ii) adjustments to
IFRS financial revenue and other, net reflect
the exclusion of certain one-time financial
gains and losses in 2012 and 2013, and (iii)
all adjustments to IFRS income data reflect
the combined effect of these adjustments,
plus with respect to net income and diluted
net income per share, the income tax effect
of the non IFRS adjustments.
2. The non-IFRS percentage increase
(decrease) compares non-IFRS measures
for the two different periods. In the event
there is a non-IFRS adjustment to the
relevant measure for only one of the periods
under comparison, the non-IFRS increase
(decrease) compares the non-IFRS measure
to the relevant IFRS measure.
3. Based on a weighted average of 127.2
million diluted shares for Q2 2013 and 125.5
million diluted shares for Q2 2012.
(€ million, except % and per share data)
2013 IFRSAdjustment
(1)
2013
non-IFRS2012 IFRS
Adjustment
(1)
2012
non-IFRSIFRS Non-IFRS (2)
Total Operating Expenses (783.6) 71.3 (712.3) (732.7) 49.7 (683.0) +6.9% +4.3%
Stock-based compensation expense (18.3) 18.3 - (10.5) 10.5 - - -
Amortization of acquired intangibles (48.8) 48.8 - (43.3) 43.3 - - -
Other operating income and expense, net (4.2) 4.2 - 4.1 (4.1) - - -
Operating Income 223.7 74.7 298.4 232.6 49.7 282.3 (3.8%) +5.7%
Operating Margin 22.2% 29.5% 24.1% 29.2%
Financial revenue & other, net 11.8 (0.7) 11.1 5.1 (2.4) 2.7 +131.4% +311.1%
Income tax expense (79.1) (24.1) (103.2) (79.2) (19.3) (98.5) (0.1%) +4.8%
Non-controlling interest impact (1.7) 0.0 (1.7) (2.1) 0.0 (2.1) -
Net Income 154.7 49.9 204.6 156.4 28.0 184.4 (1.1%) +11.0%
Diluted net income per share, in € (3) 1.22 0.39 1.61 1.25 0.22 1.47 (2.4%) +9.5%
(€ million)
Cost of rev enue (129.8) 0.4 (129.4) (130.4) 0.3 (130.1)
Research and dev elopment (191.9) 7.7 (184.2) (179.3) 5.0 (174.3)
Marketing and sales (333.4) 6.1 (327.3) (310.5) 2.7 (307.8)
General and administrativ e (75.5) 4.1 (71.4) (73.3) 2.5 (70.8)
Total stock-based compensation expense 18.3 10.5
Six months ended June 30,
2013 IFRS Adjust.2013
non-IFRS2012 IFRS Adjust.
2012
non-IFRS
Six months ended June 30, Increase (Decrease)
59
3DS
.CO
M ©
Das
saul
t Sys
tèm
es
| Q2
2013
Ear
ning
s P
rese
ntat
ion
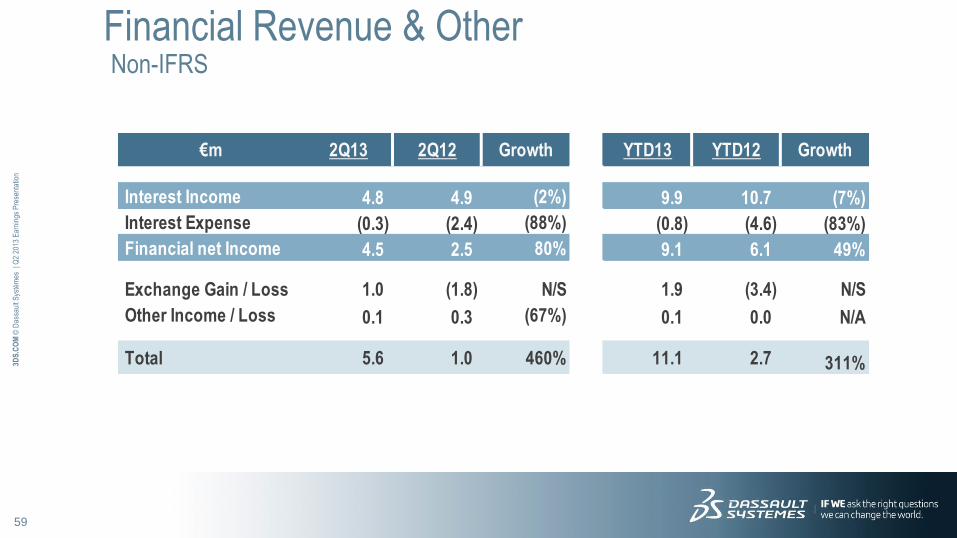
Financial Revenue & Other Non-IFRS
€m 2Q13 2Q12 Growth YTD13 YTD12 Growth
Interest Income 4.8 4.9 (2%) 9.9 10.7 (7%)
Interest Expense (0.3) (2.4) (88%) (0.8) (4.6) (83%)
Financial net Income 4.5 2.5 80% 9.1 6.1 49%
Exchange Gain / Loss 1.0 (1.8) N/S 1.9 (3.4) N/S
Other Income / Loss 0.1 0.3 (67%) 0.1 0.0 N/A
Total 5.6 1.0 460% 11.1 2.7 311%
60
3DS
.CO
M ©
Das
saul
t Sys
tèm
es
| Q2
2013
Ear
ning
s P
rese
ntat
ion
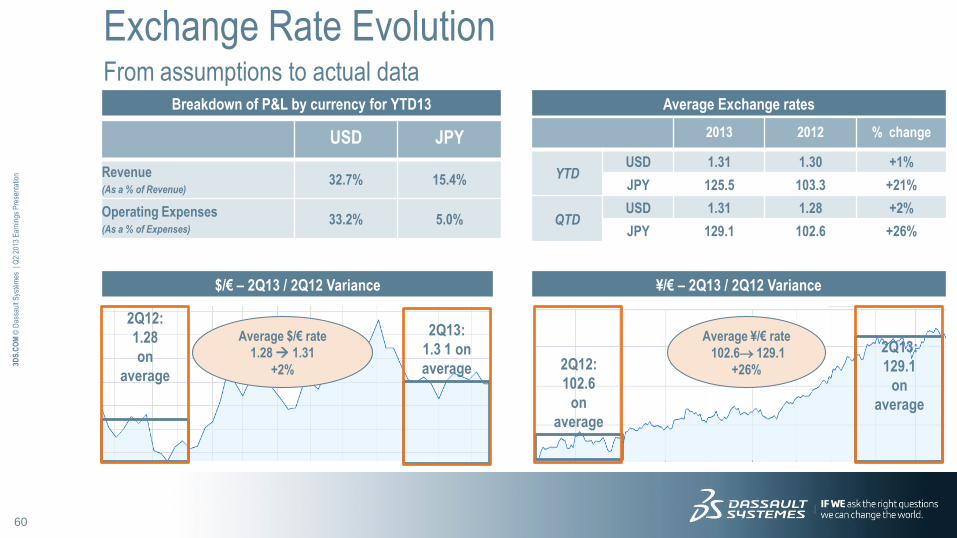
Exchange Rate Evolution From assumptions to actual data
Breakdown of P&L by currency for YTD13
USD JPY
Revenue (As a % of Revenue)
32.7% 15.4%
Operating Expenses (As a % of Expenses)
33.2% 5.0%
Average Exchange rates
$/€ – 2Q13 / 2Q12 Variance ¥/€ – 2Q13 / 2Q12 Variance
2Q12:
1.28
on
average
Average ¥/€ rate
102.6 129.1
+26%
Average $/€ rate
1.28 1.31
+2%
2Q13:
129.1
on
average
2013 2012 % change
YTD USD 1.31 1.30 +1%
JPY 125.5 103.3 +21%
QTD USD 1.31 1.28 +2%
JPY 129.1 102.6 +26%
2Q12:
102.6
on
average
2Q13:
1.3 1 on
average
61
3DS
.CO
M ©
Das
saul
t Sys
tèm
es
| Q2
2013
Ear
ning
s P
rese
ntat
ion
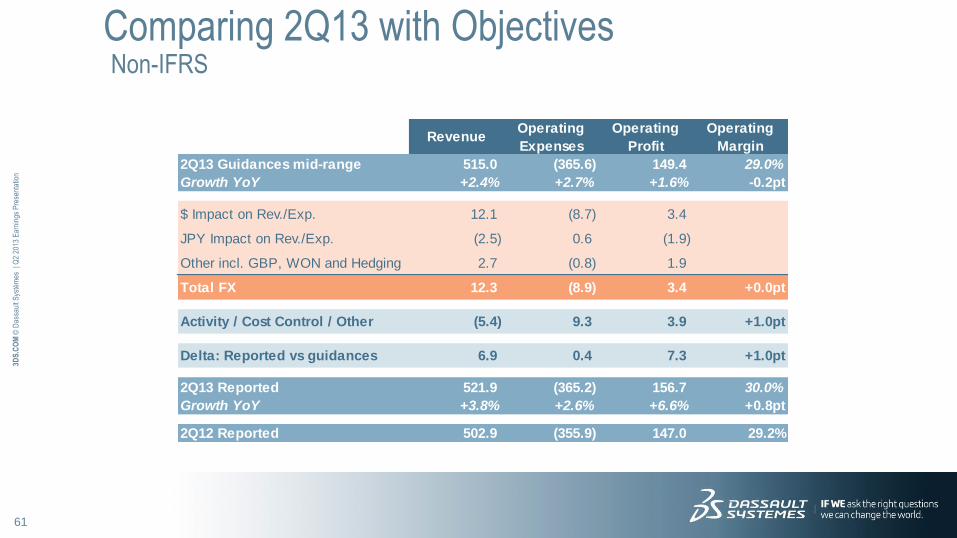
Comparing 2Q13 with Objectives Non-IFRS
RevenueOperating
Expenses
Operating
Profit
Operating
Margin
2Q13 Guidances mid-range 515.0 (365.6) 149.4 29.0%
Growth YoY +2.4% +2.7% +1.6% -0.2pt
$ Impact on Rev./Exp. 12.1 (8.7) 3.4
JPY Impact on Rev./Exp. (2.5) 0.6 (1.9)
Other incl. GBP, WON and Hedging 2.7 (0.8) 1.9
Total FX 12.3 (8.9) 3.4 +0.0pt
Activity / Cost Control / Other (5.4) 9.3 3.9 +1.0pt
Delta: Reported vs guidances 6.9 0.4 7.3 +1.0pt
2Q13 Reported 521.9 (365.2) 156.7 30.0%
Growth YoY +3.8% +2.6% +6.6% +0.8pt
2Q12 Reported 502.9 (355.9) 147.0 29.2%
62
3DS
.CO
M ©
Das
saul
t Sys
tèm
es
| Q2
2013
Ear
ning
s P
rese
ntat
ion
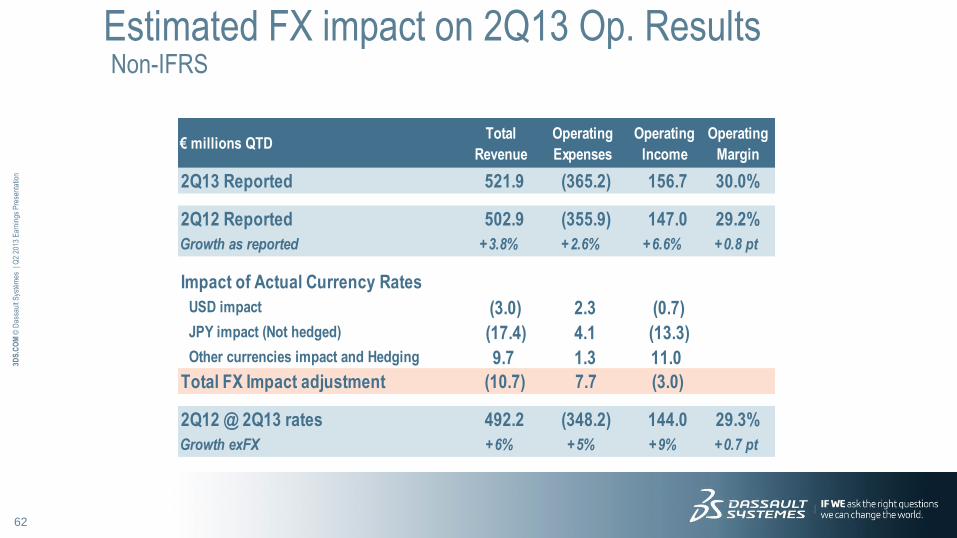
Estimated FX impact on 2Q13 Op. Results Non-IFRS
€ millions QTDTotal
Revenue
Operating
Expenses
Operating
Income
Operating
Margin
2Q13 Reported 521.9 (365.2) 156.7 30.0%
2Q12 Reported 502.9 (355.9) 147.0 29.2%
Growth as reported +3.8% +2.6% +6.6% +0.8 pt
Impact of Actual Currency Rates
USD impact (3.0) 2.3 (0.7)
JPY impact (Not hedged) (17.4) 4.1 (13.3)
Other currencies impact and Hedging 9.7 1.3 11.0
Total FX Impact adjustment (10.7) 7.7 (3.0)
2Q12 @ 2Q13 rates 492.2 (348.2) 144.0 29.3%
Growth exFX +6% +5% +9% +0.7 pt
63
3DS
.CO
M ©
Das
saul
t Sys
tèm
es
| Q2
2013
Ear
ning
s P
rese
ntat
ion
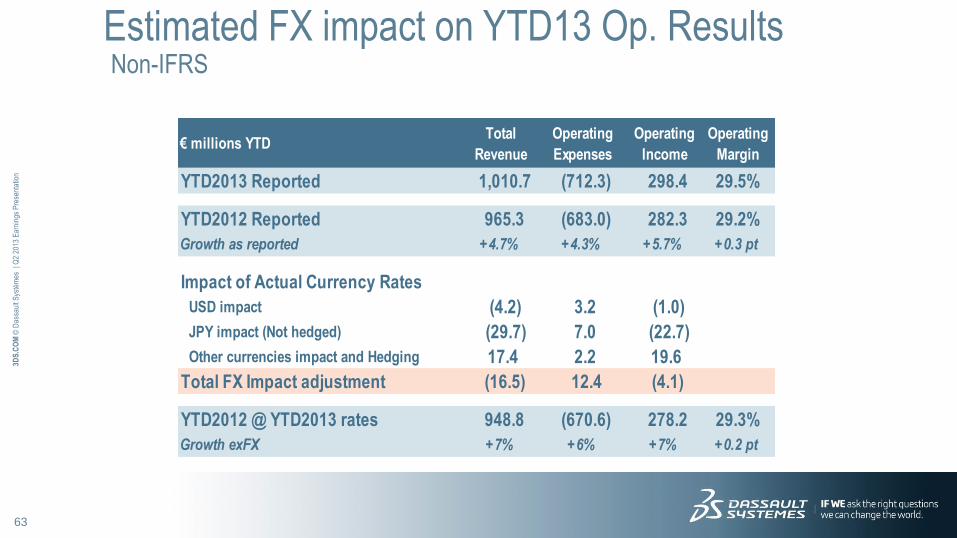
Estimated FX impact on YTD13 Op. Results Non-IFRS
€ millions YTDTotal
Revenue
Operating
Expenses
Operating
Income
Operating
Margin
YTD2013 Reported 1,010.7 (712.3) 298.4 29.5%
YTD2012 Reported 965.3 (683.0) 282.3 29.2%
Growth as reported +4.7% +4.3% +5.7% +0.3 pt
Impact of Actual Currency Rates
USD impact (4.2) 3.2 (1.0)
JPY impact (Not hedged) (29.7) 7.0 (22.7)
Other currencies impact and Hedging 17.4 2.2 19.6
Total FX Impact adjustment (16.5) 12.4 (4.1)
YTD2012 @ YTD2013 rates 948.8 (670.6) 278.2 29.3%
Growth exFX +7% +6% +7% +0.2 pt
64
3DS
.CO
M ©
Das
saul
t Sys
tèm
es
| Q2
2013
Ear
ning
s P
rese
ntat
ion
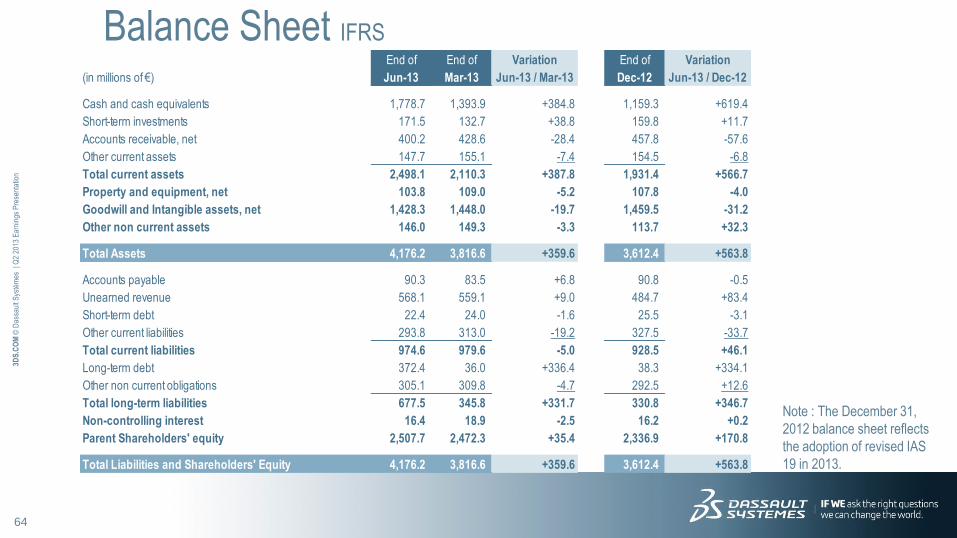
Balance Sheet IFRS
Note : The December 31,
2012 balance sheet reflects
the adoption of revised IAS
19 in 2013.
End of End of Variation End of Variation
(in millions of €) Jun-13 Mar-13 Jun-13 / Mar-13 Dec-12 Jun-13 / Dec-12
Cash and cash equivalents 1,778.7 1,393.9 +384.8 1,159.3 +619.4
Short-term investments 171.5 132.7 +38.8 159.8 +11.7
Accounts receivable, net 400.2 428.6 -28.4 457.8 -57.6
Other current assets 147.7 155.1 -7.4 154.5 -6.8
Total current assets 2,498.1 2,110.3 +387.8 1,931.4 +566.7
Property and equipment, net 103.8 109.0 -5.2 107.8 -4.0
Goodwill and Intangible assets, net 1,428.3 1,448.0 -19.7 1,459.5 -31.2
Other non current assets 146.0 149.3 -3.3 113.7 +32.3
Total Assets 4,176.2 3,816.6 +359.6 3,612.4 +563.8
Accounts payable 90.3 83.5 +6.8 90.8 -0.5
Unearned revenue 568.1 559.1 +9.0 484.7 +83.4
Short-term debt 22.4 24.0 -1.6 25.5 -3.1
Other current liabilities 293.8 313.0 -19.2 327.5 -33.7
Total current liabilities 974.6 979.6 -5.0 928.5 +46.1
Long-term debt 372.4 36.0 +336.4 38.3 +334.1
Other non current obligations 305.1 309.8 -4.7 292.5 +12.6
Total long-term liabilities 677.5 345.8 +331.7 330.8 +346.7
Non-controlling interest 16.4 18.9 -2.5 16.2 +0.2
Parent Shareholders' equity 2,507.7 2,472.3 +35.4 2,336.9 +170.8
Total Liabilities and Shareholders' Equity 4,176.2 3,816.6 +359.6 3,612.4 +563.8
65
3DS
.CO
M ©
Das
saul
t Sys
tèm
es
| Q2
2013
Ear
ning
s P
rese
ntat
ion
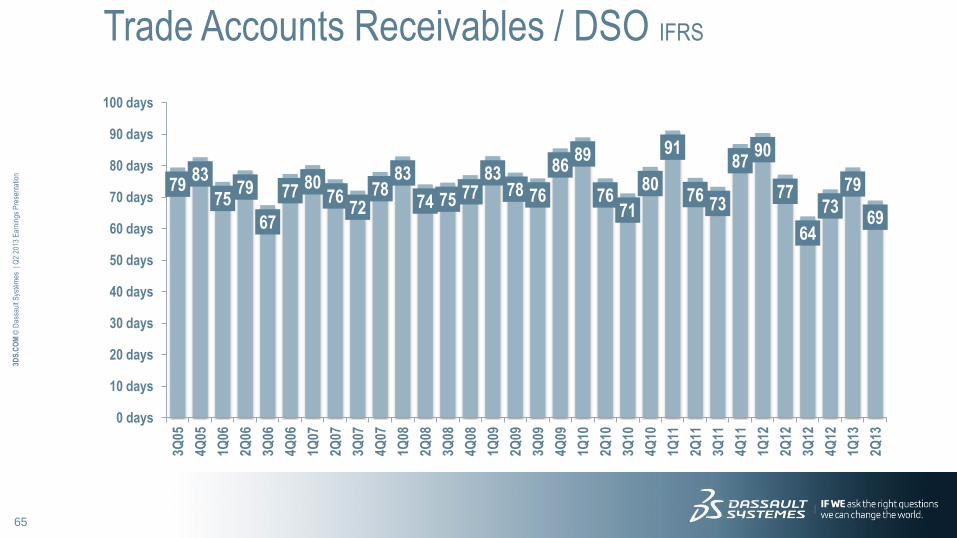
Trade Accounts Receivables / DSO IFRS
79 83
75 79
67
77 80
76 72
78 83
74 75 77 83
78 76
86 89
76 71
80
91
76 73
87 90
77
64
73
79
69
0 days
10 days
20 days
30 days
40 days
50 days
60 days
70 days
80 days
90 days
100 days
3Q05
4Q05
1Q06
2Q06
3Q06
4Q06
1Q07
2Q07
3Q07
4Q07
1Q08
2Q08
3Q08
4Q08
1Q09
2Q09
3Q09
4Q09
1Q10
2Q10
3Q10
4Q10
1Q11
2Q11
3Q11
4Q11
1Q12
2Q12
3Q12
4Q12
1Q13
2Q13
66
3DS
.CO
M ©
Das
saul
t Sys
tèm
es
| Q2
2013
Ear
ning
s P
rese
ntat
ion
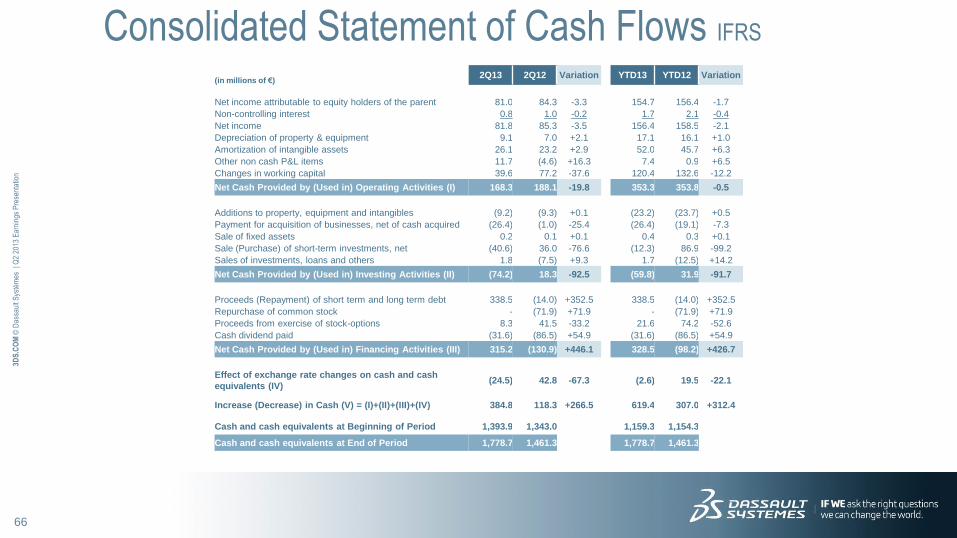
Consolidated Statement of Cash Flows IFRS
(in millions of €) 2Q13 2Q12 Variation YTD13 YTD12 Variation
Net income attributable to equity holders of the parent 81.0 84.3 -3.3 154.7 156.4 -1.7
Non-controlling interest 0.8 1.0 -0.2 1.7 2.1 -0.4
Net income 81.8 85.3 -3.5 156.4 158.5 -2.1
Depreciation of property & equipment 9.1 7.0 +2.1 17.1 16.1 +1.0
Amortization of intangible assets 26.1 23.2 +2.9 52.0 45.7 +6.3
Other non cash P&L items 11.7 (4.6) +16.3 7.4 0.9 +6.5
Changes in working capital 39.6 77.2 -37.6 120.4 132.6 -12.2
Net Cash Provided by (Used in) Operating Activities (I) 168.3 188.1 -19.8 353.3 353.8 -0.5
Additions to property, equipment and intangibles (9.2) (9.3) +0.1 (23.2) (23.7) +0.5
Payment for acquisition of businesses, net of cash acquired (26.4) (1.0) -25.4 (26.4) (19.1) -7.3
Sale of fixed assets 0.2 0.1 +0.1 0.4 0.3 +0.1
Sale (Purchase) of short-term investments, net (40.6) 36.0 -76.6 (12.3) 86.9 -99.2
Sales of investments, loans and others 1.8 (7.5) +9.3 1.7 (12.5) +14.2
Net Cash Provided by (Used in) Investing Activities (II) (74.2) 18.3 -92.5 (59.8) 31.9 -91.7
Proceeds (Repayment) of short term and long term debt 338.5 (14.0) +352.5 338.5 (14.0) +352.5
Repurchase of common stock - (71.9) +71.9 - (71.9) +71.9
Proceeds from exercise of stock-options 8.3 41.5 -33.2 21.6 74.2 -52.6
Cash dividend paid (31.6) (86.5) +54.9 (31.6) (86.5) +54.9
Net Cash Provided by (Used in) Financing Activities (III) 315.2 (130.9) +446.1 328.5 (98.2) +426.7
Effect of exchange rate changes on cash and cash
equivalents (IV) (24.5) 42.8 -67.3 (2.6) 19.5 -22.1
Increase (Decrease) in Cash (V) = (I)+(II)+(III)+(IV) 384.8 118.3 +266.5 619.4 307.0 +312.4
Cash and cash equivalents at Beginning of Period 1,393.9 1,343.0 1,159.3 1,154.3
Cash and cash equivalents at End of Period 1,778.7 1,461.3 1,778.7 1,461.3
67
3DS
.CO
M ©
Das
saul
t Sys
tèm
es
| Q2
2013
Ear
ning
s P
rese
ntat
ion
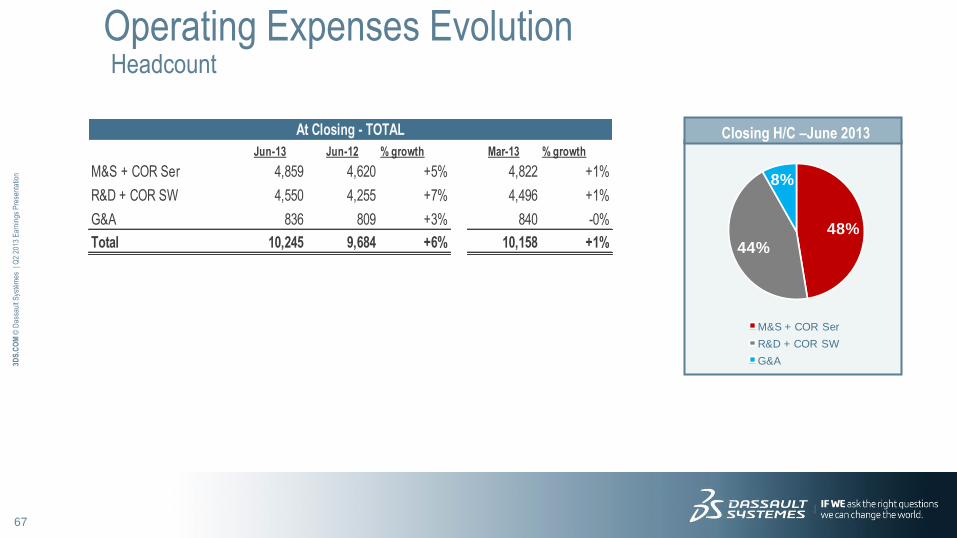
Operating Expenses Evolution Headcount
Closing H/C –June 2013
48%
44%
8%
M&S + COR Ser
R&D + COR SW
G&A
At Closing - TOTAL
Jun-13 Jun-12 % growth Mar-13 % growth
M&S + COR Ser 4,859 4,620 +5% 4,822 +1%
R&D + COR SW 4,550 4,255 +7% 4,496 +1%
G&A 836 809 +3% 840 -0%
Total 10,245 9,684 +6% 10,158 +1%
68
3DS
.CO
M ©
Das
saul
t Sys
tèm
es
| Q2
2013
Ear
ning
s P
rese
ntat
ion
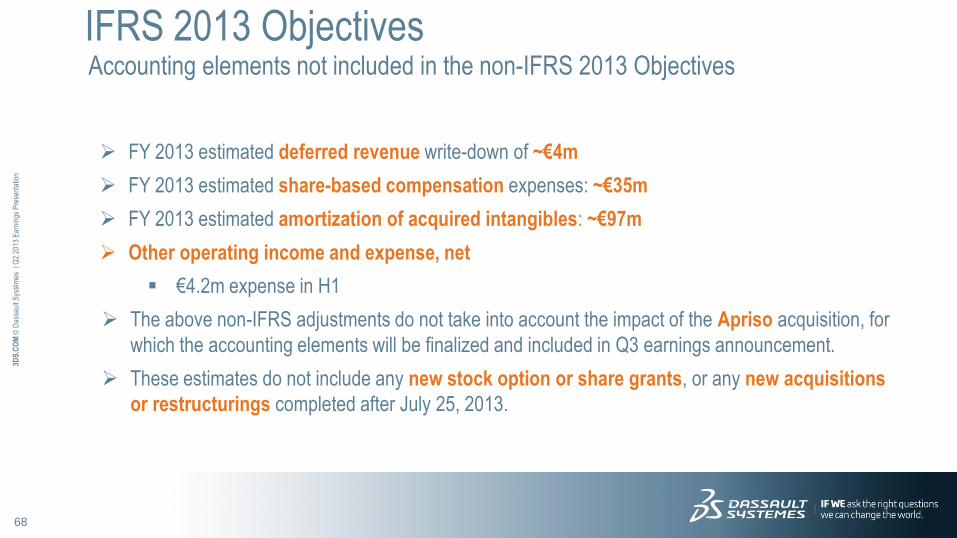
FY 2013 estimated deferred revenue write-down of ~€4m
FY 2013 estimated share-based compensation expenses: ~€35m
FY 2013 estimated amortization of acquired intangibles: ~€97m
Other operating income and expense, net
€4.2m expense in H1
The above non-IFRS adjustments do not take into account the impact of the Apriso acquisition, for
which the accounting elements will be finalized and included in Q3 earnings announcement.
These estimates do not include any new stock option or share grants, or any new acquisitions
or restructurings completed after July 25, 2013.
IFRS 2013 Objectives Accounting elements not included in the non-IFRS 2013 Objectives
69
3DS
.CO
M ©
Das
saul
t Sys
tèm
es
| Q2
2013
Ear
ning
s P
rese
ntat
ion