Embed Size (px)
DESCRIPTION
http://tk-development.com/Files/Filer/Fondsboers/2013%20UK/Q1_Announcement_2013.pdf
Citation preview
I N T E R I M R E P O R T Q 1
TK DEvElOPMENT A/S | CvR NO. 24256782
COMPANY ANNOUNCEMENT NO. 16/2013 | 21 JUNE 2013
2013/14
IllUSTRATION:
BARKARBY GATE, RETAIL PARK
Stockholm, Sweden
2 / 3 4 | T k D e v e lo pm e n T A / S | I n T e r I m r e p o rT Q 1 2 0 1 3 / 1 4 | TA B L E o f co n T E n Ts
TA b l E O f C O N T E N T S
3 Summary
5 Consolidated financial highlights and key ratios
6 results in Q1 2013/14 and outlook for 2013/14
12 market conditions
13 property development
17 Asset management
22 Discontinuing activities
23 other matters
24 Statement by the Board of Directors and executive Board on the Interim report
25 Consolidated financial statements
34 Company information
page
s u m m A RY | I n T e r I m r e p o rT Q 1 2 0 1 3 / 1 4 | T k D e v e lo pm e n T A / S | 3 / 3 4
S U M M A R Y
R E s u LT s fo R T h E f I R s T q u A RT E R o f 2 0 1 3 / 1 4
Tk Development’s results for the first quarter of 2013/14
amounted to Dkk -19.0 million before tax, compared to Dkk
-6.9 million in the same period the year before. The results
after tax amounted to Dkk -16.2 million against Dkk -154.9
million in the same period the year before.
The balance sheet total amounted to Dkk 3,957.9 million
at 30 April 2013 against Dkk 4,009.3 million at 31 January
2013. Consolidated equity totalled Dkk 1,370.9 million, and
the solvency ratio stood at 34.6 %.
Cash flows for the period amounted to Dkk -4.5 million
against Dkk -12.9 million in the same period the year before.
net interest-bearing debt amounted to Dkk 2,195.7 million
at 30 April 2013 against Dkk 2,206.1 million at 31 January
2013.
P R o P E RT Y D E V E Lo Pm E n T
In the municipality of Danderyd near Stockholm, Tk Devel-
opment handed over the first 13,000 m² phase of a retail
park to an investor in 2010/11. Construction of the second
phase of about 1,800 m² was completed in march 2013, and
the retail park was handed over to the investor in the first
quarter of 2013/14. The total project has been sold to the
German investment fund Commerz real on the basis of for-
ward funding.
In January 2013, construction of the first phase of 7,850 m²,
a total of 136 units, of Tk Development’s residential project
in Bielany, Warsaw, poland, was completed. The first units
were handed over to the buyers in February 2013 and 50 %
of all units were handed over in the first quarter of 2013/14.
In total, 76 % of the first-phase units have been sold.
After the reporting date, Tk Development has sold a 20,000
m² retail park project in Barkarby, Stockholm, Sweden, to a
fund managed by Cordea Savills. The sale is based on for-
ward funding. 73 % of the project premises have been let.
The option to purchase land for the project will be exercised
simultaneously with construction startup, scheduled for Au-
gust 2013. earnings from the sale are expected to be recog-
nized in the 2014/15 financial year.
The Group’s project portfolio in the property development
area comprised 456,000 m² at 30 April 2013 (31 January
2013: 452,000 m²).
A s s E T m A n A G E m E n T
The total portfolio of own properties under asset manage-
ment, which thus generates cash flow, comprised 138,250
m² and amounted to Dkk 1,938.7 million at 30 April 2013,
of which investment properties accounted for Dkk 314.0
million. The annual net rent from the current leases corre-
sponds to a return on the carrying amount of 6.7 %. Based
on full occupancy, the return on the carrying amount is ex-
pected to reach 7.9 %.
The operation of these properties is generally proceeding
satisfactorily, and overall the footfall and revenue in the
centres are developing positively.
m A R K E T c o n D I T I o n s
In management’s opinion, the market conditions have not
changed appreciably during the past months.
The main challenge currently facing the property sector is
the difficult access to financing. Uncertainty on the inter-
national financial markets continues to adversely affect the
property sector, leading to consistently long decision-mak-
ing processes among financing sources, tenants and inves-
tors alike.
The Group will make the startup of major new projects con-
tingent on obtaining either full or partial financing for them
and on freeing up cash resources from the sale of several
major completed projects.
f I n A n c I A L I s s u E s
At the Company’s Annual General meeting on 22 may 2013,
the Board of Directors was authorized to carry out a capital
increase with gross proceeds of about Dkk 210-231 million.
The capital increase will help generate the cash resources
required to underpin future operations and project flow, and
thus long-term earnings. The capital increase has been dis-
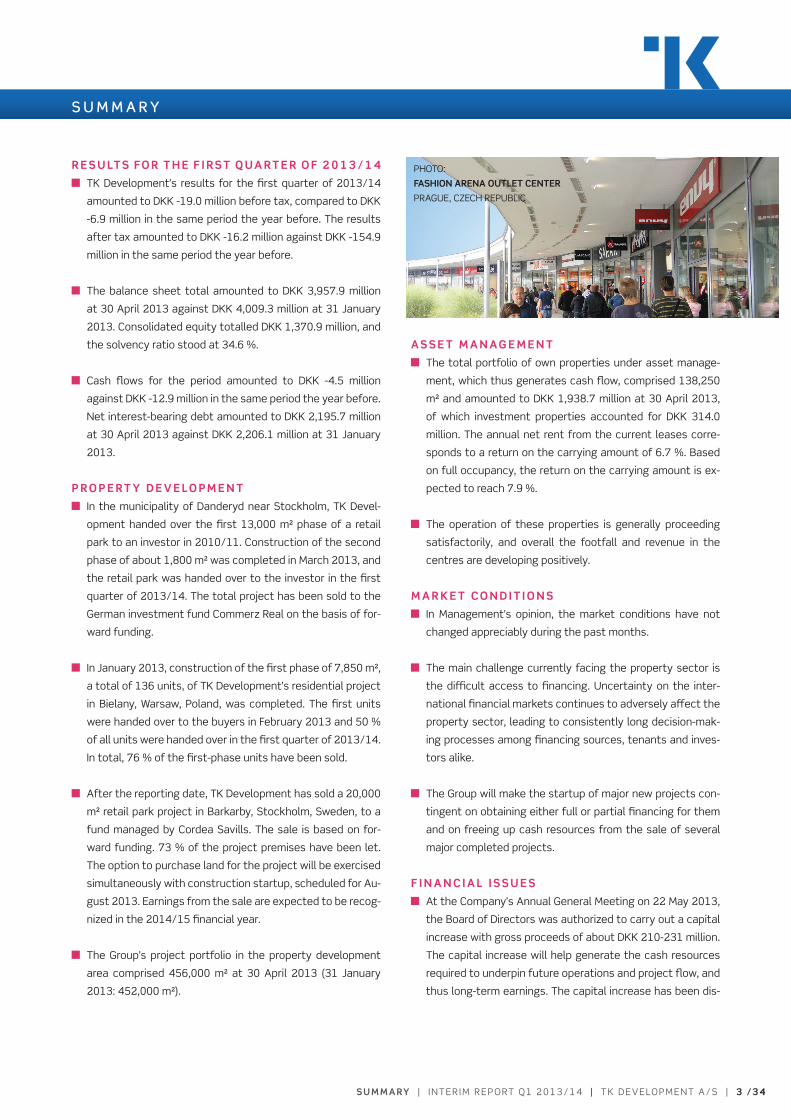
pHoTo:
fAshIon AREnA ouTLET cEnTER
prAGUe, CZeCH repUBlIC
4 / 3 4 | T k D e v e lo pm e n T A / S | I n T e r I m r e p o rT Q 1 2 0 1 3 / 1 4 | s u m m A RY
S U M M A R Y
cussed with the Group’s major shareholders, who, together
with a few major private and institutional investors, have giv-
en conditional subscription and underwriting commitments
for the total capital increase.
The Board of Directors has appointed nordea Bank Danmark
A/S to be the manager of the offering. The more specific
terms and conditions governing the capital increase have
not yet been determined. The prospectus currently being
prepared will set out the detailed terms and conditions of
the capital increase. Tk Development expects to publish the
prospectus in the first half of August 2013 and expects the
capital increase to be completed in early September 2013.
A substantial portion of the proceeds from the capital in-
crease will be used to reduce the debt to credit institutions,
including project finance loans of Dkk 68.5 million granted
by a number of the Company’s major shareholders and mem-
bers of management.
Tk Development has a general agreement with the Group’s
main banker about both operating and projects credits. Af-
ter the reporting date, the agreement has been extended
for a two-year period, subject to the condition that the op-
erating credit limit is reduced by Dkk 73.5 million when the
forthcoming capital increase has been implemented, at the
latest.
During and after the period under review, Tk Development
has concluded agreements regarding the refinancing of proj-
ect credits worth Dkk 1.2 billion out of the Dkk 1.5 billion
due to mature in 2013/14 as of 31 January 2013. The most
significant project credit of those refinanced after the re-
porting date has been extended by two years, subject to the
condition that the credit is reduced by Dkk 50 million when
the forthcoming capital increase has been implemented, at
the latest.
now that the above-mentioned refinancing agreements
are in place, credits of Dkk 0.3 billion are due to mature in
2013/14. The Group is in ongoing dialogue with the relevant
credit institutions, and management anticipates being able
to either prolong or otherwise refinance project credits that
have not been prematurely repaid upon project sales.
o u T Lo o K fo R 2 0 1 3 / 1 4
management anticipates positive results before tax for the
continuing activities for the 2013/14 financial year. The
timing and progress of the phase-out of the discontinuing
activities are subject to major uncertainty, and the results
of these activities are therefore not included in the outlook
for the 2013/14 financial year.
As mentioned previously, management has revised the sales
strategy for the Group’s projects and chosen to accept re-
duced prices for selected project sales. Thus, management
considers it important for the Group to sell some of its com-
pleted projects and plots of land in the 2013/14 financial
year.
The expectations mentioned in this Interim Report, including
earnings expectations, are naturally subject to risks and un-
certainties, which may result in deviations from the expected
results. various factors may impact on expectations, as out-
lined in the section “Risk issues” in the Group’s Annual Report
for 2012/13, particularly the valuation of the Group’s project
portfolio.
co n s o L I DAT E D f I n A n c I A L h I G h L I G h Ts A n D K E Y R AT I os | I n T e r I m r e p o rT Q 1 2 0 1 3 / 1 4 | T k D e v e lo pm e n T A / S | 5 / 3 4
C O N S O l I D AT E D f I N A N C I A l h I G h l I G h T S A N D K E Y R AT I O S
DkkmQ1
2013/14Q1
2012/13Full year
2012/13
f I n A n c I A L h I G h L I G h T s :
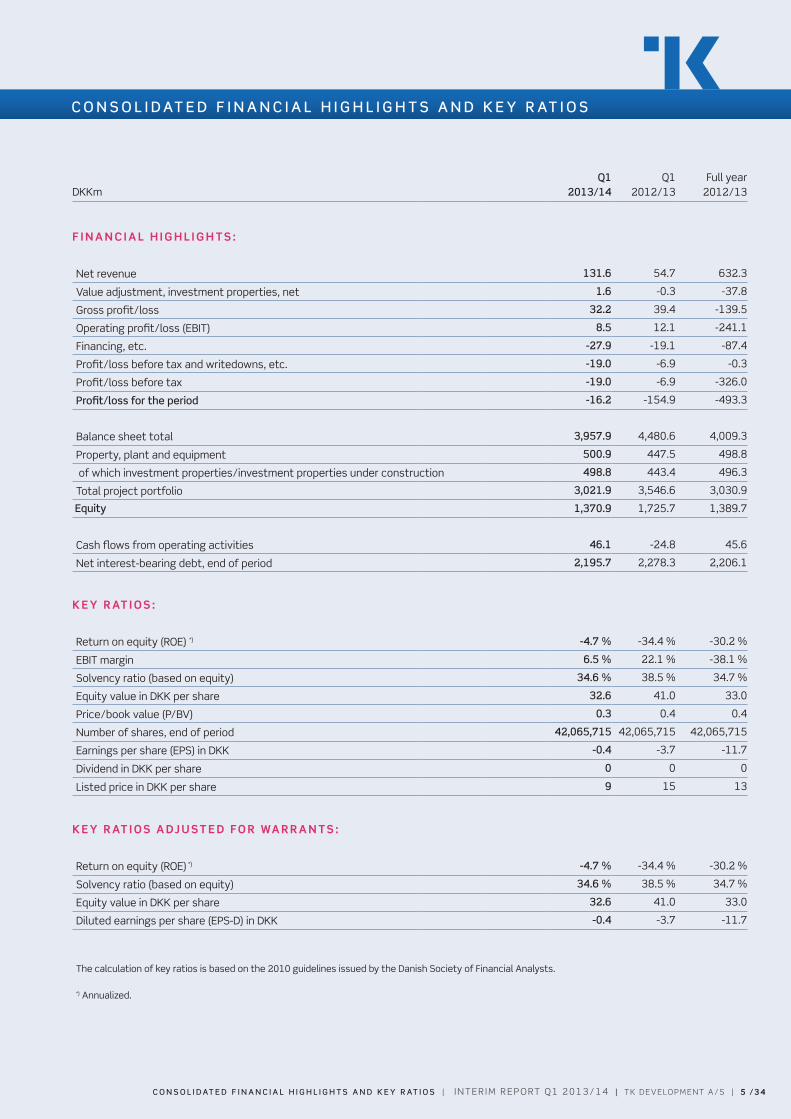
net revenue 131.6 54.7 632.3
value adjustment, investment properties, net 1.6 -0.3 -37.8
Gross profit/loss 32.2 39.4 -139.5
operating profit/loss (eBIT) 8.5 12.1 -241.1
Financing, etc. -27.9 -19.1 -87.4
profit/loss before tax and writedowns, etc. -19.0 -6.9 -0.3
profit/loss before tax -19.0 -6.9 -326.0
Profit/loss for the period -16.2 -154.9 -493.3
Balance sheet total 3,957.9 4,480.6 4,009.3
property, plant and equipment 500.9 447.5 498.8
of which investment properties/investment properties under construction 498.8 443.4 496.3
Total project portfolio 3,021.9 3,546.6 3,030.9
Equity 1,370.9 1,725.7 1,389.7
Cash flows from operating activities 46.1 -24.8 45.6
net interest-bearing debt, end of period 2,195.7 2,278.3 2,206.1
K E Y R AT I o s :
return on equity (roe) *) -4.7 % -34.4 % -30.2 %
eBIT margin 6.5 % 22.1 % -38.1 %
Solvency ratio (based on equity) 34.6 % 38.5 % 34.7 %
equity value in Dkk per share 32.6 41.0 33.0
price/book value (p/Bv) 0.3 0.4 0.4
number of shares, end of period 42,065,715 42,065,715 42,065,715
earnings per share (epS) in Dkk -0.4 -3.7 -11.7
Dividend in Dkk per share 0 0 0
listed price in Dkk per share 9 15 13
K E Y R AT I o s A Dj u s T E D fo R wA R R A n T s :
return on equity (roe) *) -4.7 % -34.4 % -30.2 %
Solvency ratio (based on equity) 34.6 % 38.5 % 34.7 %
equity value in Dkk per share 32.6 41.0 33.0
Diluted earnings per share (epS-D) in Dkk -0.4 -3.7 -11.7
The calculation of key ratios is based on the 2010 guidelines issued by the Danish Society of Financial Analysts. *) Annualized.
C O N S O l I D AT E D f I N A N C I A l h I G h l I G h T S A N D K E Y R AT I O S | I n T e r I m r e p o rT Q 1 2 0 1 3 / 1 4 | T k D e v e lo pm e n T A / S | 5 / 3 4
6 / 3 4 | T k D e v e lo pm e n T A / S | I n T e r I m r e p o rT Q 1 2 0 1 3 / 1 4 | m A n AG E m E n T com m E n TA RY
Tk Development’s results for the first quarter of 2013/14
amounted to Dkk -19.0 million before tax, compared to Dkk
-6.9 million in the same period the year before. The results after
tax amounted to Dkk -16.2 million against Dkk -154.9 million in
the same period the year before.
The balance sheet total amounted to Dkk 3,957.9 million at 30
April 2013 against Dkk 4,009.3 million at 31 January 2013. Con-
solidated equity totalled Dkk 1,370.9 million, and the solvency
ratio stood at 34.6 %.
The results for Q1 2013/14 and the balance sheet at 30 April
2013, broken down by business segment, appear from the ta-
bles below.
The activities within each individual business segment are de-
scribed in more detail on pages 13-22.
The property development segment is described on pages
13-16. The description includes information about the
development potential of Tk Development’s project portfolio,
including an outline of the individual development projects.
The asset management segment is described on pages
17-21. The description contains information about Tk
Development’s own properties under asset management, in-
cluding an outline of the operation and customer influx for the
individual projects.
The discontinuing activities are described on page 22, which
provides more details about Tk Development’s properties and
projects in the countries where management has decided to
phase out activities.
Therefore, the financial review below contains a description of
the results and balance sheet total at group level only.
A c c o u n T I n G P o L I c I E s
The Interim report is presented in accordance with IAS 34, In-
terim Financial reporting, as adopted by the eU, and Danish dis-
closure requirements for listed companies.
The Interim report has been presented in accordance with
the financial reporting standards (IFrS/IAS) and IFrIC interpre-
tations applicable for financial years beginning at 1 February
2013.
The implementation of new and amended financial reporting
standards and interpretations that have entered into force as
of the 2013/14 financial year has not impacted recognition and
measurement in the consolidated financial statements and
thus has no effect on the earnings per share and the diluted
earnings per share.
In march 2013, the Board of Directors decided to change the
internal reporting procedure. In this connection, the segment
definition has been revised, and segments are now divided into
property development activities, asset management activi-
ties and discontinuing activities. The comparative figures have
been restated accordingly.
The accounting policies have been applied consistently with
those presented in the Annual report for 2012/13. reference
is made to the Annual report for a complete description of the
R E S U lT S I N Q 1 2 0 1 3 / 1 4 A N D O U T l O O K f O R 2 0 1 3 / 1 4
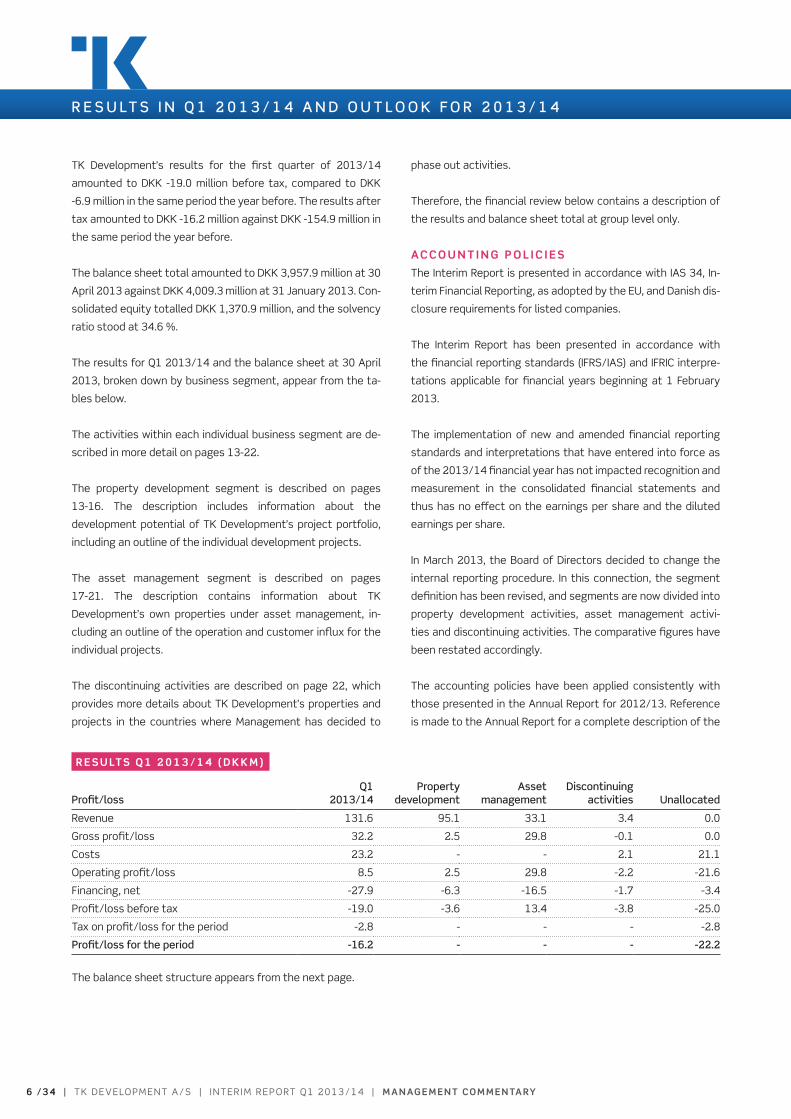
R E s u LT s q 1 2 0 1 3 / 1 4 ( D K K m )
Profit/lossQ1
2013/14Property
developmentAsset
managementDiscontinuing
activities Unallocated
revenue 131.6 95.1 33.1 3.4 0.0
Gross profit/loss 32.2 2.5 29.8 -0.1 0.0
Costs 23.2 - - 2.1 21.1
operating profit/loss 8.5 2.5 29.8 -2.2 -21.6
Financing, net -27.9 -6.3 -16.5 -1.7 -3.4
profit/loss before tax -19.0 -3.6 13.4 -3.8 -25.0
Tax on profit/loss for the period -2.8 - - - -2.8
Profit/loss for the period -16.2 - - - -22.2
The balance sheet structure appears from the next page.
m A n AG E m E n T com m E n TA RY | I n T e r I m r e p o rT Q 1 2 0 1 3 / 1 4 | T k D e v e lo pm e n T A / S | 7 / 3 4
Group’s accounting policies.
no interim financial statements have been prepared for the
parent Company. The Interim report is presented in Dkk, which
is the presentation currency for the Group’s activities and the
functional currency of the parent Company. The Interim report
has not been audited or reviewed by the Company’s auditors.
Ac c o u n T I n G E s T I m AT E s A n D j u D G m E n T s
The most significant accounting estimates and judgments
made by management in applying the Group’s accounting pol-
icies, and the associated, estimated material uncertainty, are
the same as those made in the preparation of the Annual re-
port for 2012/13. For a more detailed description, reference is
therefore made to the Annual report.
I n c o m E s TAT E m E n T
Revenue
The revenue for the period under review totalled Dkk 131.6 mil-
lion against Dkk 54.7 million in Q1 2012/13.
The revenue stems from the sale of projects, rental and fee in-
come, etc.
overview of handed-over projects
q1 2013/14
Retail park, Enebyängen, Danderyd, Sweden
In the municipality of Danderyd near Stockholm, Tk Develop-
ment handed over the first 13,000 m² phase of the retail park
to an investor in 2010/11. Construction of the second phase
of about 1,800 m² was completed in march 2013, and the re-
tail park was handed over to the investor in the first quarter of
2013/14. The second phase is fully let and tenanted by plan-
tagen (2012/13: 100 %). The total project has been sold to the
German investment fund Commerz real on the basis of forward
funding.
Residential park, bielany, Warsaw, Poland
Construction of the first phase of 7,850 m², a total of 136 units,
was completed in January 2013, and the first units were hand-
ed over to the buyers in February 2013. A total of 76 % of the
units have been sold (2012/13: 69 %), with 50 % being handed
over to the buyers in Q1 2013/14. The residential units are be-
ing sold as owner-occupied apartments to private users.
R E S U lT S I N Q 1 2 0 1 3 / 1 4 A N D O U T l O O K f O R 2 0 1 3 / 1 4
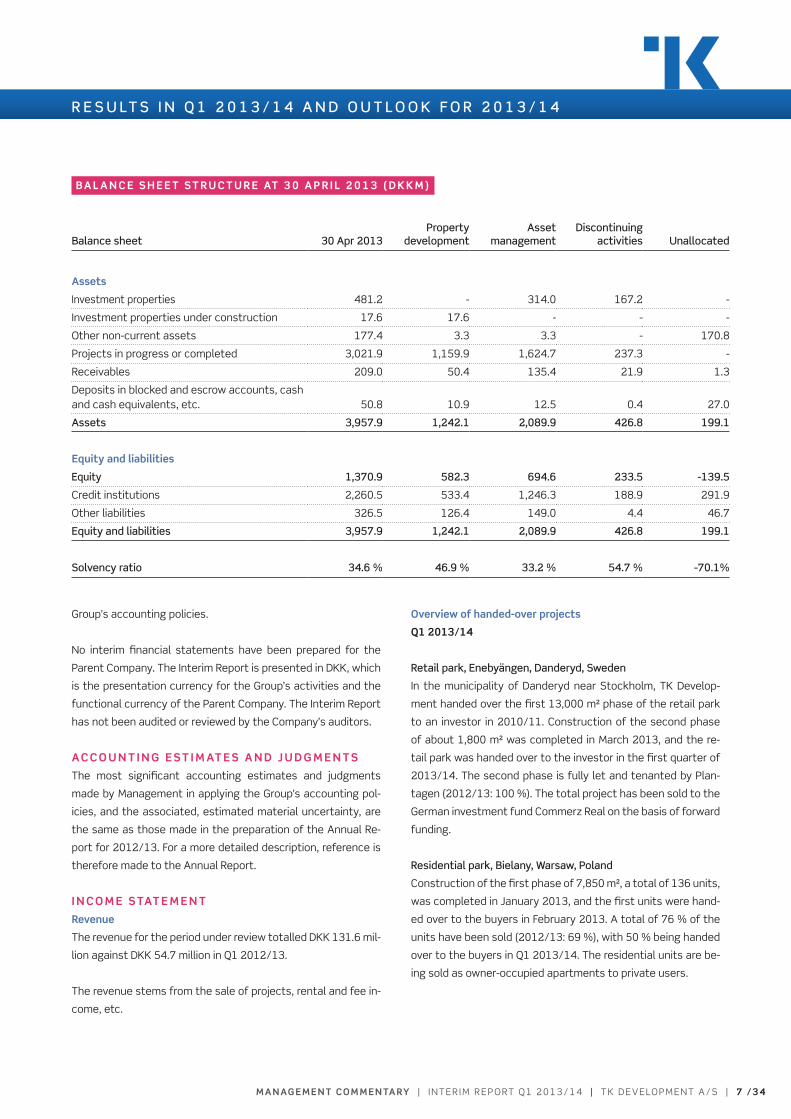
B A L A n c E s h E E T s T R u c T u R E AT 3 0 A P R I L 2 0 1 3 ( D K K m )
balance sheet 30 Apr 2013Property
developmentAsset
managementDiscontinuing
activities Unallocated
Assets
Investment properties 481.2 - 314.0 167.2 -
Investment properties under construction 17.6 17.6 - - -
other non-current assets 177.4 3.3 3.3 - 170.8
projects in progress or completed 3,021.9 1,159.9 1,624.7 237.3 -
receivables 209.0 50.4 135.4 21.9 1.3
Deposits in blocked and escrow accounts, cash and cash equivalents, etc. 50.8 10.9 12.5 0.4 27.0
Assets 3,957.9 1,242.1 2,089.9 426.8 199.1
Equity and liabilities
Equity 1,370.9 582.3 694.6 233.5 -139.5
Credit institutions 2,260.5 533.4 1,246.3 188.9 291.9
other liabilities 326.5 126.4 149.0 4.4 46.7
Equity and liabilities 3,957.9 1,242.1 2,089.9 426.8 199.1
Solvency ratio 34.6 % 46.9 % 33.2 % 54.7 % -70.1%
8 / 3 4 | T k D e v e lo pm e n T A / S | I n T e r I m r e p o rT Q 1 2 0 1 3 / 1 4 | m A n AG E m E n T com m E n TA RY
R E S U lT S I N Q 1 2 0 1 3 / 1 4 A N D O U T l O O K f O R 2 0 1 3 / 1 4
Gross margin
The gross margin for Q1 2013/14 amounted to Dkk 32.2 million
against Dkk 39.4 million in Q1 2012/13. The gross margin de-
rives from the operation of completed projects, the operation
and value adjustment of the Group’s investment properties and
profits on handed-over projects.
The value adjustment of the Group’s investment properties
amounted to Dkk 1.6 million against Dkk -0.3 million in Q1
2012/13.
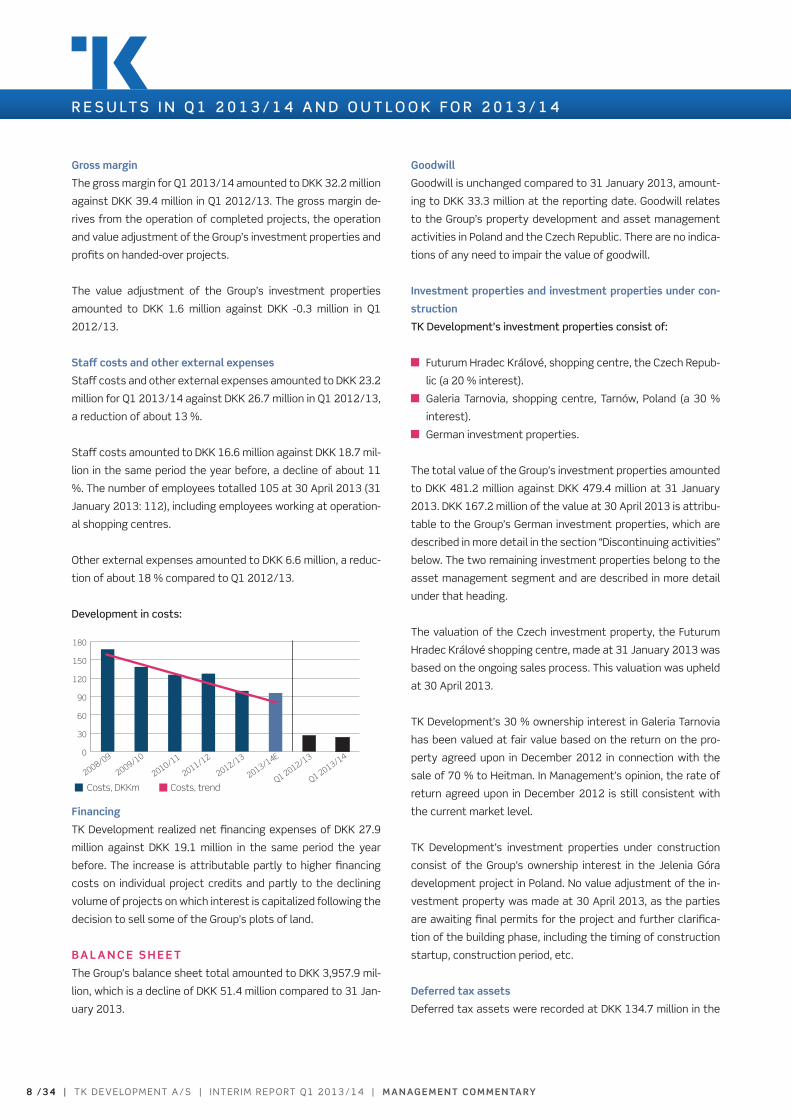
staff costs and other external expenses
Staff costs and other external expenses amounted to Dkk 23.2
million for Q1 2013/14 against Dkk 26.7 million in Q1 2012/13,
a reduction of about 13 %.
Staff costs amounted to Dkk 16.6 million against Dkk 18.7 mil-
lion in the same period the year before, a decline of about 11
%. The number of employees totalled 105 at 30 April 2013 (31
January 2013: 112), including employees working at operation-
al shopping centres.
other external expenses amounted to Dkk 6.6 million, a reduc-
tion of about 18 % compared to Q1 2012/13.
Development in costs:
Costs, DKKm Costs, trend
0
30
60
90
120
150
180
Q1 2013/14
Q1 2012/13
2013/14E
2012/13
2011/12
2010/11
2009/10
2008/09
financing
Tk Development realized net financing expenses of Dkk 27.9
million against Dkk 19.1 million in the same period the year
before. The increase is attributable partly to higher financing
costs on individual project credits and partly to the declining
volume of projects on which interest is capitalized following the
decision to sell some of the Group’s plots of land.
B A L A n c E s h E E T
The Group’s balance sheet total amounted to Dkk 3,957.9 mil-
lion, which is a decline of Dkk 51.4 million compared to 31 Jan-
uary 2013.
Goodwill
Goodwill is unchanged compared to 31 January 2013, amount-
ing to Dkk 33.3 million at the reporting date. Goodwill relates
to the Group’s property development and asset management
activities in poland and the Czech republic. There are no indica-
tions of any need to impair the value of goodwill.
Investment properties and investment properties under con-
struction
TK Development’s investment properties consist of:
Futurum Hradec králové, shopping centre, the Czech repub-
lic (a 20 % interest).
Galeria Tarnovia, shopping centre, Tarnów, poland (a 30 %
interest).
German investment properties.
The total value of the Group’s investment properties amounted
to Dkk 481.2 million against Dkk 479.4 million at 31 January
2013. Dkk 167.2 million of the value at 30 April 2013 is attribu-
table to the Group’s German investment properties, which are
described in more detail in the section “Discontinuing activities”
below. The two remaining investment properties belong to the
asset management segment and are described in more detail
under that heading.
The valuation of the Czech investment property, the Futurum
Hradec králové shopping centre, made at 31 January 2013 was
based on the ongoing sales process. This valuation was upheld
at 30 April 2013.
Tk Development’s 30 % ownership interest in Galeria Tarnovia
has been valued at fair value based on the return on the pro-
perty agreed upon in December 2012 in connection with the
sale of 70 % to Heitman. In management’s opinion, the rate of
return agreed upon in December 2012 is still consistent with
the current market level.
Tk Development’s investment properties under construction
consist of the Group’s ownership interest in the Jelenia Góra
development project in poland. no value adjustment of the in-
vestment property was made at 30 April 2013, as the parties
are awaiting final permits for the project and further clarifica-
tion of the building phase, including the timing of construction
startup, construction period, etc.
Deferred tax assets
Deferred tax assets were recorded at Dkk 134.7 million in the
m A n AG E m E n T com m E n TA RY | I n T e r I m r e p o rT Q 1 2 0 1 3 / 1 4 | T k D e v e lo pm e n T A / S | 9 / 3 4
balance sheet against Dkk 127.0 million at 31 January 2013.
The valuation of the tax assets is based on existing budgets
and profit forecasts for a five-year period. For the first three
years, budgets are based on an evaluation of specific projects
in the Group’s project portfolio. The valuation for the next two
years is based on specific projects in the project portfolio with
a longer time horizon than three years as well as various project
opportunities.
Due to the substantial uncertainties attaching to these val-
uations, provisions have been made for the risk that projects
are postponed or not implemented and the risk that project
profits fall below expectations. A change in the conditions and
assumptions for budgets and profit forecasts, including time
estimates, could result in the value of the tax assets being low-
er than that computed at 30 April 2013, which could have an
adverse effect on the Group’s results of operations and finan-
cial position.
Project portfolio
The total project portfolio came to Dkk 3,021.9 million against
Dkk 3,030.9 million at 31 January 2013. The decline is a com-
bined result of an increase in the Group’s portfolio of ongoing
projects and a decrease due to the sale of projects.
Total prepayments based on forward-funding agreements
were Dkk 330.3 million at 31 January 2013, compared to
Dkk 369.6 million at 31 January 2013. Forward funding de-
creased due to the handover of projects to investors in Q1
2013/14. At 30 April 2013, forward funding represented 94.8
% of the gross carrying amount of sold projects.
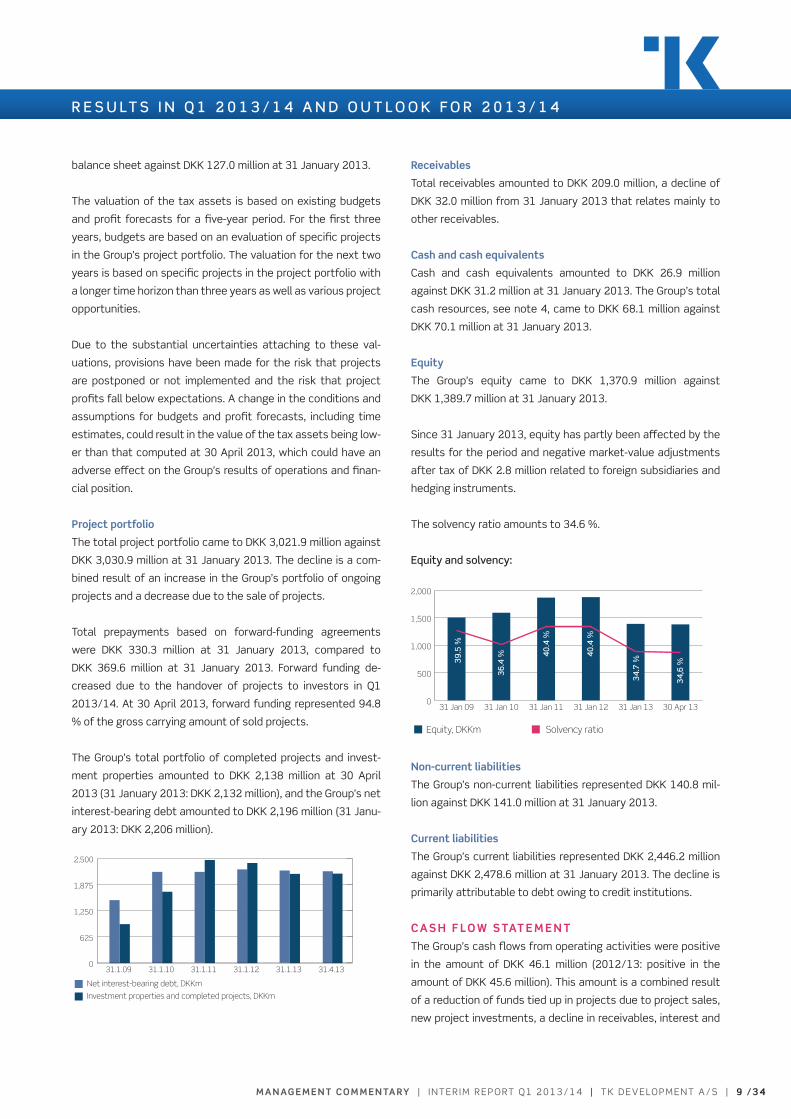
The Group’s total portfolio of completed projects and invest-
ment properties amounted to Dkk 2,138 million at 30 April
2013 (31 January 2013: Dkk 2,132 million), and the Group’s net
interest-bearing debt amounted to Dkk 2,196 million (31 Janu-
ary 2013: Dkk 2,206 million).
Net interest-bearing debt, DKKm
0
625
1,250
1,875
2,500
31.4.1331.1.1331.1.1231.1.1131.1.1031.1.09
Investment properties and completed projects, DKKm
Receivables
Total receivables amounted to Dkk 209.0 million, a decline of
Dkk 32.0 million from 31 January 2013 that relates mainly to
other receivables.
cash and cash equivalents
Cash and cash equivalents amounted to Dkk 26.9 million
against Dkk 31.2 million at 31 January 2013. The Group’s total
cash resources, see note 4, came to Dkk 68.1 million against
Dkk 70.1 million at 31 January 2013.
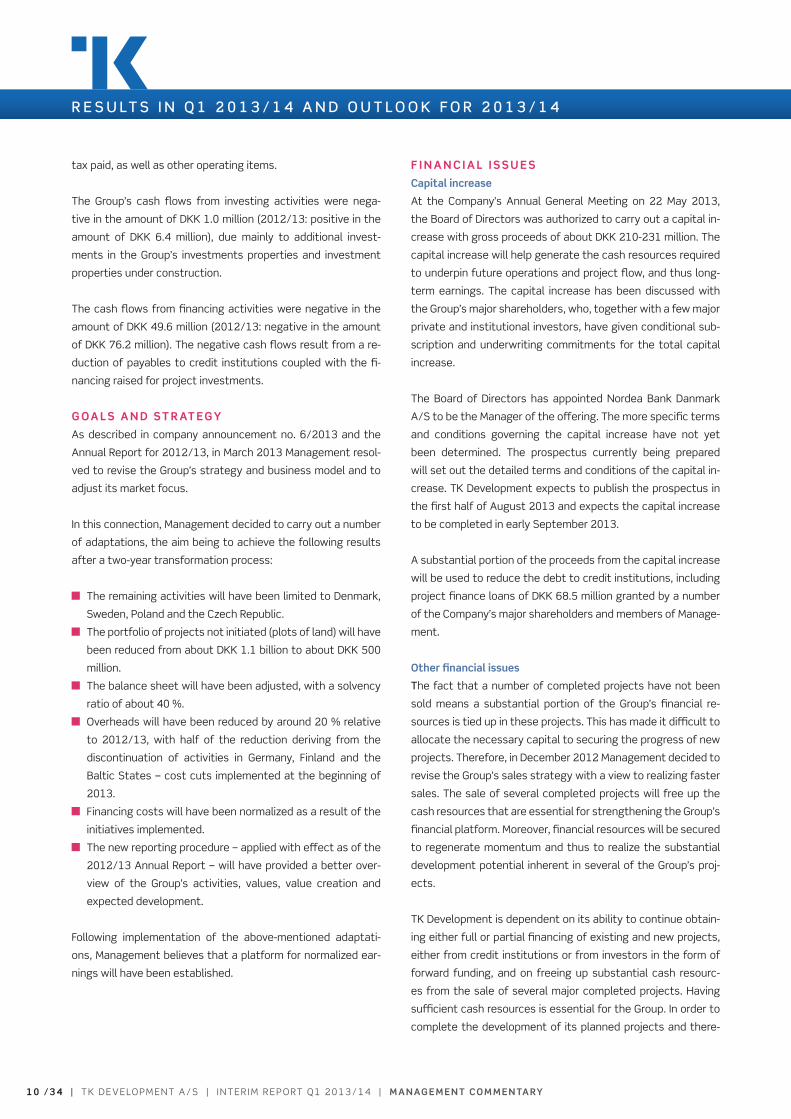
Equity
The Group’s equity came to Dkk 1,370.9 million against
Dkk 1,389.7 million at 31 January 2013.
Since 31 January 2013, equity has partly been affected by the
results for the period and negative market-value adjustments
after tax of Dkk 2.8 million related to foreign subsidiaries and
hedging instruments.
The solvency ratio amounts to 34.6 %.
Equity and solvency:
Equity, DKKm Solvency ratio
0
500
1,000
1,500
2,000
30 Apr 1331 Jan 1331 Jan 1231 Jan 1131 Jan 1031 Jan 09
59 %
39.5
%
36.4
% 40.4
%
40.4
%
34.7
%
34,6
%
non-current liabilities
The Group’s non-current liabilities represented Dkk 140.8 mil-
lion against Dkk 141.0 million at 31 January 2013.
current liabilities
The Group’s current liabilities represented Dkk 2,446.2 million
against Dkk 2,478.6 million at 31 January 2013. The decline is
primarily attributable to debt owing to credit institutions.
cA s h f Lo w s TAT E m E n T
The Group’s cash flows from operating activities were positive
in the amount of Dkk 46.1 million (2012/13: positive in the
amount of Dkk 45.6 million). This amount is a combined result
of a reduction of funds tied up in projects due to project sales,
new project investments, a decline in receivables, interest and
R E S U lT S I N Q 1 2 0 1 3 / 1 4 A N D O U T l O O K f O R 2 0 1 3 / 1 4
1 0 / 3 4 | T k D e v e lo pm e n T A / S | I n T e r I m r e p o rT Q 1 2 0 1 3 / 1 4 | m A n AG E m E n T com m E n TA RY
tax paid, as well as other operating items.
The Group’s cash flows from investing activities were nega-
tive in the amount of Dkk 1.0 million (2012/13: positive in the
amount of Dkk 6.4 million), due mainly to additional invest-
ments in the Group’s investments properties and investment
properties under construction.
The cash flows from financing activities were negative in the
amount of Dkk 49.6 million (2012/13: negative in the amount
of Dkk 76.2 million). The negative cash flows result from a re-
duction of payables to credit institutions coupled with the fi-
nancing raised for project investments.
G oA L s A n D s T R AT EGY
As described in company announcement no. 6/2013 and the
Annual report for 2012/13, in march 2013 management resol-
ved to revise the Group’s strategy and business model and to
adjust its market focus.
In this connection, management decided to carry out a number
of adaptations, the aim being to achieve the following results
after a two-year transformation process:
The remaining activities will have been limited to Denmark,
Sweden, poland and the Czech republic.
The portfolio of projects not initiated (plots of land) will have
been reduced from about Dkk 1.1 billion to about Dkk 500
million.
The balance sheet will have been adjusted, with a solvency
ratio of about 40 %.
overheads will have been reduced by around 20 % relative
to 2012/13, with half of the reduction deriving from the
discontinuation of activities in Germany, Finland and the
Baltic States – cost cuts implemented at the beginning of
2013.
Financing costs will have been normalized as a result of the
initiatives implemented.
The new reporting procedure – applied with effect as of the
2012/13 Annual report – will have provided a better over-
view of the Group’s activities, values, value creation and
expected development.
Following implementation of the above-mentioned adaptati-
ons, management believes that a platform for normalized ear-
nings will have been established.
f I n A n c I A L I s s u E s
capital increase
At the Company’s Annual General meeting on 22 may 2013,
the Board of Directors was authorized to carry out a capital in-
crease with gross proceeds of about Dkk 210-231 million. The
capital increase will help generate the cash resources required
to underpin future operations and project flow, and thus long-
term earnings. The capital increase has been discussed with
the Group’s major shareholders, who, together with a few major
private and institutional investors, have given conditional sub-
scription and underwriting commitments for the total capital
increase.
The Board of Directors has appointed nordea Bank Danmark
A/S to be the manager of the offering. The more specific terms
and conditions governing the capital increase have not yet
been determined. The prospectus currently being prepared
will set out the detailed terms and conditions of the capital in-
crease. Tk Development expects to publish the prospectus in
the first half of August 2013 and expects the capital increase
to be completed in early September 2013.
A substantial portion of the proceeds from the capital increase
will be used to reduce the debt to credit institutions, including
project finance loans of Dkk 68.5 million granted by a number
of the Company’s major shareholders and members of manage-
ment.
other financial issues
The fact that a number of completed projects have not been
sold means a substantial portion of the Group’s financial re-
sources is tied up in these projects. This has made it difficult to
allocate the necessary capital to securing the progress of new
projects. Therefore, in December 2012 management decided to
revise the Group’s sales strategy with a view to realizing faster
sales. The sale of several completed projects will free up the
cash resources that are essential for strengthening the Group’s
financial platform. moreover, financial resources will be secured
to regenerate momentum and thus to realize the substantial
development potential inherent in several of the Group’s proj-
ects.
Tk Development is dependent on its ability to continue obtain-
ing either full or partial financing of existing and new projects,
either from credit institutions or from investors in the form of
forward funding, and on freeing up substantial cash resourc-
es from the sale of several major completed projects. Having
sufficient cash resources is essential for the Group. In order to
complete the development of its planned projects and there-
R E S U lT S I N Q 1 2 0 1 3 / 1 4 A N D O U T l O O K f O R 2 0 1 3 / 1 4
m A n AG E m E n T com m E n TA RY | I n T e r I m r e p o rT Q 1 2 0 1 3 / 1 4 | T k D e v e lo pm e n T A / S | 1 1 / 3 4
by achieve the expected results, the Group must have or must
be able to procure sufficient cash resources to cover the costs
and deposits required for the projects, the capacity costs and
other obligations.
Tk Development has a general agreement with the Group’s
main banker about both operating and project credits. After the
reporting date, the agreement has been extended for a two-
year period, subject to the condition that the operating credit
limit is reduced by Dkk 73.5 million when the forthcoming capi-
tal increase has been implemented, at the latest.
During and after the period under review, Tk Development has
concluded agreements regarding the refinancing of project
credits worth Dkk 1.2 billion out of the Dkk 1.5 billion due to
mature in 2013/14 as of 31 January 2013. The most significant
project credit of those refinanced after the reporting date has
been extended by two years, subject to the condition that the
credit is reduced by Dkk 50 million when the forthcoming capi-
tal increase has been implemented, at the latest.
now that the above-mentioned refinancing agreements are in
place, credits of Dkk 0.3 billion are due to mature in 2013/14.
The Group is in ongoing dialogue with the relevant credit institu-
tions, and management anticipates being able to either prolong
or otherwise refinance project credits that have not been pre-
maturely repaid upon project sales.
o u T Lo o K fo R 2 0 1 3 / 1 4
management anticipates positive results before tax for the
continuing activities for the 2013/14 financial year. The timing
and progress of the phase-out of the discontinuing activities
are subject to major uncertainty, and the results of these activ-
ities are therefore not included in the outlook for the 2013/14
financial year.
As mentioned previously, management has revised the sales
strategy for the Group’s projects and chosen to accept reduced
prices for selected project sales. Thus, management considers
it important for the Group to sell some of its completed proj-
ects and plots of land in the 2013/14 financial year.
The expectations mentioned in this Interim Report, including
earnings expectations, are naturally subject to risks and un-
certainties, which may result in deviations from the expected
results. various factors may impact on expectations, as out-
lined in the section “Risk issues” in the Group’s Annual Report
for 2012/13, particularly the valuation of the Group’s project
portfolio.
s u B s Eq u E n T E V E n T s
As stated in company announcement no. 15/2013, in June
2013 Tk Development has sold a Swedish 20,000 m² retail park
project in Barkarby, Stockholm, to a fund managed by Cordea
Savills. The sale is based on forward funding. 73 % of the proj-
ect premises have been let, and construction is scheduled to
begin in August 2013.
other than those mentioned in the management commentary,
no significant events of relevance to the Company have oc-
curred after the reporting date.
R E S U lT S I N Q 1 2 0 1 3 / 1 4 A N D O U T l O O K f O R 2 0 1 3 / 1 4
1 2 / 3 4 | T k D e v e lo pm e n T A / S | I n T e r I m r e p o rT Q 1 2 0 1 3 / 1 4 | m A n AG E m E n T com m E n TA RY
In management’s opinion, the Group’s market conditions have
not changed appreciably during the past months. The current
market conditions are still leading to long decision-making pro-
cesses among investors, tenants and financing sources alike.
The Danish market in particular continues to be affected by
uncertainty, partly because of a weakened financial sector. In
management’s opinion, there are no indications of a significant
improvement during the period to come.
The access to project financing remains difficult and is currently
the greatest challenge facing the property sector. The financial
sector is weakened and has sharpened its focus on credit risks,
and at the same time new rules have imposed stricter capital
requirements on banks. This means that credit institutions re-
main reluctant to provide loans to finance real property, with a
resulting negative effect for the property sector, and thus Tk
Development as well. Tk Development is dependent on its abil-
ity to continue obtaining either full or partial project financing,
either from credit institutions or from investors in the form of
forward funding, and on freeing up substantial cash resources
from the sale of several major completed projects.
The past year has seen cautious investor optimism and in-
creased interest in investing in selected segments of retail
projects, with quality and location being key factors in the in-
vestment decision. However, the decision-making processes
continue to be lengthy, in part because of the investors’ re-
quirement for lower project risk.
Institutional investors need options for placing their funds,
and this paves the way for setting up partnerships with such
investors for the purpose of cooperating on the execution of
new projects. These opportunities fall in line with the Group’s
business model, according to which Tk Development wishes
to enter into partnerships regarding completed properties and
new development projects, and thus to improve the allocation
of the Company’s equity, diversify risks and better utilize the
Group’s development competencies.
The Swedish market is currently considered the most trans-
parent and attractive market for selling projects in the nordic
region, and given the continued retail expansion, this market is
highly interesting for Tk Development.
In the letting market for retail property, tenants continue to fo-
cus on location. Tk Development is experiencing a good amount
of interest in prime-location projects, and several strong na-
tional and international retail chains are expanding, although
decision-making processes are protracted in light of the unrest
on international financial markets.
The rental level is expected to remain fairly stable in the period
ahead. However, the rental level for secondary locations is ex-
pected to be under pressure.
In the residential segment in Warsaw, poland, demand is slug-
gish and prices have realigned due to the large supply of new
housing for sale, among other factors. The scope of housing
projects launched in Warsaw is now diminishing, and over time
the supply of housing is expected to stabilize. Therefore, in the
opinion of management, housing development in poland will be-
come attractive again, particularly in the Warsaw area.
M A R K E T C O N D I T I O N S
m A n AG E m E n T com m E n TA RY | I n T e r I m r e p o rT Q 1 2 0 1 3 / 1 4 | T k D e v e lo pm e n T A / S | 1 3 / 3 4
The Group’s primary business area is the development of real
property, termed property development.
Strategy for business area – Property development
Developing projects from the conceptual phase through to proj-ect completion, based on one of several models:• Sold projects (forward funding / forward purchase)• projects with partners• on Tk’s own books based on a high degree of confidence in
the letting and sales potential• Services for third parties.
Property development
Countries: Denmark, Sweden,
poland and the Czech republic
revenue: Q1 2013/14: Dkk 95.1 million
(Q1 2012/13: Dkk 14.5 million)
Gross profit/loss: Q1 2013/14: Dkk 2.5 million
(Q1 2012/13: Dkk 5.5 million)
Balance sheet total: 30 Apr 2013: Dkk 1,242.1 million
(31 Jan 2013: Dkk 1,284.5 million)
In its property development segment, Tk Development focuses
on executing existing projects in the portfolio, as well as on se-
curing satisfactory pre-construction letting or sales. In addition,
the Group continuously works on new project opportunities.
The Group will make the startup of major new projects contin-
gent on obtaining either full or partial financing for them and on
freeing up cash resources from the sale of one or more major
completed projects.
The gross margin for development activities amounted to Dkk
2.5 million in Q1 2013/14 against Dkk 5.5 million in Q1 2012/13.
The Group’s retail projects on which construction is already on-
going or about to start are still attracting a good amount of in-
terest from tenants. During the period under review, the Group
also concluded lease agreements for several of these projects.
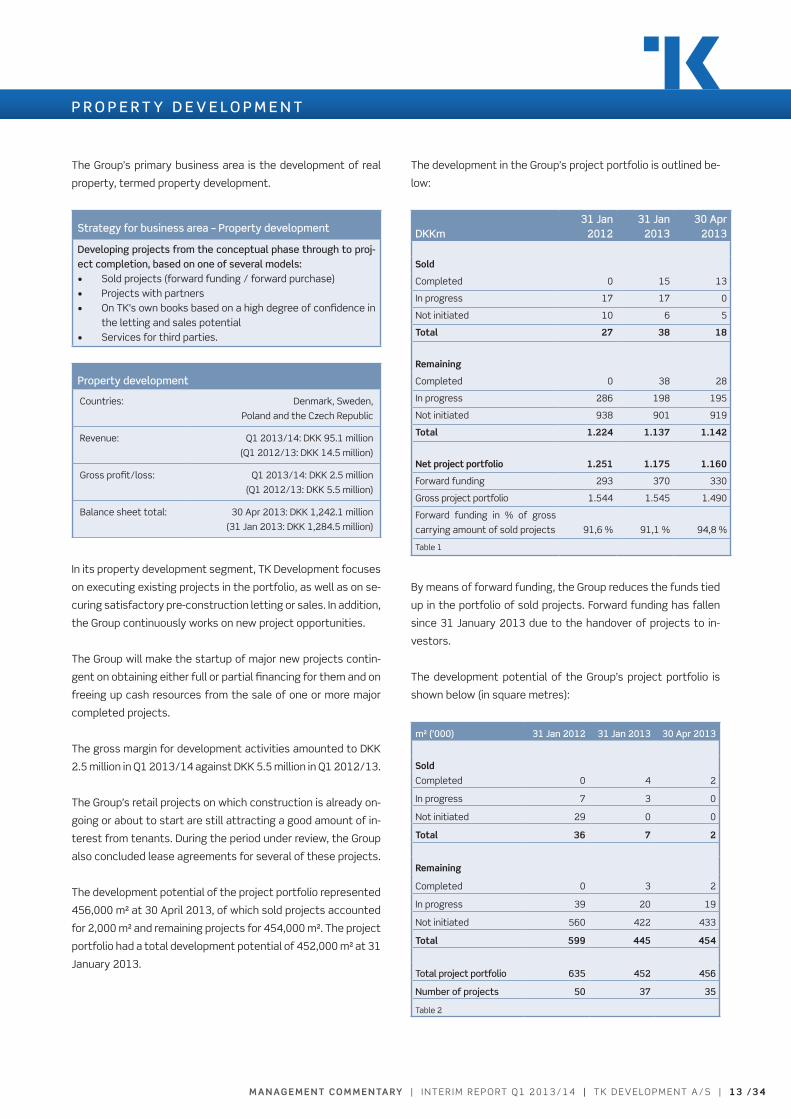
The development potential of the project portfolio represented
456,000 m² at 30 April 2013, of which sold projects accounted
for 2,000 m² and remaining projects for 454,000 m². The project
portfolio had a total development potential of 452,000 m² at 31
January 2013.
The development in the Group’s project portfolio is outlined be-
low:
DKKm31 Jan
201231 Jan
201330 Apr
2013
sold
Completed 0 15 13
In progress 17 17 0
not initiated 10 6 5
Total 27 38 18
Remaining
Completed 0 38 28
In progress 286 198 195
not initiated 938 901 919
Total 1.224 1.137 1.142
net project portfolio 1.251 1.175 1.160
Forward funding 293 370 330
Gross project portfolio 1.544 1.545 1.490
Forward funding in % of gross
carrying amount of sold projects 91,6 % 91,1 % 94,8 %
Table 1
By means of forward funding, the Group reduces the funds tied
up in the portfolio of sold projects. Forward funding has fallen
since 31 January 2013 due to the handover of projects to in-
vestors.
The development potential of the Group’s project portfolio is
shown below (in square metres):
m² (’000) 31 Jan 2012 31 Jan 2013 30 Apr 2013
sold
Completed 0 4 2
In progress 7 3 0
not initiated 29 0 0
Total 36 7 2
Remaining
Completed 0 3 2
In progress 39 20 19
not initiated 560 422 433
Total 599 445 454
Total project portfolio 635 452 456
Number of projects 50 37 35
Table 2
P R O P E R T Y D E v E l O P M E N T
1 4 / 3 4 | T k D e v e lo pm e n T A / S | I n T e r I m r e p o rT Q 1 2 0 1 3 / 1 4 | m A n AG E m E n T com m E n TA RY
Project name city/town country segment
TKD’s share
of area (m2)
TKD’s
ownership
interest
construction
start/
expected con-
struction start
opening/
expected
opening
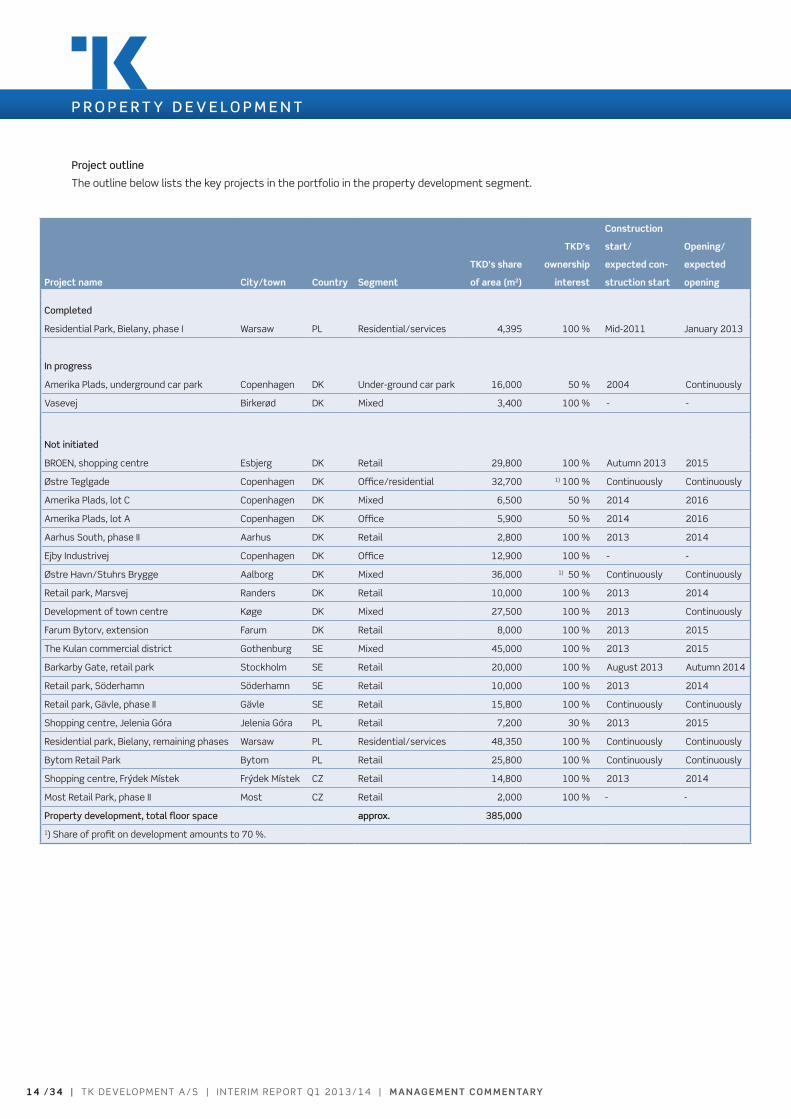
Completed
residential park, Bielany, phase I Warsaw pl residential/services 4,395 100 % mid-2011 January 2013
In progress
Amerika plads, underground car park Copenhagen Dk Under-ground car park 16,000 50 % 2004 Continuously
vasevej Birkerød Dk mixed 3,400 100 % - -
Not initiated
Broen, shopping centre esbjerg Dk retail 29,800 100 % Autumn 2013 2015
Østre Teglgade Copenhagen Dk office/residential 32,700 1) 100 % Continuously Continuously
Amerika plads, lot C Copenhagen Dk mixed 6,500 50 % 2014 2016
Amerika plads, lot A Copenhagen Dk office 5,900 50 % 2014 2016
Aarhus South, phase II Aarhus Dk retail 2,800 100 % 2013 2014
ejby Industrivej Copenhagen Dk office 12,900 100 % - -
Østre Havn/Stuhrs Brygge Aalborg Dk mixed 36,000 1) 50 % Continuously Continuously
retail park, marsvej randers Dk retail 10,000 100 % 2013 2014
Development of town centre køge Dk mixed 27,500 100 % 2013 Continuously
Farum Bytorv, extension Farum Dk retail 8,000 100 % 2013 2015
The kulan commercial district Gothenburg Se mixed 45,000 100 % 2013 2015
Barkarby Gate, retail park Stockholm Se retail 20,000 100 % August 2013 Autumn 2014
retail park, Söderhamn Söderhamn Se retail 10,000 100 % 2013 2014
retail park, Gävle, phase II Gävle Se retail 15,800 100 % Continuously Continuously
Shopping centre, Jelenia Góra Jelenia Góra pl retail 7,200 30 % 2013 2015
residential park, Bielany, remaining phases Warsaw pl residential/services 48,350 100 % Continuously Continuously
Bytom retail park Bytom pl retail 25,800 100 % Continuously Continuously
Shopping centre, Frýdek místek Frýdek místek CZ retail 14,800 100 % 2013 2014
most retail park, phase II most CZ retail 2,000 100 % - -
Property development, total floor space approx. 385,000
1) Share of profit on development amounts to 70 %.
Project outline
The outline below lists the key projects in the portfolio in the property development segment.
P R O P E R T Y D E v E l O P M E N T
m A n AG E m E n T com m E n TA RY | I n T e r I m r e p o rT Q 1 2 0 1 3 / 1 4 | T k D e v e lo pm e n T A / S | 1 5 / 3 4
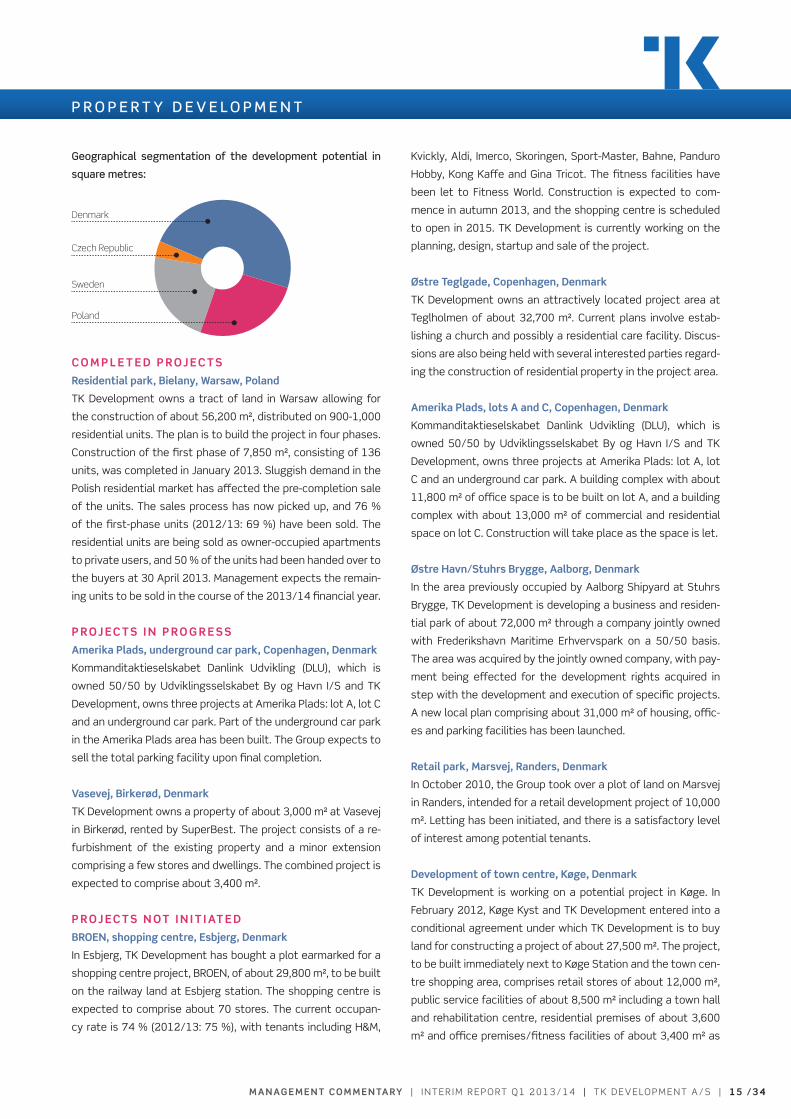
Geographical segmentation of the development potential in
square metres:
Sweden
Denmark
Czech Republic
Poland
c o m P L E T E D P R oj Ec T s
Residential park, Bielany, warsaw, Poland
Tk Development owns a tract of land in Warsaw allowing for
the construction of about 56,200 m², distributed on 900-1,000
residential units. The plan is to build the project in four phases.
Construction of the first phase of 7,850 m², consisting of 136
units, was completed in January 2013. Sluggish demand in the
polish residential market has affected the pre-completion sale
of the units. The sales process has now picked up, and 76 %
of the first-phase units (2012/13: 69 %) have been sold. The
residential units are being sold as owner-occupied apartments
to private users, and 50 % of the units had been handed over to
the buyers at 30 April 2013. management expects the remain-
ing units to be sold in the course of the 2013/14 financial year.
P R o j Ec T s I n P R o G R E s s
Amerika Plads, underground car park, copenhagen, Denmark
kommanditaktieselskabet Danlink Udvikling (DlU), which is
owned 50/50 by Udviklingsselskabet By og Havn I/S and Tk
Development, owns three projects at Amerika plads: lot A, lot C
and an underground car park. part of the underground car park
in the Amerika plads area has been built. The Group expects to
sell the total parking facility upon final completion.
Vasevej, Birkerød, Denmark
Tk Development owns a property of about 3,000 m² at vasevej
in Birkerød, rented by SuperBest. The project consists of a re-
furbishment of the existing property and a minor extension
comprising a few stores and dwellings. The combined project is
expected to comprise about 3,400 m².
P R o j Ec T s n oT I n I T I AT E D
BRoEn, shopping centre, Esbjerg, Denmark
In esbjerg, Tk Development has bought a plot earmarked for a
shopping centre project, Broen, of about 29,800 m², to be built
on the railway land at esbjerg station. The shopping centre is
expected to comprise about 70 stores. The current occupan-
cy rate is 74 % (2012/13: 75 %), with tenants including H&m,
kvickly, Aldi, Imerco, Skoringen, Sport-master, Bahne, panduro
Hobby, kong kaffe and Gina Tricot. The fitness facilities have
been let to Fitness World. Construction is expected to com-
mence in autumn 2013, and the shopping centre is scheduled
to open in 2015. Tk Development is currently working on the
planning, design, startup and sale of the project.
Østre Teglgade, copenhagen, Denmark
Tk Development owns an attractively located project area at
Teglholmen of about 32,700 m². Current plans involve estab-
lishing a church and possibly a residential care facility. Discus-
sions are also being held with several interested parties regard-
ing the construction of residential property in the project area.
Amerika Plads, lots A and c, copenhagen, Denmark
kommanditaktieselskabet Danlink Udvikling (DlU), which is
owned 50/50 by Udviklingsselskabet By og Havn I/S and Tk
Development, owns three projects at Amerika plads: lot A, lot
C and an underground car park. A building complex with about
11,800 m² of office space is to be built on lot A, and a building
complex with about 13,000 m² of commercial and residential
space on lot C. Construction will take place as the space is let.
Østre havn/stuhrs Brygge, Aalborg, Denmark
In the area previously occupied by Aalborg Shipyard at Stuhrs
Brygge, Tk Development is developing a business and residen-
tial park of about 72,000 m² through a company jointly owned
with Frederikshavn maritime erhvervspark on a 50/50 basis.
The area was acquired by the jointly owned company, with pay-
ment being effected for the development rights acquired in
step with the development and execution of specific projects.
A new local plan comprising about 31,000 m² of housing, offic-
es and parking facilities has been launched.
Retail park, marsvej, Randers, Denmark
In october 2010, the Group took over a plot of land on marsvej
in randers, intended for a retail development project of 10,000
m². letting has been initiated, and there is a satisfactory level
of interest among potential tenants.
Development of town centre, Køge, Denmark
Tk Development is working on a potential project in køge. In
February 2012, køge kyst and Tk Development entered into a
conditional agreement under which Tk Development is to buy
land for constructing a project of about 27,500 m². The project,
to be built immediately next to køge Station and the town cen-
tre shopping area, comprises retail stores of about 12,000 m²,
public service facilities of about 8,500 m² including a town hall
and rehabilitation centre, residential premises of about 3,600
m² and office premises/fitness facilities of about 3,400 m² as
P R O P E R T Y D E v E l O P M E N T
1 6 / 3 4 | T k D e v e lo pm e n T A / S | I n T e r I m r e p o rT Q 1 2 0 1 3 / 1 4 | m A n AG E m E n T com m E n TA RY
well as a 14,000 m² underground car park. The local plan for
the area is to be changed, and a new one expected to be final-
ly adopted in mid-2013. Tk Development expects to enter into
an agreement with køge municipality regarding its takeover of
both town hall and rehabilitation centre. letting of the retail
premises has started, and potential tenants are showing a
good amount of interest in the project.
farum Bytorv, extension, farum, Denmark
In Farum, Tk Development has made a winning bid for an exten-
sion of Farum Bytorv by about 8,000 m². A new local plan for the
area is to be drawn up. This process is under way, and the local
plan is expected to be adopted in mid-2013.
The Kulan commercial district, shopping centre and service/
commercial space, Gothenburg, sweden
Tk Development and the Swedish housing developer Jm AB
have entered into a cooperation agreement with SkF Sverige
AB to develop SkF’s former factory area in the old part of Go-
thenburg. The contemplated project comprises a total floor
space of about 75,000 m²: 30,000 m² for a shopping centre,
15,000 m² for services/commercial use and 30,000 m² for
housing. Tk Development will be in charge of developing the
45,000 m² for a shopping centre, services and commercial fa-
cilities, while Jm AB will have responsibility for the 30,000 m² of
housing. The local plan is being drawn up and is expected to be
approved in 2013. The project is being discussed with potential
tenants, and several lease agreements have been concluded.
Barkarby Gate, retail park, stockholm, sweden
In Barkarby in the northwestern part of Stockholm, Tk Develop-
ment has an option on an area for the development of a 20,000
m² retail park. The retail park is expected to consist of 12-14
units, of which 9-10 units will be retail stores. The current oc-
cupancy rate is 73 % (2012/13: 70 %), and lease agreements
have been concluded with various major tenants, including XXl
(sports store), Clas ohlson, Intersport, lager 157, Grizzly, kjell
& Co., Burger king and the fitness chain nordic Wellness. After
the reporting date, the project has been sold to a fund man-
aged by Cordea Savills. The sale is based on forward funding.
The option to purchase land for the project will be exercised
simultaneously with construction startup, scheduled for Au-
gust 2013. The opening has been scheduled for autumn 2014.
earnings from the sale will be recognized upon handover of the
project to the investor, expected to take place in 2014/15.
Retail park, phase II, Gävle, sweden
In 2012/13, Tk Development sold and handed over an 8,300 m²
retail park in the Swedish town of Gävle to the Swedish proper-
ty company nordika Fastigheter AB. moreover, Tk Development
has an option to buy a plot of land for developing additional
retail park premises of about 15,800 m².
shopping centre, jelenia Góra, Poland
Tk Development has bought a plot of land in Jelenia Góra and
has an option on additional land for the development of a shop-
ping centre of about 24,000 m². The project will comprise a su-
permarket of about 2,200 m² and retail, restaurant and service
premises totalling about 21,800 m². The local plan for the area
is in place and the letting of premises has started. Construction
is expected to commence in 2013, and the shopping centre is
scheduled to open in 2015. In December 2012, 70 % of the proj-
ect was handed over to Heitman, and in this connection the
Group’s 30 % ownership interest was classified under “Invest-
ment properties under construction”. Tk Development will re-
ceive fee income from the jointly owned company established
for developing, letting and managing the construction of the
project.
Residential park, Bielany, warsaw, Poland
Tk Development owns a tract of land in Warsaw allowing for
the construction of residential units of about 56,200 m² in all;
see above under “Completed projects”. Construction of the first
phase of 7,850 m² has been completed. The plan is to initiate
construction of the remaining three phases of about 48,350
m² successively, in continuation of the completion of the first
phase, once pre-construction sales have reached a satisfacto-
ry level.
Bytom Retail Park, Bytom, Poland
Tk Development intends to develop a retail park with total leas-
able space of about 25,800 m² on its site at the plejada shop-
ping centre in Bytom, which is centrally located in the katowice
region. Construction of the project will be phased in step with
letting. letting efforts are ongoing, and construction will start
as space is let.
shopping centre, frýdek místek, the czech Republic
In the Czech town of Frýdek místek, Tk Development has an
option to buy a plot of land for building a 14,800 m² shopping
centre, consisting of about 60 stores. The current occupancy
rate is 71 % (2012/13: 75 %). As the project has been post-
poned relative to the original schedule, a few tenants have cho-
sen to exercise their right to withdraw from the lease agree-
ments, which is the reason for the declining occupancy rate.
The letting process is still proceeding satisfactorily, and lease
agreements have been concluded with such tenants as Billa,
Intersport, H&m, newYorker and euronics. Construction is ex-
pected to start in the course of 2013, with the opening sched-
uled for 2014.
P R O P E R T Y D E v E l O P M E N T
m A n AG E m E n T com m E n TA RY | I n T e r I m r e p o rT Q 1 2 0 1 3 / 1 4 | T k D e v e lo pm e n T A / S | 1 7 / 3 4
The Group’s secondary business area is asset management,
which consists of owning, operating, running in, maturing and
optimizing completed projects for a medium-long operating pe-
riod whose length matches the potential for adding value both
for the Group and for third parties.
Strategy for business area – Asset management
Owning, operating, maturing and optimizing completed projects for a
medium-long operating period that matches the potential for adding
value both for the Group and for third parties.
Asset management
Countries: Denmark, Sweden, poland
and the Czech republic
revenue: Q1 2013/14: Dkk 33.1 million
(Q1 2012/13: Dkk 37.0 million)
Gross profit/loss: Q1 2013/14: Dkk 29.8 million
(Q1 2012/13: Dkk 31.9 million)
Balance sheet
total:
30 Apr 2013: Dkk 2,089.9 million
(31 Jan 2013: Dkk 2,100.7 million)
number of employ-
ees at centres:
30 Apr 2013: 9
(31 Jan 2013: 12)
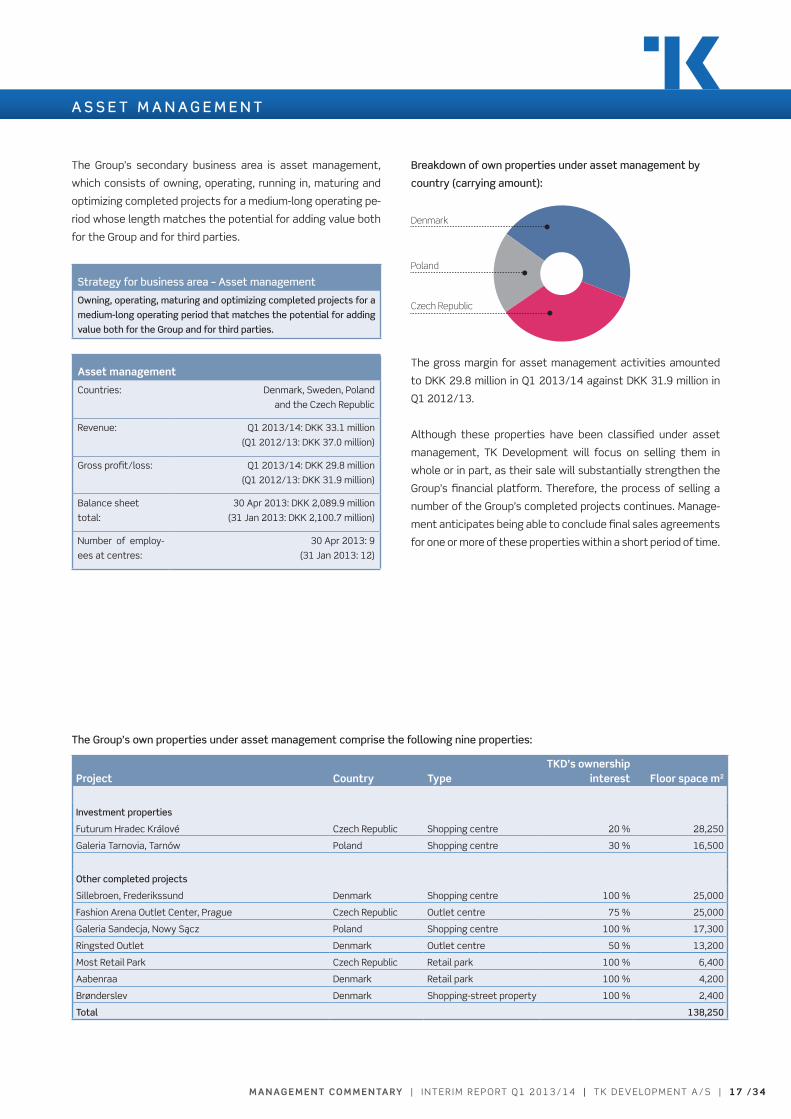
breakdown of own properties under asset management by
country (carrying amount):
Czech Republic
Denmark
Poland
The gross margin for asset management activities amounted
to Dkk 29.8 million in Q1 2013/14 against Dkk 31.9 million in
Q1 2012/13.
Although these properties have been classified under asset
management, Tk Development will focus on selling them in
whole or in part, as their sale will substantially strengthen the
Group’s financial platform. Therefore, the process of selling a
number of the Group’s completed projects continues. manage-
ment anticipates being able to conclude final sales agreements
for one or more of these properties within a short period of time.
A S S E T M A N A G E M E N T
Project country TypeTKD’s ownership
interest floor space m2
Investment properties
Futurum Hradec králové Czech republic Shopping centre 20 % 28,250
Galeria Tarnovia, Tarnów poland Shopping centre 30 % 16,500
Other completed projects
Sillebroen, Frederikssund Denmark Shopping centre 100 % 25,000
Fashion Arena outlet Center, prague Czech republic outlet centre 75 % 25,000
Galeria Sandecja, nowy Sącz poland Shopping centre 100 % 17,300
ringsted outlet Denmark outlet centre 50 % 13,200
most retail park Czech republic retail park 100 % 6,400
Aabenraa Denmark retail park 100 % 4,200
Brønderslev Denmark Shopping-street property 100 % 2,400
Total 138,250
The Group’s own properties under asset management comprise the following nine properties:
1 8 / 3 4 | T k D e v e lo pm e n T A / S | I n T e r I m r e p o rT Q 1 2 0 1 3 / 1 4 | m A n AG E m E n T com m E n TA RY
The total portfolio of properties under asset management
amounted to Dkk 1,938.7 million at 30 April 2013 (31 January
2013: Dkk 1,932.1 million), of which investment properties ac-
counted for Dkk 314.0 million (31 January 2013: Dkk 312.1 mil-
lion). The operation of these properties, which largely consist
of shopping centres, is generally proceeding satisfactorily. The
annual net rent from the current leases corresponds to a return
on the carrying amount of 6.7 % (2012/13: 6.7 %). Based on full
occupancy, the return on the carrying amount is expected to
reach 7.9 % (2012/13: 7.9 %).
overall, the individual centres recorded favourable develop-
ment in 2012, and the positive development in both footfall and
revenue has continued into 2013.
The development of the individual centres appears from pages
19-21.
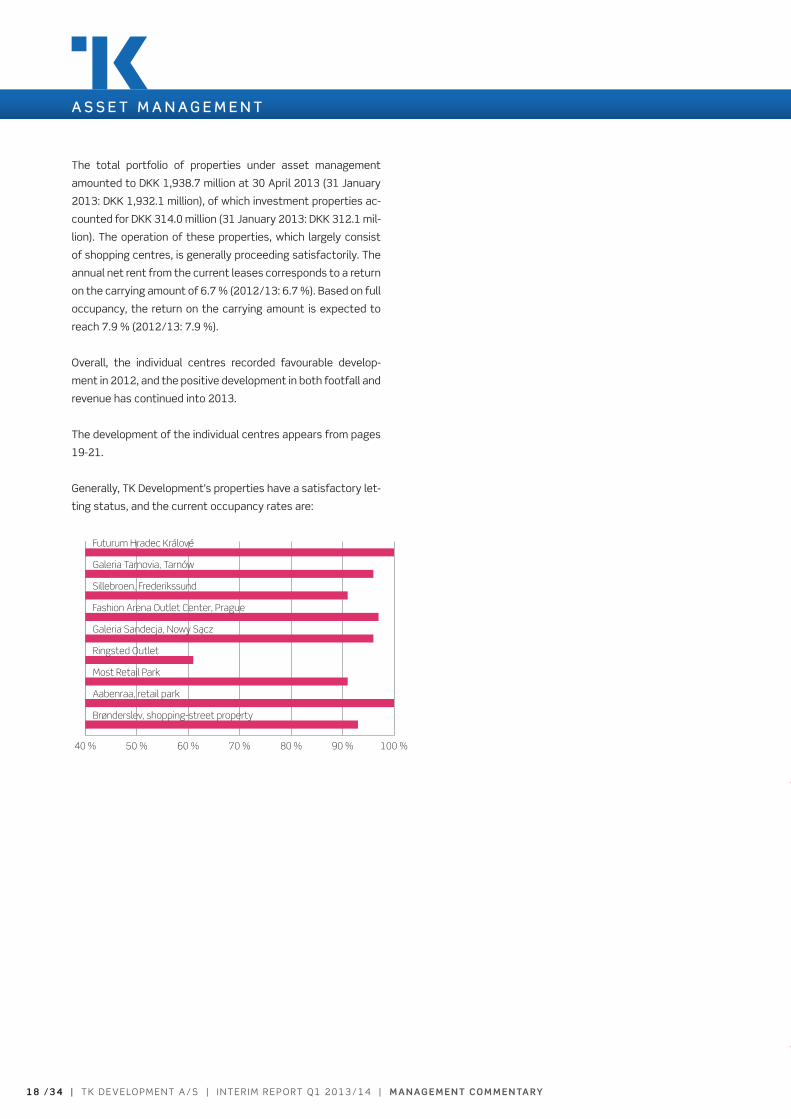
Generally, Tk Development’s properties have a satisfactory let-
ting status, and the current occupancy rates are:
40 % 50 % 60 % 70 % 80 % 90 % 100 %
Brønderslev, shopping-street property
Aabenraa, retail park
Most Retail Park
Ringsted Outlet
Galeria Sandecja, Nowy Sącz
Fashion Arena Outlet Center, Prague
Sillebroen, Frederikssund
Galeria Tarnovia, Tarnów
Futurum Hradec Králové
A S S E T M A N A G E M E N T
m A n AG E m E n T com m E n TA RY | I n T e r I m r e p o rT Q 1 2 0 1 3 / 1 4 | T k D e v e lo pm e n T A / S | 1 9 / 3 4
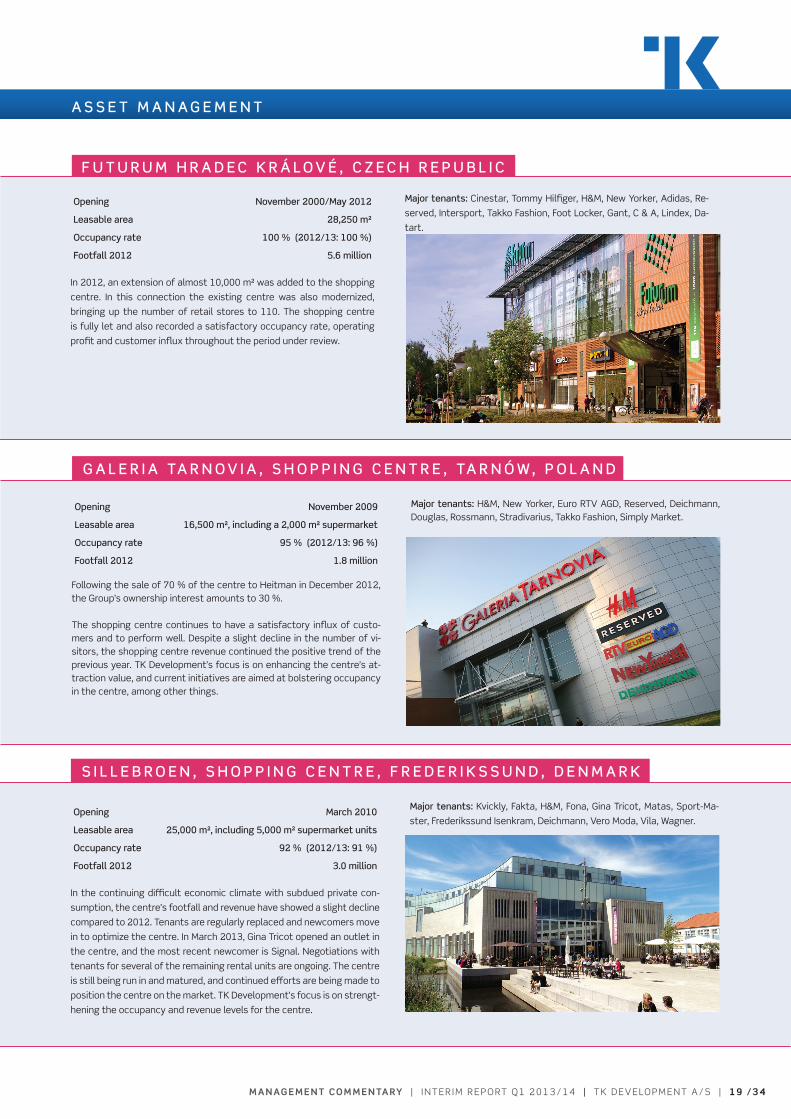
Opening November 2000/May 2012
leasable area 28,250 m²
Occupancy rate 100 % (2012/13: 100 %)
footfall 2012 5.6 million
In 2012, an extension of almost 10,000 m² was added to the shopping
centre. In this connection the existing centre was also modernized,
bringing up the number of retail stores to 110. The shopping centre
is fully let and also recorded a satisfactory occupancy rate, operating
profit and customer influx throughout the period under review.
Major tenants: Cinestar, Tommy Hilfiger, H&m, new Yorker, Adidas, re-
served, Intersport, Takko Fashion, Foot locker, Gant, C & A, lindex, Da-
tart.
Opening November 2009
leasable area 16,500 m², including a 2,000 m² supermarket
Occupancy rate 95 % (2012/13: 96 %)
footfall 2012 1.8 million
Following the sale of 70 % of the centre to Heitman in December 2012, the Group’s ownership interest amounts to 30 %.
The shopping centre continues to have a satisfactory influx of custo-mers and to perform well. Despite a slight decline in the number of vi-sitors, the shopping centre revenue continued the positive trend of the previous year. Tk Development’s focus is on enhancing the centre’s at-traction value, and current initiatives are aimed at bolstering occupancy in the centre, among other things.
Major tenants: H&m, new Yorker, euro rTv AGD, reserved, Deichmann, Douglas, rossmann, Stradivarius, Takko Fashion, Simply market.
f U T U R U M h R A D E C K R Á l O v É , C Z E C h R E P U b l I C
G A l E R I A TA R N O v I A , S h O P P I N G C E N T R E , TA R N Ó W , P O l A N D
Opening March 2010
leasable area 25,000 m², including 5,000 m² supermarket units
Occupancy rate 92 % (2012/13: 91 %)
footfall 2012 3.0 million
In the continuing difficult economic climate with subdued private con-
sumption, the centre’s footfall and revenue have showed a slight decline
compared to 2012. Tenants are regularly replaced and newcomers move
in to optimize the centre. In march 2013, Gina Tricot opened an outlet in
the centre, and the most recent newcomer is Signal. negotiations with
tenants for several of the remaining rental units are ongoing. The centre
is still being run in and matured, and continued efforts are being made to
position the centre on the market. Tk Development’s focus is on strengt-
hening the occupancy and revenue levels for the centre.
Major tenants: kvickly, Fakta, H&m, Fona, Gina Tricot, matas, Sport-ma-
ster, Frederikssund Isenkram, Deichmann, vero moda, vila, Wagner.
S I l l E b R O E N , S h O P P I N G C E N T R E , f R E D E R I K S S U N D , D E N M A R K
A S S E T M A N A G E M E N T
2 0 / 3 4 | T k D e v e lo pm e n T A / S | I n T e r I m r e p o rT Q 1 2 0 1 3 / 1 4 | m A n AG E m E n T com m E n TA RY
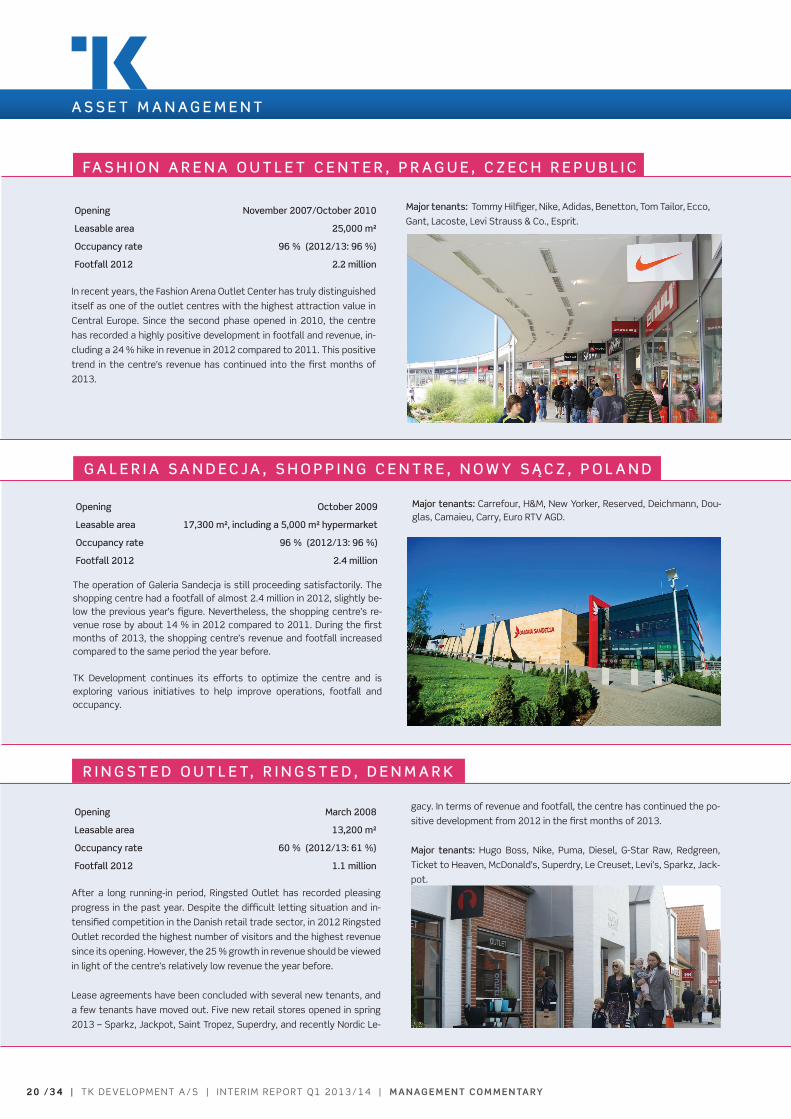
Opening November 2007/October 2010
leasable area 25,000 m²
Occupancy rate 96 % (2012/13: 96 %)
footfall 2012 2.2 million
In recent years, the Fashion Arena outlet Center has truly distinguished
itself as one of the outlet centres with the highest attraction value in
Central europe. Since the second phase opened in 2010, the centre
has recorded a highly positive development in footfall and revenue, in-
cluding a 24 % hike in revenue in 2012 compared to 2011. This positive
trend in the centre’s revenue has continued into the first months of
2013.
Major tenants: Tommy Hilfiger, nike, Adidas, Benetton, Tom Tailor, ecco,
Gant, lacoste, levi Strauss & Co., esprit.
Opening October 2009
leasable area 17,300 m², including a 5,000 m² hypermarket
Occupancy rate 96 % (2012/13: 96 %)
footfall 2012 2.4 million
The operation of Galeria Sandecja is still proceeding satisfactorily. The shopping centre had a footfall of almost 2.4 million in 2012, slightly be-low the previous year’s figure. nevertheless, the shopping centre’s re-venue rose by about 14 % in 2012 compared to 2011. During the first months of 2013, the shopping centre’s revenue and footfall increased compared to the same period the year before.
Tk Development continues its efforts to optimize the centre and is exploring various initiatives to help improve operations, footfall and occupancy.
Major tenants: Carrefour, H&m, new Yorker, reserved, Deichmann, Dou-glas, Camaieu, Carry, euro rTv AGD.
fA S h I O N A R E N A O U T l E T C E N T E R , P R A G U E , C Z E C h R E P U b l I C
G A l E R I A S A N D E C J A , S h O P P I N G C E N T R E , N O W Y S Ą C Z , P O l A N D
Opening March 2008
leasable area 13,200 m²
Occupancy rate 60 % (2012/13: 61 %)
footfall 2012 1.1 million
After a long running-in period, ringsted outlet has recorded pleasing
progress in the past year. Despite the difficult letting situation and in-
tensified competition in the Danish retail trade sector, in 2012 ringsted
outlet recorded the highest number of visitors and the highest revenue
since its opening. However, the 25 % growth in revenue should be viewed
in light of the centre’s relatively low revenue the year before.
lease agreements have been concluded with several new tenants, and
a few tenants have moved out. Five new retail stores opened in spring
2013 – Sparkz, Jackpot, Saint Tropez, Superdry, and recently nordic le-
gacy. In terms of revenue and footfall, the centre has continued the po-
sitive development from 2012 in the first months of 2013.
Major tenants: Hugo Boss, nike, puma, Diesel, G-Star raw, redgreen,
Ticket to Heaven, mcDonald’s, Superdry, le Creuset, levi’s, Sparkz, Jack-
pot.
R I N G S T E D O U T l E T, R I N G S T E D , D E N M A R K
A S S E T M A N A G E M E N T
m A n AG E m E n T com m E n TA RY | I n T e r I m r e p o rT Q 1 2 0 1 3 / 1 4 | T k D e v e lo pm e n T A / S | 2 1 / 3 4
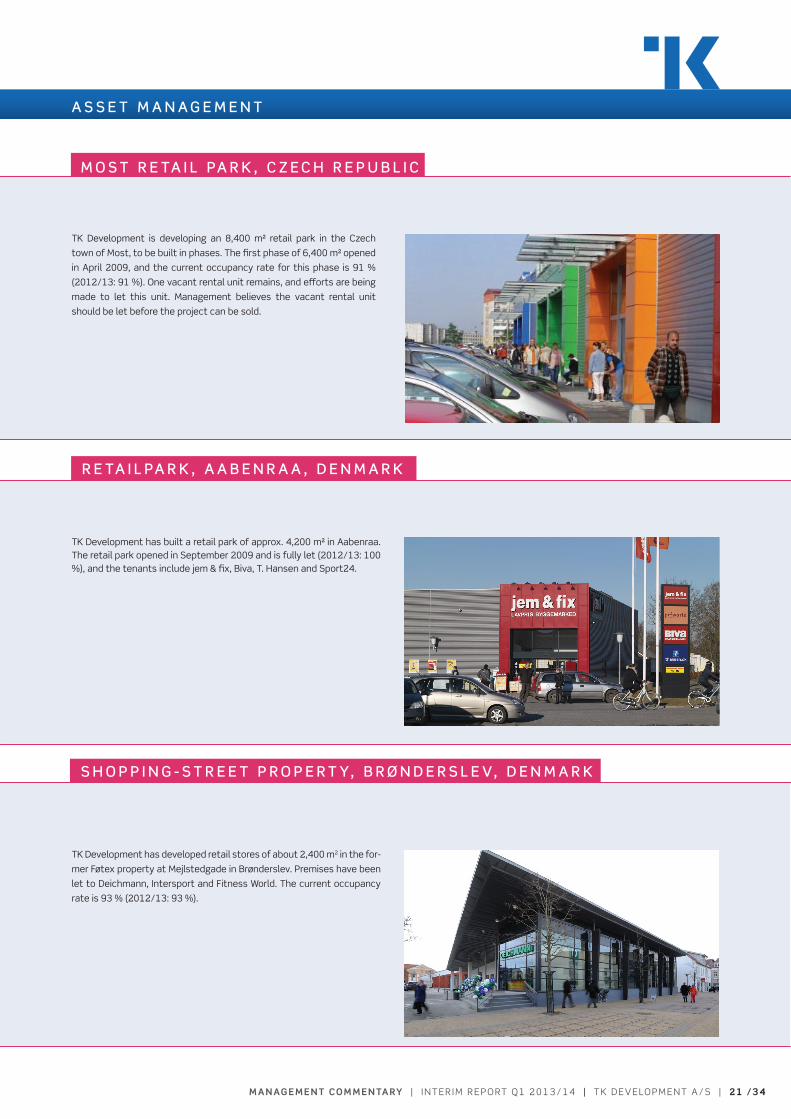
Tk Development is developing an 8,400 m² retail park in the Czech
town of most, to be built in phases. The first phase of 6,400 m² opened
in April 2009, and the current occupancy rate for this phase is 91 %
(2012/13: 91 %). one vacant rental unit remains, and efforts are being
made to let this unit. management believes the vacant rental unit
should be let before the project can be sold.
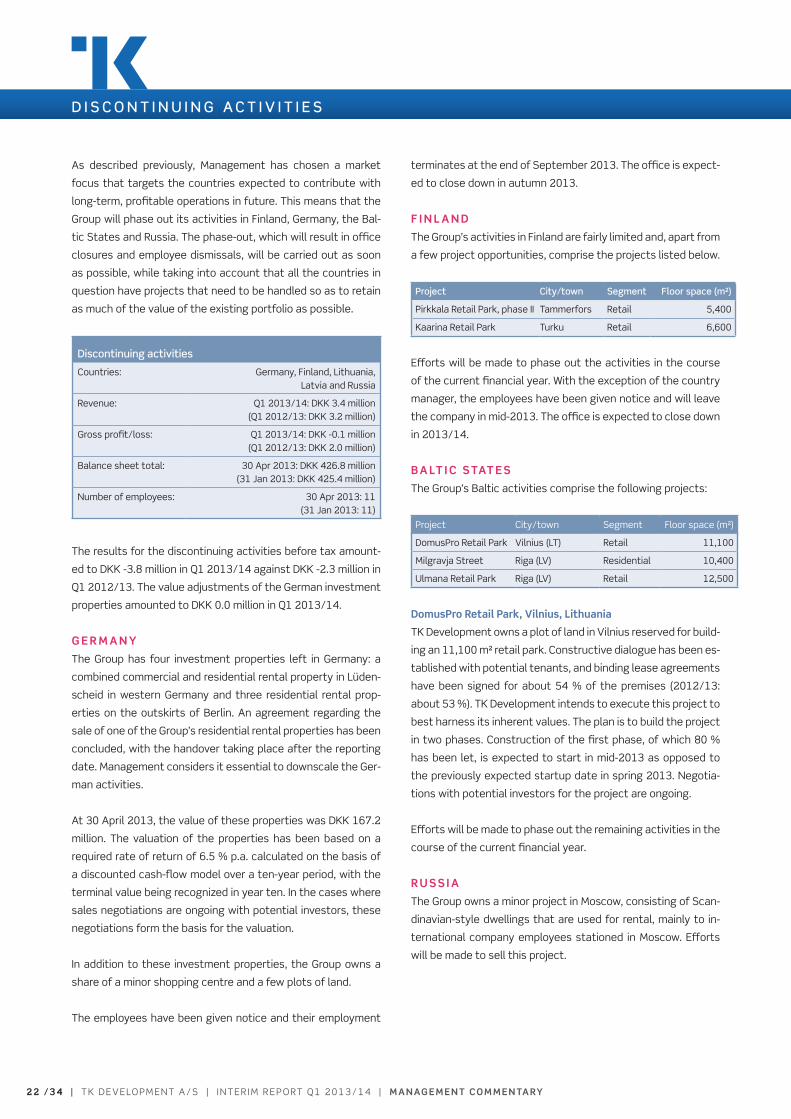
Tk Development has built a retail park of approx. 4,200 m² in Aabenraa. The retail park opened in September 2009 and is fully let (2012/13: 100 %), and the tenants include jem & fix, Biva, T. Hansen and Sport24.
M O S T R E TA I l PA R K , C Z E C h R E P U b l I C
R E TA I l PA R K , A A b E N R A A , D E N M A R K
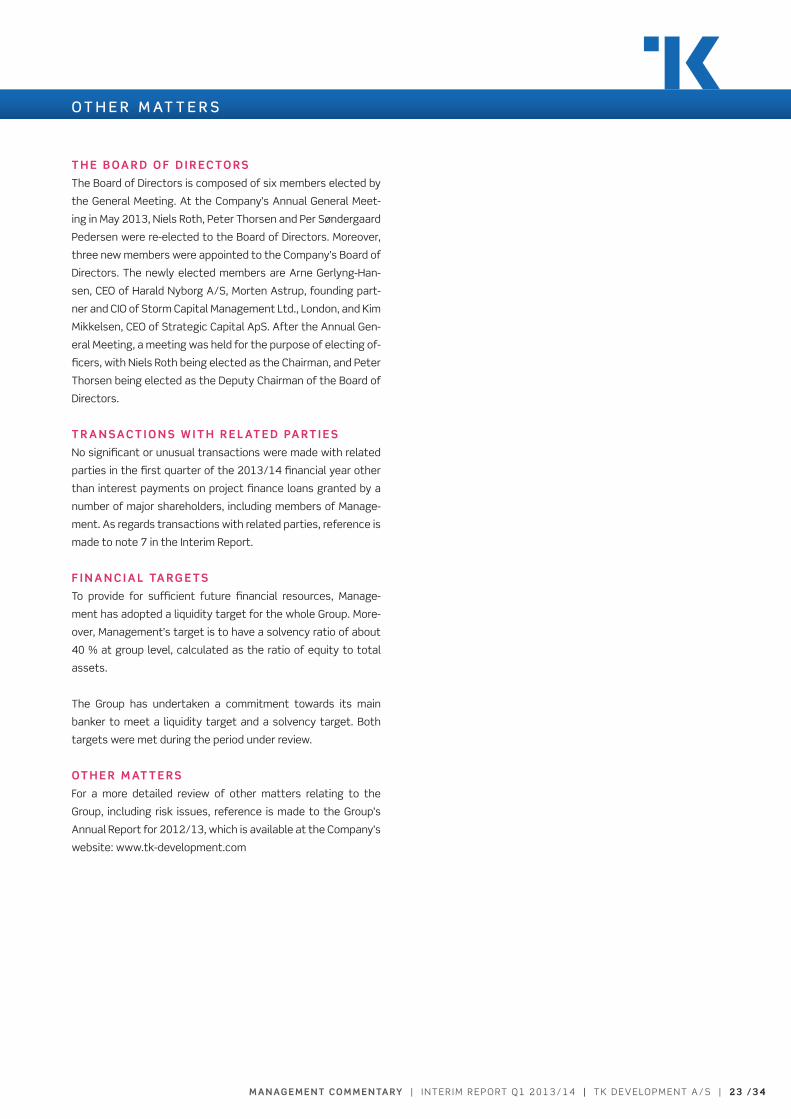
Tk Development has developed retail stores of about 2,400 m2 in the for-
mer Føtex property at mejlstedgade in Brønderslev. premises have been
let to Deichmann, Intersport and Fitness World. The current occupancy
rate is 93 % (2012/13: 93 %).
S h O P P I N G - S T R E E T P R O P E R T Y, b R Ø N D E R S l E v, D E N M A R K
A S S E T M A N A G E M E N T
2 2 / 3 4 | T k D e v e lo pm e n T A / S | I n T e r I m r e p o rT Q 1 2 0 1 3 / 1 4 | m A n AG E m E n T com m E n TA RY
As described previously, management has chosen a market
focus that targets the countries expected to contribute with
long-term, profitable operations in future. This means that the
Group will phase out its activities in Finland, Germany, the Bal-
tic States and russia. The phase-out, which will result in office
closures and employee dismissals, will be carried out as soon
as possible, while taking into account that all the countries in
question have projects that need to be handled so as to retain
as much of the value of the existing portfolio as possible.
Discontinuing activities
Countries: Germany, Finland, lithuania, latvia and russia
revenue: Q1 2013/14: Dkk 3.4 million (Q1 2012/13: Dkk 3.2 million)
Gross profit/loss: Q1 2013/14: Dkk -0.1 million (Q1 2012/13: Dkk 2.0 million)
Balance sheet total: 30 Apr 2013: Dkk 426.8 million (31 Jan 2013: Dkk 425.4 million)
number of employees: 30 Apr 2013: 11 (31 Jan 2013: 11)
The results for the discontinuing activities before tax amount-
ed to Dkk -3.8 million in Q1 2013/14 against Dkk -2.3 million in
Q1 2012/13. The value adjustments of the German investment
properties amounted to Dkk 0.0 million in Q1 2013/14.
G E R m A n Y
The Group has four investment properties left in Germany: a
combined commercial and residential rental property in lüden-
scheid in western Germany and three residential rental prop-
erties on the outskirts of Berlin. An agreement regarding the
sale of one of the Group’s residential rental properties has been
concluded, with the handover taking place after the reporting
date. management considers it essential to downscale the Ger-
man activities.
At 30 April 2013, the value of these properties was Dkk 167.2
million. The valuation of the properties has been based on a
required rate of return of 6.5 % p.a. calculated on the basis of
a discounted cash-flow model over a ten-year period, with the
terminal value being recognized in year ten. In the cases where
sales negotiations are ongoing with potential investors, these
negotiations form the basis for the valuation.
In addition to these investment properties, the Group owns a
share of a minor shopping centre and a few plots of land.
The employees have been given notice and their employment
terminates at the end of September 2013. The office is expect-
ed to close down in autumn 2013.
f I n L A n D
The Group’s activities in Finland are fairly limited and, apart from
a few project opportunities, comprise the projects listed below.
Project City/town Segment floor space (m²)
pirkkala retail park, phase II Tammerfors retail 5,400
kaarina retail park Turku retail 6,600
efforts will be made to phase out the activities in the course
of the current financial year. With the exception of the country
manager, the employees have been given notice and will leave
the company in mid-2013. The office is expected to close down
in 2013/14.
B A LT I c s TAT E s
The Group’s Baltic activities comprise the following projects:
project City/town Segment Floor space (m²)
Domuspro retail park vilnius (lT) retail 11,100
milgravja Street riga (lv) residential 10,400
Ulmana retail park riga (lv) retail 12,500
DomusPro Retail Park, Vilnius, Lithuania
Tk Development owns a plot of land in vilnius reserved for build-
ing an 11,100 m² retail park. Constructive dialogue has been es-
tablished with potential tenants, and binding lease agreements
have been signed for about 54 % of the premises (2012/13:
about 53 %). Tk Development intends to execute this project to
best harness its inherent values. The plan is to build the project
in two phases. Construction of the first phase, of which 80 %
has been let, is expected to start in mid-2013 as opposed to
the previously expected startup date in spring 2013. negotia-
tions with potential investors for the project are ongoing.
efforts will be made to phase out the remaining activities in the
course of the current financial year.
R u s s I A
The Group owns a minor project in moscow, consisting of Scan-
dinavian-style dwellings that are used for rental, mainly to in-
ternational company employees stationed in moscow. efforts
will be made to sell this project.
D I S C O N T I N U I N G A C T I v I T I E S
m A n AG E m E n T com m E n TA RY | I n T e r I m r e p o rT Q 1 2 0 1 3 / 1 4 | T k D e v e lo pm e n T A / S | 2 3 / 3 4
T h E B oA R D o f D I R Ec To R s
The Board of Directors is composed of six members elected by
the General meeting. At the Company’s Annual General meet-
ing in may 2013, niels roth, peter Thorsen and per Søndergaard
pedersen were re-elected to the Board of Directors. moreover,
three new members were appointed to the Company’s Board of
Directors. The newly elected members are Arne Gerlyng-Han-
sen, Ceo of Harald nyborg A/S, morten Astrup, founding part-
ner and CIo of Storm Capital management ltd., london, and kim
mikkelsen, Ceo of Strategic Capital ApS. After the Annual Gen-
eral meeting, a meeting was held for the purpose of electing of-
ficers, with niels roth being elected as the Chairman, and peter
Thorsen being elected as the Deputy Chairman of the Board of
Directors.
T R A n s Ac T I o n s w I T h R E L AT E D PA RT I E s
no significant or unusual transactions were made with related
parties in the first quarter of the 2013/14 financial year other
than interest payments on project finance loans granted by a
number of major shareholders, including members of manage-
ment. As regards transactions with related parties, reference is
made to note 7 in the Interim report.
f I n A n c I A L TA R G E T s
To provide for sufficient future financial resources, manage-
ment has adopted a liquidity target for the whole Group. more-
over, management’s target is to have a solvency ratio of about
40 % at group level, calculated as the ratio of equity to total
assets.
The Group has undertaken a commitment towards its main
banker to meet a liquidity target and a solvency target. Both
targets were met during the period under review.
oT h E R m AT T E R s
For a more detailed review of other matters relating to the
Group, including risk issues, reference is made to the Group’s
Annual report for 2012/13, which is available at the Company’s
website: www.tk-development.com
O T h E R M AT T E R S
2 4 / 3 4 | T k D e v e lo pm e n T A / S | I n T e r I m r e p o rT Q 1 2 0 1 3 / 1 4 | sTAT E m E n T BY T h E B oA R D o f D I R EcTo Rs A n D E x Ec u T I V E B oA R D
S TAT E M E N T b Y T h E b O A R D O f D I R E C T O R S A N D E x E C U T I v E b O A R D O N T h E I N T E R I M R E P O R T
The Board of Directors and executive Board have today consid-
ered and adopted the Interim report of Tk Development A/S
for the period from 1 February to 30 April 2013.
The Interim report, which has not been audited or reviewed by
the Company’s auditors, is presented in accordance with IAS
34, Interim Financial reporting, as adopted by the eU, and Dan-
ish disclosure requirements for listed companies.
In our opinion, the Interim report gives a true and fair view of
the Group’s financial position at 30 April 2013 and of the results
of the Group’s operations and cash flows for the period from 1
February to 30 April 2013.
moreover, we consider the management’s review to give a fair
presentation of the development in the Group’s activities and
financial affairs, the results for the period and the Group’s over-
all financial position, as well as a true and fair description of
the most significant risks and elements of uncertainty faced
by the Group.
Aalborg, 21 June 2013
E x E c u T I V E B o A R D
B o A R D o f D I R Ec To R s
frede Clausen
president and Ceo
Robert Andersen
executive vice president
Peter Thorsen
Deputy Chairman
Per Søndergaard Pedersen Arne Gerlyng-hansen
Niels Roth
Chairman
Kim Mikkelsen Morten Astrup
co n s o L I DAT E D f I n A n c I A L sTAT E m E n Ts | I n T e r I m r e p o rT Q 1 2 0 1 3 / 1 4 | T k D e v e lo pm e n T A / S | 2 5 / 3 4
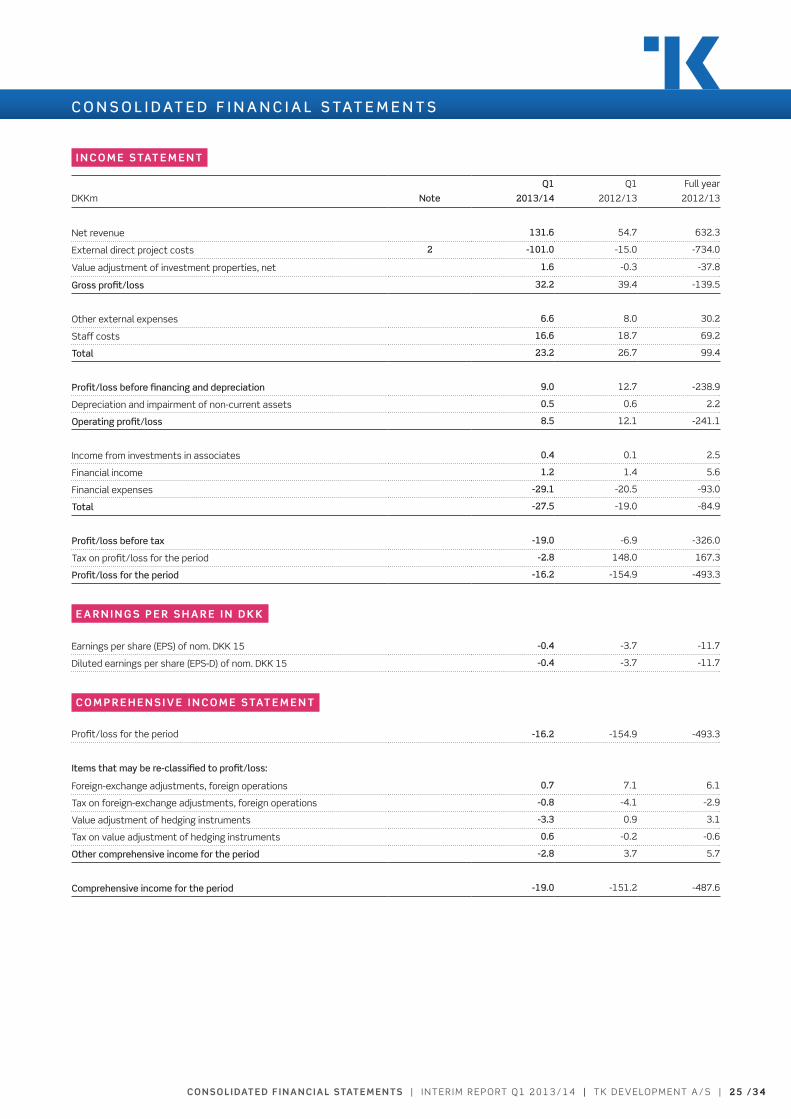
I n c o m E s TAT E m E n T
Dkkm Note
Q1
2013/14
Q1
2012/13
Full year
2012/13
net revenue 131.6 54.7 632.3
external direct project costs 2 -101.0 -15.0 -734.0
value adjustment of investment properties, net 1.6 -0.3 -37.8
Gross profit/loss 32.2 39.4 -139.5
other external expenses 6.6 8.0 30.2
Staff costs 16.6 18.7 69.2
Total 23.2 26.7 99.4
Profit/loss before financing and depreciation 9.0 12.7 -238.9
Depreciation and impairment of non-current assets 0.5 0.6 2.2
Operating profit/loss 8.5 12.1 -241.1
Income from investments in associates 0.4 0.1 2.5
Financial income 1.2 1.4 5.6
Financial expenses -29.1 -20.5 -93.0
Total -27.5 -19.0 -84.9
Profit/loss before tax -19.0 -6.9 -326.0
Tax on profit/loss for the period -2.8 148.0 167.3
Profit/loss for the period -16.2 -154.9 -493.3
E A R n I n G s P E R s h A R E I n D K K
earnings per share (epS) of nom. Dkk 15 -0.4 -3.7 -11.7
Diluted earnings per share (epS-D) of nom. Dkk 15 -0.4 -3.7 -11.7
c o m P R E h E n s I V E I n c o m E s TAT E m E n T
profit/loss for the period -16.2 -154.9 -493.3
Items that may be re-classified to profit/loss:
Foreign-exchange adjustments, foreign operations 0.7 7.1 6.1
Tax on foreign-exchange adjustments, foreign operations -0.8 -4.1 -2.9
value adjustment of hedging instruments -3.3 0.9 3.1
Tax on value adjustment of hedging instruments 0.6 -0.2 -0.6
Other comprehensive income for the period -2.8 3.7 5.7
Comprehensive income for the period -19.0 -151.2 -487.6
C O N S O l I D AT E D f I N A N C I A l S TAT E M E N T S
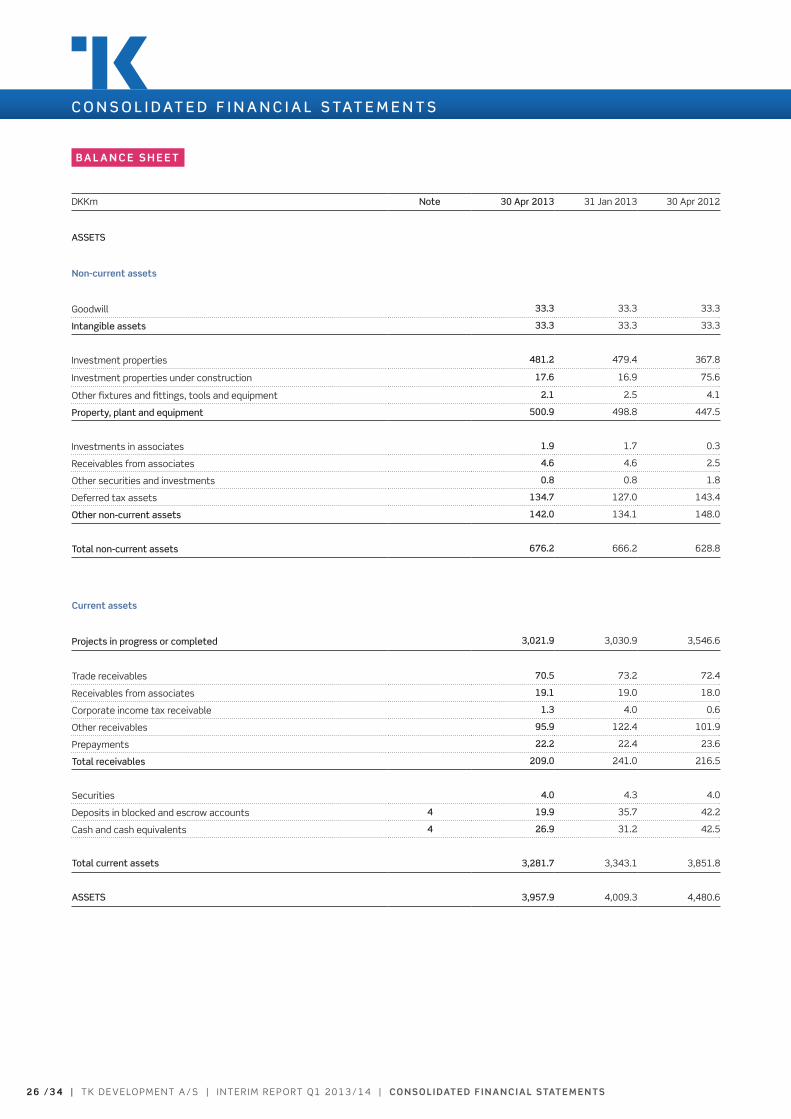
2 6 / 3 4 | T k D e v e lo pm e n T A / S | I n T e r I m r e p o rT Q 1 2 0 1 3 / 1 4 | co n s o L I DAT E D f I n A n c I A L sTAT E m E n Ts
C O N S O l I D AT E D f I N A N C I A l S TAT E M E N T S
B A L A n c E s h E E T
Dkkm Note 30 Apr 2013 31 Jan 2013 30 Apr 2012
ASSETS
non-current assets
Goodwill 33.3 33.3 33.3
Intangible assets 33.3 33.3 33.3
Investment properties 481.2 479.4 367.8
Investment properties under construction 17.6 16.9 75.6
other fixtures and fittings, tools and equipment 2.1 2.5 4.1
Property, plant and equipment 500.9 498.8 447.5
Investments in associates 1.9 1.7 0.3
receivables from associates 4.6 4.6 2.5
other securities and investments 0.8 0.8 1.8
Deferred tax assets 134.7 127.0 143.4
Other non-current assets 142.0 134.1 148.0
Total non-current assets 676.2 666.2 628.8
current assets
Projects in progress or completed 3,021.9 3,030.9 3,546.6
Trade receivables 70.5 73.2 72.4
receivables from associates 19.1 19.0 18.0
Corporate income tax receivable 1.3 4.0 0.6
other receivables 95.9 122.4 101.9
prepayments 22.2 22.4 23.6
Total receivables 209.0 241.0 216.5
Securities 4.0 4.3 4.0
Deposits in blocked and escrow accounts 4 19.9 35.7 42.2
Cash and cash equivalents 4 26.9 31.2 42.5
Total current assets 3,281.7 3,343.1 3,851.8
ASSETS 3,957.9 4,009.3 4,480.6
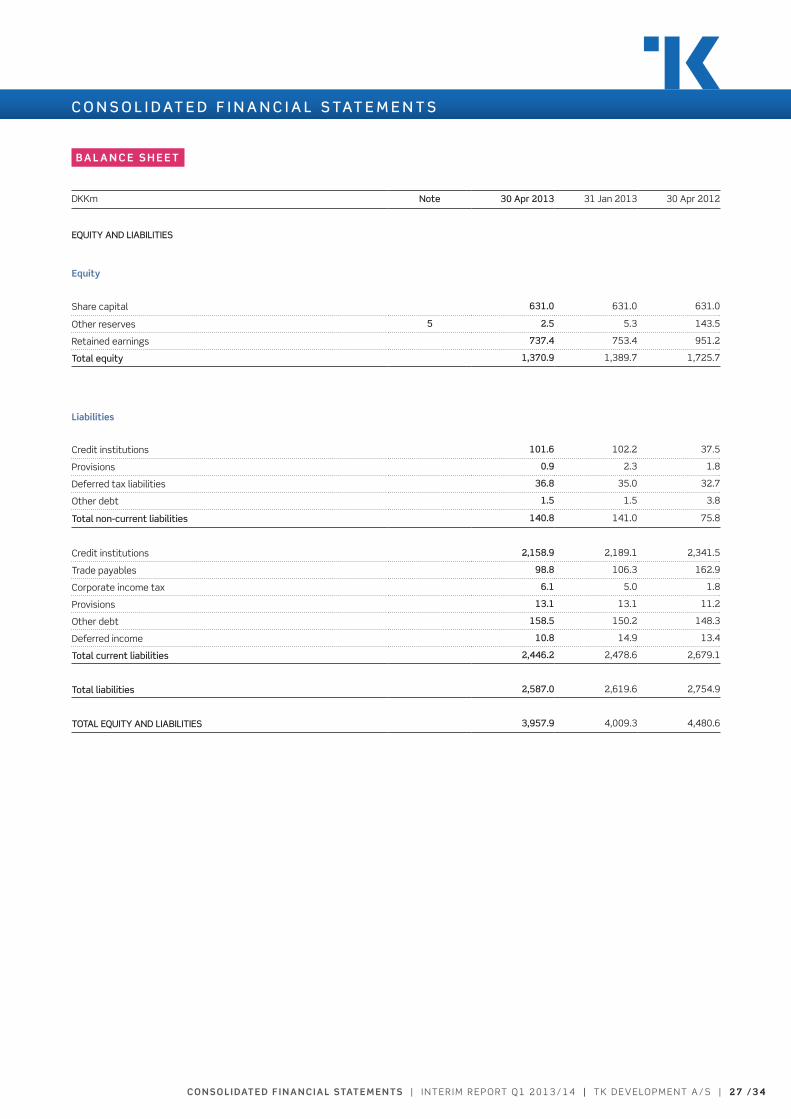
co n s o L I DAT E D f I n A n c I A L sTAT E m E n Ts | I n T e r I m r e p o rT Q 1 2 0 1 3 / 1 4 | T k D e v e lo pm e n T A / S | 2 7 / 3 4
C O N S O l I D AT E D f I N A N C I A l S TAT E M E N T S
B A L A n c E s h E E T
Dkkm Note 30 Apr 2013 31 Jan 2013 30 Apr 2012
EQUITY AND lIAbIlITIES
Equity
Share capital 631.0 631.0 631.0
other reserves 5 2.5 5.3 143.5
retained earnings 737.4 753.4 951.2
Total equity 1,370.9 1,389.7 1,725.7
Liabilities
Credit institutions 101.6 102.2 37.5
provisions 0.9 2.3 1.8
Deferred tax liabilities 36.8 35.0 32.7
other debt 1.5 1.5 3.8
Total non-current liabilities 140.8 141.0 75.8
Credit institutions 2,158.9 2,189.1 2,341.5
Trade payables 98.8 106.3 162.9
Corporate income tax 6.1 5.0 1.8
provisions 13.1 13.1 11.2
other debt 158.5 150.2 148.3
Deferred income 10.8 14.9 13.4
Total current liabilities 2,446.2 2,478.6 2,679.1
Total liabilities 2,587.0 2,619.6 2,754.9
TOTAl EQUITY AND lIAbIlITIES 3,957.9 4,009.3 4,480.6
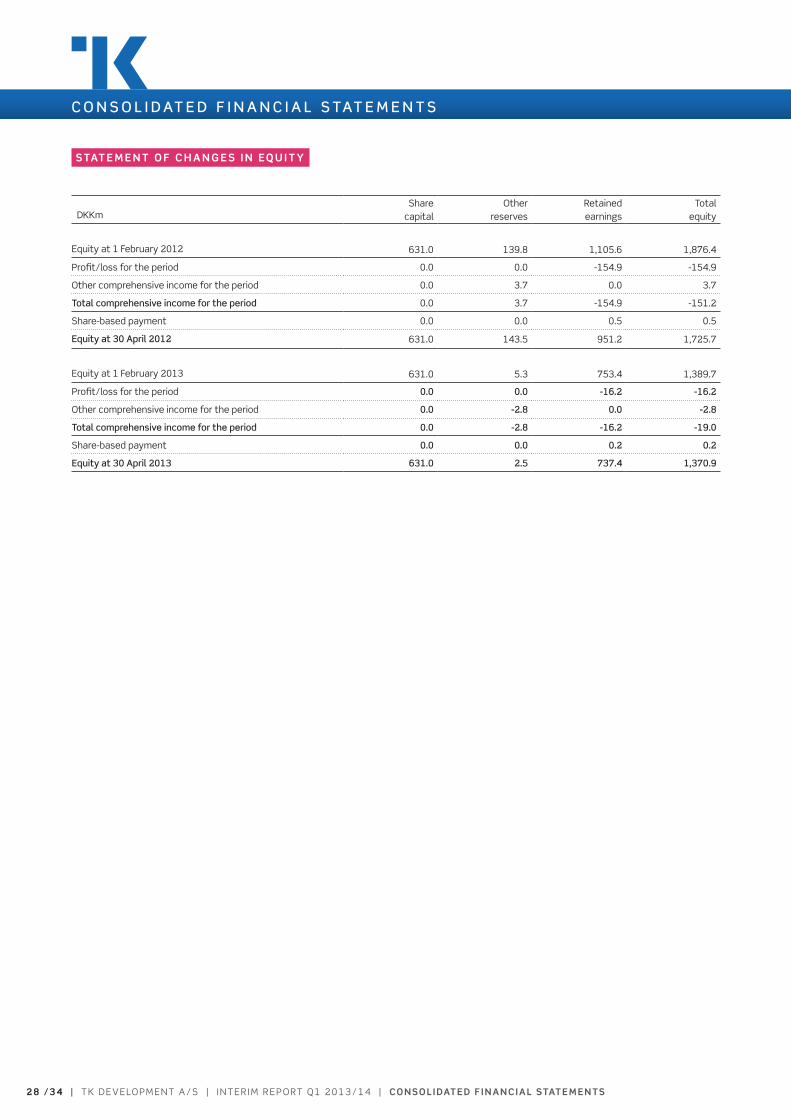
2 8 / 3 4 | T k D e v e lo pm e n T A / S | I n T e r I m r e p o rT Q 1 2 0 1 3 / 1 4 | co n s o L I DAT E D f I n A n c I A L sTAT E m E n Ts
C O N S O l I D AT E D f I N A N C I A l S TAT E M E N T S
s TAT E m E n T o f c h A n G E s I n Eq u I T Y
Dkkm Share
capitalother
reservesretained earnings
Total equity
equity at 1 February 2012 631.0 139.8 1,105.6 1,876.4
profit/loss for the period 0.0 0.0 -154.9 -154.9
other comprehensive income for the period 0.0 3.7 0.0 3.7
Total comprehensive income for the period 0.0 3.7 -154.9 -151.2
Share-based payment 0.0 0.0 0.5 0.5
Equity at 30 April 2012 631.0 143.5 951.2 1,725.7
equity at 1 February 2013 631.0 5.3 753.4 1,389.7
profit/loss for the period 0.0 0.0 -16.2 -16.2
other comprehensive income for the period 0.0 -2.8 0.0 -2.8
Total comprehensive income for the period 0.0 -2.8 -16.2 -19.0
Share-based payment 0.0 0.0 0.2 0.2
Equity at 30 April 2013 631.0 2.5 737.4 1,370.9
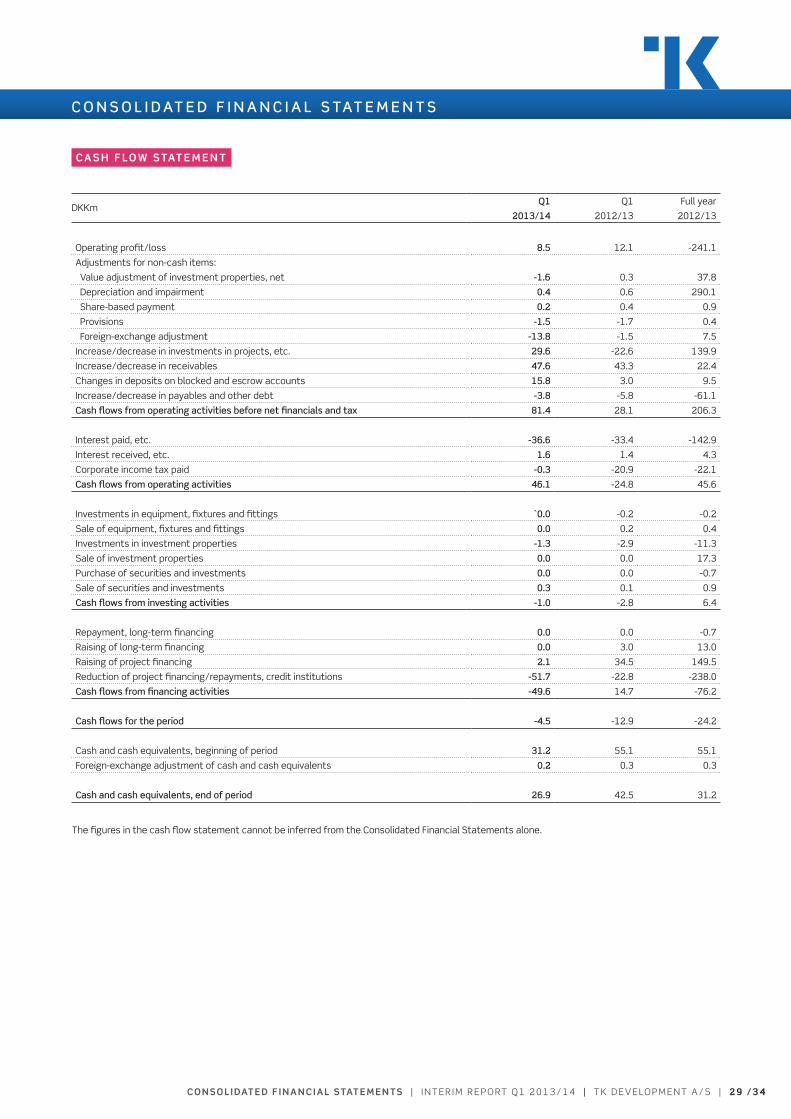
co n s o L I DAT E D f I n A n c I A L sTAT E m E n Ts | I n T e r I m r e p o rT Q 1 2 0 1 3 / 1 4 | T k D e v e lo pm e n T A / S | 2 9 / 3 4
C O N S O l I D AT E D f I N A N C I A l S TAT E M E N T S
cA s h f Lo w s TAT E m E n T
DkkmQ1
2013/14
Q1
2012/13
Full year
2012/13
operating profit/loss 8.5 12.1 -241.1
Adjustments for non-cash items:
value adjustment of investment properties, net -1.6 0.3 37.8
Depreciation and impairment 0.4 0.6 290.1
Share-based payment 0.2 0.4 0.9
provisions -1.5 -1.7 0.4
Foreign-exchange adjustment -13.8 -1.5 7.5
Increase/decrease in investments in projects, etc. 29.6 -22.6 139.9
Increase/decrease in receivables 47.6 43.3 22.4
Changes in deposits on blocked and escrow accounts 15.8 3.0 9.5
Increase/decrease in payables and other debt -3.8 -5.8 -61.1
Cash flows from operating activities before net financials and tax 81.4 28.1 206.3
Interest paid, etc. -36.6 -33.4 -142.9
Interest received, etc. 1.6 1.4 4.3
Corporate income tax paid -0.3 -20.9 -22.1
Cash flows from operating activities 46.1 -24.8 45.6
Investments in equipment, fixtures and fittings `0.0 -0.2 -0.2
Sale of equipment, fixtures and fittings 0.0 0.2 0.4
Investments in investment properties -1.3 -2.9 -11.3
Sale of investment properties 0.0 0.0 17.3
purchase of securities and investments 0.0 0.0 -0.7
Sale of securities and investments 0.3 0.1 0.9
Cash flows from investing activities -1.0 -2.8 6.4
repayment, long-term financing 0.0 0.0 -0.7
raising of long-term financing 0.0 3.0 13.0
raising of project financing 2.1 34.5 149.5
reduction of project financing/repayments, credit institutions -51.7 -22.8 -238.0
Cash flows from financing activities -49.6 14.7 -76.2
Cash flows for the period -4.5 -12.9 -24.2
Cash and cash equivalents, beginning of period 31.2 55.1 55.1
Foreign-exchange adjustment of cash and cash equivalents 0.2 0.3 0.3
Cash and cash equivalents, end of period 26.9 42.5 31.2
The figures in the cash flow statement cannot be inferred from the Consolidated Financial Statements alone.
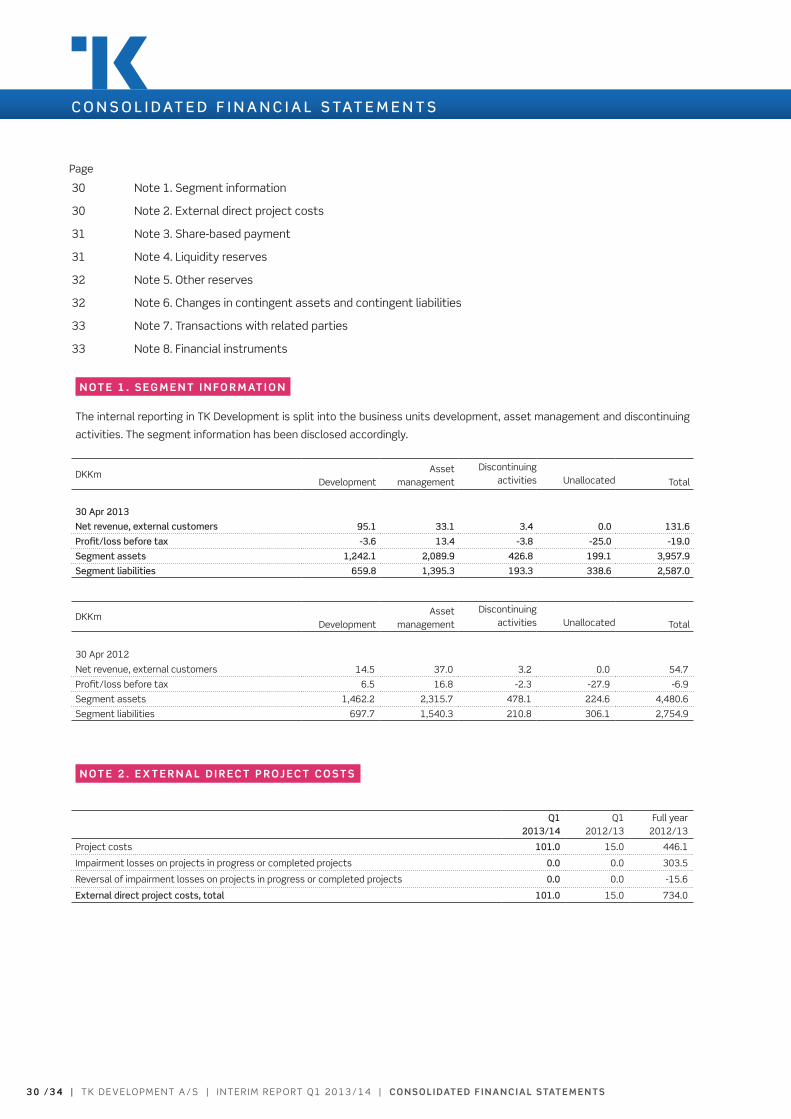
3 0 / 3 4 | T k D e v e lo pm e n T A / S | I n T e r I m r e p o rT Q 1 2 0 1 3 / 1 4 | co n s o L I DAT E D f I n A n c I A L sTAT E m E n Ts
n oT E 1 . s E G m E n T I n fo R m AT I o n
The internal reporting in Tk Development is split into the business units development, asset management and discontinuing
activities. The segment information has been disclosed accordingly.
DkkmDevelopment
Asset management
Discontinuingactivities Unallocated Total
30 Apr 2013
Net revenue, external customers 95.1 33.1 3.4 0.0 131.6
Profit/loss before tax -3.6 13.4 -3.8 -25.0 -19.0
Segment assets 1,242.1 2,089.9 426.8 199.1 3,957.9
Segment liabilities 659.8 1,395.3 193.3 338.6 2,587.0
DkkmDevelopment
Asset management
Discontinuingactivities Unallocated Total
30 Apr 2012
net revenue, external customers 14.5 37.0 3.2 0.0 54.7
profit/loss before tax 6.5 16.8 -2.3 -27.9 -6.9
Segment assets 1,462.2 2,315.7 478.1 224.6 4,480.6
Segment liabilities 697.7 1,540.3 210.8 306.1 2,754.9
n oT E 2 . E x T E R n A L D I R Ec T P R oj Ec T c o s T s
Q12013/14
Q1 2012/13
Full year2012/13
project costs 101.0 15.0 446.1
Impairment losses on projects in progress or completed projects 0.0 0.0 303.5
reversal of impairment losses on projects in progress or completed projects 0.0 0.0 -15.6
External direct project costs, total 101.0 15.0 734.0
page
C O N S O l I D AT E D f I N A N C I A l S TAT E M E N T S
30 note 1. Segment information
30 note 2. external direct project costs
31 note 3. Share-based payment
31 note 4. liquidity reserves
32 note 5. other reserves
32 note 6. Changes in contingent assets and contingent liabilities
33 note 7. Transactions with related parties
33 note 8. Financial instruments
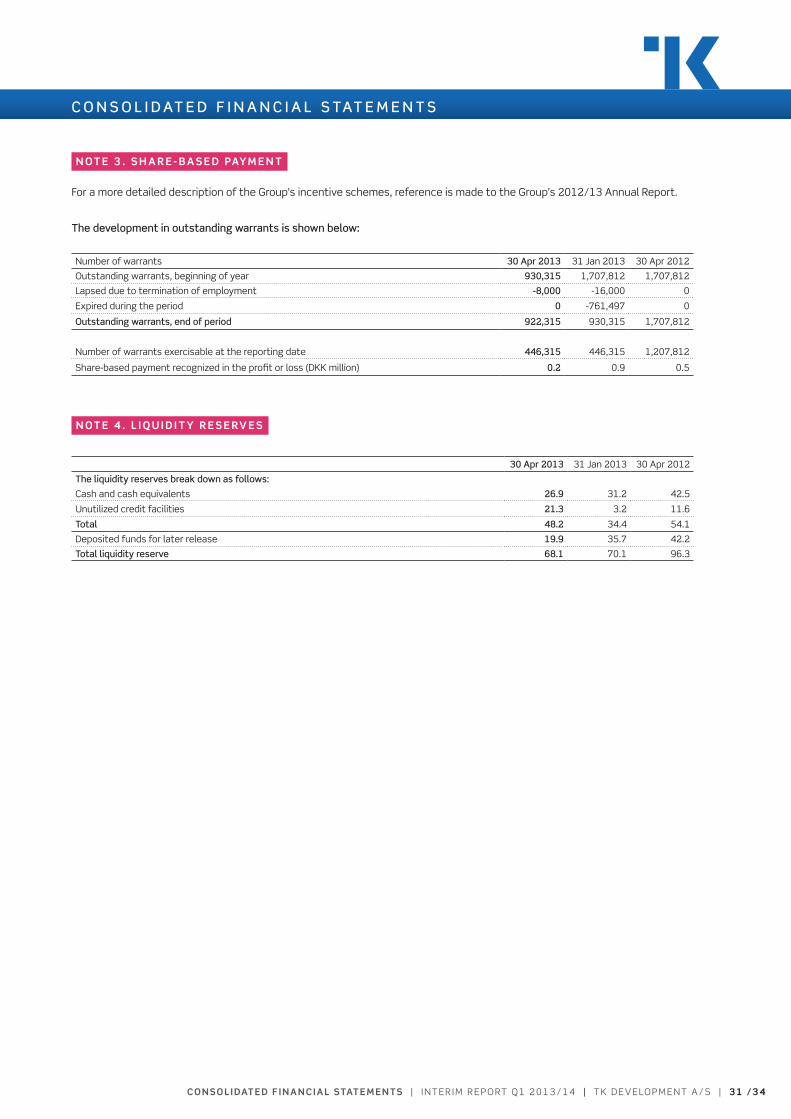
co n s o L I DAT E D f I n A n c I A L sTAT E m E n Ts | I n T e r I m r e p o rT Q 1 2 0 1 3 / 1 4 | T k D e v e lo pm e n T A / S | 3 1 / 3 4
n oT E 3 . s h A R E - B A s E D PAYm E n T
For a more detailed description of the Group’s incentive schemes, reference is made to the Group’s 2012/13 Annual report.
The development in outstanding warrants is shown below:
number of warrants 30 Apr 2013 31 Jan 2013 30 Apr 2012
outstanding warrants, beginning of year 930,315 1,707,812 1,707,812
lapsed due to termination of employment -8,000 -16,000 0
expired during the period 0 -761,497 0
Outstanding warrants, end of period 922,315 930,315 1,707,812
number of warrants exercisable at the reporting date 446,315 446,315 1,207,812
Share-based payment recognized in the profit or loss (Dkk million) 0.2 0.9 0.5
n oT E 4 . L I q u I D I T Y R E s E RV E s
30 Apr 2013 31 Jan 2013 30 Apr 2012
The liquidity reserves break down as follows:
Cash and cash equivalents 26.9 31.2 42.5
Unutilized credit facilities 21.3 3.2 11.6
Total 48.2 34.4 54.1
Deposited funds for later release 19.9 35.7 42.2
Total liquidity reserve 68.1 70.1 96.3
C O N S O l I D AT E D f I N A N C I A l S TAT E M E N T S
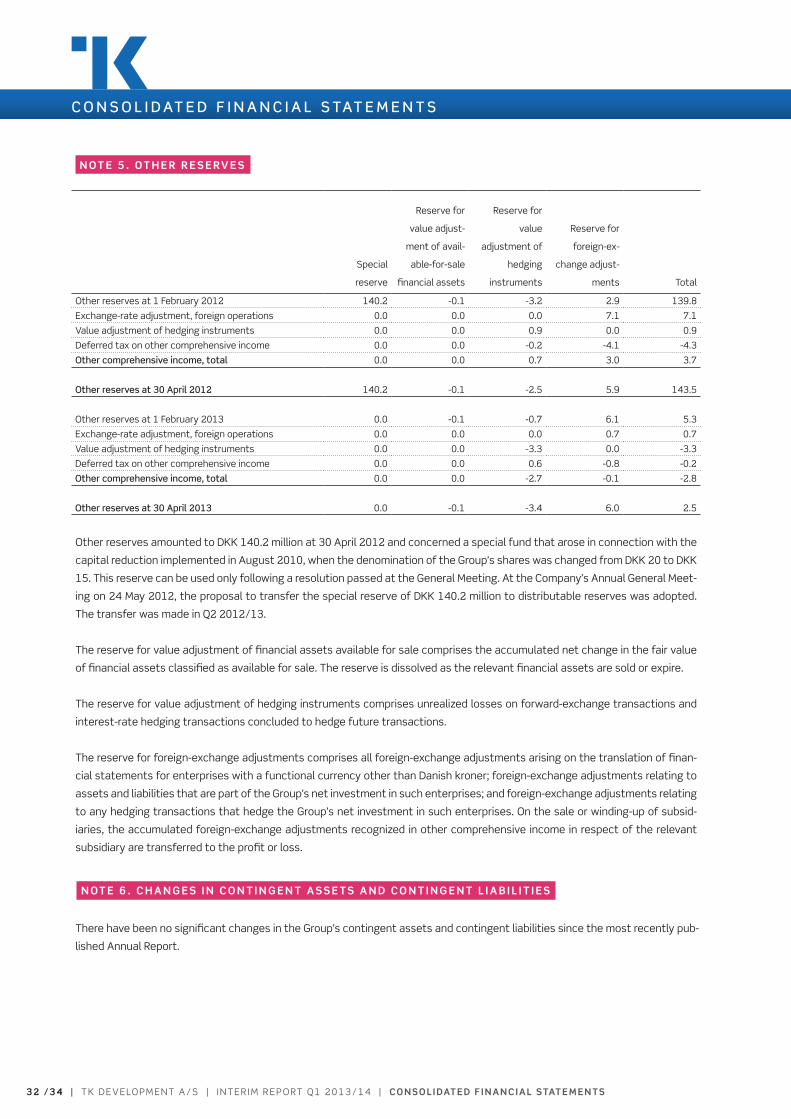
3 2 / 3 4 | T k D e v e lo pm e n T A / S | I n T e r I m r e p o rT Q 1 2 0 1 3 / 1 4 | co n s o L I DAT E D f I n A n c I A L sTAT E m E n Ts
n oT E 5 . oT h E R R E s E RV E s
Special
reserve
reserve for
value adjust-
ment of avail-
able-for-sale
financial assets
reserve for
value
adjustment of
hedging
instruments
reserve for
foreign-ex-
change adjust-
ments Total
other reserves at 1 February 2012 140.2 -0.1 -3.2 2.9 139.8
exchange-rate adjustment, foreign operations 0.0 0.0 0.0 7.1 7.1
value adjustment of hedging instruments 0.0 0.0 0.9 0.0 0.9
Deferred tax on other comprehensive income 0.0 0.0 -0.2 -4.1 -4.3
Other comprehensive income, total 0.0 0.0 0.7 3.0 3.7
Other reserves at 30 April 2012 140.2 -0.1 -2.5 5.9 143.5
other reserves at 1 February 2013 0.0 -0.1 -0.7 6.1 5.3
exchange-rate adjustment, foreign operations 0.0 0.0 0.0 0.7 0.7
value adjustment of hedging instruments 0.0 0.0 -3.3 0.0 -3.3
Deferred tax on other comprehensive income 0.0 0.0 0.6 -0.8 -0.2
Other comprehensive income, total 0.0 0.0 -2.7 -0.1 -2.8
Other reserves at 30 April 2013 0.0 -0.1 -3.4 6.0 2.5
other reserves amounted to Dkk 140.2 million at 30 April 2012 and concerned a special fund that arose in connection with the
capital reduction implemented in August 2010, when the denomination of the Group’s shares was changed from Dkk 20 to Dkk
15. This reserve can be used only following a resolution passed at the General meeting. At the Company’s Annual General meet-
ing on 24 may 2012, the proposal to transfer the special reserve of Dkk 140.2 million to distributable reserves was adopted.
The transfer was made in Q2 2012/13.
The reserve for value adjustment of financial assets available for sale comprises the accumulated net change in the fair value
of financial assets classified as available for sale. The reserve is dissolved as the relevant financial assets are sold or expire.
The reserve for value adjustment of hedging instruments comprises unrealized losses on forward-exchange transactions and
interest-rate hedging transactions concluded to hedge future transactions.
The reserve for foreign-exchange adjustments comprises all foreign-exchange adjustments arising on the translation of finan-
cial statements for enterprises with a functional currency other than Danish kroner; foreign-exchange adjustments relating to
assets and liabilities that are part of the Group’s net investment in such enterprises; and foreign-exchange adjustments relating
to any hedging transactions that hedge the Group’s net investment in such enterprises. on the sale or winding-up of subsid-
iaries, the accumulated foreign-exchange adjustments recognized in other comprehensive income in respect of the relevant
subsidiary are transferred to the profit or loss.
C O N S O l I D AT E D f I N A N C I A l S TAT E M E N T S
n oT E 6 . c h A n G E s I n c o n T I n G E n T A s s E T s A n D c o n T I n G E n T L I A B I L I T I E s
There have been no significant changes in the Group’s contingent assets and contingent liabilities since the most recently pub-
lished Annual report.
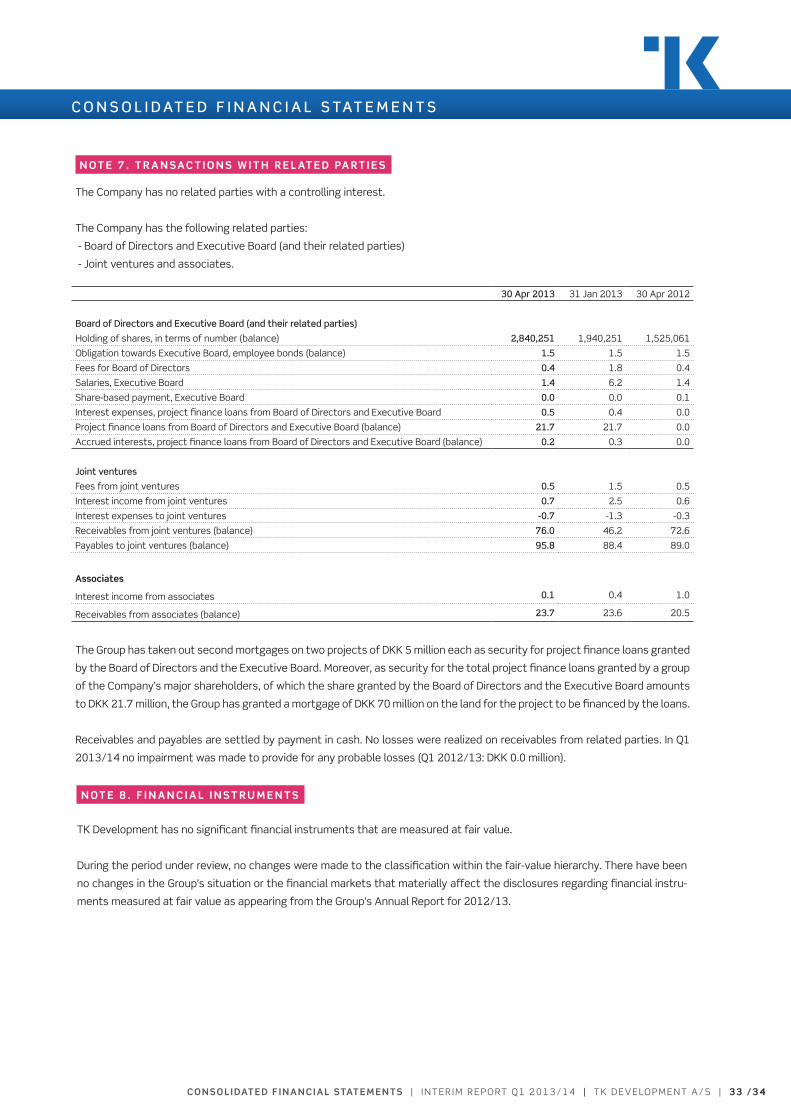
co n s o L I DAT E D f I n A n c I A L sTAT E m E n Ts | I n T e r I m r e p o rT Q 1 2 0 1 3 / 1 4 | T k D e v e lo pm e n T A / S | 3 3 / 3 4
n oT E 7 . T R A n sAc T I o n s w I T h R E L AT E D PA RT I E s
The Company has no related parties with a controlling interest.
The Company has the following related parties:
- Board of Directors and executive Board (and their related parties)
- Joint ventures and associates.
30 Apr 2013 31 Jan 2013 30 Apr 2012
board of Directors and Executive board (and their related parties)
Holding of shares, in terms of number (balance) 2,840,251 1,940,251 1,525,061
obligation towards executive Board, employee bonds (balance) 1.5 1.5 1.5
Fees for Board of Directors 0.4 1.8 0.4
Salaries, executive Board 1.4 6.2 1.4
Share-based payment, executive Board 0.0 0.0 0.1
Interest expenses, project finance loans from Board of Directors and executive Board 0.5 0.4 0.0
project finance loans from Board of Directors and executive Board (balance) 21.7 21.7 0.0
Accrued interests, project finance loans from Board of Directors and executive Board (balance) 0.2 0.3 0.0
Joint ventures
Fees from joint ventures 0.5 1.5 0.5
Interest income from joint ventures 0.7 2.5 0.6
Interest expenses to joint ventures -0.7 -1.3 -0.3
receivables from joint ventures (balance) 76.0 46.2 72.6
payables to joint ventures (balance) 95.8 88.4 89.0
Associates
Interest income from associates 0.1 0.4 1.0
receivables from associates (balance) 23.7 23.6 20.5
The Group has taken out second mortgages on two projects of Dkk 5 million each as security for project finance loans granted
by the Board of Directors and the executive Board. moreover, as security for the total project finance loans granted by a group
of the Company’s major shareholders, of which the share granted by the Board of Directors and the executive Board amounts
to Dkk 21.7 million, the Group has granted a mortgage of Dkk 70 million on the land for the project to be financed by the loans.
receivables and payables are settled by payment in cash. no losses were realized on receivables from related parties. In Q1
2013/14 no impairment was made to provide for any probable losses (Q1 2012/13: Dkk 0.0 million).
C O N S O l I D AT E D f I N A N C I A l S TAT E M E N T S
n oT E 8 . f I n A n c I A L I n s T R u m E n T s
Tk Development has no significant financial instruments that are measured at fair value.
During the period under review, no changes were made to the classification within the fair-value hierarchy. There have been
no changes in the Group’s situation or the financial markets that materially affect the disclosures regarding financial instru-
ments measured at fair value as appearing from the Group’s Annual report for 2012/13.
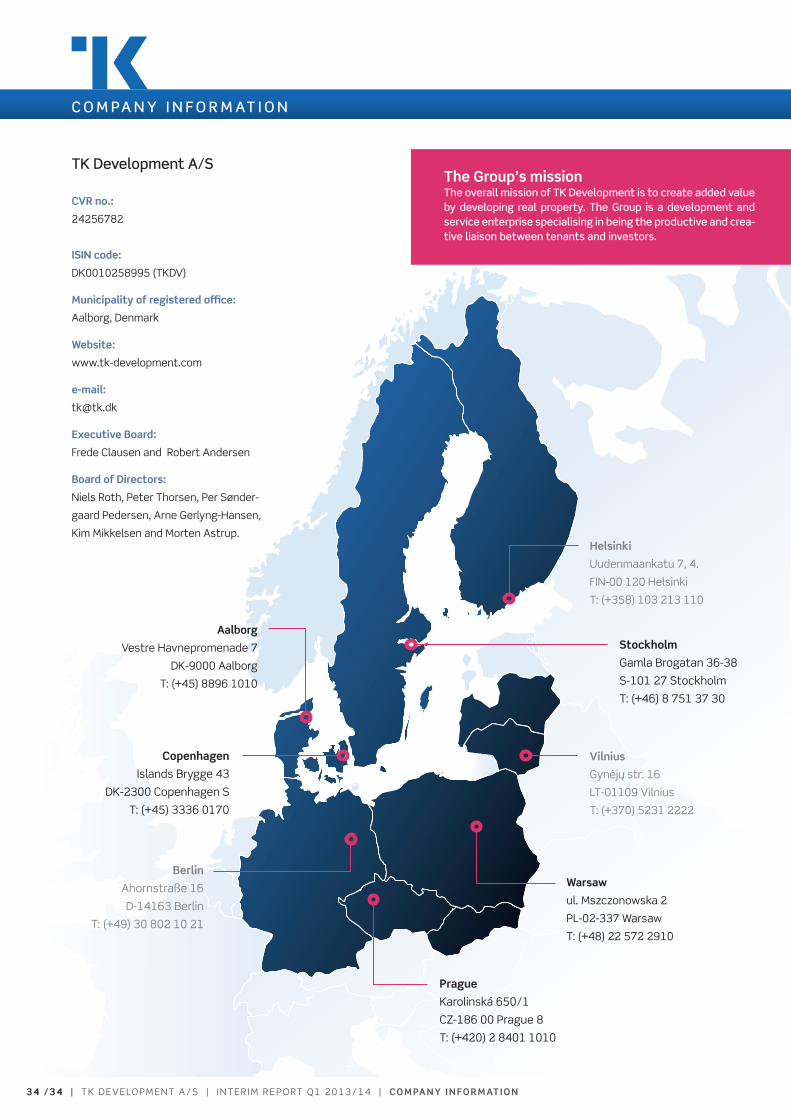
3 4 / 3 4 | T k D e v e lo pm e n T A / S | I n T e r I m r e p o rT Q 1 2 0 1 3 / 1 4 | com PA n Y I n fo R m AT I o n
Aalborg
vestre Havnepromenade 7
Dk-9000 Aalborg
T: (+45) 8896 1010
Berlin
Ahornstraße 16
D-14163 Berlin
T: (+49) 30 802 10 21
helsinki
Uudenmaankatu 7, 4.
FIn-00 120 Helsinki
T: (+358) 103 213 110
Vilnius
Gynėjų str. 16
lT-01109 vilnius
T: (+370) 5231 2222
warsaw
ul. mszczonowska 2
pl-02-337 Warsaw
T: (+48) 22 572 2910
Prague
karolinská 650/1
CZ-186 00 prague 8
T: (+420) 2 8401 1010
stockholm
Gamla Brogatan 36-38
S-101 27 Stockholm
T: (+46) 8 751 37 30
copenhagen
Islands Brygge 43
Dk-2300 Copenhagen S
T: (+45) 3336 0170
C O M PA N Y I N f O R M AT I O N
TK Development A/S
cVR no.:
24256782
IsIn code:
Dk0010258995 (TkDv)
municipality of registered office:
Aalborg, Denmark
website:
www.tk-development.com
e-mail:
Executive Board:
Frede Clausen and robert Andersen
Board of Directors:
niels roth, peter Thorsen, per Sønder-
gaard pedersen, Arne Gerlyng-Hansen,
kim mikkelsen and morten Astrup.
The Group’s missionThe overall mission of TK Development is to create added value by developing real property. The Group is a development and service enterprise specialising in being the productive and crea-tive liaison between tenants and investors.


