Embed Size (px)
Citation preview
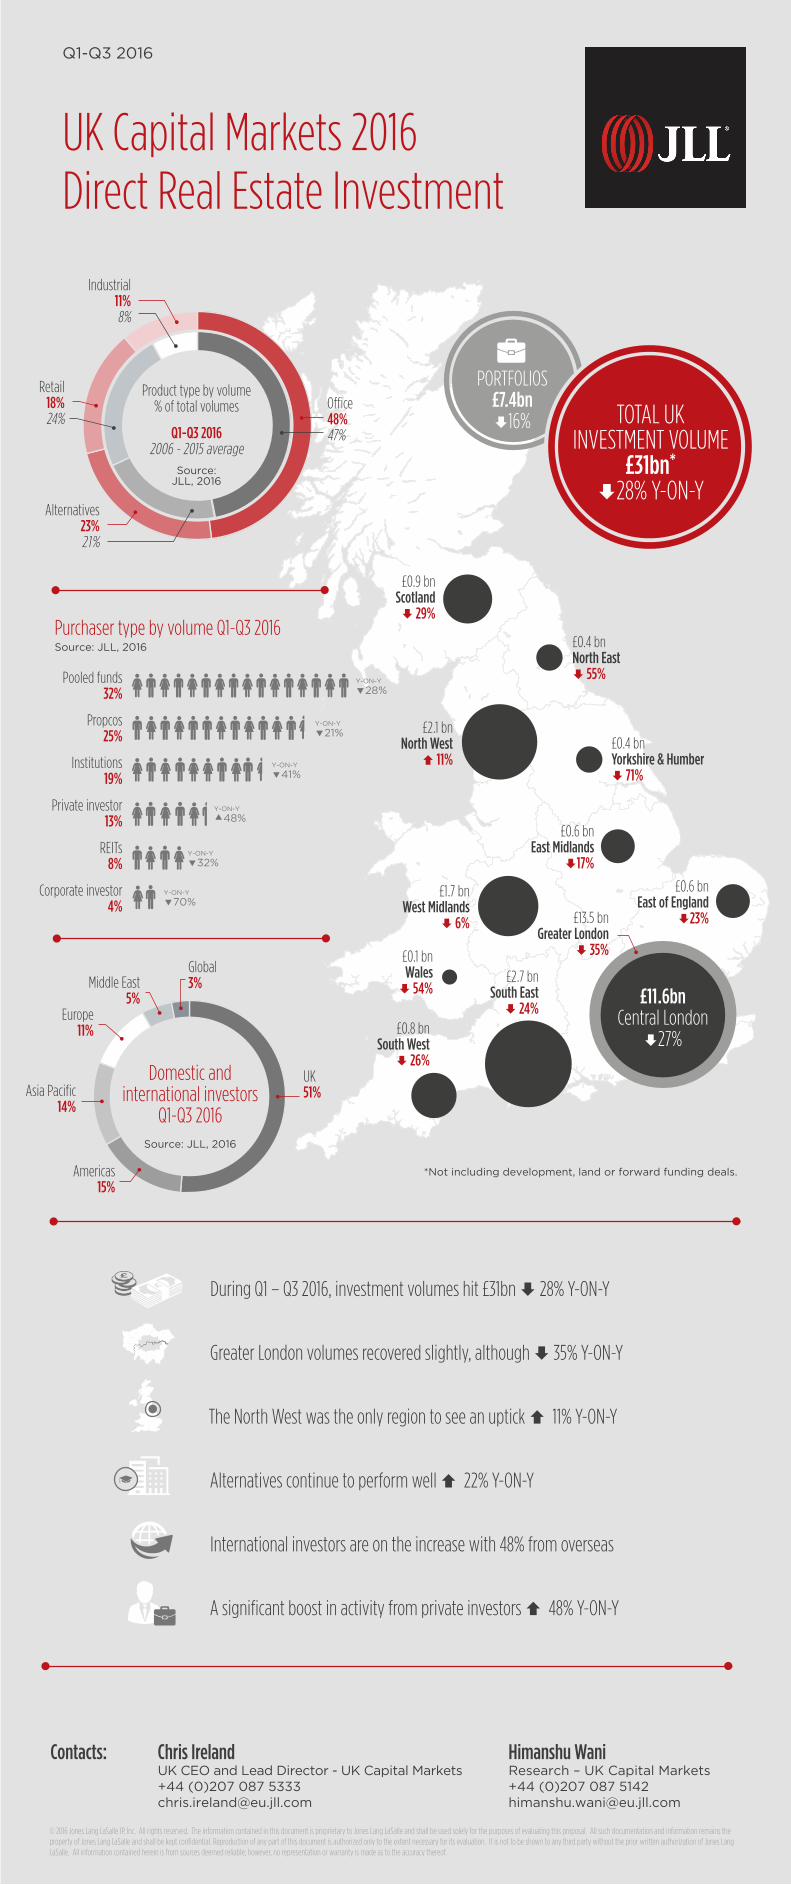
Pooled funds32%
Propcos25%
Institutions19%
Private investor13%
REITs8%
Corporate investor4%
Purchaser type by volume Q1-Q3 2016Source: JLL, 2016
£13.5 bnGreater London
È 35%
£0.6 bnEast of England
È23%
£2.7 bnSouth EastÈ 24%
£0.8 bnSouth WestÈ 26%
£0.1 bn WalesÈ 54%
£1.7 bnWest Midlands
È 6%
£0.6 bnEast Midlands
È17%
£0.4 bnYorkshire & HumberÈ 71%
£2.1 bnNorth West
Ç 11%
£0.9 bnScotlandÈ 29%
£0.4 bnNorth EastÈ 55%
Y-ON-Y
28%
Y-ON-Y
41%
Y-ON-Y
21%
Y-ON-Y
48%
Y-ON-Y
70%
Y-ON-Y
32%
£11.6bnCentral London
È27%
*Not including development, land or forward funding deals.
UK Capital Markets 2016 Direct Real Estate Investment
Q1-Q3 2016
Americas15%
Asia Pacific14%
Middle East5%
UK51%
Domestic and international investors
Q1-Q3 2016Source: JLL, 2016
Europe11%
Global3%
PORTFOLIOS£7.4bn È16% TOTAL UK
INVESTMENT VOLUME £31bn*
È28% Y-ON-Y
Chris IrelandUK CEO and Lead Director - UK Capital Markets+44 (0)207 087 [email protected]
Himanshu WaniResearch – UK Capital Markets+44 (0)207 087 [email protected]
Contacts:
© 2016 Jones Lang LaSalle IP, Inc. All rights reserved. The information contained in this document is proprietary to Jones Lang LaSalle and shall be used solely for the purposes of evaluating this proposal. All such documentation and information remains the property of Jones Lang LaSalle and shall be kept confidential. Reproduction of any part of this document is authorized only to the extent necessary for its evaluation. It is not to be shown to any third party without the prior written authorization of Jones Lang LaSalle. All information contained herein is from sources deemed reliable; however, no representation or warranty is made as to the accuracy thereof.
During Q1 – Q3 2016, investment volumes hit £31bn È 28% Y-ON-Y
Greater London volumes recovered slightly, although È 35% Y-ON-Y
The North West was the only region to see an uptick Ç 11% Y-ON-Y
Alternatives continue to perform well Ç 22% Y-ON-Y
International investors are on the increase with 48% from overseas
A significant boost in activity from private investors Ç 48% Y-ON-Y
Office48%47%
Alternatives23%21%
Industrial11%8%
Retail18%24%
Product type by volume % of total volumes
Q1-Q3 2016 2006 - 2015 average
Source: JLL, 2016