Embed Size (px)
Citation preview

HOW INDIVIDUAL CAPITAL REQUIREMENTS AFFECT CAPITALRATIOS IN UK BANKSAND BUILDING SOCIETIES
Documentos de Trabajo N.º 0515
Isaac Alfon, Isabel Argimón,and Patricia Bascuñana-Ambrós
2005

HOW INDIVIDUAL CAPITAL REQUIREMENTS AFFECT CAPITAL RATIOS IN UK BANKS AND
BUILDING SOCIETIES

HOW INDIVIDUAL CAPITAL REQUIREMENTS AFFECT CAPITAL
RATIOS IN UK BANKS AND BUILDING SOCIETIES(*)
Isaac Alfon(**)
CAPITAL MARKETS AND GOVERNANCE TEAM, HM TREASURY
Isabel Argimón(**)
RESEARCH DEPARTMENT, BANCO DE ESPAÑA
Patricia Bascuñana-Ambrós(**)
FINANCE, STRATEGY AND RISK DIVISION, FINANCIAL SERVICES AUTHORITY
(*) The paper is based on research undertaken while the authors were at the UK’s Financial Services Authority and published in Alfon et al. (2004a). We are grateful to Peter Andrews, Clive Briault, Malcolm Cook, Jonathan Fischel,Nadege Genetay, James McGregor, Jesus Saurina, Sarah Smith, and Andrew Sykes for their help and comments atdifferent stages of the project. The paper reflects our views and not the corporate views of the Financial ServicesAuthority, HM Treasury or Banco de España.
(**) Isabel Argimón. Banco de España. Tef. Number: +34 913385878. Fax Number: +34 913385486. E-mail: [email protected]
Documentos de Trabajo. N.º 0515
2005

The Working Paper Series seeks to disseminate original research in economics and finance. All papers have been anonymously refereed. By publishing these papers, the Banco de España aims to contribute to economic analysis and, in particular, to knowledge of the Spanish economy and its international environment. The opinions and analyses in the Working Paper Series are the responsibility of the authors and, therefore, do not necessarily coincide with those of the Banco de España or the Eurosystem. The Banco de España disseminates its main reports and most of its publications via the INTERNET at the following website: http://www.bde.es. Reproduction for educational and non-commercial purposes is permitted provided that the source is acknowledged. © BANCO DE ESPAÑA, Madrid, 2005 ISSN: 0213-2710 (print) ISSN: 1579-8666 (on line) Depósito legal: Imprenta del Banco de España

Abstract
The UK’s Financial Services Authority sets individual capital requirements that reflect its
assessment of risks and that are greater than the 8% minimum required by Basel. This
approach is similar to the supervisory review in Pillar II proposed in the new Basel Accord.
Using regulatory returns for UK banks and building societies, we empirically assess how
changing a firm’s individual capital requirement affects its capital ratio. We find that banks
faced with an increase in capital requirements transfer nearly 50% of the increase into
changes in their capital holdings, but only 20% if they face a reduction. The results are
different for building societies, where about 20% of either an increase or a decrease in capital
requirements is transferred into capital ratios.
Words: 5294.
Key words: Banks, building societies, capital requirements.

BANCO DE ESPAÑA 9 DOCUMENTO DE TRABAJO N.º 0515
1 Introduction
The UK’s Financial Services Authority (FSA) sets individual capital requirements for UK
banks1 and building societies2 in excess of the current Basel minimum of 8%. Most banks
and building societies hold considerably more capital than required by the FSA. This might
lead one to assume that changes in capital requirements do not affect the amount of capital
held, as the changes will be fully absorbed by this excess or buffer.
There is a growing empirical literature on the determinants of banks’ capital buffers.
It includes Furfine (2000) for US banks, Rime (2000) for Swiss banks, Kleff and Weber (2003)
for German banks, Ayuso et al. (2004) for Spanish banks, and Lindquist (2004) for Norwegian
banks. These papers focus on the capital buffers over the Basel minimum because the
regulators do not set individual capital requirements like in the UK. However, the buffer over
individual capital requirements in the UK might not be a decision variable and be just residual.
We analyse the determinants of UK firms’ capital ratios. Following Alfon et al. (2004)
we assume that firms’ capital ratios could be influenced by firms’ internal factors (e.g. the risk
preferences of managers), by market discipline exerted by shareholders and bondholders and
by the regulatory framework.3
Our research gathers evidence on the role of the FSA’s individual capital
requirements in determining the capital ratios of UK banks and building societies. In particular
we analyse empirically whether and how capital ratios are affected by individual capital
requirements.4 Ediz et al. (1998), exploring UK banks’ reactions to regulatory pressure, found
evidence that banks boost their capital ratios as soon as they fall to a certain level above the
regulatory minimum. Here, we quantify the impact of having individual capital requirements,
an arrangement that will be extended to most banks operating in countries that adopt the
new Basel Accord.
The paper is structured as follows. Section 2 sets out aspects of the UK framework
for individual capital requirements. Section 3 describes the data used. Section 4 presents our
empirical model. Section 5 summarises the estimation approach and discusses the results.
Section 6 concludes.
1. The term UK bank is used here as a bank that both operates in the UK and is incorporated in the UK. We therefore exclude UK branches of foreign banks. 2. A building society is a mutual organisation whose main activity is mortgage lending for house purchase, financed mainly but not exclusively by taking deposits from retail customers. 3. See Alfon et al. (2004a) for a review of these factors and Alfon et al. (2004b) for a summarised qualitative analysis of the factors’ relevance for UK banks and building societies, based on interviews. 4. Banks and building societies also accumulate provisions against loan default. These provisions protect against expected losses and are likely to vary over time, Pain (2003). Provisions are therefore different from capital, which should provide a buffer against unexpected losses. Decisions about provisions and capital are unlikely to be independent. For example, Laeven and Majnoni (2002) explore the relationship between capital and provisions and find that banks tend to delay provisioning for bad loans, thereby possibly magnifying the economic cycle’s impact on capital. Further research may be needed to explore the relationship between capital and provisions in the UK.

BANCO DE ESPAÑA 10 DOCUMENTO DE TRABAJO N.º 0515
2 Framework for capital requirements in the UK
A regulator may set a capital requirement with the explicit intention that banks always operate
with a higher capital ratio. In fact, this is the intention behind the 8% ratio of the current Basel
Accord, BCBS (1999). In the UK, the regulator sets individual capital requirements in excess
of the 8% as minima with the expectation that firms will always exceed even them.
The FSA inherited from the Bank of England the practice of setting two separate
capital requirements for each bank: a ‘trigger ratio’ and a higher ‘target ratio’. The trigger ratio
was a minimum capital ratio for the bank that would trigger regulatory intervention if
breached. The target ratio was to act as a warning light and as a cushion of capital to help
prevent an accidental breach of the trigger ratio. For building societies, the Building Societies
Commission set ‘threshold ratios’ that corresponded to banks’ trigger ratios.
Following the Financial Services and Markets Act, which came into force in 2001,
the FSA stopped setting target ratios for banks and said that it would “consider it to be good
management practice in the financial services industry for a UK bank to hold an appropriate
capital buffer above the individual capital ratio advised by the FSA”, FSA (2001). At the same
time, the FSA published details about the factors that it would take into account when setting
banks’ individual capital requirements, risk being the main factor, FSA (2001). The FSA also
announced that it was reviewing banks’ individual capital requirements to make them
consistent with the new framework. A similar review took place for building societies.
Three broad characteristics underlie the UK regulatory system for banks
and building societies throughout the period analysed: individual capital requirements
are set at firm-specific level; the FSA may at any time vary a firm’s requirement; and
individual capital requirements exceed the Basel minimum of 8% for all banks and building
societies. The “FSA considers that the basic 8% regulatory minimum capital requirement is
only appropriate for a well-diversified firm whose business, management, systems and
controls are strong and where the risks that it is exposed to are captured adequately by the
existing capital model”, FSA (2001). In fact, the Basel Committee of Banking Supervision,
BCBS (1999), recognised as weaknesses of the current system its poor risk sensitivity, its
difficulty in covering all risks and its inability to provide the right incentives for good risk
management practices.5 These views are shared by many analysts, for example, Milne (2001)
and Oliver, Wyman & Company (2001).
5. BCBS (1999) also acknowledged that the requirements mostly deal with credit and market risks: “While the original Accord focused mainly on credit risk, it has since been amended to address market risk. Interest rate risk in the banking book and other risks, such as operational, liquidity, legal and reputational risks, are not explicitly addressed. Implicitly, however, the present Accord takes account of such risks by setting a minimum ratio that has an acknowledged buffer to cover unquantified risks.”

BANCO DE ESPAÑA 11 DOCUMENTO DE TRABAJO N.º 0515
3 Data used
We use data from the prudential returns submitted to the FSA by building societies and UK
banks. For building societies we use quarterly data from the second quarter of 1997 to the
second quarter of 2002, constituting a balanced panel dataset.6 For banks we use quarterly
data from the third quarter of 1998 to the third quarter of 2002. Banks report at different
months. In some cases their reporting pattern is not regular and some have changed it during
the period analysed. It is therefore an unbalanced panel dataset that in most cases does not
contain information about income and expenditure (profit and loss account data).7
Tables 1 and 2 summarise the main statistics of the variables used in analysing
building societies and banks respectively. A comparison of the tables shows much higher
unweighted average capital ratios and regulatory capital requirements for banks than for
building societies.
The tables also show that, with the exception of the building society proxy for the
return on equity, all variables show more dispersion across firms than within a given firm over
time.8 In many instances, the differences among firms are four times larger than the
differences over time for a given firm. The dispersion is greater for actual capital ratios than for
required regulatory ratios, suggesting that the market discipline and management preferences
differentiate more between firms than the regulator. Dispersion in capital ratios is much lower
for building societies than for banks, which could indicate that the former are more
homogeneous.
Table 3 summarises some statistics where the data are weighted by size. We use
two measures of size: 1) total assets and 2) risk-weighted assets, with the weights used in
the current Accord. The table shows that, weighted by total assets, the average capital ratio
for banks is nearly 50% above the average individual capital requirements set by the FSA
(35% if weighted by risk-weighted assets). This rises to over 85% for banks without trading
book activity (40% if weighted by risk-weighted assets).9 It must be taken into account that
banks that have a trading book are larger than the average bank and most of them have
a non-UK parent. On the other hand, building societies hold a weighted average about 31%
more than individually required. Building societies’ weighted average buffer (i.e. capital minus
individual capital required, as a percentage of individual capital required) is below that for
banks. The weighted averages of actual capital ratios and buffers are much lower than the
unweighted averages, indicating that larger firms tend to have lower capital ratios and smaller
buffers.
As Figure 1 shows, over the period banks increased their buffer. Building societies
maintained theirs at a steady level. The differences in capital ratios amongst banks have
reduced in the same period. The pattern for building societies seems to be the contrary, as
the dispersion has increased, especially since 2000.10
6. These returns include both capital statements and the income and expenditure account. 7. We have excluded observations of banks where the capital ratio or the capital requirement is missing, where the capital ratio is shown as exceeding 500% of risk-weighted assets, or where more than 100% is obtained for the proportion of total assets that attract a 100% risk-weight or the proportion of commercial and retail deposits to total deposits. We have also excluded two observations with capital ratios at or below the required minimum level, as these banks would have been subject to intervention by the supervisory authorities. 8. The mean of the ROE for the minority of banks for which data are available is 6.88%. 9. The trading book consists of securities, foreign exchange, commodities positions, and derivatives that are held for a short term trading purpose. 10. The coefficient of variation (CV) of banks’ individual capital requirements in 1998 was 0.59. It dropped to 0.42 at the end of 2000 and 0.27 in 2002. For building societies, the CV shows the reverse pattern: from 0.04 in 1997 to 0.08 in 2002.
BANCO DE ESPAÑA 12 DOCUMENTO DE TRABAJO N.º 0515
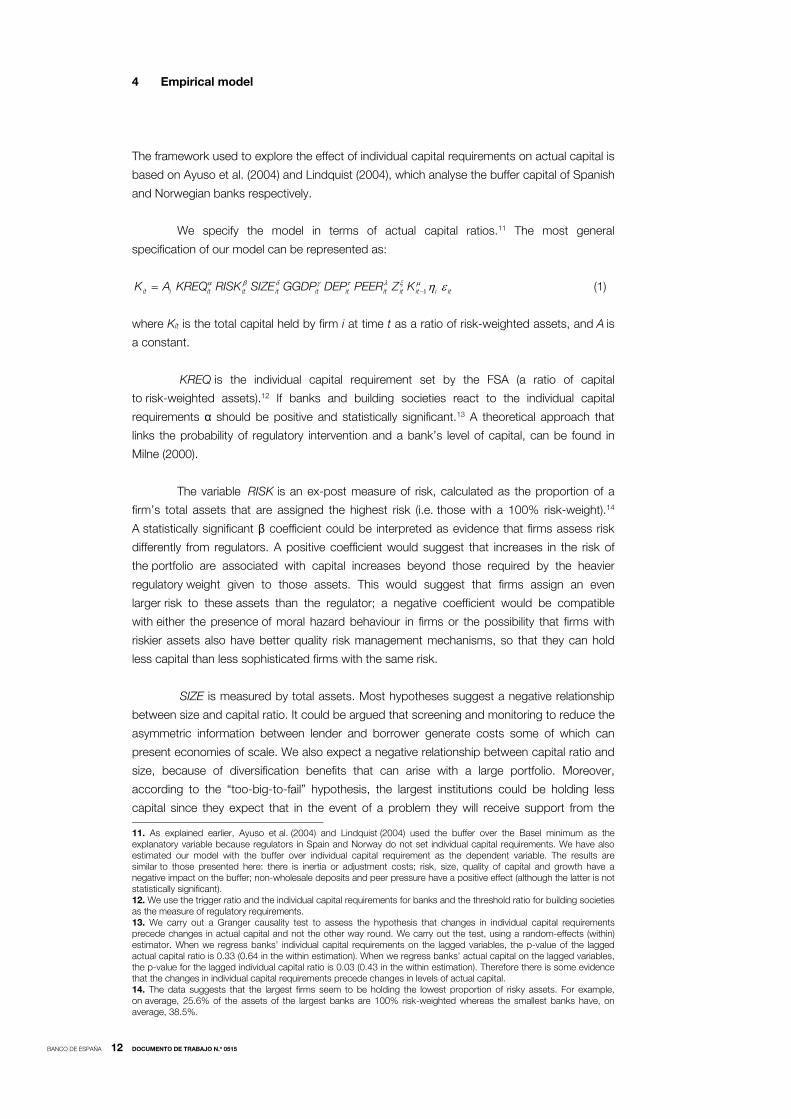
4 Empirical model
The framework used to explore the effect of individual capital requirements on actual capital is
based on Ayuso et al. (2004) and Lindquist (2004), which analyse the buffer capital of Spanish
and Norwegian banks respectively.
We specify the model in terms of actual capital ratios.11 The most general
specification of our model can be represented as:
1it i it it it it it it it it i itK A KREQ RISK SIZE GGDP DEP PEER Z Kα β δ γ τ λ ξ µ η ε−= (1)
where Kit is the total capital held by firm i at time t as a ratio of risk-weighted assets, and A is
a constant.
KREQ is the individual capital requirement set by the FSA (a ratio of capital
to risk-weighted assets).12 If banks and building societies react to the individual capital
requirements α should be positive and statistically significant.13 A theoretical approach that
links the probability of regulatory intervention and a bank’s level of capital, can be found in
Milne (2000).
The variable RISK is an ex-post measure of risk, calculated as the proportion of a
firm’s total assets that are assigned the highest risk (i.e. those with a 100% risk-weight).14
A statistically significant β coefficient could be interpreted as evidence that firms assess risk
differently from regulators. A positive coefficient would suggest that increases in the risk of
the portfolio are associated with capital increases beyond those required by the heavier
regulatory weight given to those assets. This would suggest that firms assign an even
larger risk to these assets than the regulator; a negative coefficient would be compatible
with either the presence of moral hazard behaviour in firms or the possibility that firms with
riskier assets also have better quality risk management mechanisms, so that they can hold
less capital than less sophisticated firms with the same risk.
SIZE is measured by total assets. Most hypotheses suggest a negative relationship
between size and capital ratio. It could be argued that screening and monitoring to reduce the
asymmetric information between lender and borrower generate costs some of which can
present economies of scale. We also expect a negative relationship between capital ratio and
size, because of diversification benefits that can arise with a large portfolio. Moreover,
according to the “too-big-to-fail” hypothesis, the largest institutions could be holding less
capital since they expect that in the event of a problem they will receive support from the 11. As explained earlier, Ayuso et al. (2004) and Lindquist (2004) used the buffer over the Basel minimum as the explanatory variable because regulators in Spain and Norway do not set individual capital requirements. We have also estimated our model with the buffer over individual capital requirement as the dependent variable. The results are similar to those presented here: there is inertia or adjustment costs; risk, size, quality of capital and growth have a negative impact on the buffer; non-wholesale deposits and peer pressure have a positive effect (although the latter is not statistically significant). 12. We use the trigger ratio and the individual capital requirements for banks and the threshold ratio for building societies as the measure of regulatory requirements. 13. We carry out a Granger causality test to assess the hypothesis that changes in individual capital requirements precede changes in actual capital and not the other way round. We carry out the test, using a random-effects (within) estimator. When we regress banks’ individual capital requirements on the lagged variables, the p-value of the lagged actual capital ratio is 0.33 (0.64 in the within estimation). When we regress banks’ actual capital on the lagged variables, the p-value for the lagged individual capital ratio is 0.03 (0.43 in the within estimation). Therefore there is some evidence that the changes in individual capital requirements precede changes in levels of actual capital. 14. The data suggests that the largest firms seem to be holding the lowest proportion of risky assets. For example, on average, 25.6% of the assets of the largest banks are 100% risk-weighted whereas the smallest banks have, on average, 38.5%.

BANCO DE ESPAÑA 13 DOCUMENTO DE TRABAJO N.º 0515
regulator. A negative relationship would also result if small firms had more difficulties
accessing capital markets when faced with stressful situations and preferred to hold a higher
level of capital overall than large firms did. Small firms could have proportionally larger
adjustment costs. A negative relationship between size and capital ratio could also support
the hypothesis of market signalling, whereby small firms might use their capital as a
mechanism to show the market their soundness or their prudence. It could also support the
hypothesis that small firms need slack to finance their long-term strategies.
Economic conditions may also affect the overall level of capital, see Borio
et al. (2001). GGDP tries to capture the role of the cycle and is measured as the real annual
GDP growth rate by quarter. We expect that in a downturn, when risks are more likely to
materialise, actual capital ratios may decrease as a result of write-offs and because of
increases in specific provisions. Moreover, the default probabilities of loans and the value
of collateral could be highly correlated, since when the market turns down many participants
might want to sell assets at the same time. A macroeconomic downturn will lead to a
deterioration in ratings and hence to additional demands on capital for those firms using
ratings to assess their loans’ risks and to decide on capital. In an upturn, risk reduces and
firms can safely hold less capital than in a downturn. If actual capital is pro-cyclical, we expect
the coefficient of GGDP to have a negative sign.
For each period t and firm i, the variable PEER is the average capital ratio of all firms,
except firm i, that report at time t and that are of similar size to firm i.15 It tries to capture peer
pressure as its existence could imply that there is a kind of herd effect.16 If this effect exists,
we would expect the coefficient of PEER to be positive.
DEP is the proportion of commercial and retail deposits (i.e. non-interbank deposits)
over total deposits. Only retail deposits up to certain limits fall within the scope of deposit
compensation scheme so this variable is included to capture the relevance of
deposit insurance. For example, Nier and Bauman (2003) find that a higher share of uninsured
funding leads banks to choose a larger capital buffer for a given risk, so the larger the amount
of insured funding, the weaker the market discipline could be. A negative coefficient of
DEP could be regarded as evidence of moral hazard behaviour by firms.
Other variables, denoted generically as Z , have also been included in the estimation
depending on their availability and relevance. For building societies, return on equity, ROE , is
included as a proxy for the cost of capital. It is measured as the proportion of profits over
capital. We expect the sign of the coefficient to be negative. As already mentioned, this
variable could not be constructed for most banks as their returns do not include the relevant
data.
For banks, we include as part of Z the variable TRADE as a proxy for the amount
of trading book activity. It is measured as the proportion of the trading book’s notional
risk-weighted assets over total risk-weighted assets. It is included as it could be argued that
the risk associated with these activities could have different implications for capital than does
credit risk. The variable could capture business differences associated with trading activities in
the firms' overall portfolio.17 We also include FOREIGN. This is a trend dummy variable that
takes the value of 1 if the country of origin of the bank’s parent is the UK and 0 otherwise.
15. Firms are grouped by quartile. 16. Lindquist (2004) proposes a similar measure, although not grouping firms by size. 17. The average proportion of assets in the trading book was 2.3% for UK-owned banks, 13.3% for other EU-owned banks, 17.1% for US-owned banks and 12.2% for other foreign banks.

BANCO DE ESPAÑA 14 DOCUMENTO DE TRABAJO N.º 0515
The hypothesis that there are adjustment costs in attaining the desired level of capital
is captured by the inclusion of the dependent variable lagged one period.
Finally, ηi is an unobservable variable that captures the idiosyncratic features
of each firm that are constant over time but vary from firm to firm. These could cover
management’s aversion to regulatory risk, management’s strategy for new business
opportunities and management’s freedom from shareholders. εit is a random shock.

BANCO DE ESPAÑA 15 DOCUMENTO DE TRABAJO N.º 0515
5 Estimation and empirical results
In order to carry out the estimation, we re-specify equation 1 in logs, so that it becomes:
itiitit
itittititititit
kzpeerdepggdpsizeriskkreqak
εηµξλτγδβα
++++++++++=
−1
(2)
where the lower case names indicate all variables are in logs.
We treat risk, dep, trade and roe as endogenous. As the lagged endogenous
variable is included among the regressors, we transform the equation into first differences
and estimate it with a GMM estimator. We use as instruments the lagged levels of the
dependent variable and of the endogenous variables (second, third and fourth lags), and
the lagged differences of the exogenous variables. We report the estimated coefficients
and robust standard errors from the robust first-step estimators. We also report the Sargan
test of over-identifying restrictions and autocorrelation tests of first and second order.18
Table 4 presents the results from the dataset for building societies. Column 1 reports
the results for the whole sample. Columns 2 and 3 report the results for building societies that
have experienced an increase or decrease respectively in their individual capital requirements.
The last column shows the results for building societies with buffers in the lowest quartile.
Table 5 shows the results for banks. Column 1 shows the results for the whole
sample. Column 2 shows the results for banks with a trading book. Columns 3 and 4 show
the results for banks that have experienced an increase and a decrease respectively in their
individual capital requirements. 33 banks have experienced both increases and decreases in
their requirements during the period considered and are therefore included in both columns.
Column 5 shows the results for banks with the lowest buffers (those in the lowest quartile).
None of the estimated equations in Tables 4 and 5 can reject the Sargan test
of over-identifying restrictions. They all show the adequate properties in the face of
autocorrelation: they show first order autocorrelation but the hypothesis of no second order
autocorrelation can not be rejected in all cases.
We find that size has a negative effect on capital, so the larger the firm the lower its
capital ratio. This negative relationship could be consistent with any of the hypotheses
discussed above under “size”. The current specification does not allow for a unique
interpretation.
The relationship between capital ratios and the proposed measure of ex-post risk is
estimated to be negative, so the higher the risk appetite of a firm, the less capital it holds.
Evidence of a negative risk effect is also obtained in Ayuso et al. (2004) and Lindquist (2004).
This result could support the hypothesis that there is moral hazard in firms’ behaviour.
However, this interpretation is not consistent with the positive relationship estimated between
capital and the ratio of partially insured deposits over total deposits plus capital holdings.
18. Using data on first differences, we should observe first order autocorrelation and no second order autocorrelation.

BANCO DE ESPAÑA 16 DOCUMENTO DE TRABAJO N.º 0515
It could be argued that firms with riskier assets also have better quality systems and controls
allowing them to be comfortable with less capital for a given risk.19
We find a negative and significant relationship between the economic cycle and the
capital ratio for banks. The results are consistent with those reported in Ayuso et al. (2004) for
buffers of Spanish banks. Not surprisingly, for building societies the results are less clear: the
estimated coefficient is negative but not significant. We also find evidence that peer pressure
affects the capital ratio of all types of firm considered, although the coefficient is not very high.
This is broadly consistent with Lindquist (2004). This suggests that firms may be using the
capital ratio as a signalling device.
For banks with a trading book, we estimate a negative relationship between the
value of assets in the trading book and the capital ratio. Again it could suggest that firms with
a trading book value risks differently from firms without, perhaps because assets in the
trading book are more liquid than in the banking book.
The coefficient of the cost of capital for building societies is estimated to be
positive and statistically significant –a result which is difficult to interpret–. However, when
we exclude the lagged capital ratio (a proxy for adjustment costs), we find a weak and
negative relationship between roe and capital ratio.20 A possible explanation is that profits are
the main source of capital for building societies, so that the proxy used in the estimation for
the cost of capital is not appropriate. For the banks that include profit and loss data in their
returns, the estimated coefficient of the return on equity is positive and not statistically
significant. The role of the cost of capital and the need to find a meaningful proxy for it need
to be explored further.
We might also expect that firms whose actual capital ratio is closer to their individual
capital requirement would react more strongly to changes in capital requirements, because
of the greater risk of breaching the requirement, Ediz et al. (1998). To test this hypothesis,
we estimate the equation for groups of firms defined according to their buffer. For the lowest
quartile, we find that the estimated coefficient is higher for banks and building societies with
low buffers than for the average bank. In other words, firms with small buffers react more to a
given change in individual capital requirements.21 The estimated coefficient for banks with low
buffers is higher than the coefficient for building societies with low buffers. This suggests that
the banks with the lowest buffers react more than building societies with the lowest buffers to
changes to individual capital requirements.
For both building societies and banks we obtain a significant and positive
relationship between individual capital requirements and actual capital ratios, indicating
that the higher the required individual capital ratio the higher the actual capital ratio. The
short term coefficients range from 0.28 for all banks to 0.43 for banks engaged in trading
activities. The long term coefficients are 0.41 and 0.61 respectively. For building societies the
short term coefficient is 0.18 and the long term one is 0.29. So there is never a one-to-one
response. These figures suggest that, in general, much less than 50% of changes in individual
capital requirements are translated into changes in the capital ratio. In other words, the buffer
tends to absorb most of any change in the requirements. 19. Rather similar results were obtained when we proxied risk by the ratio of Tier one capital over total eligible capital and when we used other definitions of risks such as the ratio of highest risk assets over risk-weighted assets, the proportion of assets weighted at 50% or proportion of risk-weighted assets to total assets. 20. The estimated coefficient is negative and statistically significant at the 20% level of confidence. 21. In general terms, firms with a large buffer do not seem to react to changes in the required capital: the coefficient of individual capital requirement is either not statistically significant or much lower than for firms whose capital is closer to the regulator’s requirement.

BANCO DE ESPAÑA 17 DOCUMENTO DE TRABAJO N.º 0515
In order to assess the robustness of these results we test for asymmetric
responses to changes in capital requirements. When the sample is split between firms that
have experienced an increase in their required capital ratio during the period analysed and
firms that have experienced a decrease, the results show different responses to changes. In
particular, banks that have experienced an increase in their requirements raise their actual
capital ratio by 50% of the increase in the requirement in the short term and by nearly 71% in
the long term. For banks that have experienced a decrease, the adjustment is around 20%.
This result seems to suggest that banks are more concerned with the possibility of regulatory
breach than with the additional costs associated with holding excess capital.22 Building
societies react similarly to increases and reductions in regulatory capital requirements. Under
both circumstances the buffer absorbs 80% of the change and the building society changes
its capital holdings by 20%.
22. The lack of statistical significance of roe mentioned earlier could support such an interpretation. However, as already pointed out, the results obtained for roe must be treated with caution.

BANCO DE ESPAÑA 18 DOCUMENTO DE TRABAJO N.º 0515
6 Conclusions
Our main finding is that, although firms have a buffer over individual capital
requirements, changes in the individual capital requirements are very likely to be accompanied
by some response in the capital ratio. For example, if a bank (building society) which is
holding capital at 15% of risk-weighted assets has its individual required capital ratio
increased from 10% to 11%, it would on average increase its actual capital ratio at least
to 15.4%.
The evidence shows that firms operating close to their individual capital requirement
are more sensitive to changes in regulatory capital than firms with a large buffer. As the firms
with smaller buffers are generally large banks, it could be argued that changes in individual
capital requirements will affect them more than they will affect smaller banks. The firm’s
degree of risk aversion will influence the final impact as firms with riskier assets seem to hold
less capital.
The implementation of the new Basel Accord will change the relationship between
regulatory capital requirements and the capital held by firms. Since regulatory capital will rely
more heavily on internal models devised by firms to set their desired capital, the link between
capital requirements and actual capital may be reinforced. This requires further research.

BANCO DE ESPAÑA 19 DOCUMENTO DE TRABAJO N.º 0515
REFERENCES
ALFON, I., I. ARGIMON and P. BASCUÑANA-AMBRÓS (2004a). What determines how much capital is held by
UK banks and building societies?, FSA Occasional Paper n.º 22, London.
–– (2004b). “Management views about desired capital: The case of UK banks and building societies”, Journal of
Financial Regulation and Compliance, Vol. 12, n.º 3, pp. 263-274.
AYUSO, J., D. PÉREZ and J. SAURINA (2004). “Are capital buffers pro-cyclical? Evidence from Spanish panel data”,
Journal of Financial Intermediation, n.º 13, pp. 249-264.
BASEL COMMITTEE ON BANKING SUPERVISION (1999). A new capital adequacy framework, Consultative paper
issued by the BCBS, Bank for International Settlements, Basel.
BORIO, C., C. FURFINE and P. LOWE (2001). “Procyclicality of the financial system and financial stability: issues and
policy options”, in Marrying the Macro- and Micro- Prudential Dimensions of Financial Stability, Bank for International
Settlements, Basel, Paper n.º 1, pp. 1-57.
EDIZ, T., I. MICHAEL and W. PERRAUDIN (1998). “The impact of capital requirements on UK bank behaviour”, FRBNY
Economic Policy Review, Vol. 4, n.º 3.
FINANCIAL SERVICES AUTHORITY (2001). Individual capital ratios for banks, Policy Statement, United Kingdom.
FURFINE, C. (2000). Evidence on the response of US banks to changes in capital requirements, Working Paper n.º 88,
Bank for International Settlement.
KLEFF, V., and M. WEBER (2003). How do banks determine capital? Empirical evidence for Germany, ZEW Discussion
Paper n.º 03-66, Mannheim.
LAEVEN, L., and G. MAJNONI (2002). Loan loss provisioning and economic slowdowns: too much, too late?, Working
Paper n.º 2749, World Bank.
LINDQUIST, K. (2004). “Banks’ buffer capital: How important is risk”, Journal of International Money and Finance,
Vol. 23, pp. 493-513.
MILNE, A. (2001). “Minimum capital requirements and the design of the new Basel Accord: a constructive critique”,
Journal of Financial Regulation and Compliance, Vol. 9, n.º 4, pp. 312-326.
–– (2002). “Bank capital regulation as an incentive mechanism: implications for portfolio choice”, Journal of Banking and
Finance, Vol. 26, issue 1, pp. 1-23.
NIER, E., and U. BAUMANN (2003). Market discipline, disclosure and moral hazard in banking, Paper n.º 664, EFA
Annual Conference, http://ssrn.com/abstract=423986.
OLIVER, WYMAN & COMPANY (2001). Study on the risk profile and capital adequacy of financial conglomerates,
February.
PAIN, D. (2003). The provisioning experience of the major UK banks: a small panel investigation, Working Paper n.º 177,
Bank of England.
RIME, B. (2000). Bank capital behaviour: empirical evidence for Switzerland, Working Paper 00.05, Study Centre
Grezensse, Swiss National Bank.

BANCO DE ESPAÑA 20 DOCUMENTO DE TRABAJO N.º 0515
Figure 1. Unweighted average buffer over required capital (%)
0
50
100
150
200
250
300
1997 1998 1999 2000 2001 2002
BanksBuilding Societies

BANCO DE ESPAÑA 21 DOCUMENTO DE TRABAJO N.º 0515
TABLE 1. Summary statistics about building societies(1)
Mean Overall
standard deviation
Standard deviation over time
Standard deviation
within firms
Actual capital (% of risk-weighted assets; K) 15.16 4.11 4.05 0.88
Capital requirements (% of risk-weighted assets; KREQ) 9.65 0.50 0.40 0.30
Tier 1 capital (% of total capital) 95.45 6.89 6.52 2.37
Buffer (% in excess of capital requirement) 56.92 40.51 39.70 9.39
Buffer (difference between actual capital and capital requirement in percentage points) 5.50 4.02 3.96 0.87
Size (£m of assets; SIZE) 2229.00 7947.40 7859.90 1513.10
Riskiness (% of total assets attracting a 100% risk-weight; RISK) 6.88 4.18 3.75 1.89
Return on equity (%; ROE) 6.83 4.52 2.55 3.75
Observations: 1365 Firms: 65
(1) Quarterly data; unweighted; second quarter 1997 to second quarter 2002.
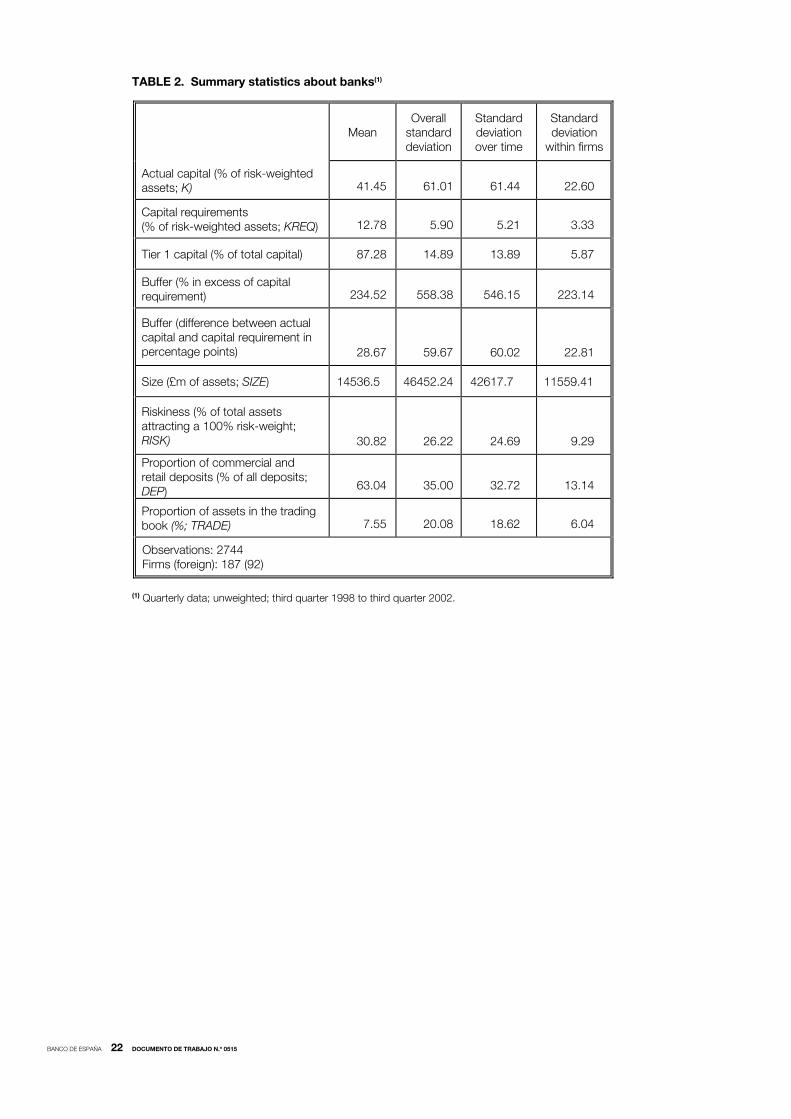
BANCO DE ESPAÑA 22 DOCUMENTO DE TRABAJO N.º 0515
TABLE 2. Summary statistics about banks(1)
Mean Overall
standard deviation
Standard deviation over time
Standard deviation
within firms
Actual capital (% of risk-weighted assets; K) 41.45 61.01 61.44 22.60
Capital requirements (% of risk-weighted assets; KREQ) 12.78 5.90 5.21 3.33
Tier 1 capital (% of total capital) 87.28 14.89 13.89 5.87
Buffer (% in excess of capital requirement) 234.52 558.38 546.15 223.14
Buffer (difference between actual capital and capital requirement in percentage points) 28.67 59.67 60.02 22.81
Size (£m of assets; SIZE) 14536.50 46452.24 42617.70 11559.41
Riskiness (% of total assets attracting a 100% risk-weight; RISK) 30.82 26.22 24.69 9.29
Proportion of commercial and retail deposits (% of all deposits; DEP)
63.04 35.00 32.72 13.14
Proportion of assets in the trading book (%; TRADE) 7.55 20.08 18.62 6.04
Observations: 2744 Firms (foreign): 187 (92)
(1) Quarterly data; unweighted; third quarter 1998 to third quarter 2002.

TABLE 3. Additional data for banks (1998-2002) and building societies (1997-2002)
Average capital
requirements
% of risk-weighted
assets
Average actual capital
% of risk-weighted
assets
Average buffer
% of capital
requirement
Proportion of assets in
trading book
% of risk-weighted
assets
Proportion of tier 1 capital
% of total capital
Average size
£ billion of assets
Unweighted 12.78 41.45 234.52 7.55 87.28
Weighted by total assets 9.42 14.16 48.06 9.83 84.78 All banks Weighted by risk-weighted assets 9.42 12.92 35.03 8.61 95.14
14.54
Unweighted 10.97 30.24 177.67 22.80 83.15
Weighted by total assets 9.20 12.71 36.38 12.79 84.21 Banks with trading book activity Weighted by
risk-weighted assets 9.24 12.49 33.82 11.23 97.04
33.74
Unweighted 13.68 47.00 262.68 0 89.61
Weighted by total assets 10.15 18.99 86.95 0 86.79 Banks without trading book activity Weighted by
risk-weighted aassets 10.01 14.33 39.03 0 88.88
5.02
Unweighted 9.65 15.16 56.92 n/a 95.45
Weighted by total assets 9.45 12.40 31.13 n/a 90.32 Building societies
Weighted by risk-weighted assets 9.43 12.33 30.76 n/a 90.56
2.23
BA
NC
O D
E E
SP
AÑ
A 23 D
OC
UM
EN
TO
DE
TR
AB
AJO
N.º 0515

BANCO DE ESPAÑA 26 DOCUMENTO DE TRABAJO N.º 0515
TABLE 4. Determinants of building societies’ capital ratios(1)
Variable All sample
Firms that experienced an
increase in capital
requirements
Firms that experienced a decrease in
capital requirements
Firms with a low buffer (2)
kreq 0.18 (0.07)** 0.22 (0.10)** 0.21 (0.10)** 0.29 (0.14)**
size -0.02 (0.02) -0.05 (0.03)** 0.01 (0.01) -0.08 (0.04)**
risk -0.04 (0.01)** -0.05 (0.01)** -0.04 (0.01)** -0.01 (0.02)
ggdp -0.002 (0.005) -0.003 (0.007) -0.004 (0.006) -0.01 (0.009)
peer 0.16 (0.06)** 0.17 (0.09)** 0.04 (0.08) 0.17 (0.13)
roe 0.01 (0.004)** – – –
kt-1 0.48 (0.06)** 0.39 (0.06)** 0.63 (0.12)** 0.34 (0.09)**
kt-2 -0.10 (0.04)** -0.10 (0.04)**
Sargan test(3) 1.00 (291) 1.00 (239) 1.00 (242) 1.00 (242)
H0 = No 1st order autocorrelation Prob > z 0.000 0.0004 0.13 0.03
H0 = No 2nd order autocorrelation Prob > z 0.87 0.93 0.80 0.55
Number of observations 1162 954 304 305
Number of firms 65 53 16 33
(1) Quarterly data from second quarter 1997 to second quarter 2002. First difference regressions. First-step robust standard errors in brackets. All equations include quarterly dummies. Risk, dep, roe, kt-1 and kt-2 have been instrumented with their 2nd ,3rd and 4th lags and the lagged differences of the exogenous variables. (2) Includes only observations corresponding to a buffer lower than 30.5%, which corresponds to the lowest quarterile of the population. (3) Prob > χ2 (degrees of freedom). (**) Statistically significant at 5%.

BANCO DE ESPAÑA 27 DOCUMENTO DE TRABAJO N.º 0515
TABLE 5. Determinants of banks’ capital ratios(1)
Variable All sample Firms with
trading book
Firms that have experienced an
increase in capital
requirements
Firms that have experienced a decrease in
capital requirements
Firms with a low buffer(2)
kreq 0.28 (0.14)** 0.43 (0.23)* 0.49 (0.23) ** 0.19 (0.10)** 0.41 (0.15)**
size -0.23 (0.06) ** -0.38 (0.07)** -0.25 (0.04)** -0.26 (0.06)** -0.13 (0.06)**
risk -0.22 (0.07)** -0.23 (0.05)** -0.17 (0.04) ** -0.25 (0.07)** -0.12 (0.06)**
ggdp -0.04 (0.02)** -0.11 (0.04)** -0.08 (0.04)** -0.01 (0.02) -0.04 (0.02)**
peer 0.07 (0.02)** 0.06 (0.03)* 0.08 (0.03)** 0.06 (0.03)** 0.01 (0.01)
dep 0.02 (0.03) 0.02 (0.01)** 0.02 (0.01)* -0.03 (0.03) -0.02 (0.06)
trade - -0.06 (0.03)** - - -
foreign 0.005 (0.005) 0.008 (0.007) -0.002 (0.007) 0.01 (0.007)* 0.0005(0.006)
kt-1 0.32 (0.09)** 0.30 (0.06)** 0.31 (0.07)** 0.24 (0.05)** 0.22 (0.07)**
Const 0.007 (0.003)** 0.006 (0.006) 0.01 (0.005)* 0.006 (0.004) -0.02 (0.004)**
Sargan test(3) 0.93 (201) 1.00 (242) 1.00 (201) 1.00 (201) 1.00 (190)
H0 = No 1st order
autocorrelation
Prob > z 0.000 0.005 0.009 0.0004 0.05
H0 = No 2nd order
autocorrelation
Prob > z 0.92 0.99 0.75 0.78 0.47
Number of observations 2052 646 821 1180 403
Number of firms 182 59 72 97 76
(1) Quarterly data from second quarter 1997 to second quarter 2002. First difference regressions. First-step robust standard errors in brackets. All equations include quarterly dummies. Risk, dep, roe have been instrumented with their 2nd ,3rd and 4th lags and the lagged differences of the exogenous variables. (2) Includes only observations corresponding to a buffer lower than 30.5%, which corresponds to the lowest quarterile of the population. (3) Prob > χ2 (degrees of freedom). (*) Statistically significant at 10%. (**) Statistically significant at 5%.

BANCO DE ESPAÑA PUBLICATIONS
WORKING PAPERS1
0401 ROBERTO BLANCO, SIMON BRENNAN AND IAN W. MARSH: An empirical analysis of the dynamic relationship
between investment grade bonds and credit default swaps.
0402 ENRIQUE ALBEROLA AND LUIS MOLINA: What does really discipline fiscal policy in emerging markets? The role
and dynamics of exchange rate regimes.
0403 PABLO BURRIEL-LLOMBART: An economic analysis of education externalities in the matching process of UK
regions (1992-1999).
0404 FABIO CANOVA, MATTEO CICCARELLI AND EVA ORTEGA: Similarities and convergence in G-7 cycles.
0405 ENRIQUE ALBEROLA, HUMBERTO LÓPEZ AND LUIS SERVÉN: Tango with the gringo: the hard peg and real
misalignment in Argentina.
0406 ANA BUISÁN, JUAN CARLOS CABALLERO AND NOELIA JIMÉNEZ: Determinación de las exportaciones de
manufacturas en los países de la UEM a partir de un modelo de oferta-demanda.
0407 VÍTOR GASPAR, GABRIEL PÉREZ QUIRÓS AND HUGO RODRÍGUEZ MENDIZÁBAL: Interest rate determination
in the interbank market.
0408 MÁXIMO CAMACHO, GABRIEL PÉREZ-QUIRÓS AND LORENA SAIZ: Are European business cycles close
enough to be just one?
0409 JAVIER ANDRÉS, J. DAVID LÓPEZ-SALIDO AND EDWARD NELSON: Tobin’s imperfect assets substitution in
optimizing general equilibrium.
0410 A. BUISÁN, J. C. CABALLERO, J. M. CAMPA AND N. JIMÉNEZ: La importancia de la histéresis en las
exportaciones de manufacturas de los países de la UEM.
0411 ANDREW BENITO, FRANCISCO JAVIER DELGADO AND JORGE MARTÍNEZ PAGÉS: A synthetic indicator of
financial pressure for Spanish firms.
0412 JAVIER DELGADO, IGNACIO HERNANDO AND MARÍA J. NIETO: Do European primarily Internet banks show
scale and experience efficiencies?
0413 ÁNGEL ESTRADA, JOSÉ LUIS FERNÁNDEZ, ESTHER MORAL AND ANA V. REGIL: A quarterly
macroeconometric model of the Spanish economy.
0414 GABRIEL JIMÉNEZ AND JESÚS SAURINA: Collateral, type of lender and relationship banking as determinants of
credit risk.
0415 MIGUEL CASARES: On monetary policy rules for the euro area.
0416 MARTA MANRIQUE SIMÓN AND JOSÉ MANUEL MARQUÉS SEVILLANO: An empirical approximation of the
natural rate of interest and potential growth. (The Spanish original of this publication has the same number).
0417 REGINA KAISER AND AGUSTÍN MARAVALL: Combining filter design with model-based filtering (with an
application to business-cycle estimation).
0418 JÉRÔME HENRY, PABLO HERNÁNDEZ DE COS AND SANDRO MOMIGLIANO: The short-term impact of
government budgets on prices: evidence from macroeconometric models.
0419 PILAR BENGOECHEA AND GABRIEL PÉREZ-QUIRÓS: A useful tool to identify recessions in the euro area.
0420 GABRIEL JIMÉNEZ, VICENTE SALAS AND JESÚS SAURINA: Determinants of collateral.
0421 CARMEN MARTÍNEZ-CARRASCAL AND ANA DEL RÍO: Household borrowing and consumption in Spain:
A VECM approach.
0422 LUIS J. ÁLVAREZ AND IGNACIO HERNANDO: Price setting behaviour in Spain: Stylised facts using consumer
price micro data.
0423 JUAN CARLOS BERGANZA AND ALICIA GARCÍA-HERRERO: What makes balance sheet effects detrimental for
the country risk premium?
0501 ÓSCAR J. ARCE: The fiscal theory of the price level: a narrow theory for non-fiat money.
0502 ROBERT-PAUL BERBEN, ALBERTO LOCARNO, JULIAN MORGAN AND JAVIER VALLÉS: Cross-country
differences in monetary policy transmission.
0503 ÁNGEL ESTRADA AND J. DAVID LÓPEZ-SALIDO: Sectoral mark-up dynamics in Spain.
0504 FRANCISCO ALONSO, ROBERTO BLANCO AND GONZALO RUBIO: Testing the forecasting performance of
Ibex 35 option-implied risk-neutral densities.
1. Previously published Working Papers are listed in the Banco de España publications calalogue.

0505 ALICIA GARCÍA-HERRERO AND ÁLVARO ORTIZ: The role of global risk aversion in explaining Latin American
sovereign spreads.
0506 ALFREDO MARTÍN, JESÚS SAURINA AND VICENTE SALAS: Interest rate dispersion in deposit and loan
markets.
0507 MÁXIMO CAMACHO AND GABRIEL PÉREZ-QUIRÓS: Jump-and-rest effect of U.S. business cycles.
0508 LUIS J. ÁLVAREZ, PABLO BURRIEL AND IGNACIO HERNANDO: Do decreasing hazard functions for price
changes make any sense?
0509 ÁNGEL DE LA FUENTE AND JUAN F. JIMENO: The private and fiscal returns to schooling and the effect of
public policies on private incentives to invest in education: a general framework and some results for the EU.
0510 JUAN J. DOLADO, MARCEL JANSEN AND JUAN F. JIMENO: Dual employment protection legislation: a
framework for analysis.
0511 ANA DEL RÍO AND GARRY YOUNG: The determinants of unsecured borrowing: evidence from the British
household panel survey.
0512 ANA DEL RÍO AND GARRY YOUNG: The impact of unsecured debt on financial distress among British
households.
0513 ADELA LUQUE: Skill mix and technology in Spain: evidence from firm-level data.
0514 J. DAVID LÓPEZ-SALIDO, FERNANDO RESTOY AND JAVIER VALLÉS: Inflation differentials in EMU: The
Spanish case.
0515 ISAAC ALFON, ISABEL ARGIMÓN AND PATRICIA BASCUÑANA-AMBRÓS: How individual capital requirements
affect capital ratios in UK banks and building societies.
Unidad de Publicaciones Alcalá, 522; 28027 Madrid
Telephone +34 91 338 6363. Fax +34 91 338 6488 e-mail: [email protected]
www.bde.es