Embed Size (px)
Citation preview

Brigade Group Investor Presentation – Q1 FY 2014-15

Standalone Financials - Snapshot
2
-
500
1,000
1,500
2,000
Q1 FY 14 Q1 FY 15
1,573 1,682
Turnover
-
100
200
300
400
500
Q1 FY 14 Q1 FY 15
469 480
EBITDA
-
20
40
60
80
Q1 FY 14 Q1 FY 15
67 74
PAT
0%
2%
4%
6%
8%
10%
Turnover EBITDA PAT
7%
2%
10%
Growth %
Amounts in Rs. Mn

Particulars Q1 FY 14-15 Q4 FY 13-14 Q1 FY 13-14 Q1-15 on
Q4-14 Q1-15 on
Q1-14
Amount in Rs. Mn Percentage Change
Turnover 1,682 3,942 1,573 -57% 7%
EBITDA 480 975 469 -51% 2%
Interest 142 124 175 15% -19%
Profit after Interest 338 851 293 -60% 15%
Depreciation 223 197 186 14% 20%
PBT 114 655 107 -83% 7%
Tax 41 162 40 -75% 1%
PAT 74 492 67 -85% 10%
EBITDA/Sales 29% 25% 30%
PBT/Sales 7% 17% 7%
PAT/Sales 4% 12% 4%
Standalone Financials - Snapshot
3

Consolidated Financials - Snapshot
4
Particulars Q1 FY 14-15 Q4 FY 13-14 Q1 FY 13-14 Q1-15 on
Q4-14 Q1-15 on
Q1-14
Amount in Rs. Mn Percentage Change
Turnover 1,960 4,039 1,683 -51% 16%
EBITDA 554 1,155 497 -52% 11%
Interest 199 174 225 15% -12%
Profit after Interest 354 981 271 -64% 31%
Depreciation 238 210 199 13% 20%
PBT 116 771 72 -85% 61%
Tax 54 162 45 -67% 20%
PAT 62 609 28 -90% 125%
EBITDA/Sales 28% 29% 30%
PBT/Sales 6% 19% 4%
PAT/Sales 3% 15% 2%

Standalone Segment Profit Analysis
5
Real Estate 61%
Lease Rentals 23%
Hospitality 16%
Contribution to Total Revenue
Real Estate 40%
Lease Rentals 38%
Hospitality 22%
Contribution to Gross Profit
Real Estate 21%
Lease Rentals 61%
Hospitality 18%
Contribution to EBITDA
Real Estate 62%
Lease Rentals 38%
Contribution to PBT

Particulars Real Estate Hospitality Lease rentals Total
Revenue 1,033 272 378 1,683
Expenses 699 85 64 847
Gross profit 334 187 314 836
Gross profit Margin % 32% 69% 83% 50%
Admin Expenses 129 48 19 196
Employee cost 104 51 5 160
EBIDTA 101 88 291 480
EBIDTA / Revenue % 10% 33% 77% 29%
Interest 7 31 104 142
Profit after interest 94 57 186 338
Depreciation 11 77 135 223
PBT 83 -20 51 114
PBT / Revenue % 8% -7% 13% 7%
Income Tax 41
PAT 74
For 3 months ended June 2014
Standalone Segment Profit Analysis
6
Amount in Rs. Mn

Particulars Real Estate Hospitality Lease rentals Total
Revenue 1,149 361 450 1,960
Expenses 762 103 98 963
Gross profit 387 258 352 997
Gross profit Margin % 34% 71% 78% 51%
Admin Expenses 145 74 35 254
Employee cost 106 74 10 190
EBIDTA 136 110 307 553
EBIDTA / Revenue % 12% 30% 68% 28%
Interest 63 32 104 199
Profit after interest 73 78 203 354
Depreciation 13 89 136 238
PBT 60 -11 67 116
PBT / Revenue % 5% -3% 15% 6%
Income Tax 54
PAT 62
For 3 months ended June 2014
Consolidated Segment Profit Analysis
7
Amount in Rs. Mn

Segment Equity Debt Capital
Employed D/E
Ratio PBD/Equity
% EBIT/CE %
Real Estate 7,539 3,747 11,285 0.50 5% 3%
Hospitality 1,525 809 2,334 0.53 15% 2%
Lease Rental 3,730 3,824 7,554 1.03 20% 23%
Total 12,794 8,380 21,173 0.65 11% 5%
Less: Cash Balance 484
Net Debt 7,896
Ratios are annualised; PBD = Profit Before Depreciation & Tax (After Interest)
Figures as on June 2014; Amounts are in Rs. Mn
Deployment of Funds
8
Real Estate 53% Lease Rentals
36%
Hospitality 11%
Capital Employed
0%
5%
10%
15%
20%
25%
PBD/Equity EBIT/CE
5% 3%
15%
23%
20%
2%
Profitability Ratios
Real Estate
Lease Rentals
Hospitality

Amount in Rs. Mn
Debt & Cost Movement
9 Debt Credit Rating by ICRA upgraded from “A Minus” to “A”
8,537 8,508
9,226 9,168 8,813
9,850 9,815
8,308 8,637 8,433 8,380
13.86%
13.55%
13.31%
13.11% 13.06%
12.78%
12.38% 12.46% 12.27%
12.19% 12.16%
11.00%
11.50%
12.00%
12.50%
13.00%
13.50%
14.00%
7,500
8,000
8,500
9,000
9,500
10,000
Dec-11 Mar-12 Jun-12 Sep-12 Dec-12 Mar-13 Jun-13 Sep-13 Dec-13 Mar-14 Jun-14
Debt Interest Rate
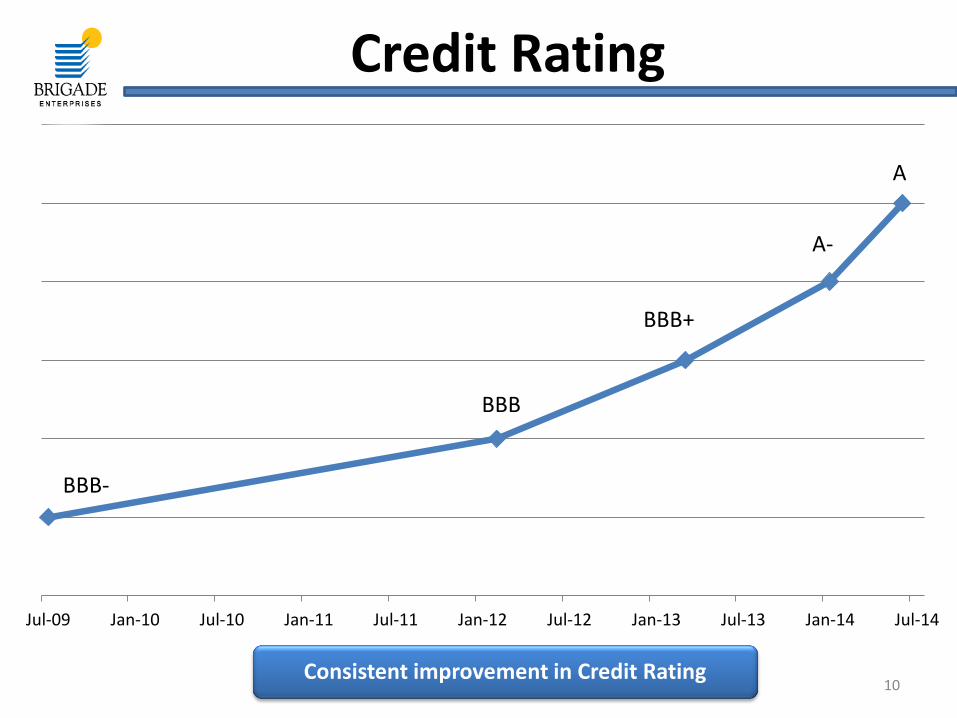
Jul-09 Jan-10 Jul-10 Jan-11 Jul-11 Jan-12 Jul-12 Jan-13 Jul-13 Jan-14 Jul-14
Credit Rating
BBB-
BBB+
BBB
A-
A
10 Consistent improvement in Credit Rating

FY 2012-13 FY 2013-14 FY 2014-15
Q1 Q2 Q3 Q4 Year Q1 Q2 Q3 Q4 Year Q1
Residential 300 271 297 537 1,405 715 678 473 394 2,260 462
Commercial 151 79 125 108 463 31 132 203 366 16
Total 451 350 422 645 1,868 715 709 605 597 2,626 478
All figures are in sft ‘000
Residential Sales Volume in Q1 FY 2014-15 increased 17% over the previous quarter 11
Sales Volume Analysis
-
100
200
300
400
500
600
700
800
Q1 FY13 Q2 FY13 Q3 FY13 Q4 FY13 Q1 FY14 Q2 FY14 Q3 FY14 Q4 FY14 Q1 FY15
300 271 297
537
715 678
473 394
462
151 79
125
108
31
132 203 16
Quarterly Sales
Residential Commercial
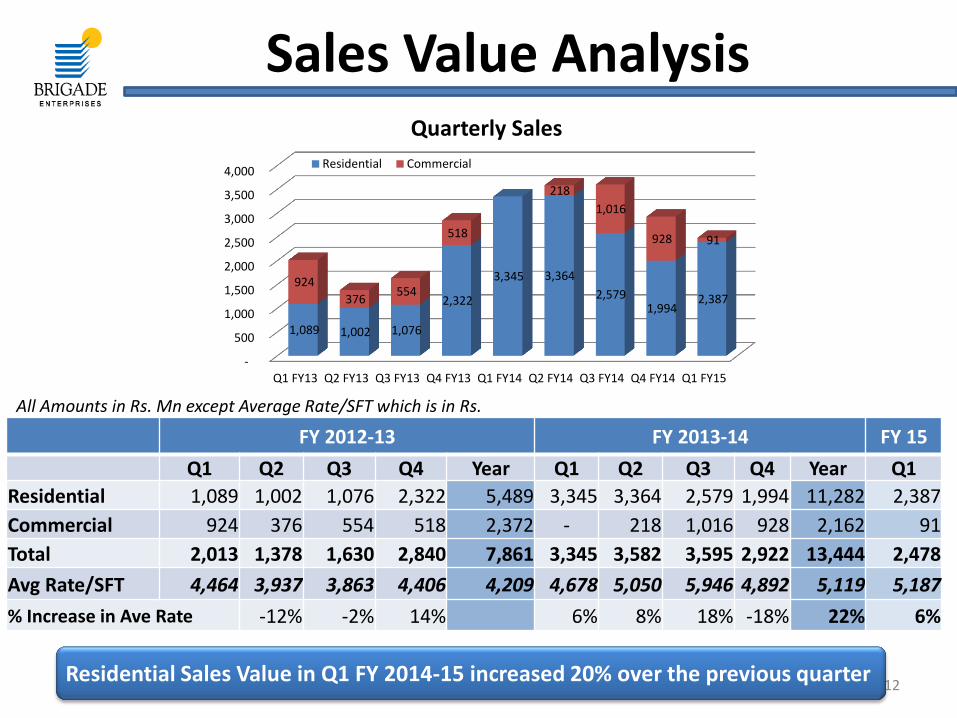
FY 2012-13 FY 2013-14 FY 15
Q1 Q2 Q3 Q4 Year Q1 Q2 Q3 Q4 Year Q1
Residential 1,089 1,002 1,076 2,322 5,489 3,345 3,364 2,579 1,994 11,282 2,387
Commercial 924 376 554 518 2,372 - 218 1,016 928 2,162 91
Total 2,013 1,378 1,630 2,840 7,861 3,345 3,582 3,595 2,922 13,444 2,478
Avg Rate/SFT 4,464 3,937 3,863 4,406 4,209 4,678 5,050 5,946 4,892 5,119 5,187
% Increase in Ave Rate -12% -2% 14% 6% 8% 18% -18% 22% 6%
All Amounts in Rs. Mn except Average Rate/SFT which is in Rs.
12 Residential Sales Value in Q1 FY 2014-15 increased 20% over the previous quarter
Sales Value Analysis
-
500
1,000
1,500
2,000
2,500
3,000
3,500
4,000
Q1 FY13 Q2 FY13 Q3 FY13 Q4 FY13 Q1 FY14 Q2 FY14 Q3 FY14 Q4 FY14 Q1 FY15
1,089 1,002 1,076
2,322
3,345 3,364
2,579 1,994
2,387
924
376 554
518
218
1,016
928 91
Quarterly Sales
Residential Commercial

GRAND MERCURE SHERATON
Details Q1 FY 14-15 Q1 FY 13-14 FY 13-14 Q1 FY 14-15 Q1 FY 13-14 FY 13-14
No of Keys 126 126 126 230 230 230
Occupancy 80% 84% 86% 69% 74% 75%
ARR (Rs.) 6,740 6,707 6,558 7,114 7,346 7,633
GOP 48.5% 49.6% 50.7% 39.9% 43.1% 40.8%
13
Hospitality Business
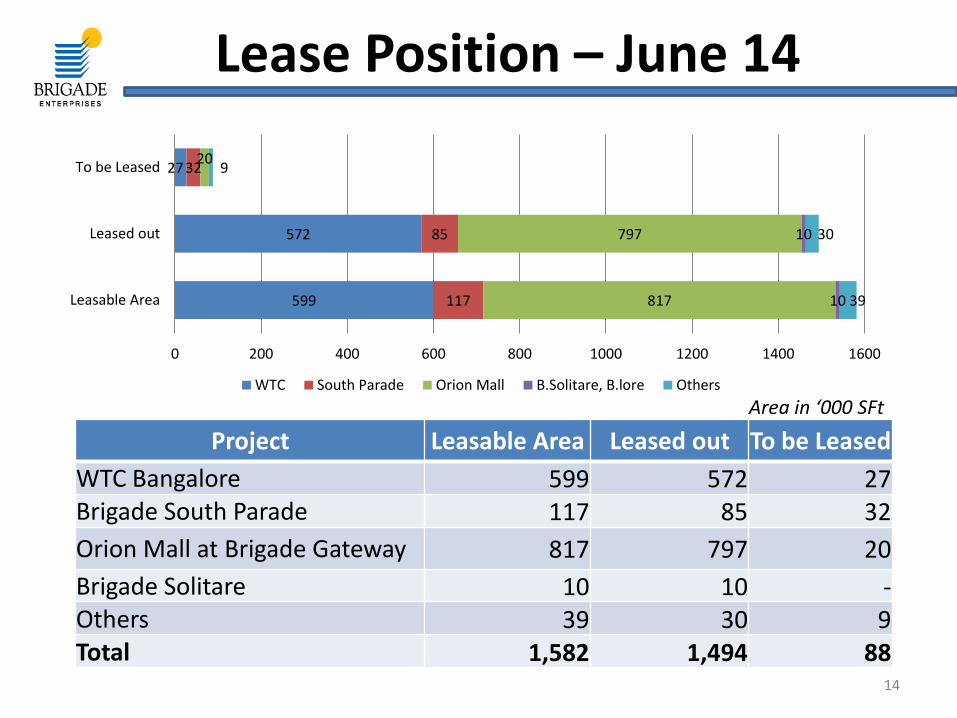
Project Leasable Area Leased out To be Leased
WTC Bangalore 599 572 27 Brigade South Parade 117 85 32
Orion Mall at Brigade Gateway 817 797 20
Brigade Solitare 10 10 - Others 39 30 9 Total 1,582 1,494 88
Area in ‘000 SFt
14
Lease Position – June 14
599
572
27
117
85
32
817
797
20
10
10
39
30
9
0 200 400 600 800 1000 1200 1400 1600
Leasable Area
Leased out
To be Leased
WTC South Parade Orion Mall B.Solitare, B.lore Others

Particulars Ongoing BEL
Projects Ongoing
SPV Projects Stock Sales
Total
In Mn. Sft Total super built-up area of launched project on sale basis
10.36 2.10 0.10 12.57
Less: LO Share 2.02 0 0 2.02
Co share of saleable area 8.35 2.10 0.10 10.55
Sold till date 4.13 1.25 0 5.38
To be sold 4.22 0.85 0.10 5.17
Rs. In Mn
Estimated Sale value 40,337 10,802 889 52,027
Value of Sold units 17,616 5,836 0 23,453
Value of unsold units 22,720 4,966 889 28,575
Collection till date on sold units 10,573 1,609 0 12,182
Balance collection for the projects (including unsold units)-A
29,763 9,193 889 39,845
15
Synopsis of Ongoing Projects – June 2014

Particulars Ongoing BEL
Projects Ongoing SPV
Projects Stock Sales
Total
Rs. In Mn
Revenue Recognised till date 6,597 260 0 6,857
Revenue to be Recognised (incl unsold units) 33,740 10,542 889 45,170
Estimated cost for the projects (incl Land/NRD) 26,321 8,181 450 34,952
Cost incurred till date 9,573 3,966 450 13,989
Balance cost to be incurred to finish the project-B 16,748 4,215 0 20,963
Estimated Profit for the projects 14,016 2,621 439 17,075
Profit recognised till date 1,760 (18) 0 1,743
Profit to be recognised (incl unsold units) 12,256 2,638 439 15,333
Present Borrowings-C 3,747 486 4,233
Operating Cash Flows-D=(A-B-C) 9,268 4,492 889 14,649
Period of realization 3 Years 3 Years 6 Months
16
Synopsis of Ongoing Projects – Contd.

* Through SPV
As on June 2014
Projects Project Area LO/JV share Co Share
Real Estate projects 10,362 2,017 8,345
Brigade Orchards * 1,267 621 646
Brigade Cosmopolis * 836 418 418
Total Real Estate 12,466 3,057 9,410
Brigade Nalapad Centre 461 230 230
Brigade Orion East 272 120 152
Brigade Vantage, Mysore 131 66 66
Brigade Vantage, Chennai 133 66 66
Brigade Bhuwalka Icon 282 141 141
Brigade Bhuwalka Icon Retail 80 40 40
Brigade Technopolis, Kochi 347 0 347
Total Lease Rental 1,706 663 1,043
Holiday Inn, Chennai* 229 114 114 Brigade Orchards Signature Club* 89 44.5 45
Grand Mercure, Mysore 105 - 105
Total Hospitality 423 158.5 264
Grand Total 14,595 3,878 10,716
Area in ‘000 SFT
17
Ongoing Projects - Summary
Residential 85%
Lease Rental 12%
Hospitality 3%
Total Project Area
Residential 88%
Lease Rental 10%
Hospitality 2%
Company Share Project Area

Bangalore
Hyderabad
Mangalore
Mysore
Kochi
Chennai
Location Land Area (in acres)
Total Cost* Paid Payable
Bangalore 235 5,959 4,718 1,241
Chennai 57 750 400 350
Kochi 22 207 207 -
Mangalore 25 45 45 -
Mysore 36 108 87 21
Total 374 7,069 5,456 1,612
* Includes Refundable/Non Refundable Deposits for Joint Developments
Amount in Rs. Mn As on June 2014
18
Land Bank - Group
Bangalore 235 Chennai 57
Kochi 22
Mangalore 25 Mysore 36
Land Area (Acres)

As on June 2014
Product No of
Projects Proj Area SFT in Mn
BEL Share
SFT in Mn
Residential 30 21.5 15.1 Commercial-Sale 5 2.2 1.3 Commercial-Lease
13 7.0 6.5
Retail 2 0.2 0.1 Hotel 5 0.7 0.7 Total 55 31.6 23.7
Location No of
Projects Proj Area SFT in Mn
BEL Share
SFT in Mn
Bangalore 39 22.9 17.3
Chennai 3 4.5 2.5
Cochin 3 0.5 0.5
Mangalore 2 2.5 2.5
Mysore 8 1.3 1.1
Total 55 31.6 23.7 19
Land Bank – Developable Area
Residential 68%
Commercial-Sale 7%
Commercial-Lease 22%
Retail 1% Hotel
2%
Project Area - Product
Bangalore 72%
Chennai 14%
Cochin 2%
Mangalore 8%
Mysore 4%
Project Area - Location

Project City Land Area Project
Area BEL
Share Launch Plan /
Status
In Acres Sft in Mn Sft in Mn
Brigade Exotica-Tower-2 Bangalore 5.26 0.72 0.72 Launched in Q1
Brigade Omega - Tower-A Bangalore 2.46 0.31 0.19 Launched in Q1
Brigade Meadows Phase 2 Bangalore 14.99 0.88 0.88 Launched in Q1
Brigade Mount view Mysore 4.00 0.40 0.40 Q2
Brigade Northridge Bangalore 7.30 0.61 0.40 Q2
Brigade Oak Tree Place Bangalore 18.58 0.34 0.24 Q2
Brigade Palmgrove – Townhomes Mysore 2.14 0.14 0.10 Q2
Brigade Lakeshore Bangalore 4.40 0.36 0.20 Q2
Brigade Orchards – Cedar Bangalore 5.00 0.50 0.25 Q2
Brigade Panorama Bangalore 11.73 1.28 0.92 Q3
Brigade Metropolis Chennai Ph-1 Chennai 11.85 0.77 0.46 Q3
Brigade Orchards – Deodar Bangalore 6.00 0.55 0.28 Q3
Brigade Orchards - Studio Units Bangalore 1.00 0.10 0.05 Q4
Residential Total 94.70 6.96 5.08
20
Project Launch Pipeline – FY 2014-15
1.79 Mn sft of residential projects launched in Q1 FY 2014-15

Project City Land Area Project
Area BEL Share
Launch Plan / Status
In Acres Sft in Mn Sft in Mn
Brigade Golden Triangle Signature Tower
Bangalore 5.41 0.55 0.39 Q2
Brigade Bhuwalka Bangalore 2.61 0.29 0.15 Launched in Q1
Brigade Meadows Bangalore 1.50 0.12 0.12 Q3
Brigade Lakeshore Bangalore 6.60 0.84 0.46 Q4
Commercial Total 16.12 1.80 1.11
Total Real Estate 110.82 8.76 6.19
Brigade Bhuwalka Retail Bangalore 0.74 0.08 0.04 Launched in Q1
Brigade Opus Bangalore 2.25 0.32 0.32 Q3
Brigade Golden Triangle Orion OMR Bangalore 3.45 0.35 0.25 Q4
Total Commercial & Retail 6.44 0.75 0.61
Grand Total 117.26 9.51 6.80
21
Project Launch Pipeline – FY 2014-15
0.19 mn sft of Commercial & Retail projects launched in Q1 FY 2014-15

THANK YOU Brigade Enterprises Ltd 29th & 30th Floor, World Trade Centre, Brigade Gateway Campus, 26/1, Dr. Rajkumar Road, Malleswaram-Rajajinagar, Bangalore -560 055. Phone: 91-80-4137 9200 Fax: 91-80-2221 0784 www.brigadegroup.com
K Suresh Chief Financial Officer Email: [email protected]
Pradyumna Krishnakumar EA to CMD & Analyst Email: [email protected]
Om Prakash P Company Secretary Email: [email protected]
Disclaimer: The information in this presentation contains certain forward-looking statements. These include statements regarding outlook on future development schedules, business plans and expectations of Capital expenditures. These statements are based on current expectations that involve a Number of risks and uncertainties which could cause actual results to differ from those anticipated by the Company.
Vikas Jain Sr. Manager Finance & Analyst Email: [email protected]
22


![ADULT’S KNIT V-NECK CARDIGAN | KNIT · Say goodbye to knitter’s block for Her Version or 17 (17-17-17½- 17½-17½)" [43(43-43-44.5-44.5- 44.5) cm] for His Version, ending on](https://img.pdfslide.us/doc/110x75/5ebb70204dce8278277f426a/adultas-knit-v-neck-cardigan-knit-say-goodbye-to-knitteras-block-for-her-version.jpg)