Embed Size (px)
Citation preview
1
1
Investor PresentationJune 2015
2
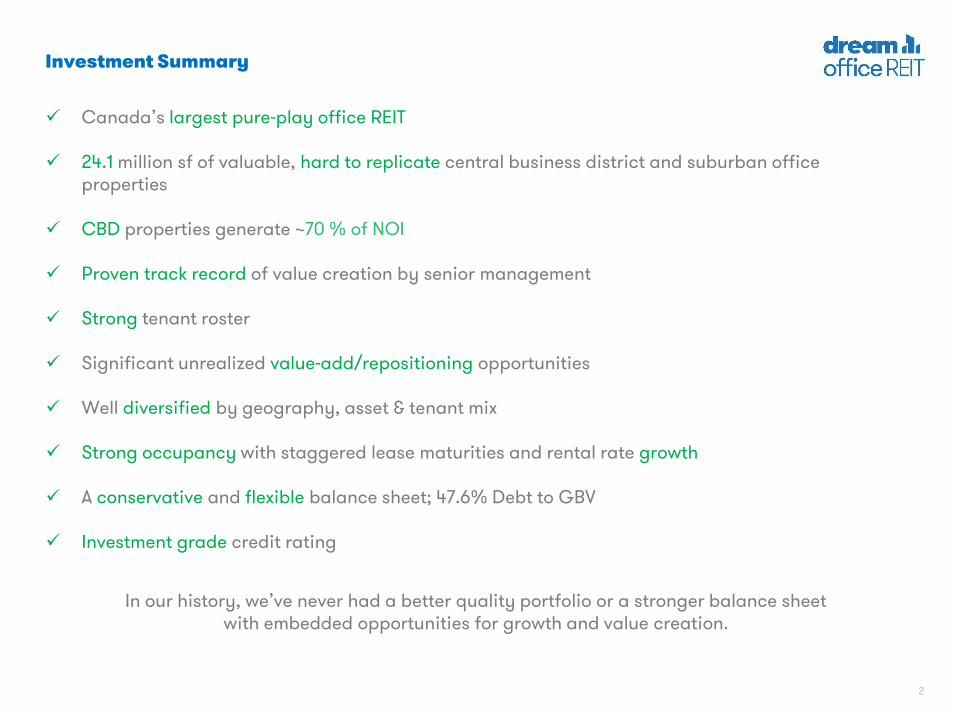
Investment Summary
Canada’s largest pure-play office REIT
24.1 million sf of valuable, hard to replicate central business district and suburban office properties
CBD properties generate ~70 % of NOI
Proven track record of value creation by senior management
Strong tenant roster
Significant unrealized value-add/repositioning opportunities
Well diversified by geography, asset & tenant mix
Strong occupancy with staggered lease maturities and rental rate growth
A conservative and flexible balance sheet; 47.6% Debt to GBV
Investment grade credit rating
In our history, we’ve never had a better quality portfolio or a stronger balance sheet with embedded opportunities for growth and value creation.
3
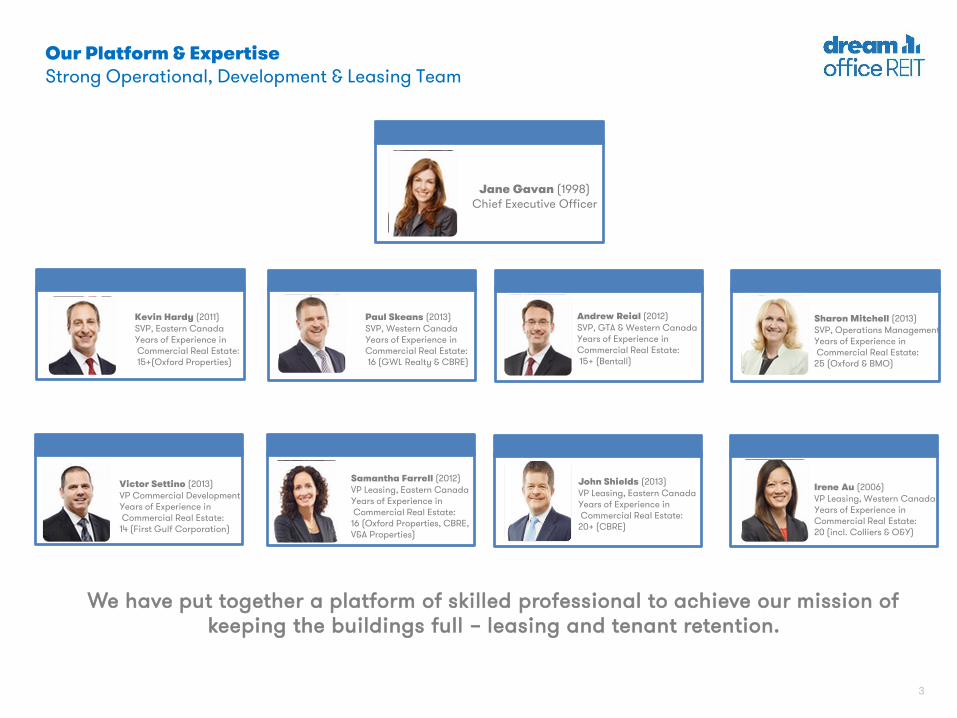
Kevin Hardy (2011)SVP, Eastern CanadaYears of Experience inCommercial Real Estate:15+(Oxford Properties)
Paul Skeans (2013)SVP, Western Canada Years of Experience in Commercial Real Estate:16 (GWL Realty & CBRE)
Victor Settino (2013)VP Commercial DevelopmentYears of Experience inCommercial Real Estate:
14 (First Gulf Corporation)
Sharon Mitchell (2013)SVP, Operations ManagementYears of Experience inCommercial Real Estate:
25 (Oxford & BMO)
Our Platform & ExpertiseStrong Operational, Development & Leasing Team
We have put together a platform of skilled professional to achieve our mission of keeping the buildings full – leasing and tenant retention.
Andrew Reial (2012)SVP, GTA & Western Canada Years of Experience in Commercial Real Estate:15+ (Bentall)
Samantha Farrell (2012)VP Leasing, Eastern CanadaYears of Experience inCommercial Real Estate:
16 (Oxford Properties, CBRE, V&A Properties)
John Shields (2013)VP Leasing, Eastern CanadaYears of Experience inCommercial Real Estate:
20+ (CBRE)
Irene Au (2006)VP Leasing, Western CanadaYears of Experience in Commercial Real Estate: 20 (incl. Colliers & O&Y)
Jane Gavan (1998)Chief Executive Officer
4
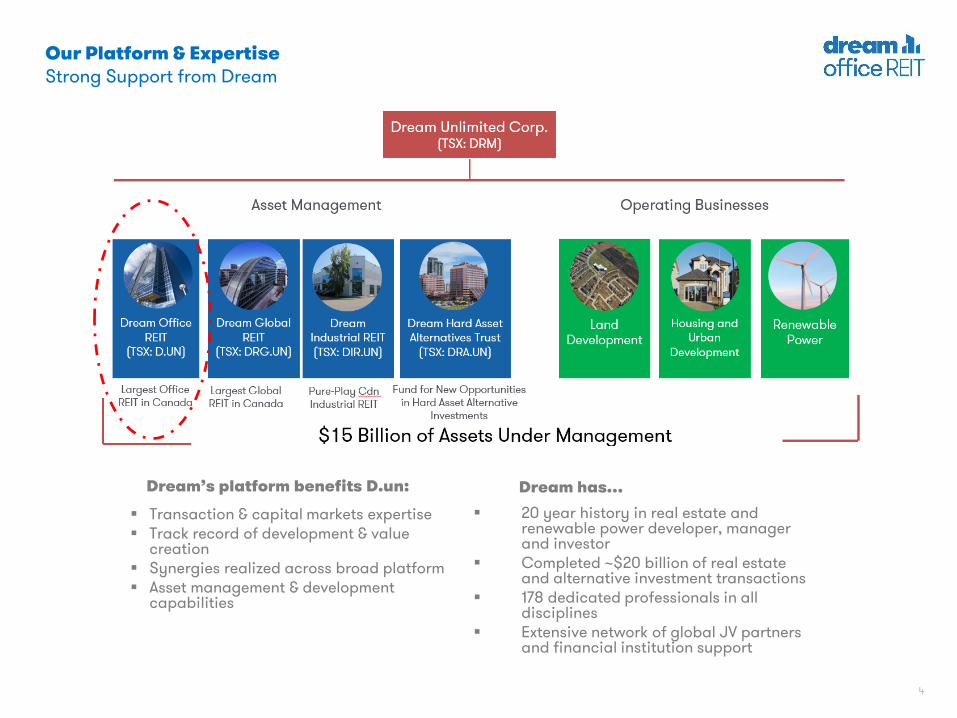
Our Platform & ExpertiseStrong Support from Dream
Dream’s platform benefits D.un:
Transaction & capital markets expertise Track record of development & value
creation Synergies realized across broad platform Asset management & development
capabilities
20 year history in real estate and renewable power developer, manager and investor
Completed ~$20 billion of real estate and alternative investment transactions
178 dedicated professionals in all disciplines
Extensive network of global JV partners and financial institution support
Dream has…
5
On April 2nd we completed the reorganization of the management structure of DREAM Office REIT.
As a result of the reorganization, the annual management fee, acquisition fee and capital expenditure fee payable to Dream Asset Management Corporation (“Dream”) have been eliminated. In consideration for the sale, Dream received 4.85 million exchangeable limited partnership units exchangeable for REIT units.
Dream will continue to provide strategic oversight on a cost recovery basis.
Dream Office continues to leverage the expertise of the acquisition and financing teams at Dream.
Reorganization of Management Structure
6
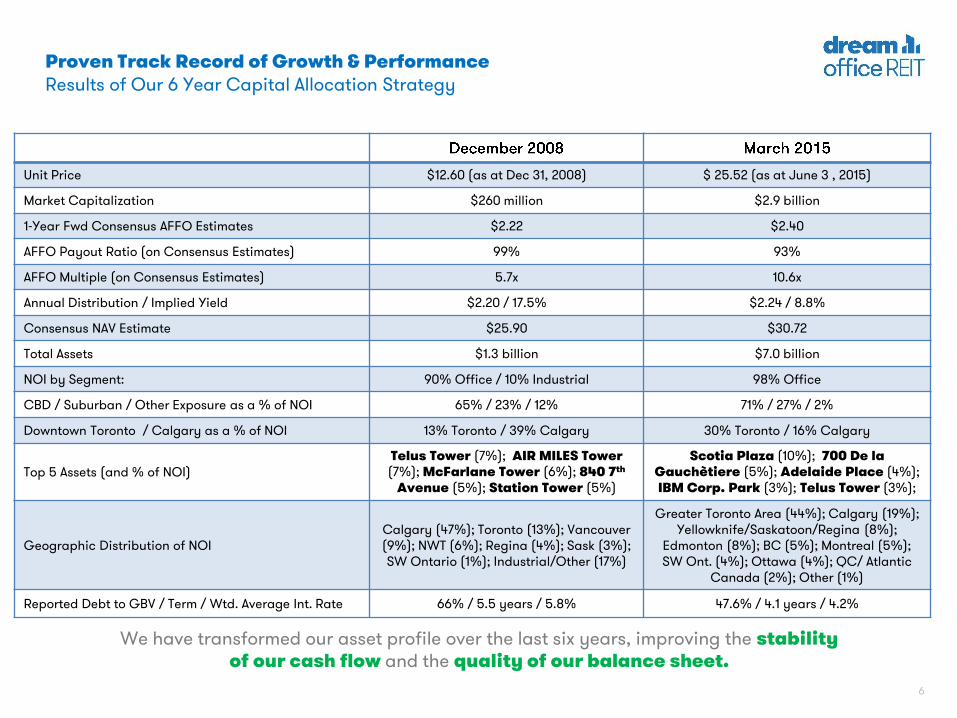
Proven Track Record of Growth & PerformanceResults of Our 6 Year Capital Allocation Strategy
Unit Price $12.60 (as at Dec 31, 2008) $ 25.52 (as at June 3 , 2015)
Market Capitalization $260 million $2.9 billion
1-Year Fwd Consensus AFFO Estimates $2.22 $2.40
AFFO Payout Ratio (on Consensus Estimates) 99% 93%
AFFO Multiple (on Consensus Estimates) 5.7x 10.6x
Annual Distribution / Implied Yield $2.20 / 17.5% $2.24 / 8.8%
Consensus NAV Estimate $25.90 $30.72
Total Assets $1.3 billion $7.0 billion
NOI by Segment: 90% Office / 10% Industrial 98% Office
CBD / Suburban / Other Exposure as a % of NOI 65% / 23% / 12% 71% / 27% / 2%
Downtown Toronto / Calgary as a % of NOI 13% Toronto / 39% Calgary 30% Toronto / 16% Calgary
Top 5 Assets (and % of NOI)Telus Tower (7%); AIR MILES Tower(7%); McFarlane Tower (6%); 840 7th
Avenue (5%); Station Tower (5%)
Scotia Plaza (10%); 700 De la Gauchètiere (5%); Adelaide Place (4%); IBM Corp. Park (3%); Telus Tower (3%);
Geographic Distribution of NOICalgary (47%); Toronto (13%); Vancouver (9%); NWT (6%); Regina (4%); Sask (3%); SW Ontario (1%); Industrial/Other (17%)
Greater Toronto Area (44%); Calgary (19%); Yellowknife/Saskatoon/Regina (8%);
Edmonton (8%); BC (5%); Montreal (5%); SW Ont. (4%); Ottawa (4%); QC/ Atlantic
Canada (2%); Other (1%)
Reported Debt to GBV / Term / Wtd. Average Int. Rate 66% / 5.5 years / 5.8% 47.6% / 4.1 years / 4.2%
We have transformed our asset profile over the last six years, improving the stability of our cash flow and the quality of our balance sheet.
7
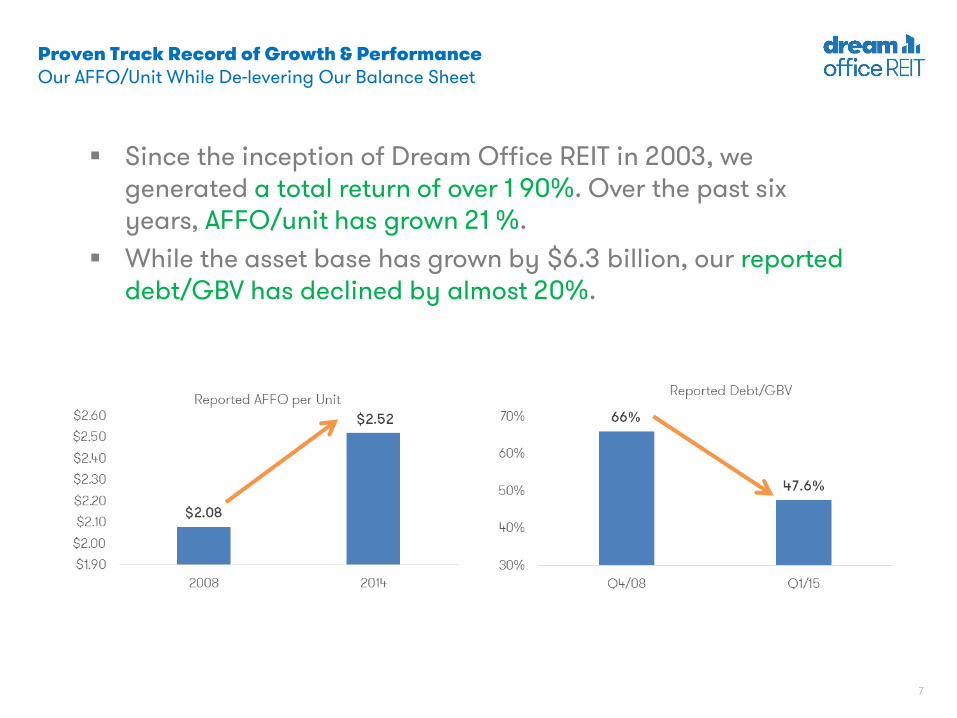
Since the inception of Dream Office REIT in 2003, we generated a total return of over 1 90%. Over the past six years, AFFO/unit has grown 21 %.
While the asset base has grown by $6.3 billion, our reported debt/GBV has declined by almost 20%.
Proven Track Record of Growth & PerformanceOur AFFO/Unit While De-levering Our Balance Sheet
8
Bo
ok
Va
lue
of
Tota
l Ass
ets
($
mil
lio
ns)
AFFO Per Unit
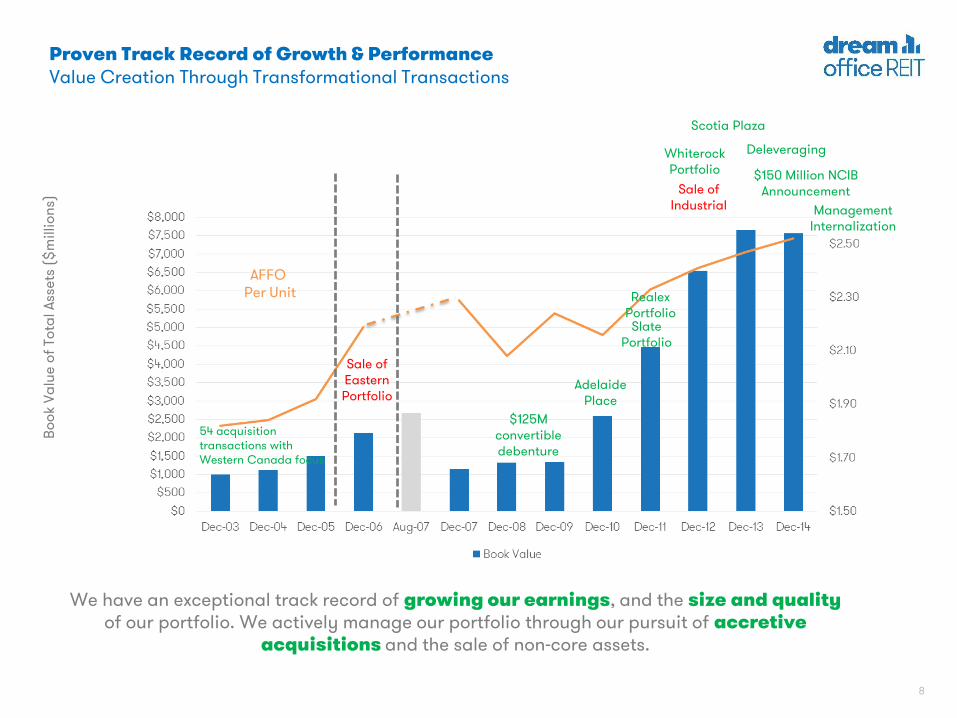
54 acquisition transactions with Western Canada focus
Sale ofEasternPortfolio
$125Mconvertible debenture
AdelaidePlace
SlatePortfolio
Sale ofIndustrial
Scotia Plaza
$150 Million NCIB Announcement
Proven Track Record of Growth & PerformanceValue Creation Through Transformational Transactions
WhiterockPortfolio
RealexPortfolio
We have an exceptional track record of growing our earnings, and the size and quality of our portfolio. We actively manage our portfolio through our pursuit of accretive
acquisitions and the sale of non-core assets.
Deleveraging
Management Internalization
9
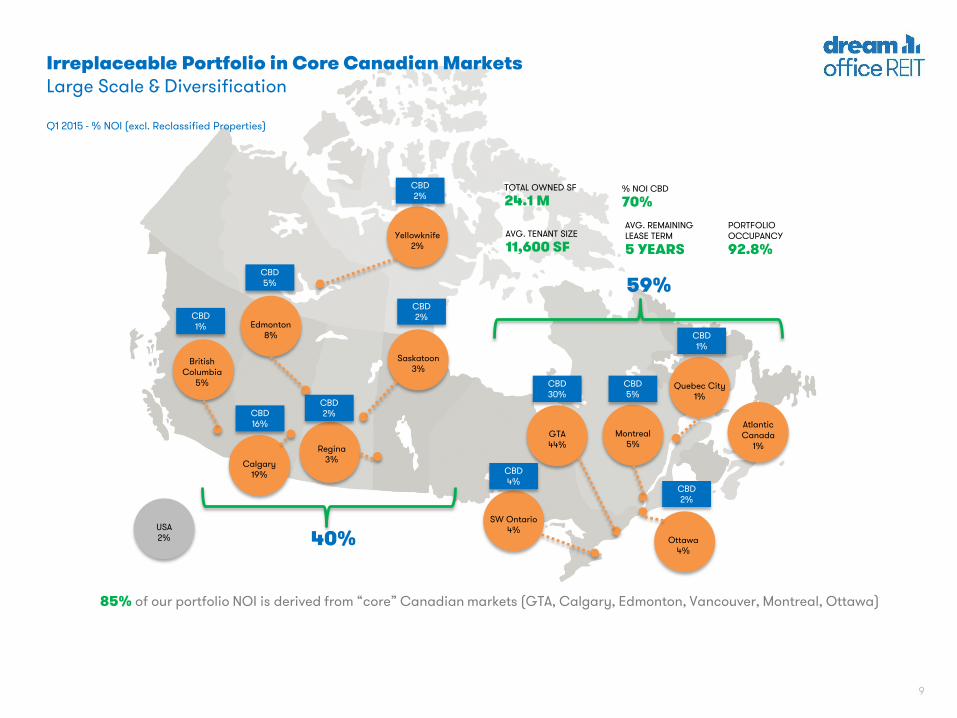
% NOI CBD
70%TOTAL OWNED SF
24.1 M
BritishColumbia
5%
Calgary19%
Yellowknife2%
Edmonton8%
Saskatoon3%
Regina3%
GTA44%
SW Ontario4%
Ottawa4%
Montreal5%
Quebec City1%
AtlanticCanada
1%
USA2%
CBD1%
CBD5%
CBD16%
CBD2%
CBD2%
CBD2%
CBD4%
CBD30%
CBD5%
CBD1%
CBD2%
40%
85% of our portfolio NOI is derived from “core” Canadian markets (GTA, Calgary, Edmonton, Vancouver, Montreal, Ottawa)
59%
AVG. TENANT SIZE
11,600 SF
AVG. REMAINING LEASE TERM
5 YEARS
PORTFOLIOOCCUPANCY
92.8%
Irreplaceable Portfolio in Core Canadian MarketsLarge Scale & Diversification
Q1 2015 - % NOI (excl. Reclassified Properties)
10
11,363
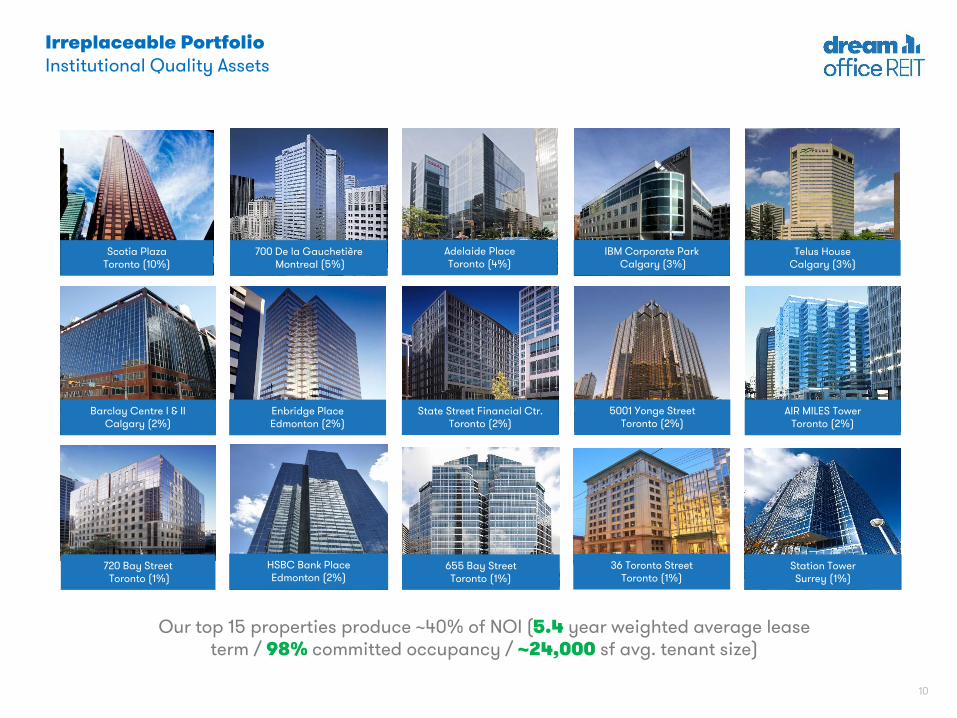
Scotia PlazaToronto (10%)
700 De la GauchetièreMontreal (5%)
Adelaide PlaceToronto (4%)
IBM Corporate ParkCalgary (3%)
Telus HouseCalgary (3%)
State Street Financial Ctr.Toronto (2%)
Enbridge PlaceEdmonton (2%)
Barclay Centre I & IICalgary (2%)
5001 Yonge StreetToronto (2%)
AIR MILES TowerToronto (2%)
655 Bay StreetToronto (1%)
HSBC Bank PlaceEdmonton (2%)
Station TowerSurrey (1%)
Irreplaceable PortfolioInstitutional Quality Assets
Our top 15 properties produce ~40% of NOI (5.4 year weighted average lease term / 98% committed occupancy / ~24,000 sf avg. tenant size)
36 Toronto StreetToronto (1%)
720 Bay StreetToronto (1%)
11
12
3
4
5
6
7
25
16
18
8
26
1320
9
12
10
17
14
22
2411
2123
19
15
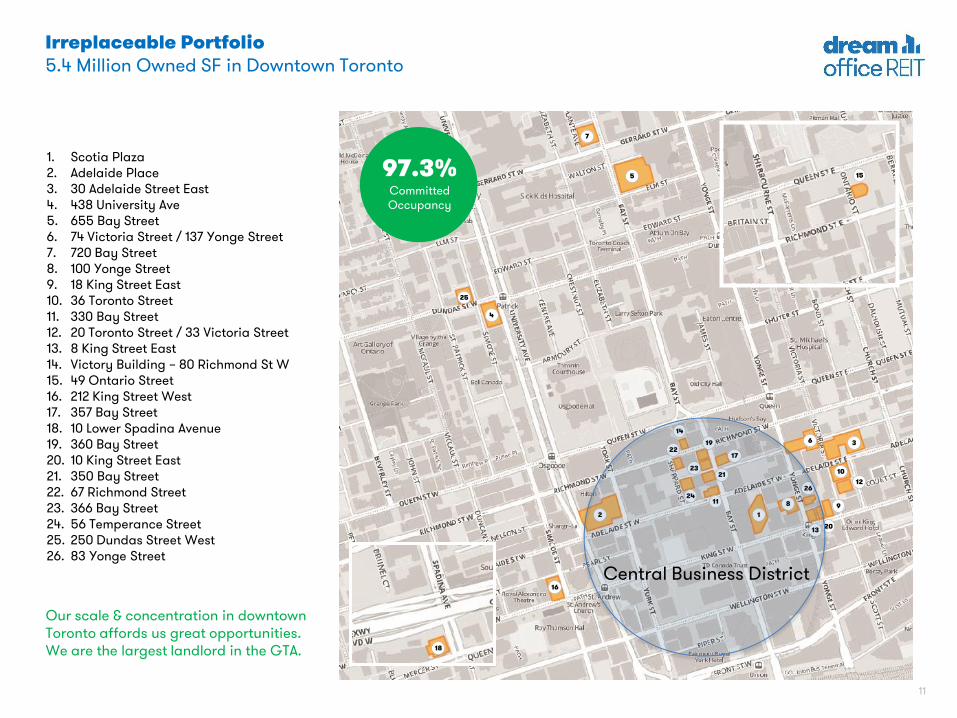
Our scale & concentration in downtown Toronto affords us great opportunities. We are the largest landlord in the GTA.
Irreplaceable Portfolio5.4 Million Owned SF in Downtown Toronto
1. Scotia Plaza2. Adelaide Place3. 30 Adelaide Street East4. 438 University Ave5. 655 Bay Street6. 74 Victoria Street / 137 Yonge Street7. 720 Bay Street8. 100 Yonge Street9. 18 King Street East10. 36 Toronto Street11. 330 Bay Street12. 20 Toronto Street / 33 Victoria Street13. 8 King Street East14. Victory Building – 80 Richmond St W15. 49 Ontario Street16. 212 King Street West17. 357 Bay Street18. 10 Lower Spadina Avenue19. 360 Bay Street20. 10 King Street East21. 350 Bay Street22. 67 Richmond Street23. 366 Bay Street24. 56 Temperance Street25. 250 Dundas Street West26. 83 Yonge Street
97.3% Committed Occupancy
Central Business District
12
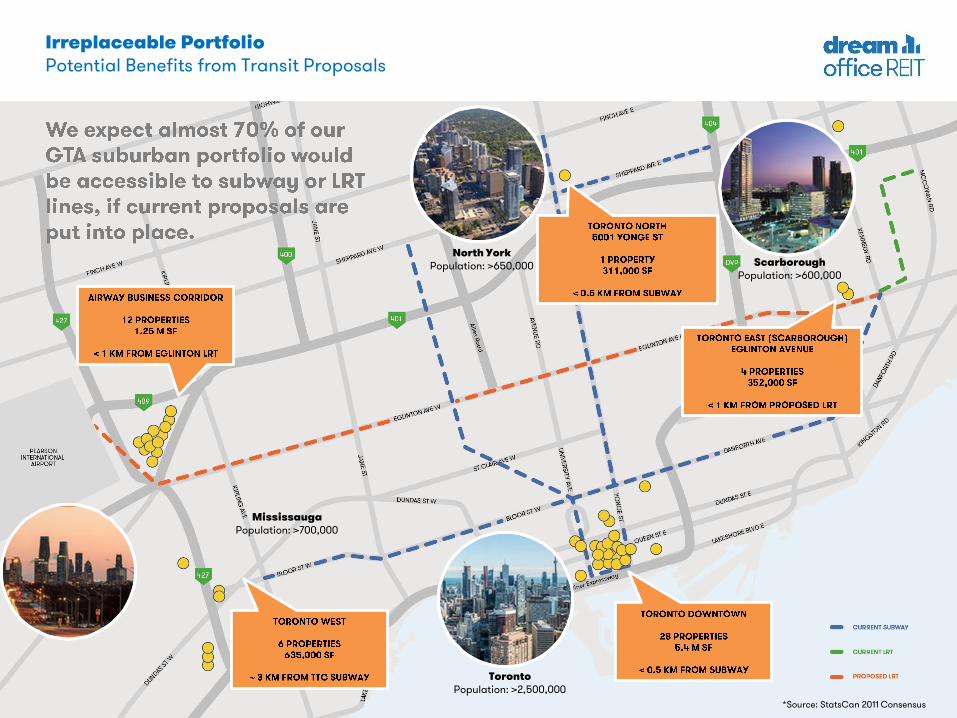
Irreplaceable PortfolioPotential Benefits from Transit Proposals
ScarboroughPopulation: >600,000
*Source: StatsCan 2011 Consensus
North YorkPopulation: >650,000
MississaugaPopulation: >700,000
TorontoPopulation: >2,500,000
13
Suburb?
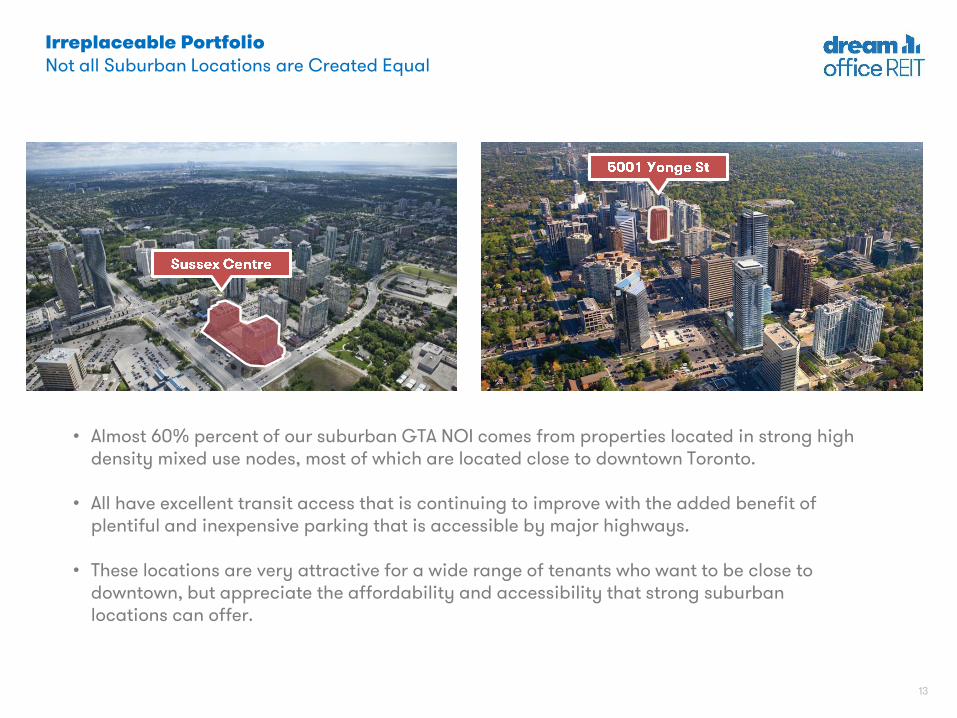
• Almost 60% percent of our suburban GTA NOI comes from properties located in strong high density mixed use nodes, most of which are located close to downtown Toronto.
• All have excellent transit access that is continuing to improve with the added benefit of plentiful and inexpensive parking that is accessible by major highways.
• These locations are very attractive for a wide range of tenants who want to be close to downtown, but appreciate the affordability and accessibility that strong suburban locations can offer.
Suburb?Irreplaceable PortfolioNot all Suburban Locations are Created Equal
14
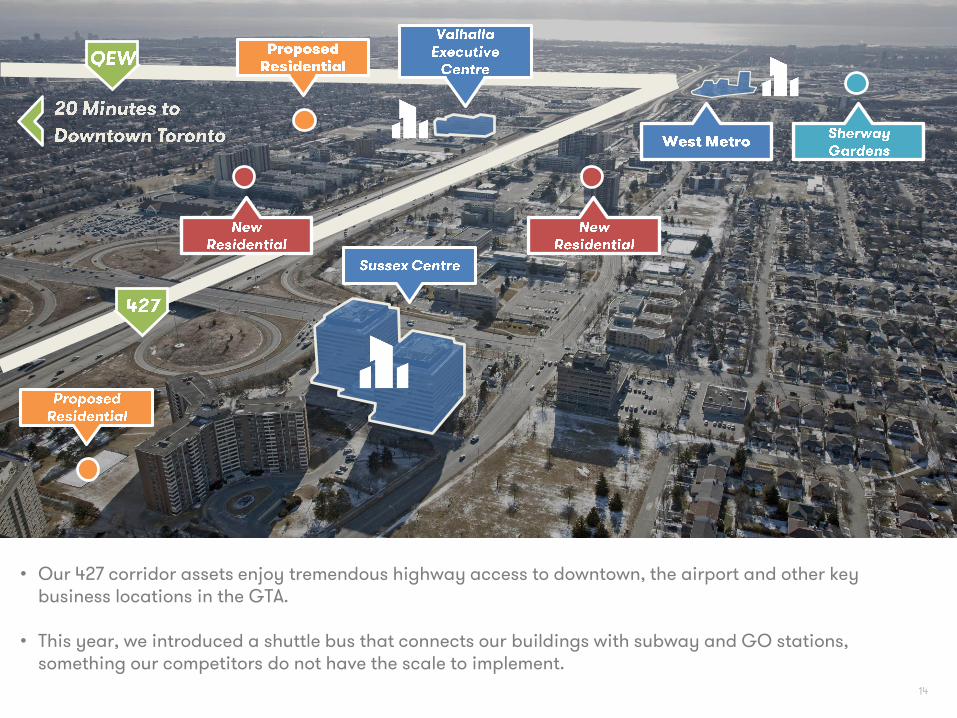
• Our 427 corridor assets enjoy tremendous highway access to downtown, the airport and other key business locations in the GTA.
• This year, we introduced a shuttle bus that connects our buildings with subway and GO stations, something our competitors do not have the scale to implement.
15
Managing RiskGeographic and Tenant Diversification
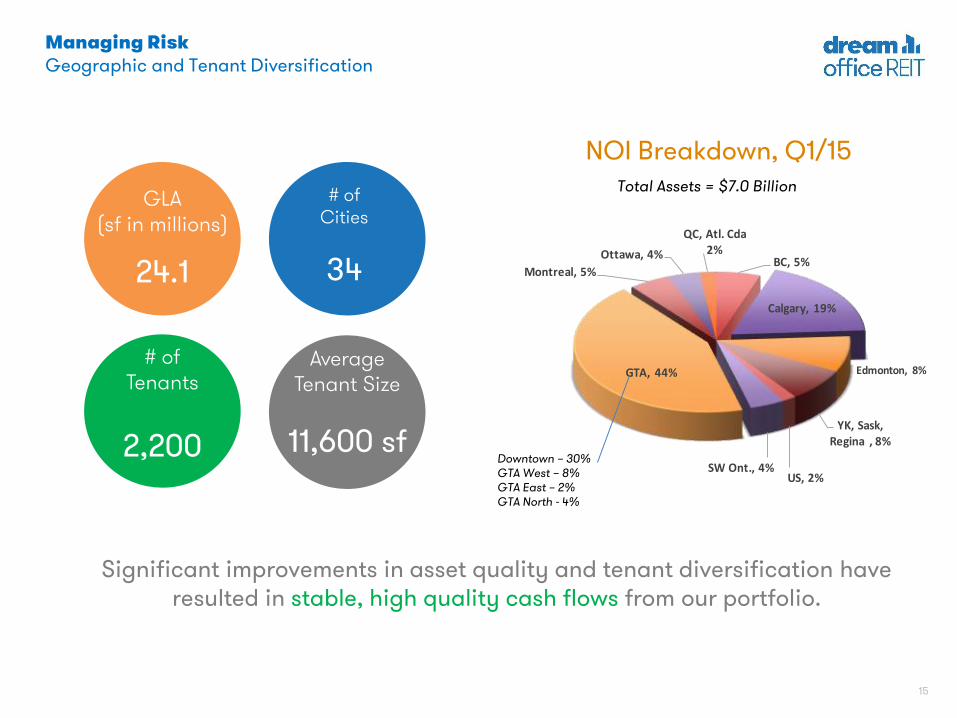
NOI Breakdown, Q1/15Total Assets = $7.0 Billion
BC, 5%
Calgary, 19%
Edmonton, 8%
YK, Sask, Regina , 8%
US, 2%SW Ont., 4%
GTA, 44%
Montreal, 5%
Ottawa, 4%
QC, Atl. Cda2%
Downtown – 30%GTA West – 8%GTA East – 2%GTA North - 4%
# of Tenants
2,200
GLA(sf in millions)
24.1
Average Tenant Size
11,600 sf
# of Cities
34
Significant improvements in asset quality and tenant diversification have resulted in stable, high quality cash flows from our portfolio.
16
Managing RiskTenant Diversification
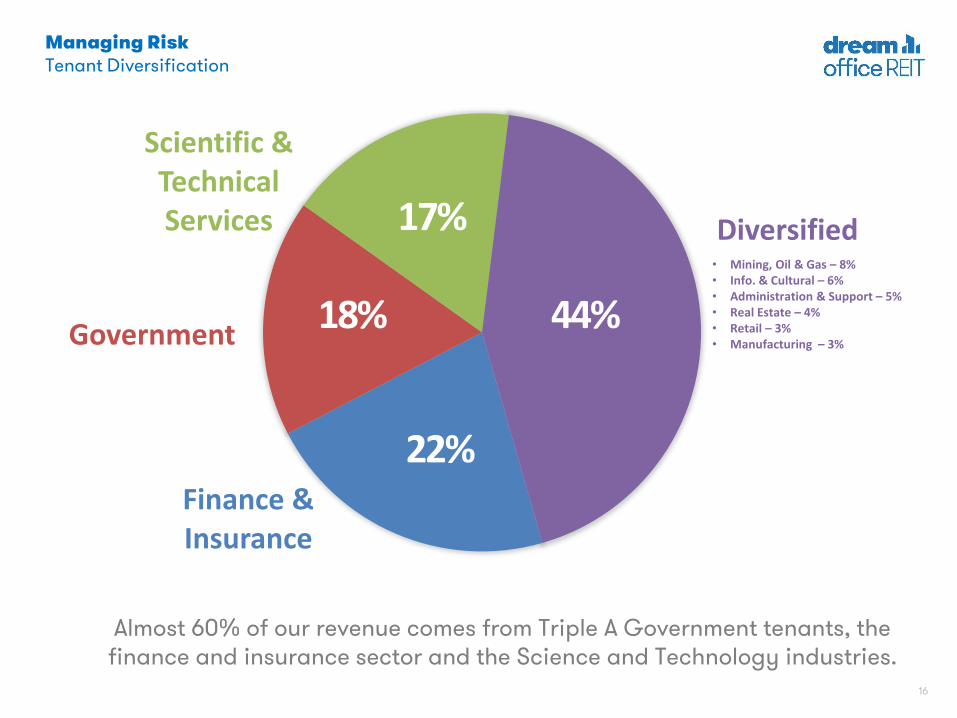
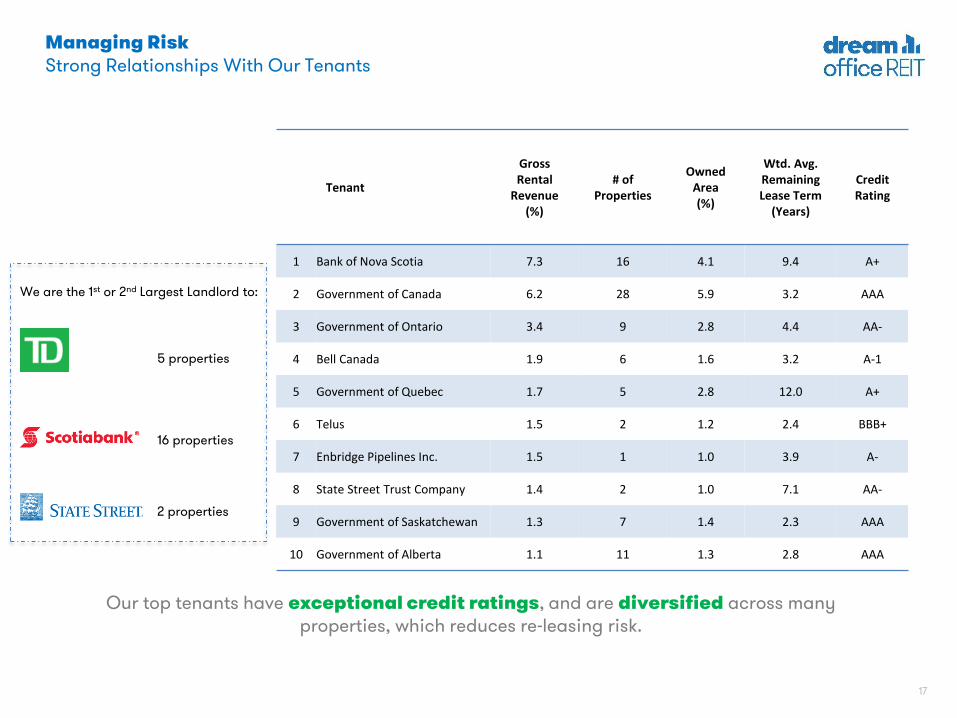
Almost 60% of our revenue comes from Triple A Government tenants, the finance and insurance sector and the Science and Technology industries.
Finance & Insurance
Government
Scientific & Technical Services Diversified
22%
18%
17%• Mining, Oil & Gas – 8%• Info. & Cultural – 6%• Administration & Support – 5%• Real Estate – 4%• Retail – 3%• Manufacturing – 3%
44%
17
Tenant
Gross Rental
Revenue(%)
# of Properties
Owned Area(%)
Wtd. Avg. Remaining Lease Term
(Years)
CreditRating
1 Bank of Nova Scotia 7.3 16 4.1 9.4 A+
2 Government of Canada 6.2 28 5.9 3.2 AAA
3 Government of Ontario 3.4 9 2.8 4.4 AA-
4 Bell Canada 1.9 6 1.6 3.2 A-1
5 Government of Quebec 1.7 5 2.8 12.0 A+
6 Telus 1.5 2 1.2 2.4 BBB+
7 Enbridge Pipelines Inc. 1.5 1 1.0 3.9 A-
8 State Street Trust Company 1.4 2 1.0 7.1 AA-
9 Government of Saskatchewan 1.3 7 1.4 2.3 AAA
10 Government of Alberta 1.1 11 1.3 2.8 AAA
Managing RiskStrong Relationships With Our Tenants
Our top tenants have exceptional credit ratings, and are diversified across many properties, which reduces re-leasing risk.
We are the 1st or 2nd Largest Landlord to:
5 properties
16 properties
2 properties
18
-
2,000,000
4,000,000
6,000,000
8,000,000
1 0,000,000
1 2,000,000
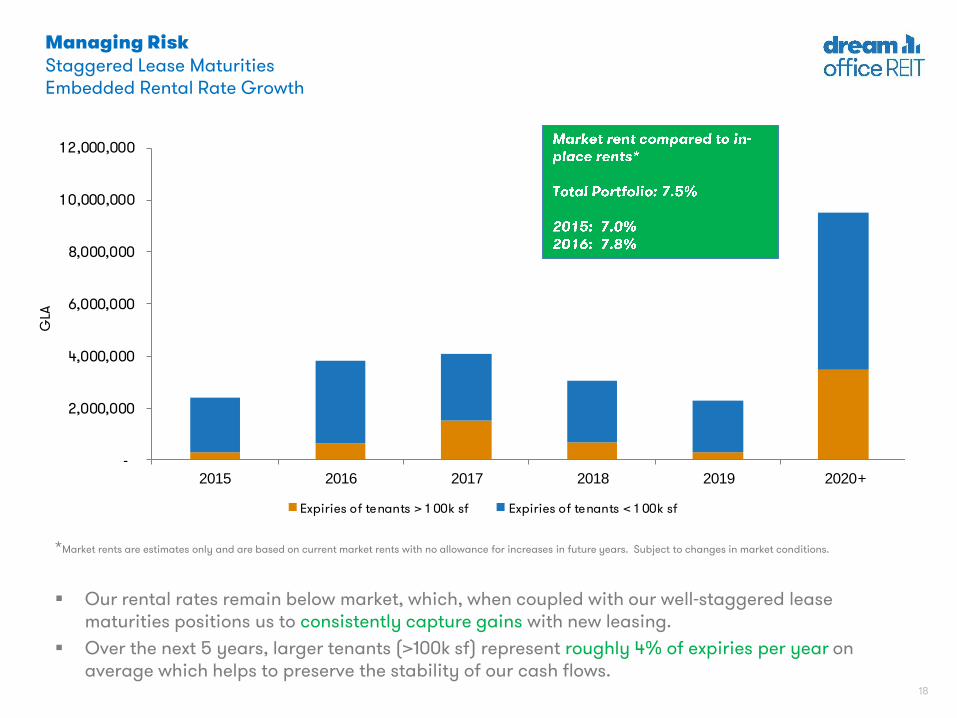
2015 2016 2017 2018 2019 2020+
Expiries of tenants > 1 00k sf Expiries of tenants < 1 00k sf
*Market rents are estimates only and are based on current market rents with no allowance for increases in future years. Subject to changes in market conditions.
Managing RiskStaggered Lease MaturitiesEmbedded Rental Rate Growth
Our rental rates remain below market, which, when coupled with our well-staggered lease maturities positions us to consistently capture gains with new leasing.
Over the next 5 years, larger tenants (>100k sf) represent roughly 4% of expiries per year on average which helps to preserve the stability of our cash flows.
GLA
19
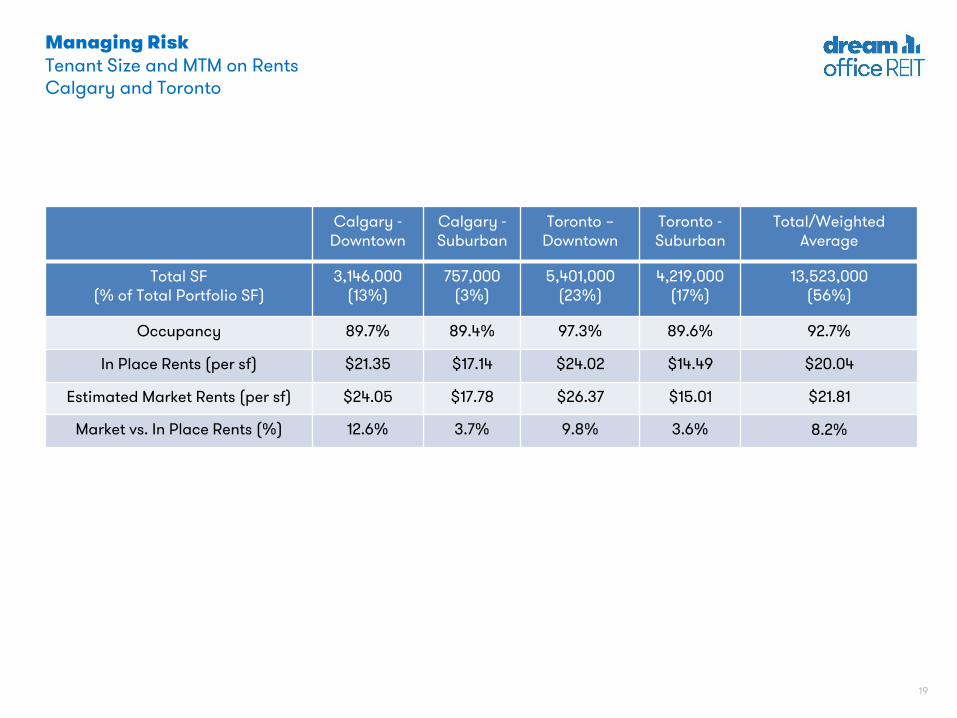
Managing RiskTenant Size and MTM on RentsCalgary and Toronto
6,000 SF
4,200 SF
7,400 SF
3,800 SF
13,000 SF
5,800 SF
6,300 SF
9,400 SF
7,200 SF
AverageTenant
Size
Calgary -Downtown
Calgary -Suburban
Toronto –Downtown
Toronto -Suburban
Total/Weighted Average
Total SF (% of Total Portfolio SF)
3,146,000 (13%)
757,000 (3%)
5,401,000 (23%)
4,219,000 (17%)
13,523,000(56%)
Occupancy 89.7% 89.4% 97.3% 89.6% 92.7%
In Place Rents (per sf) $21.35 $17.14 $24.02 $14.49 $20.04
Estimated Market Rents (per sf) $24.05 $17.78 $26.37 $15.01 $21.81
Market vs. In Place Rents (%) 12.6% 3.7% 9.8% 3.6% 8.2%
20
86%
88%
90%
92%
94%
96%
98%
100%
2003 2004 2005 2006 2007 2008 2009 2010 2011 2012 2013 2014 Q1/15
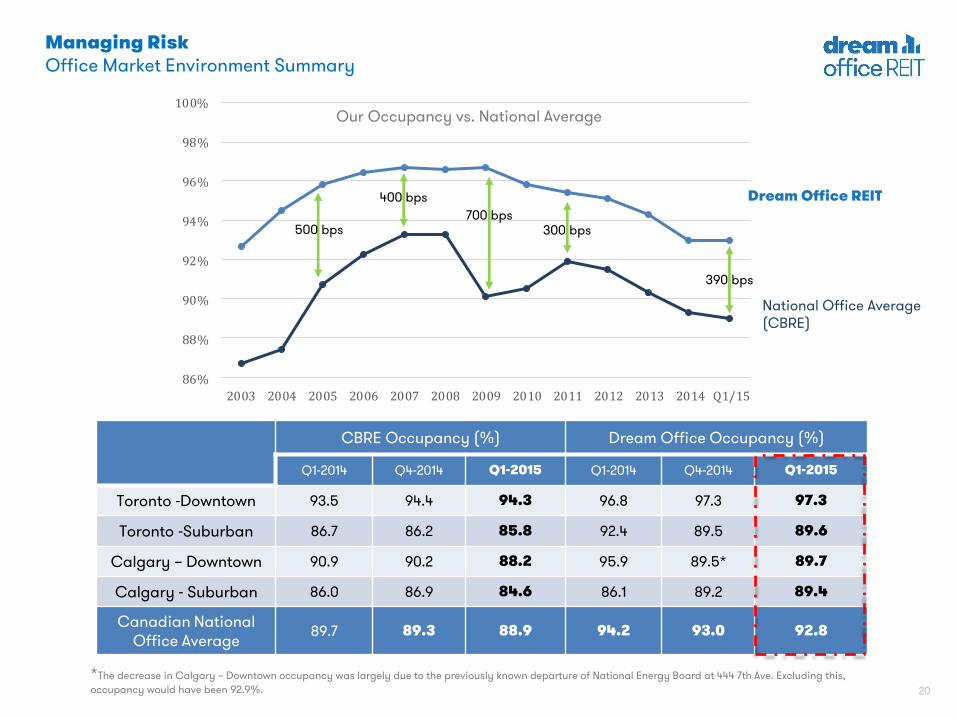
Managing RiskOffice Market Environment Summary
Net Absorption1.4 M sq. ft.
Development Pipeline
22.3 M sq. ft.
CBRE Occupancy (%) Dream Office Occupancy (%)
Q1-2014 Q4-2014 Q1-2015 Q1-2014 Q4-2014 Q1-2015
Toronto -Downtown 93.5 94.4 94.3 96.8 97.3 97.3
Toronto -Suburban 86.7 86.2 85.8 92.4 89.5 89.6
Calgary – Downtown 90.9 90.2 88.2 95.9 89.5* 89.7
Calgary - Suburban 86.0 86.9 84.6 86.1 89.2 89.4
Canadian National Office Average
89.7 89.3 88.9 94.2 93.0 92.8
Our Occupancy vs. National Average
700 bps
390 bps
300 bps500 bps
Dream Office REIT400 bps
National Office Average(CBRE)
*The decrease in Calgary – Downtown occupancy was largely due to the previously known departure of National Energy Board at 444 7th Ave. Excluding this,
occupancy would have been 92.9%.
21
0
200
400
600
800
1,000
1,200
1,400
1,600
2015 2016 2017 2018 2019 2020+
Calgary Downtown Calgary Suburban Edmonton Downtown Edmonton Suburban
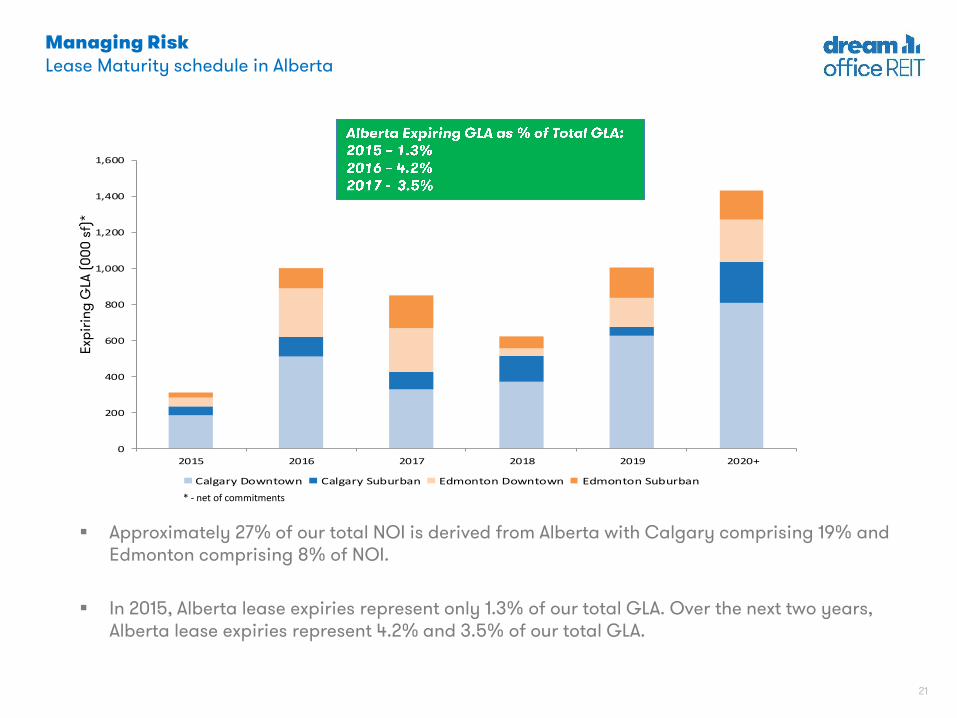
Managing RiskLease Maturity schedule in Alberta
Approximately 27% of our total NOI is derived from Alberta with Calgary comprising 19% and Edmonton comprising 8% of NOI.
In 2015, Alberta lease expiries represent only 1.3% of our total GLA. Over the next two years, Alberta lease expiries represent 4.2% and 3.5% of our total GLA.
Exp
irin
g G
LA (
00
0 s
f)*
* - net of commitments
22
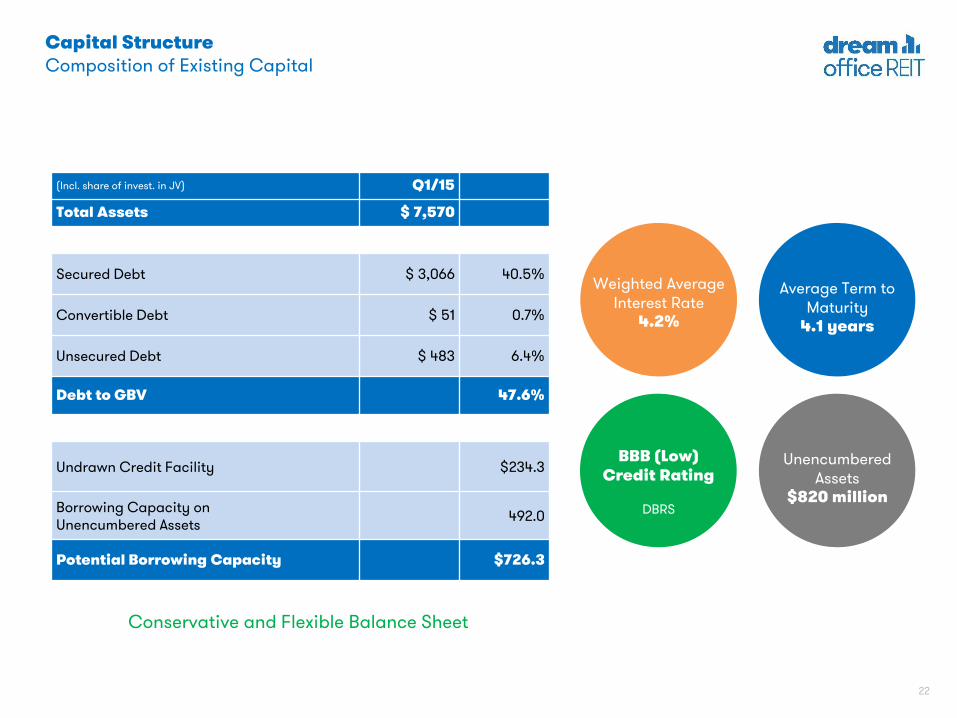
BBB (Low)Credit Rating
DBRS
(Incl. share of invest. in JV) Q1/15
Total Assets $ 7,570
Secured Debt $ 3,066 40.5%
Convertible Debt $ 51 0.7%
Unsecured Debt $ 483 6.4%
Debt to GBV 47.6%
Undrawn Credit Facility $234.3
Borrowing Capacity on Unencumbered Assets
492.0
Potential Borrowing Capacity $726.3
Weighted Average Interest Rate
4.2%
Average Term to Maturity
4.1 years
Capital StructureComposition of Existing Capital
Conservative and Flexible Balance Sheet
Unencumbered Assets
$820 million
23
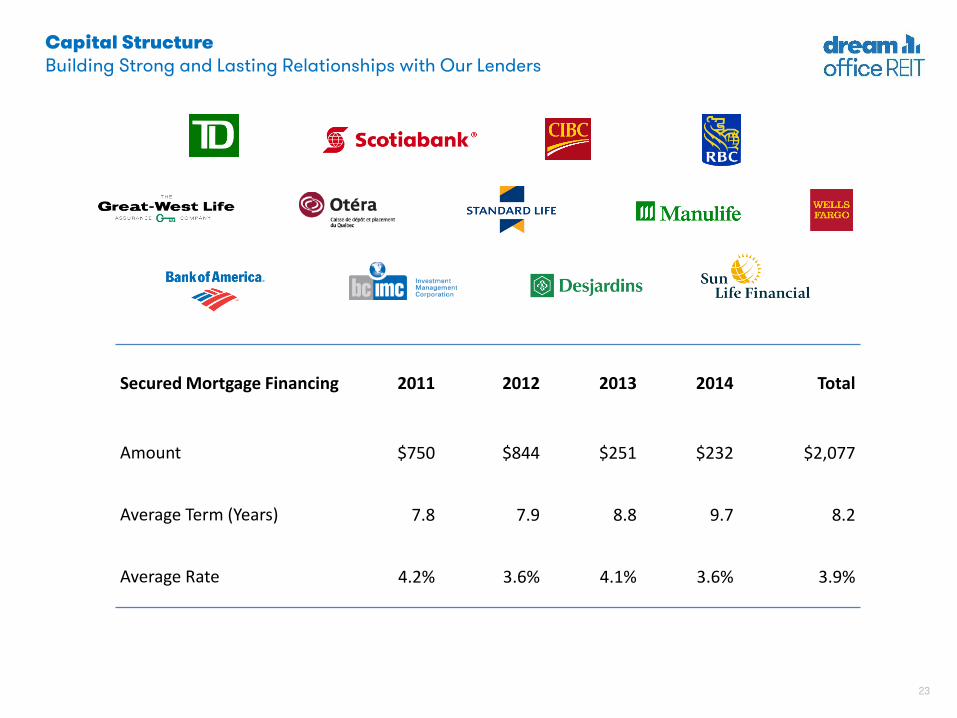
Capital StructureBuilding Strong and Lasting Relationships with Our Lenders
Secured Mortgage Financing 2011 2012 2013 2014 Total
Amount $750 $844 $251 $232 $2,077
Average Term (Years) 7.8 7.9 8.8 9.7 8.2
Average Rate 4.2% 3.6% 4.1% 3.6% 3.9%
24
4.0%
4.4%4.5%
3.9%
3.3%
4.3%
5.2%
4.2%
4.0%
2.5%
3.0%
3.5%
4.0%
4.5%
5.0%
5.5%
0
100
200
300
400
500
600
700
2015 2016 2017 2018 2019 2020 2021 2022 2023+
Unsecured Secured Weighted Average Face Rate
Tota
l De
bt
Ma
turi
tie
s ($
mil
lio
ns)
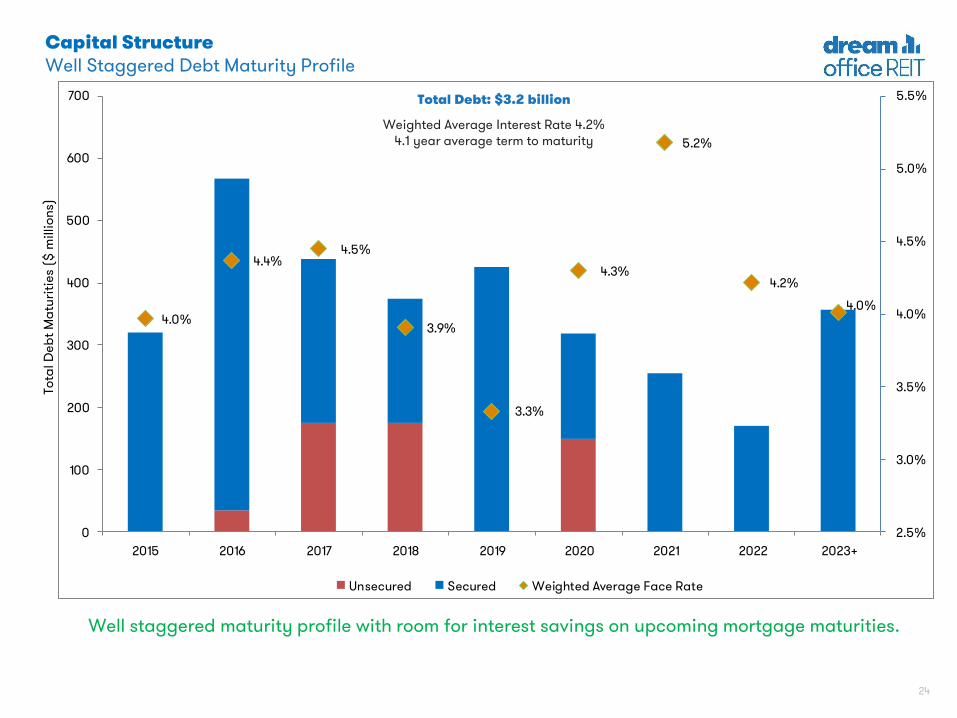
Weighted Average Interest Rate 4.2%4.1 year average term to maturity
Capital StructureWell Staggered Debt Maturity Profile
Well staggered maturity profile with room for interest savings on upcoming mortgage maturities.
Total Debt: $3.2 billion
25
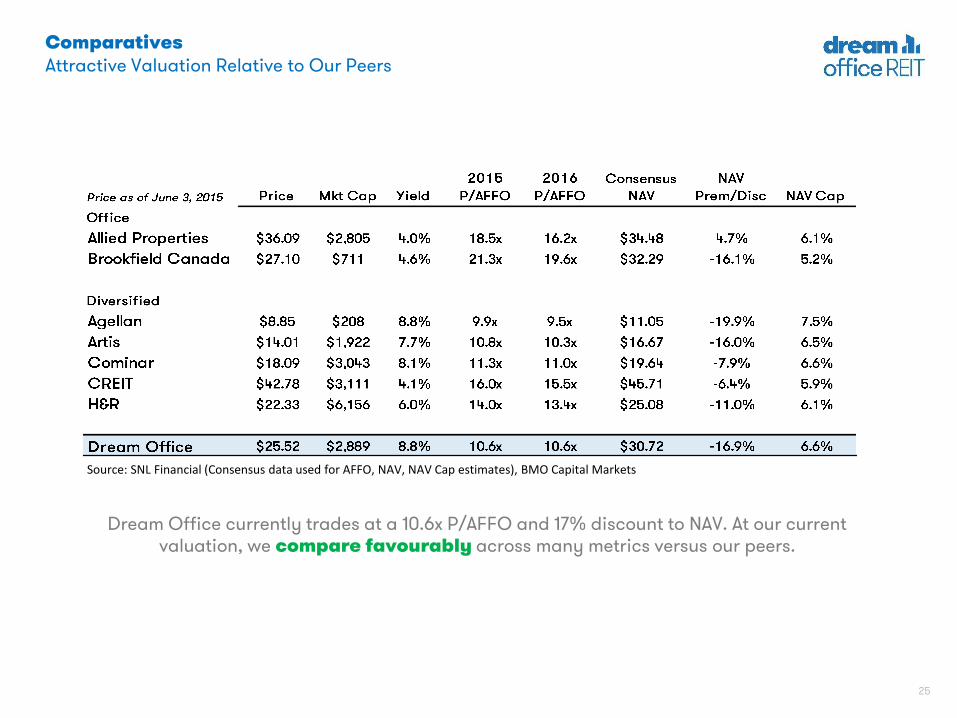
ComparativesAttractive Valuation Relative to Our Peers
Dream Office currently trades at a 10.6x P/AFFO and 17% discount to NAV. At our current valuation, we compare favourably across many metrics versus our peers.
Source: SNL Financial (Consensus data used for AFFO, NAV, NAV Cap estimates), BMO Capital Markets
26
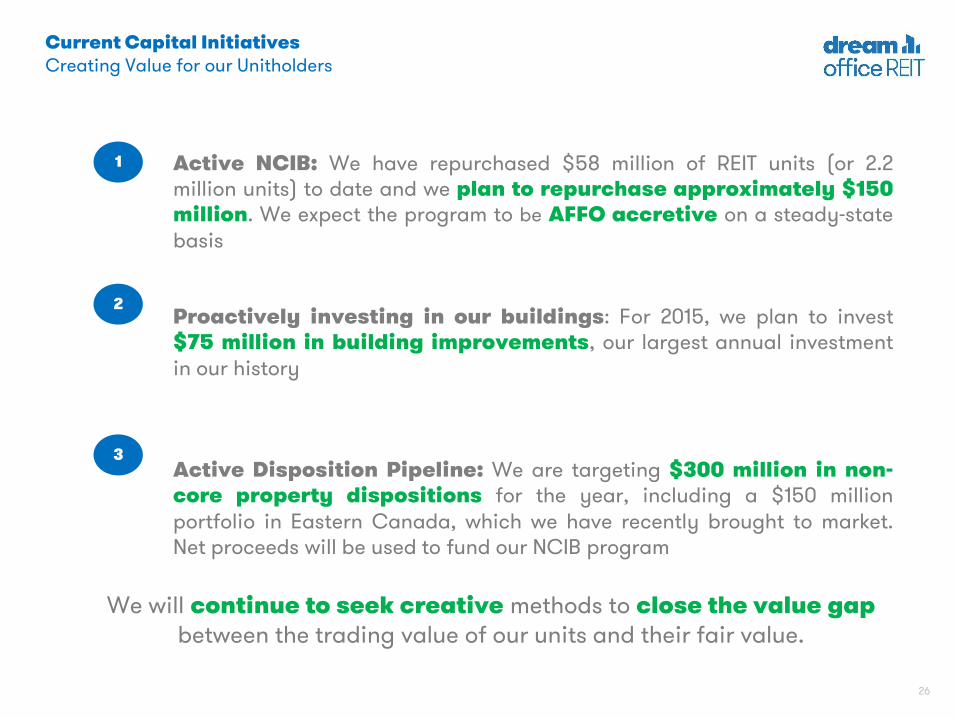
Current Capital InitiativesCreating Value for our Unitholders
Active NCIB: We have repurchased $58 million of REIT units (or 2.2million units) to date and we plan to repurchase approximately $150million. We expect the program to be AFFO accretive on a steady-statebasis
Proactively investing in our buildings: For 2015, we plan to invest$75 million in building improvements, our largest annual investmentin our history
Active Disposition Pipeline: We are targeting $300 million in non-core property dispositions for the year, including a $150 millionportfolio in Eastern Canada, which we have recently brought to market.Net proceeds will be used to fund our NCIB program
We will continue to seek creative methods to close the value gap between the trading value of our units and their fair value.
1
2
3
27
At current valuation, with our current portfolio, management team and strategy, we believe we are a very compelling investment.
The Current Opportunity
Dream Office REIT is currently generating a 8.8% cash yield and an 8%+ AFFOyield (on consensus estimates)
We are conservatively financed in our view with our current debt to gross book
value ratio of approximately 47.6% We own a collection of assets that are hard to replicate, with our portfolio quality at
its best in our history We believe that our ability to meet tenants’ needs in our portfolio, our relationships
and our contracts with tenants will help us outperform whatever benchmarks may beapplicable
Furthermore, we believe that with our scale and dedicated management team, wewill continue to generate increased and new sources of income
28
Appendix: Value Creation
29
Case Study
Suburban Modernization
Sussex Centre
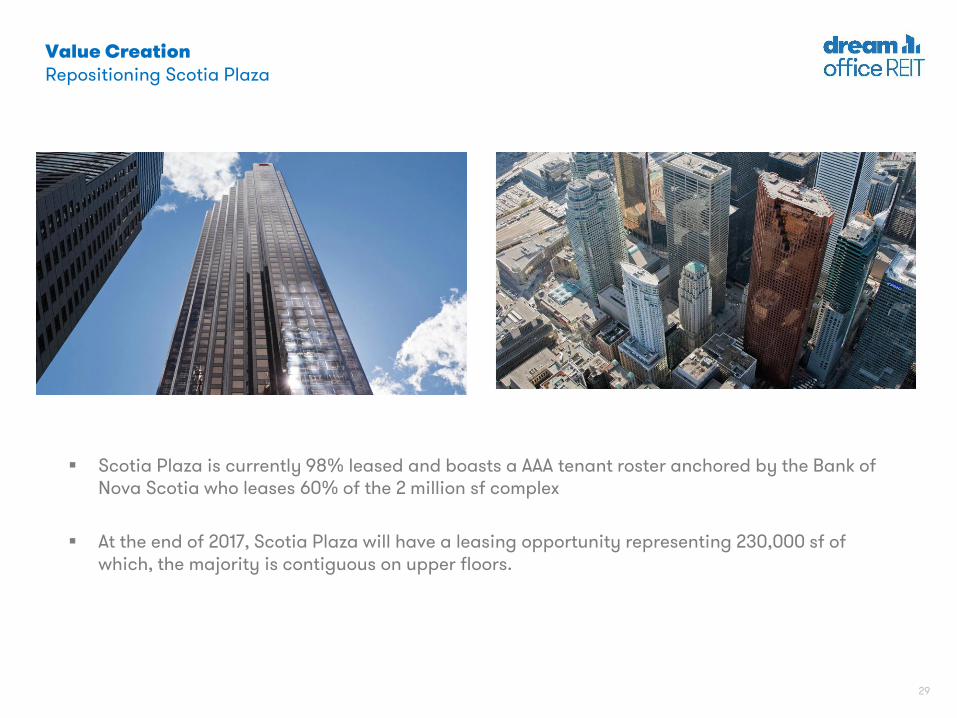
Value CreationRepositioning Scotia Plaza
Scotia Plaza is currently 98% leased and boasts a AAA tenant roster anchored by the Bank of Nova Scotia who leases 60% of the 2 million sf complex
At the end of 2017, Scotia Plaza will have a leasing opportunity representing 230,000 sf of which, the majority is contiguous on upper floors.
30
Case Study
Suburban Modernization
Sussex Centre
Value CreationRepositioning Scotia Plaza
We are rebranding Scotia Plaza with a three year capital plan that includes an $80M investment into state of the art systems, sustainability and common areas all targeted towards a superior tenant experience.
The first major capital project to kick off at Scotia Plaza is one directly linked to the needs of our tenant. We have commenced what will be the largest elevator modernization project in North America and have partnered with Schindler, a global leader in elevator technology.
Scotia Plaza will benefit from the same state of the art technology used in WTC4, Rockefeller Centre and The ICC Building in Hong Kong.
Over the next three years, we are revitalizing the main lobby, PATH, food-court and exterior forecourts on the King and Adelaide Street entrances.
31
Case Study
Suburban Modernization
Sussex Centre
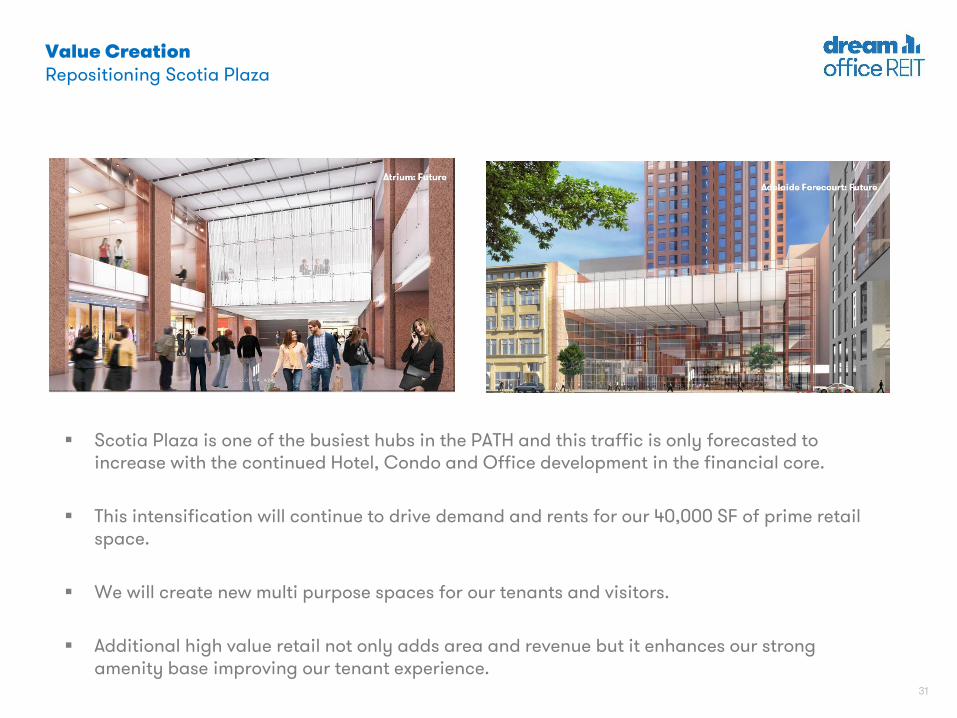
Value CreationRepositioning Scotia Plaza
Scotia Plaza is one of the busiest hubs in the PATH and this traffic is only forecasted to increase with the continued Hotel, Condo and Office development in the financial core.
This intensification will continue to drive demand and rents for our 40,000 SF of prime retail space.
We will create new multi purpose spaces for our tenants and visitors.
Additional high value retail not only adds area and revenue but it enhances our strong amenity base improving our tenant experience.
32
Case Study
Suburban Modernization
Sussex Centre
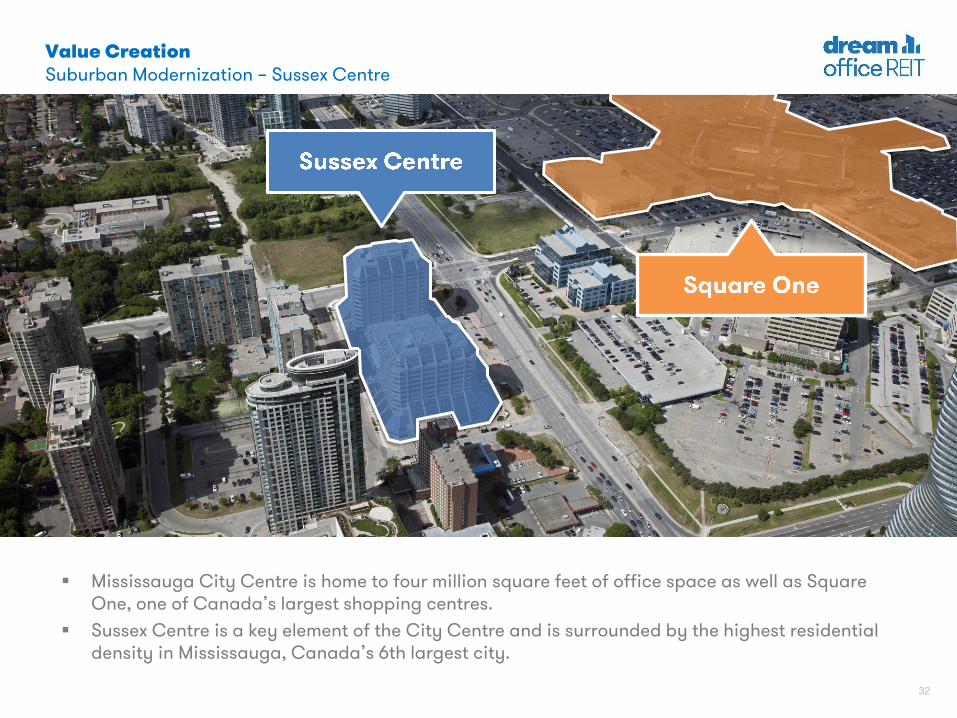
Value CreationSuburban Modernization – Sussex Centre
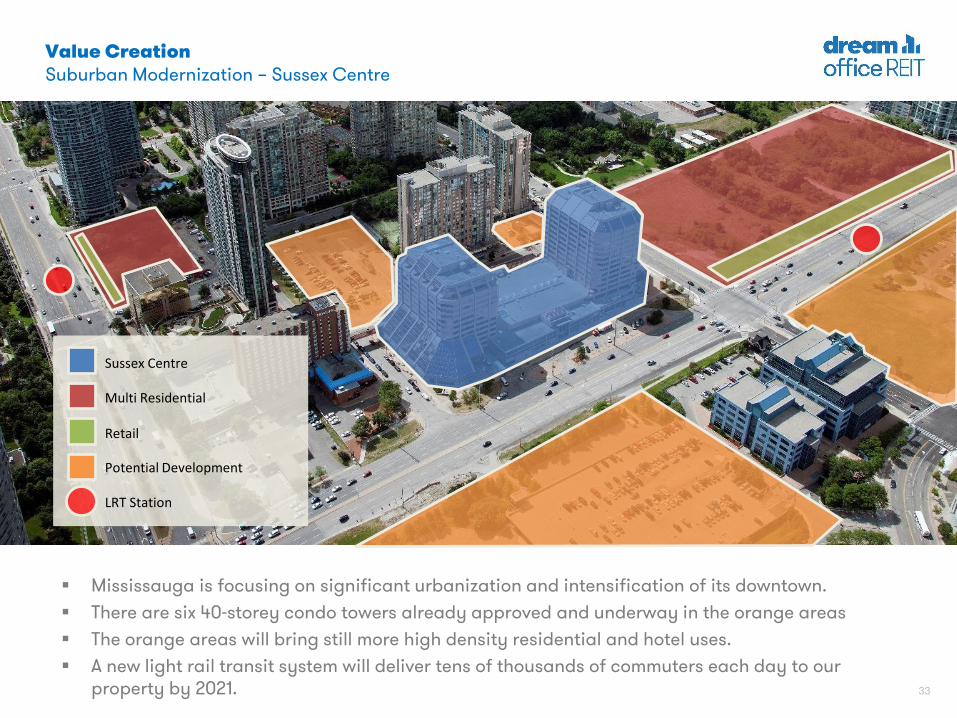
Mississauga City Centre is home to four million square feet of office space as well as Square One, one of Canada’s largest shopping centres.
Sussex Centre is a key element of the City Centre and is surrounded by the highest residential density in Mississauga, Canada’s 6th largest city.
33
Case Study
Suburban Modernization
Sussex Centre
Value CreationSuburban Modernization – Sussex Centre
Mississauga is focusing on significant urbanization and intensification of its downtown.
There are six 40-storey condo towers already approved and underway in the orange areas
The orange areas will bring still more high density residential and hotel uses.
A new light rail transit system will deliver tens of thousands of commuters each day to our property by 2021.
Multi Residential
Retail
LRT Station
Potential Development
Sussex Centre
34
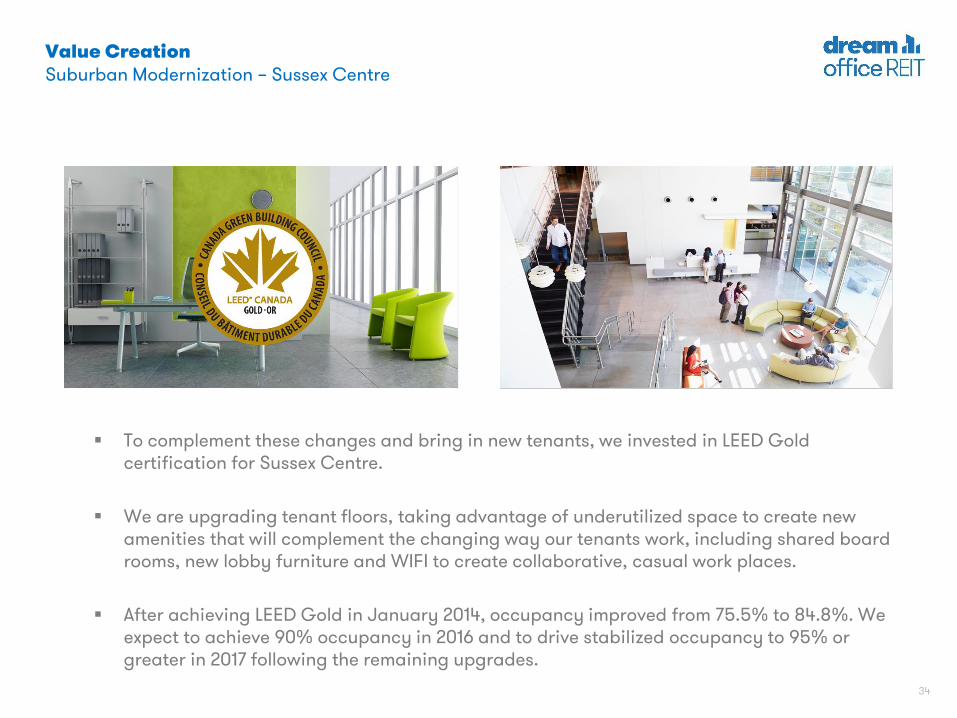
To complement these changes and bring in new tenants, we invested in LEED Gold certification for Sussex Centre.
We are upgrading tenant floors, taking advantage of underutilized space to create new amenities that will complement the changing way our tenants work, including shared board rooms, new lobby furniture and WIFI to create collaborative, casual work places.
After achieving LEED Gold in January 2014, occupancy improved from 75.5% to 84.8%. We expect to achieve 90% occupancy in 2016 and to drive stabilized occupancy to 95% or greater in 2017 following the remaining upgrades.
Value CreationSuburban Modernization – Sussex Centre
35
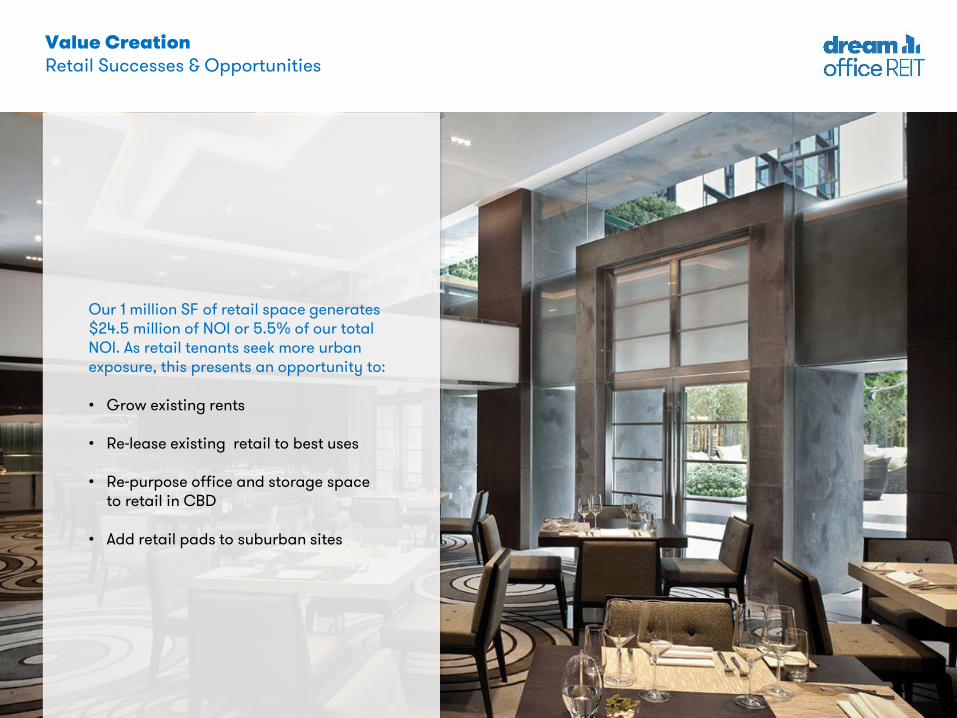
Our 1 million SF of retail space generates $24.5 million of NOI or 5.5% of our total NOI. As retail tenants seek more urban exposure, this presents an opportunity to:
• Grow existing rents
• Re-lease existing retail to best uses
• Re-purpose office and storage space to retail in CBD
• Add retail pads to suburban sites
Value CreationRetail Successes & Opportunities
36
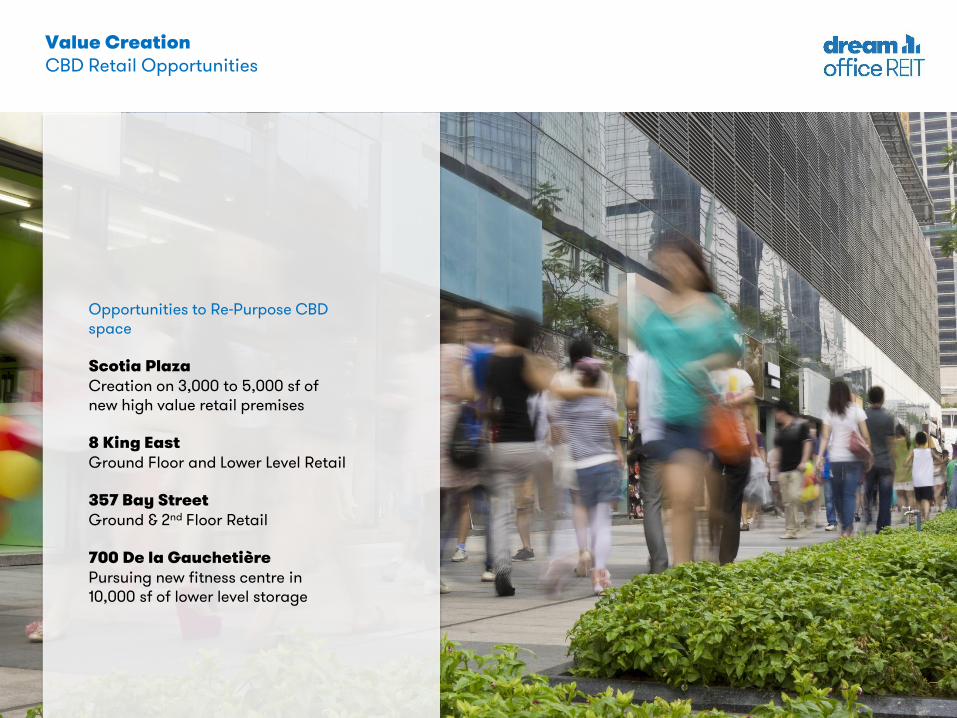
Opportunities to Re-Purpose CBD space
Scotia PlazaCreation on 3,000 to 5,000 sf of new high value retail premises
8 King EastGround Floor and Lower Level Retail
357 Bay StreetGround & 2nd Floor Retail
700 De la GauchetièrePursuing new fitness centre in 10,000 sf of lower level storage
Value CreationCBD Retail Opportunities
37
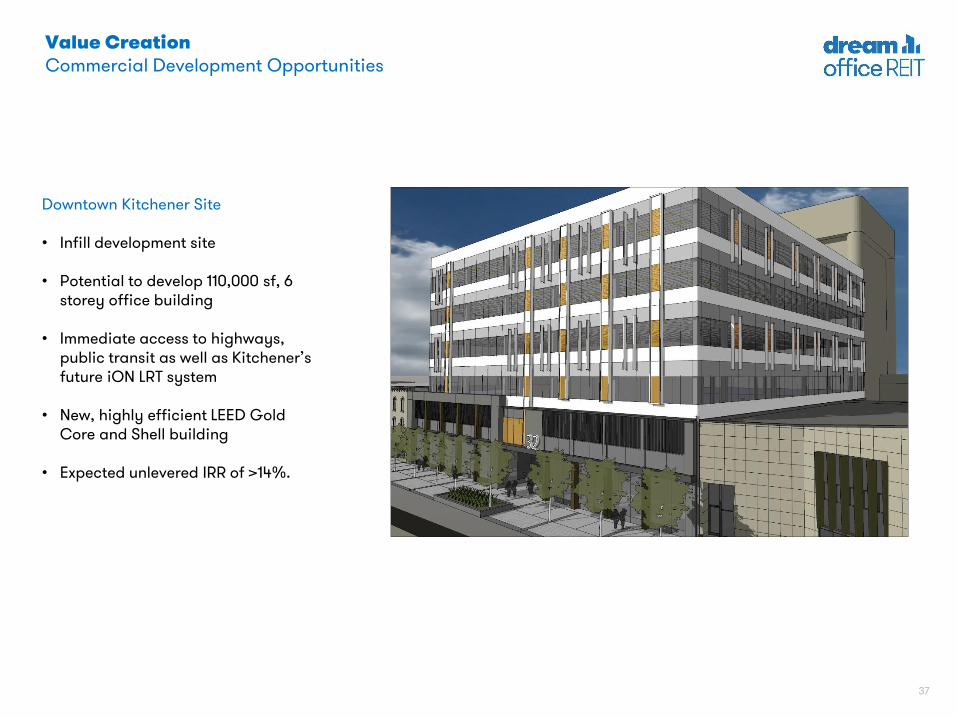
Downtown Kitchener Site
• Infill development site
• Potential to develop 110,000 sf, 6 storey office building
• Immediate access to highways, public transit as well as Kitchener’s future iON LRT system
• New, highly efficient LEED Gold Core and Shell building
• Expected unlevered IRR of >14%.
Value CreationCommercial Development Opportunities
38
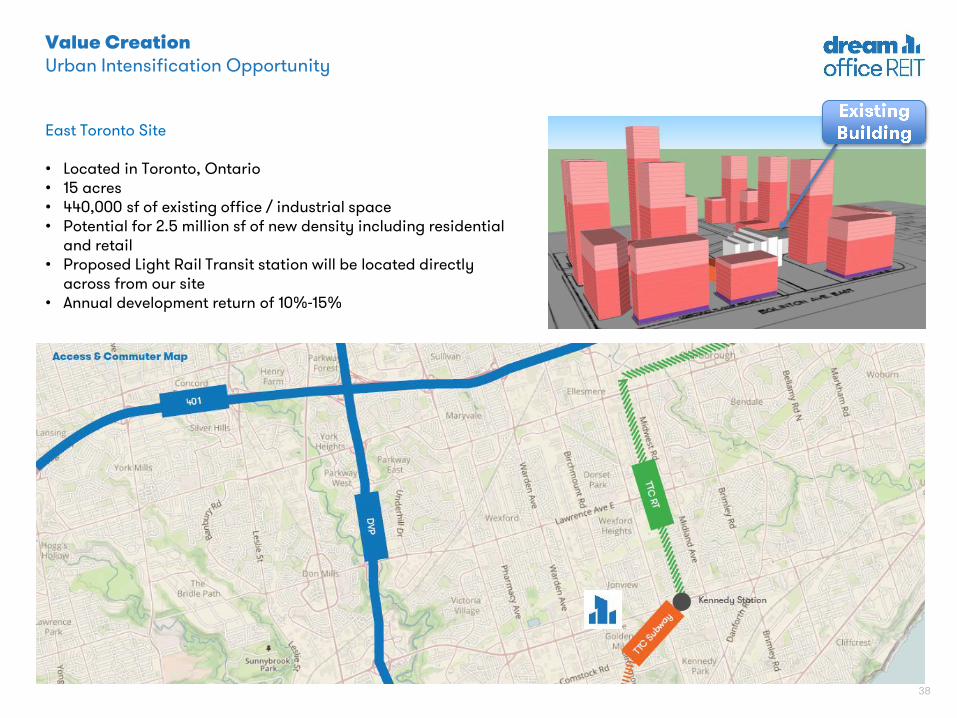
Value CreationUrban Intensification Opportunity
East Toronto Site
• Located in Toronto, Ontario• 15 acres• 440,000 sf of existing office / industrial space• Potential for 2.5 million sf of new density including residential
and retail• Proposed Light Rail Transit station will be located directly
across from our site• Annual development return of 10%-15%
39
40
Forward Looking Information
This slide presentation contains forward looking information within the meaning of
applicable securities legislation. Forward looking information is based on a number of
assumptions and is subject to a number of risks and uncertainties, many of which are
beyond Dream Office REIT's control, that could cause actual results to differ materially
from those that are disclosed in or implied by such forward looking information. These
risks and uncertainties include, but are not limited to, general and local economic and
business conditions; the financial condition of tenants; our ability to refinance maturing
debt; leasing risks, including those associated with the ability to lease vacant space. All
forward looking information in this presentation speaks as of June 3, 2015. Dream
Office REIT does not undertake to update any such forward looking information whether
as a result of new information, future events or otherwise. Additional information about
these assumptions and risks and uncertainties is disclosed in filings with securities
regulators filed on SEDAR (www.sedar.com).


![[Perforce] Perforce the Plentiful Platform](https://img.pdfslide.us/doc/110x75/5484017e5806b5bd588b45b9/perforce-perforce-the-plentiful-platform.jpg)