Embed Size (px)
Citation preview
Q1 IMS roadshow presentation
FEBRUARY 2013
1 1
2 2
Contents
1. Q1 IMS
2. Strategic overview
3. Fleet order objectives
3
Q1 IMS

4 4
Progress against strategic objectives
(1) At constant currency
1. Drive demand, conversion and yields across Europe
• Passenger numbers up by 6.2%
• Load factors increased by 1 percentage point
• Revenue per seat up by 8% (1)
• Operational roll-out of allocated seating successfully completed
2. Maintain cost advantage
• Cost per seat (excluding fuel) increase of less than 3%(1)
• easyJet Lean delivering sustainable savings
3. Build strong number 1 and 2 network positions
• Improving network returns
• New network points including Moscow, Luxembourg and Turin
4. Disciplined use of capital
• Sale and leaseback progressing
5 5
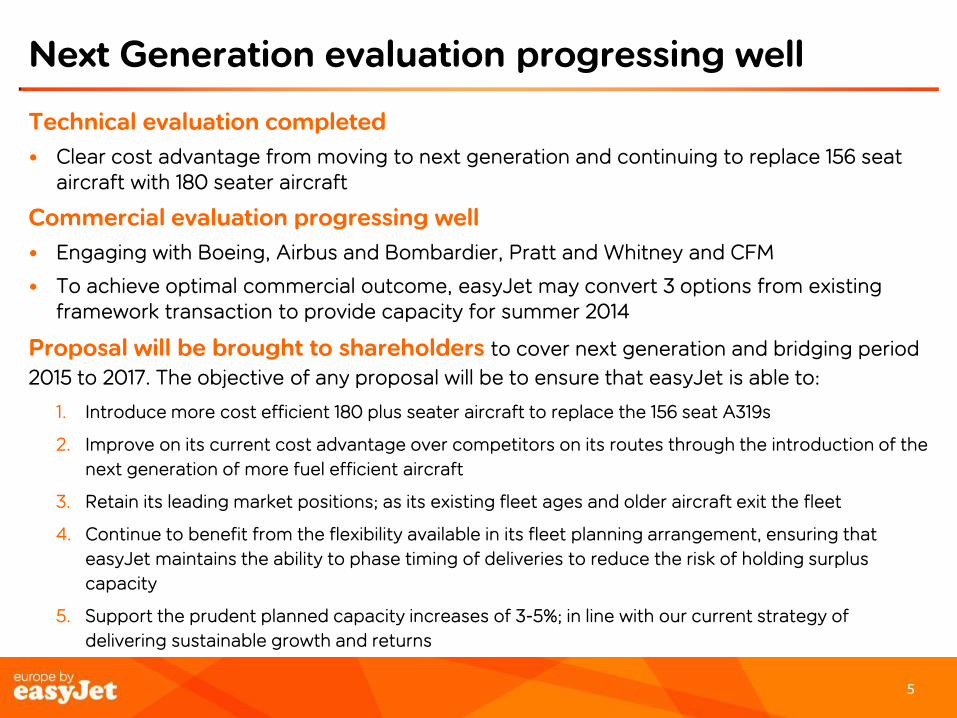
Next Generation evaluation progressing well
Technical evaluation completed
• Clear cost advantage from moving to next generation and continuing to replace 156 seat aircraft with 180 seater aircraft
Commercial evaluation progressing well
• Engaging with Boeing, Airbus and Bombardier, Pratt and Whitney and CFM
• To achieve optimal commercial outcome, easyJet may convert 3 options from existing framework transaction to provide capacity for summer 2014
Proposal will be brought to shareholders to cover next generation and bridging period
2015 to 2017. The objective of any proposal will be to ensure that easyJet is able to:
1. Introduce more cost efficient 180 plus seater aircraft to replace the 156 seat A319s
2. Improve on its current cost advantage over competitors on its routes through the introduction of the
next generation of more fuel efficient aircraft
3. Retain its leading market positions; as its existing fleet ages and older aircraft exit the fleet
4. Continue to benefit from the flexibility available in its fleet planning arrangement, ensuring that
easyJet maintains the ability to phase timing of deliveries to reduce the risk of holding surplus
capacity
5. Support the prudent planned capacity increases of 3-5%; in line with our current strategy of
delivering sustainable growth and returns
6 6
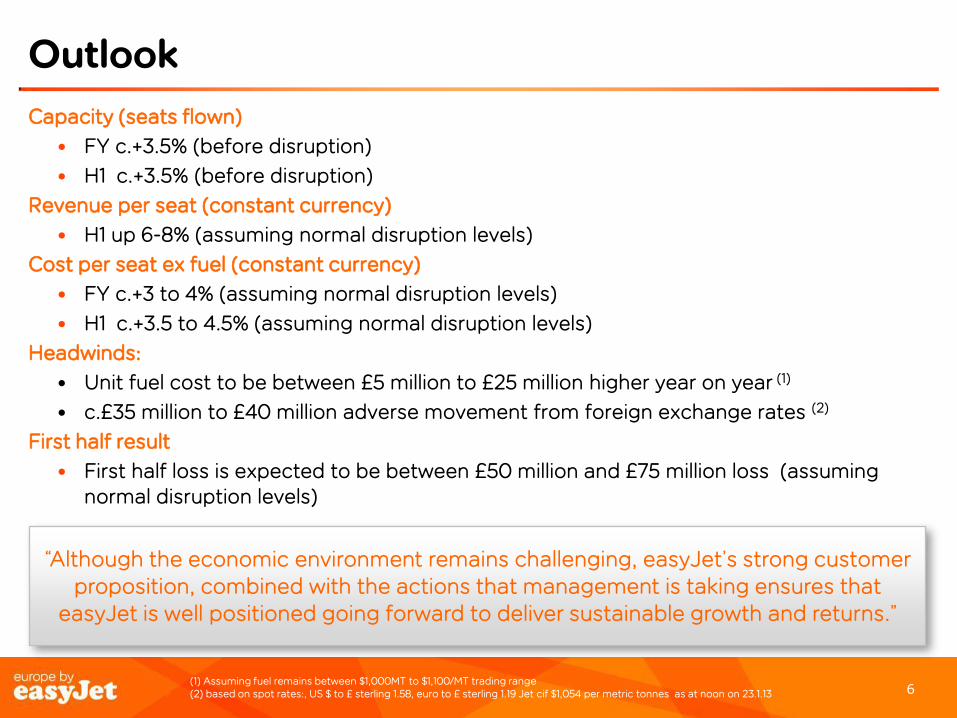
Outlook
Capacity (seats flown)
• FY c.+3.5% (before disruption)
• H1 c.+3.5% (before disruption)
Revenue per seat (constant currency)
• H1 up 6-8% (assuming normal disruption levels)
Cost per seat ex fuel (constant currency)
• FY c.+3 to 4% (assuming normal disruption levels)
• H1 c.+3.5 to 4.5% (assuming normal disruption levels)
Headwinds:
• Unit fuel cost to be between £5 million to £25 million higher year on year (1)
• c.£35 million to £40 million adverse movement from foreign exchange rates (2)
First half result
• First half loss is expected to be between £50 million and £75 million loss (assuming normal disruption levels)
“Although the economic environment remains challenging, easyJet’s strong customer proposition, combined with the actions that management is taking ensures that
easyJet is well positioned going forward to deliver sustainable growth and returns.”
(1) Assuming fuel remains between $1,000MT to $1,100/MT trading range (2) based on spot rates:, US $ to £ sterling 1.58, euro to £ sterling 1.19 Jet cif $1,054 per metric tonnes as at noon on 23.1.13

7
Strategic overview
8 8
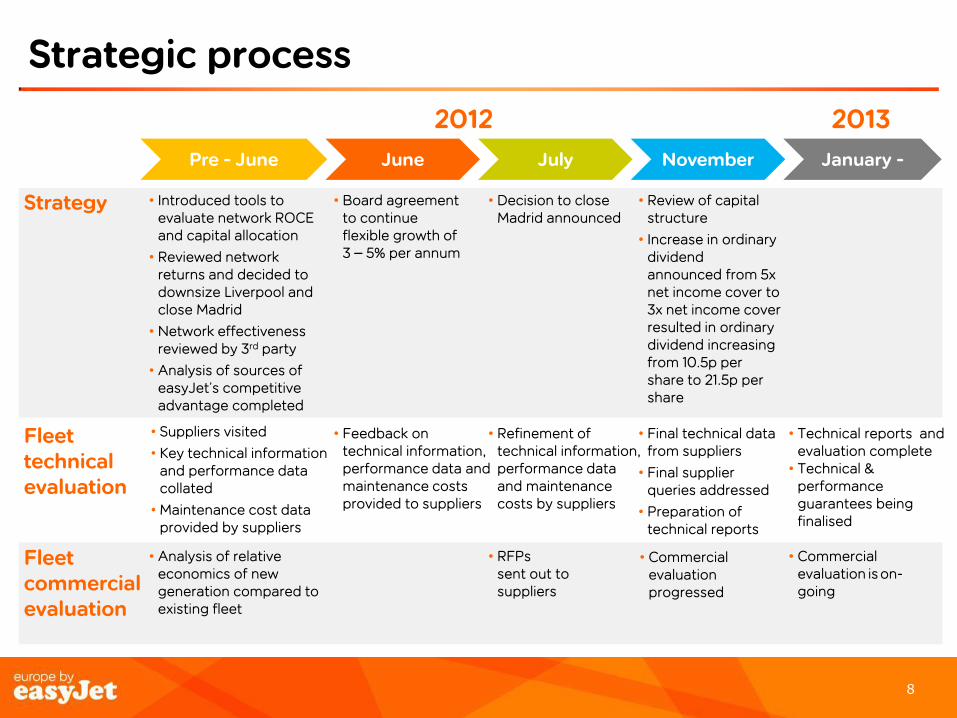
Strategic process
Strategy • Introduced tools to evaluate network ROCE and capital allocation
• Reviewed network returns and decided to downsize Liverpool and close Madrid
• Network effectiveness reviewed by 3rd party
• Analysis of sources of easyJet’s competitive advantage completed
Pre - June
• Analysis of relative economics of new generation compared to existing fleet
• Board agreement to continue flexible growth of 3 – 5% per annum
• Suppliers visited
• Key technical information and performance data collated
• Maintenance cost data provided by suppliers
• Commercial evaluation is on-going
2012 2013
June July November January -
Fleet technical evaluation
Fleet commercial evaluation
• Decision to close Madrid announced
• Review of capital structure
• Increase in ordinary dividend announced from 5x net income cover to 3x net income cover resulted in ordinary dividend increasing from 10.5p per share to 21.5p per share
• Technical reports and
evaluation complete • Technical &
performance guarantees being finalised
• Feedback on technical information, performance data and maintenance costs provided to suppliers
• RFPs sent out to suppliers
• Commercial evaluation progressed
• Refinement of technical information, performance data and maintenance costs by suppliers
• Final technical data from suppliers
• Final supplier queries addressed
• Preparation of technical reports
9 9
Maintain easyJet’s sources of competitive advantage
easyJet is best placed to create value in European short-haul markets if it adheres to the following guiding principles:
• Be number 1 or 2 in the market with a significant market share
• Cost advantage against the competitor in a market
• High asset utilisation
• In addition, easyJet derives significant competitive advantages from:
• low fares
• brand
• easyJet.com
• overall financial strength
10 10
Investing in returns and growth A
ttra
cti
ven
ess
ra
tin
g
FY Returns (Network touching)*
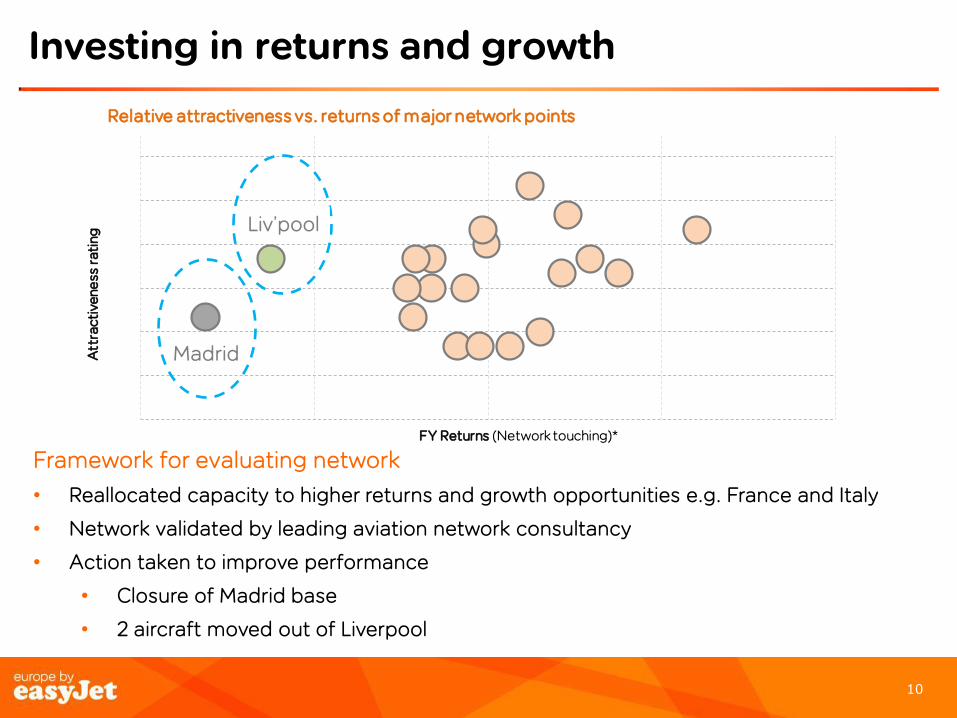
Relative attractiveness vs. returns of major network points
Madrid
Liv’pool
Framework for evaluating network
• Reallocated capacity to higher returns and growth opportunities e.g. France and Italy
• Network validated by leading aviation network consultancy
• Action taken to improve performance
• Closure of Madrid base
• 2 aircraft moved out of Liverpool
11 11
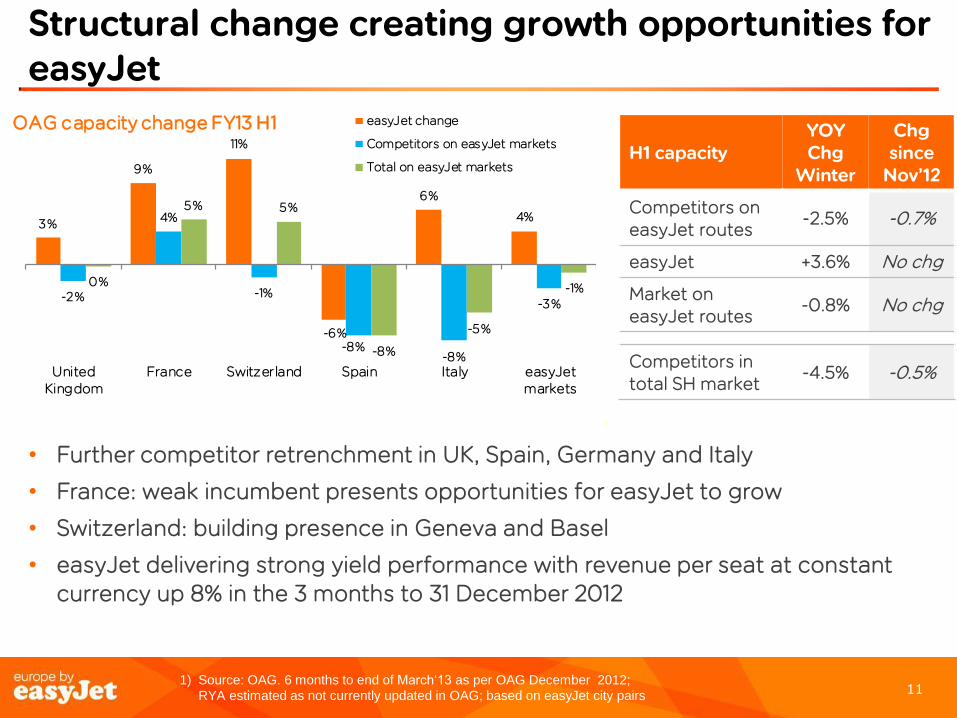
Structural change creating growth opportunities for easyJet
1) Source: OAG. 6 months to end of March‘13 as per OAG December 2012;
RYA estimated as not currently updated in OAG; based on easyJet city pairs
H1 capacity YOY Chg
Winter
Chg since
Nov’12
Competitors on easyJet routes
-2.5% -0.7%
easyJet +3.6% No chg
Market on easyJet routes
-0.8% No chg
Competitors in total SH market
-4.5% -0.5%
• Further competitor retrenchment in UK, Spain, Germany and Italy
• France: weak incumbent presents opportunities for easyJet to grow
• Switzerland: building presence in Geneva and Basel
• easyJet delivering strong yield performance with revenue per seat at constant currency up 8% in the 3 months to 31 December 2012
3%
9%
11%
-6%
6%
4%
-2%
4%
-1%
-8%-8%
-3%
0%
5% 5%
-8%
-5%
-1%
UnitedKingdom
France Switzerland Spain Italy easyJetmarkets
OAG capacity change FY13 H1 easyJet change
Competitors on easyJet markets
Total on easyJet markets
12 12
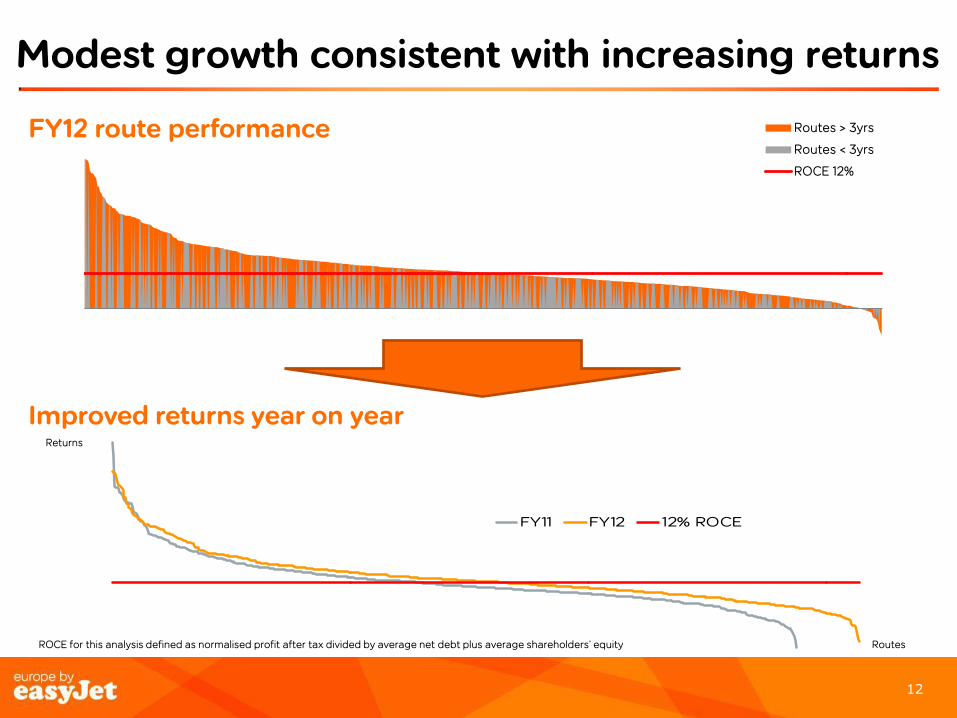
Routes > 3yrs
Routes < 3yrs
ROCE 12%
Modest growth consistent with increasing returns
FY11 FY12 12% ROCE
Improved returns year on year
Returns
FY12 route performance
Routes ROCE for this analysis defined as normalised profit after tax divided by average net debt plus average shareholders’ equity
13
Fleet order objectives
14 14
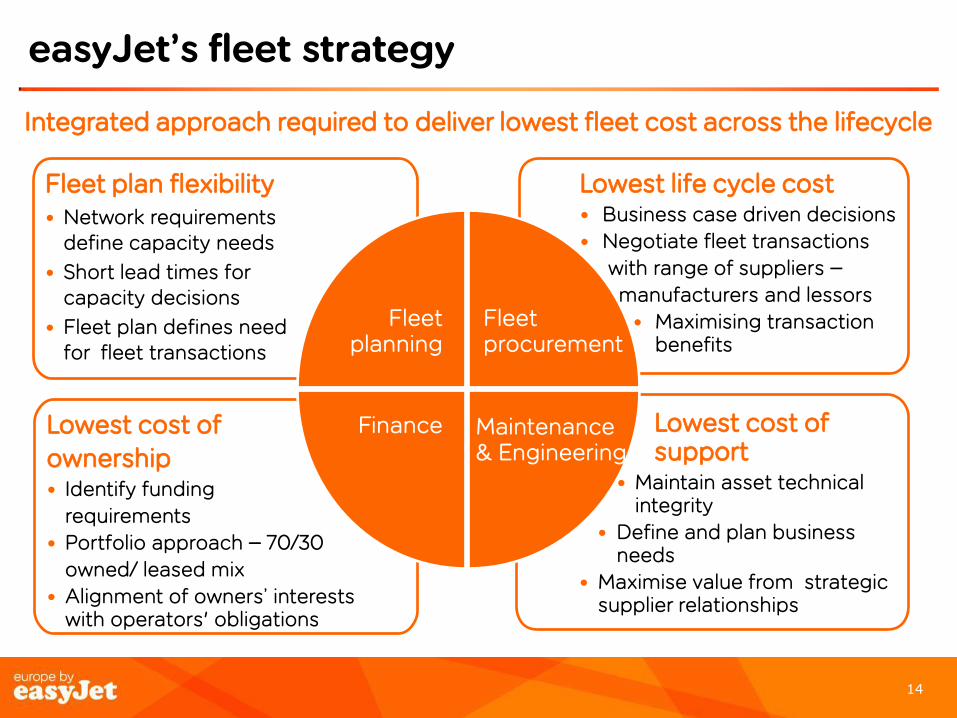
Lowest cost of
ownership • Identify funding
requirements
• Portfolio approach – 70/30
owned/ leased mix
• Alignment of owners’ interests with operators' obligations
easyJet’s fleet strategy
Integrated approach required to deliver lowest fleet cost across the lifecycle
Lowest cost of support
• Maintain asset technical integrity
• Define and plan business needs
• Maximise value from strategic supplier relationships
Lowest life cycle cost • Business case driven decisions
• Negotiate fleet transactions
• with range of suppliers –
• manufacturers and lessors
• Maximising transaction benefits
Fleet plan flexibility • Network requirements
define capacity needs
• Short lead times for capacity decisions
• Fleet plan defines need for fleet transactions
Fleet planning
Fleet procurement
Maintenance & Engineering
Finance
15 15
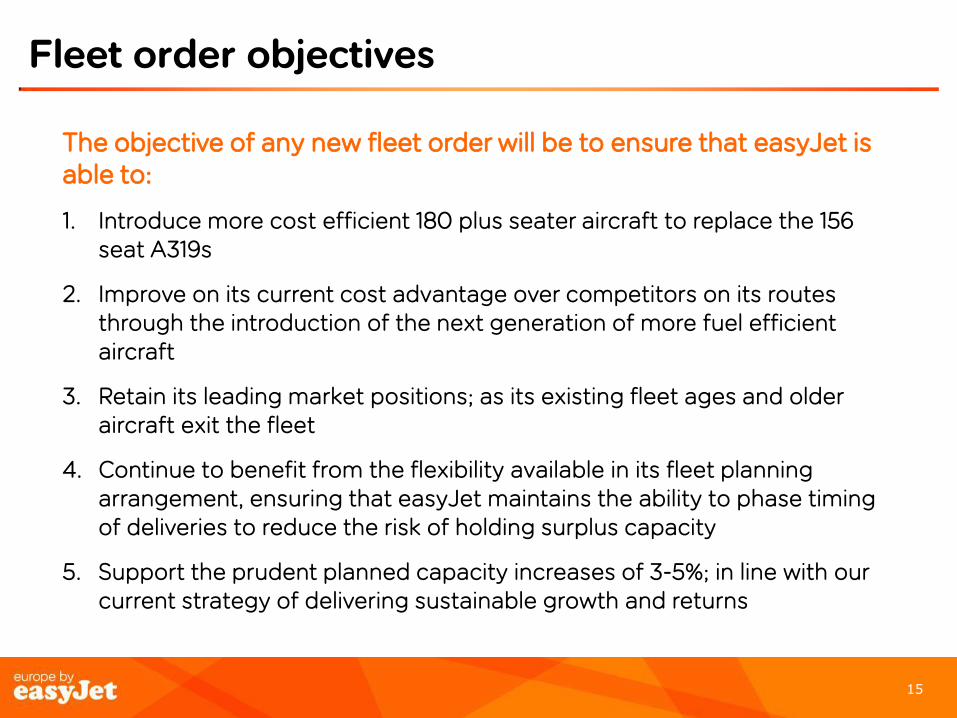
Fleet order objectives
The objective of any new fleet order will be to ensure that easyJet is able to:
1. Introduce more cost efficient 180 plus seater aircraft to replace the 156 seat A319s
2. Improve on its current cost advantage over competitors on its routes through the introduction of the next generation of more fuel efficient aircraft
3. Retain its leading market positions; as its existing fleet ages and older aircraft exit the fleet
4. Continue to benefit from the flexibility available in its fleet planning arrangement, ensuring that easyJet maintains the ability to phase timing of deliveries to reduce the risk of holding surplus capacity
5. Support the prudent planned capacity increases of 3-5%; in line with our current strategy of delivering sustainable growth and returns
16 16
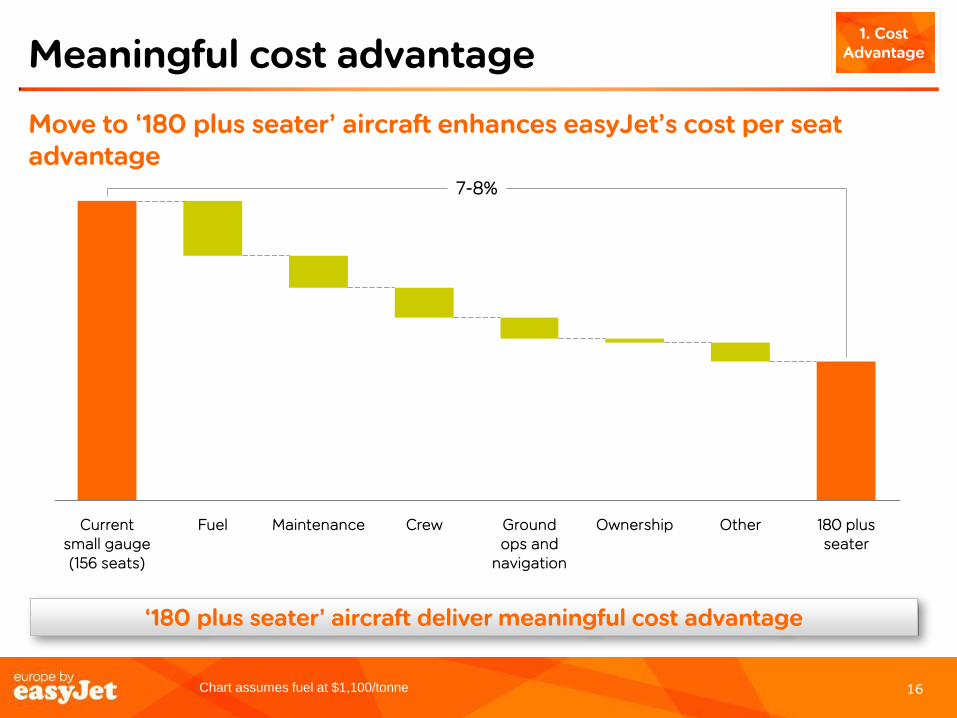
Meaningful cost advantage
Chart assumes fuel at $1,100/tonne
Move to ‘180 plus seater’ aircraft enhances easyJet’s cost per seat advantage
‘180 plus seater’ aircraft deliver meaningful cost advantage
1. Cost Advantage
7-8%
180 plus seater
Other Ownership Ground ops and
navigation
Crew Maintenance Fuel Current small gauge (156 seats)

17 17
Introduce fuel efficient aircraft
Chart assumes fuel at $1,100/tonne
It is anticipated that from 2018 suppliers will only be producing new generation aircraft
2. Cost Efficiency
Further move to new generation will allow easyJet to continue its cost advantage
4-5%
New 180 plus seater
Other Ownership Fuel 180 plus seater
18 18
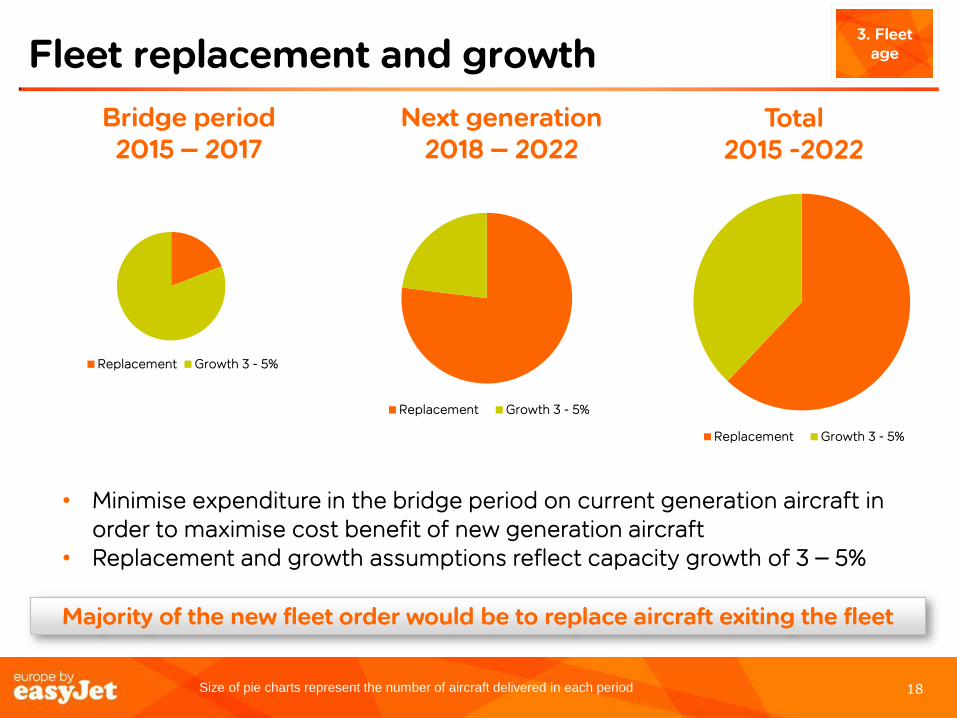
Fleet replacement and growth
Majority of the new fleet order would be to replace aircraft exiting the fleet
Bridge period 2015 – 2017
Replacement Growth 3 - 5%
Replacement Growth 3 - 5%
Next generation 2018 – 2022
Total 2015 -2022
• Minimise expenditure in the bridge period on current generation aircraft in order to maximise cost benefit of new generation aircraft
• Replacement and growth assumptions reflect capacity growth of 3 – 5%
3. Fleet age
Size of pie charts represent the number of aircraft delivered in each period
Replacement Growth 3 - 5%
19 19
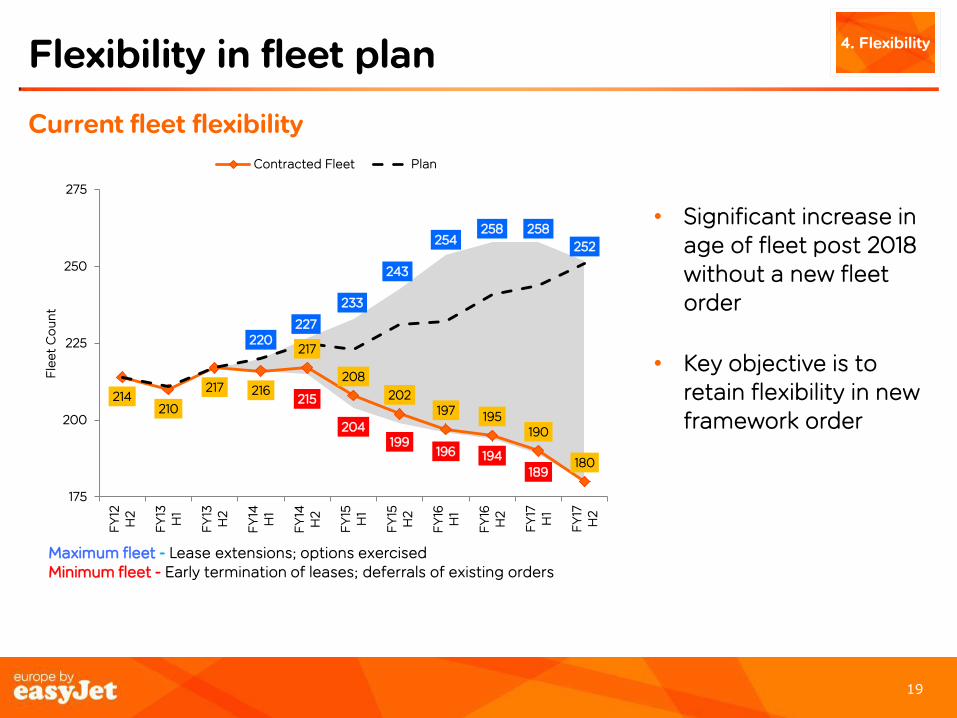
Flexibility in fleet plan
Current fleet flexibility
4. Flexibility
220 227
233
243
254 258 258
252
215
204 199
196 194 189
214 210
217 216
217
208
202 197 195
190
180
175
200
225
250
275
FY
12H
2
FY
13H
1
FY
13H
2
FY
14H
1
FY
14H
2
FY
15H
1
FY
15H
2
FY
16H
1
FY
16H
2
FY
17H
1
FY
17H
2
Fle
et
Co
un
t
Contracted Fleet Plan
Maximum fleet - Lease extensions; options exercised Minimum fleet - Early termination of leases; deferrals of existing orders
• Significant increase in age of fleet post 2018 without a new fleet order
• Key objective is to retain flexibility in new framework order
20 20
100
80
60
40
20
0
100 80 60 40 20 0
Long-haul feeder
Thin point-to-point routes Below 100 one-way pax per day
Leisure (including packages)
LCCs share of pax (~40% - 240 M)
easyJet's share of pax (~9% - 55 M)
Share of pax
Share of pax
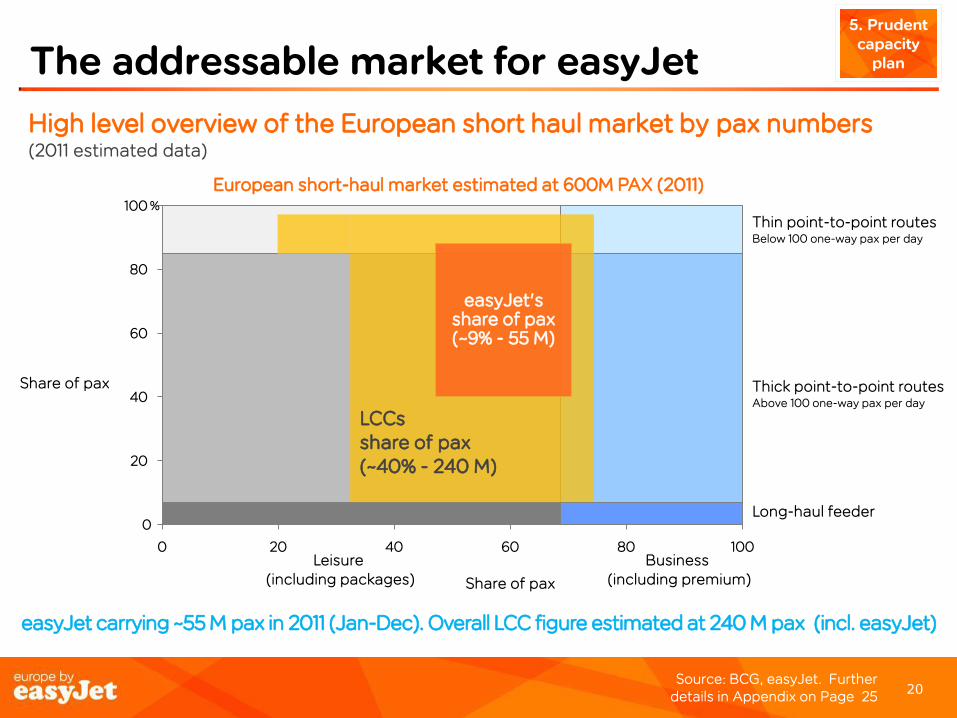
The addressable market for easyJet
High level overview of the European short haul market by pax numbers (2011 estimated data)
European short-haul market estimated at 600M PAX (2011)
easyJet carrying ~55 M pax in 2011 (Jan-Dec). Overall LCC figure estimated at 240 M pax (incl. easyJet)
%
Source: BCG, easyJet. Further details in Appendix on Page 25
Thick point-to-point routes Above 100 one-way pax per day
Business (including premium)
5. Prudent capacity
plan
21 21
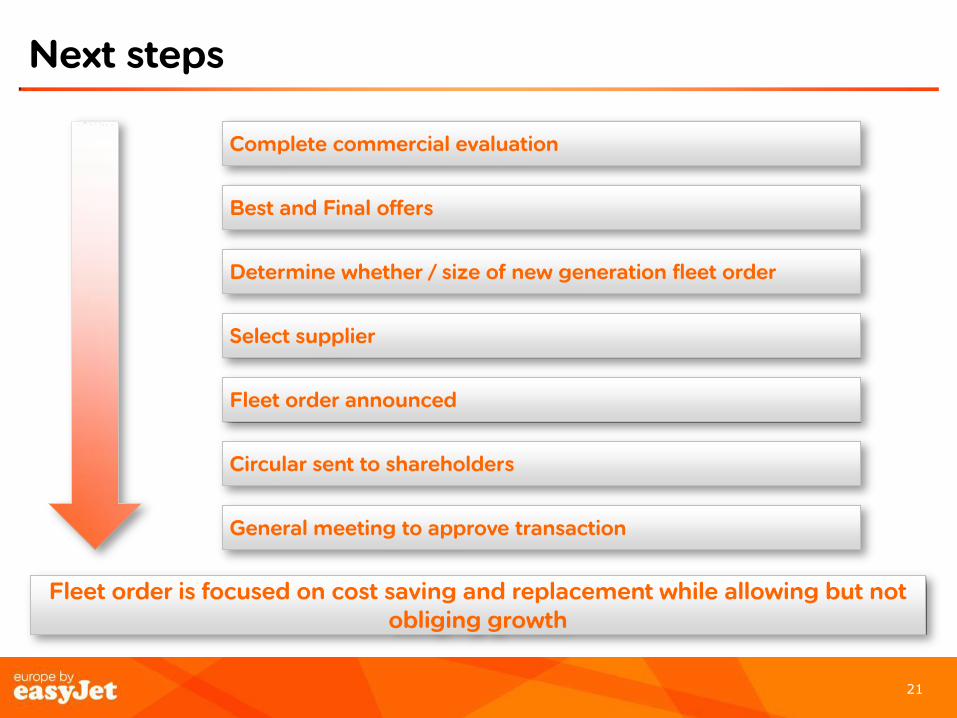
Next steps
Complete commercial evaluation
Best and Final offers
Select supplier
Fleet order announced
Circular sent to shareholders
General meeting to approve transaction
Determine whether / size of new generation fleet order
Fleet order is focused on cost saving and replacement while allowing but not obliging growth

22 22
Conclusion
• easyJet intends to generate returns in excess of the cost of capital
• easyJet intends to fund replacement, growth and maintenance capital expenditure and returns to shareholders from the cash generated by operations
• A framework order on the right terms would enable easyJet to maintain its cost advantage, provide flexibility to manage capacity and take advantage of profitable growth
23
APPENDIX
24 24
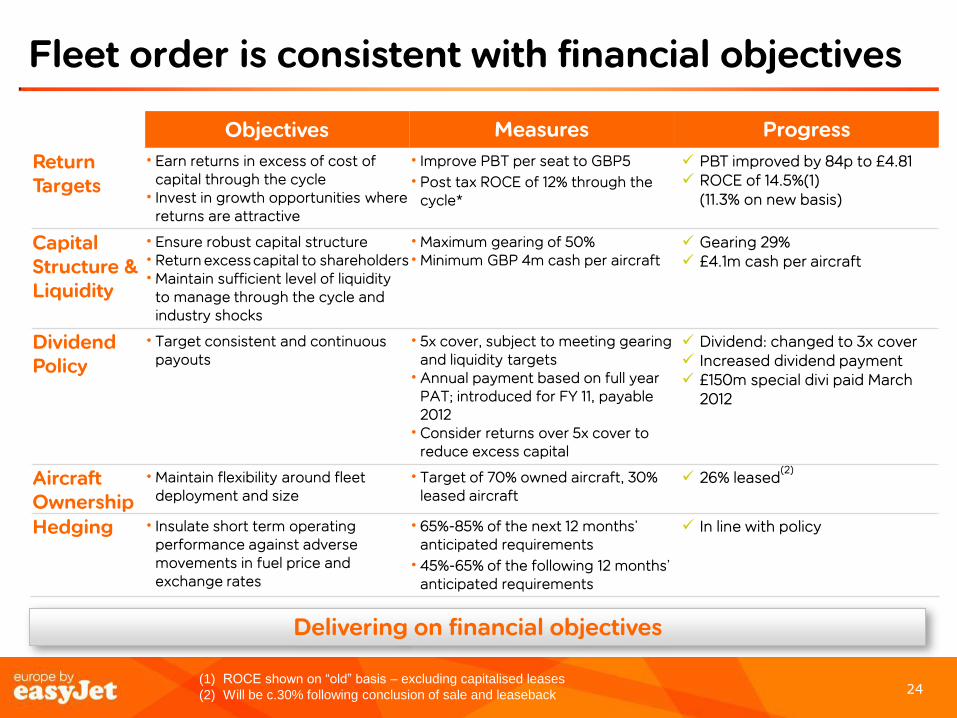
Fleet order is consistent with financial objectives
Objectives Measures Progress
Return Targets
• Earn returns in excess of cost of capital through the cycle
• Invest in growth opportunities where returns are attractive
• Improve PBT per seat to GBP5
• Post tax ROCE of 12% through the cycle*
PBT improved by 84p to £4.81 ROCE of 14.5%(1)
(11.3% on new basis)
Capital Structure & Liquidity
• Ensure robust capital structure • Return excess capital to shareholders • Maintain sufficient level of liquidity
to manage through the cycle and industry shocks
• Maximum gearing of 50% • Minimum GBP 4m cash per aircraft
Gearing 29% £4.1m cash per aircraft
Dividend Policy
• Target consistent and continuous payouts
• 5x cover, subject to meeting gearing and liquidity targets
• Annual payment based on full year PAT; introduced for FY 11, payable 2012
• Consider returns over 5x cover to reduce excess capital
Dividend: changed to 3x cover Increased dividend payment £150m special divi paid March
2012
Aircraft Ownership
• Maintain flexibility around fleet deployment and size
• Target of 70% owned aircraft, 30% leased aircraft
26% leased(2)
Hedging • Insulate short term operating performance against adverse movements in fuel price and exchange rates
• 65%-85% of the next 12 months’ anticipated requirements
• 45%-65% of the following 12 months’ anticipated requirements
In line with policy
Delivering on financial objectives
(1) ROCE shown on “old” basis – excluding capitalised leases
(2) Will be c.30% following conclusion of sale and leaseback

25 25
The addressable market for easyJet
Page 20 - Assumptions and methodology
• Number includes scheduled as well as charter passengers
• Total includes EU27 total traffic (domestic and intra EU 27), traffic to Norway, Switzerland, Russia, Morocco, Egypt, Tunisia and Turkey and the Norwegian and Swiss domestic markets
• Data excludes Turkish domestic market and flights between Europe, Middle East and former CIS countries
Source: OAG, ELFAA, Eurostat on European airport statistics; RDC; easyJet annual report; Ryanair, Norwegian, Vueling , Pegasus and Wizz traffic statistics; BCG analysis
26 26
Disclaimer
This communication is directed only at (i) persons having professional experience in matters relating to investments who fall within the definition of “investment professionals” in Article 19(5) of the Financial Services and Markets Act 2000 (Financial Promotion) Order 2001; or (ii) high net worth bodies corporate, unincorporated associations and partnerships and trustees of high value trusts as described in Article 49(2) of the Financial Services and Markets Act 2000 (Financial Promotion) Order 2001. Persons within the United Kingdom who receive this communication (other than those falling within (i) and (ii) above) should not rely on or act upon the contents of this communication. Nothing in this presentation is intended to constitute an invitation or inducement to engage in investment activity for the purposes of the prohibition on financial promotion contained in the Financial Services and Markets Act 2000.
This presentation has been furnished to you solely for information and may not be reproduced, redistributed or passed on to any other person, nor may it be published in whole or in part, for any other purpose.
This presentation does not constitute or form part of, and should not be construed as, an offer for sale or subscription of, or solicitation of any offer to buy or subscribe for, any securities of easyJet plc (“easyJet”) in any jurisdiction nor should it or any part of it form the basis of, or be relied on in connection with, any contract or commitment whatsoever. This presentation does not constitute a recommendation regarding the securities of easyJet. Without limitation to the foregoing, these materials do not constitute an offer of securities for sale in the United States. Securities may not be offered or sold into the United States absent registration under the US Securities Act of 1933 or an exemption there from.
easyJet has not verified any of the information set out in this presentation. Without prejudice to the foregoing, neither easyJet nor its associates nor any officer, director, employee or representative of any of them accepts any liability whatsoever for any loss however arising, directly or indirectly, from any reliance on this presentation or its contents.
This presentation is not being issued, and is not for distribution in, the United States (with certain limited exceptions in accordance with the US Securities Act of 1933) or in any jurisdiction where such distribution is unlawful and is not for distribution to publications with a general circulation in the United States.
By attending or reading this presentation you agree to be bound by the foregoing limitations.