Embed Size (px)
Citation preview
Q1 FY2018 Results Presentation
Certain statements in this communication may be ‘forward looking statements’ within the
meaning of applicable laws and regulations. These forward-looking statements involve a
number of risks, uncertainties and other factors that could cause actual results to differ
materially from those suggested by the forward-looking statements. Important
developments that could affect the Company’s operations include changes in the industry
structure, significant changes in political and economic environment in India and overseas,
tax laws, import duties, litigation and labour relations.
Kolte-Patil Developers Limited (KPDL) will not be in any way responsible for any action
taken based on such statements and undertakes no obligation to publicly update these
forward-looking statements to reflect subsequent events or circumstances.
2
CEO’s Message 1
Operational & Performance Highlights 2
P&L / Balance Sheet Snapshot 3
3
Project-wise Details 4
Outlook 5
About Kolte-Patil Developers Ltd. 6
4
Commenting on the performance for Q1 FY2018, Mr. Gopal Sarda, Group CEO, Kolte-Patil Developers Limited said:
“We have made a good start to the year with our top line growing 37% YoY and net profit after tax growing 27% YoY. The growth was led by the
Ivy Estate (Corolla), Western Avenue, Three Jewels projects in Pune and first time recognition at Jay-Vijay society in Mumbai. We expect to see
increased contribution from Mumbai and Bengaluru this year, adding two further dimensions to our growth and part of our strategy to diversify
the revenue base.
From a sales perspective, this quarter was a bit subdued on account of the uncertainty leading upto GST and the implementation of RERA, as
customers adopted a wait and watch approach. We recorded sales volume of 0.41 million square feet in Q1 with a total sales value of Rs. 257
crore. What is encouraging is that we have seen an uptick in the sales contribution from Bengaluru this quarter, buoyed by the launch of our new
project on Hosur Road. Despite the uncertainty, our collections have been healthy at over Rs. 253 crore, up 10% YoY. Even as the industry goes
through this phase of transformation, we have seen consistency in our quarter-on-quarter collections of ~Rs. 250 crore over the last ten quarters.
In July, we have already seen an uptick in our sales velocity and expect normalcy to return in the second half of the year. We welcome GST as
well as RERA with all its rules and regulations and believe it will bring in transparency, accountability, boost customer confidence and create a
level-playing field. We have always been a customer-centric organization providing a credible solution to customers who needed to trust real
estate companies with their hard-earned money, through transparency, quality product and timely delivery of our projects. So the reality is that it has mostly been business as usual for us.
Even during these turbulent times for the industry, we have remained focused on our goals, to provide high quality products within the
committed timelines. This once gain bears testimony to Kolte-Patil’s strong brand and focus on execution and quality.
We continue to monitor the situation and expect the sentiment to improve over the next few quarters. With several government initiatives and
the recent fall in home loan interest rates coupled with RERA introduction will lead to improved consumer confidence and demand. We will
continue to maintain our thrust on execution and organizational efficiencies and utilize the positive operating cash flows to further strengthen our
balance sheet.“
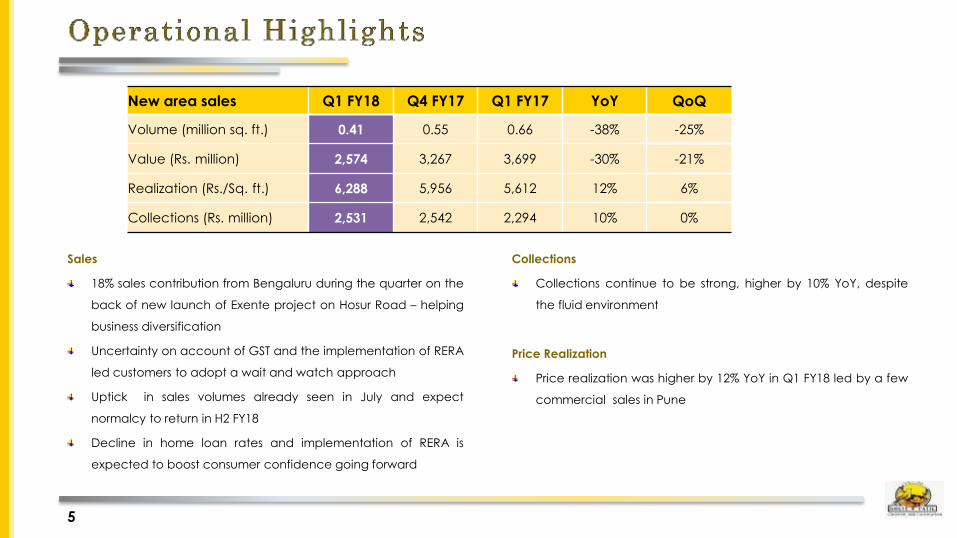
Sales
18% sales contribution from Bengaluru during the quarter on the
back of new launch of Exente project on Hosur Road – helping
business diversification
Uncertainty on account of GST and the implementation of RERA
led customers to adopt a wait and watch approach
Uptick in sales volumes already seen in July and expect
normalcy to return in H2 FY18
Decline in home loan rates and implementation of RERA is
expected to boost consumer confidence going forward
Collections
Collections continue to be strong, higher by 10% YoY, despite
the fluid environment
Price Realization
Price realization was higher by 12% YoY in Q1 FY18 led by a few
commercial sales in Pune
5
New area sales Q1 FY18 Q4 FY17 Q1 FY17 YoY QoQ
Volume (million sq. ft.) 0.41 0.55 0.66 -38% -25%
Value (Rs. million) 2,574 3,267 3,699 -30% -21%
Realization (Rs./Sq. ft.) 6,288 5,956 5,612 12% 6%
Collections (Rs. million) 2,531 2,542 2,294 10% 0%
6
7
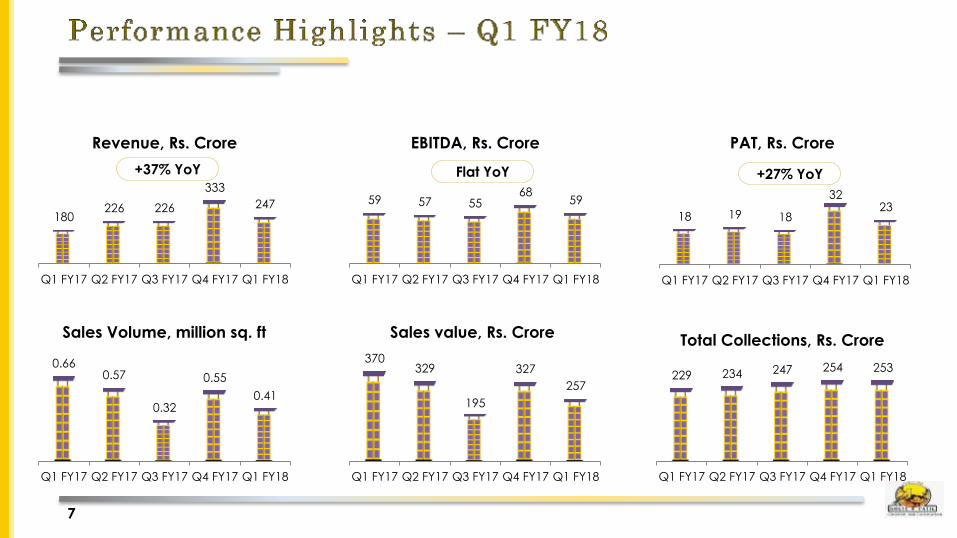
180 226 226
333
247
Q1 FY17 Q2 FY17 Q3 FY17 Q4 FY17 Q1 FY18
Revenue, Rs. Crore
59 57 55 68
59
Q1 FY17 Q2 FY17 Q3 FY17 Q4 FY17 Q1 FY18
EBITDA, Rs. Crore
0.66 0.57
0.32
0.55
0.41
Q1 FY17 Q2 FY17 Q3 FY17 Q4 FY17 Q1 FY18
Sales Volume, million sq. ft
229 234 247 254 253
Q1 FY17 Q2 FY17 Q3 FY17 Q4 FY17 Q1 FY18
Total Collections, Rs. Crore 370
329
195
327
257
Q1 FY17 Q2 FY17 Q3 FY17 Q4 FY17 Q1 FY18
Sales value, Rs. Crore
18 19 18
32 23
Q1 FY17 Q2 FY17 Q3 FY17 Q4 FY17 Q1 FY18
PAT, Rs. Crore
Flat YoY +37% YoY +27% YoY
8
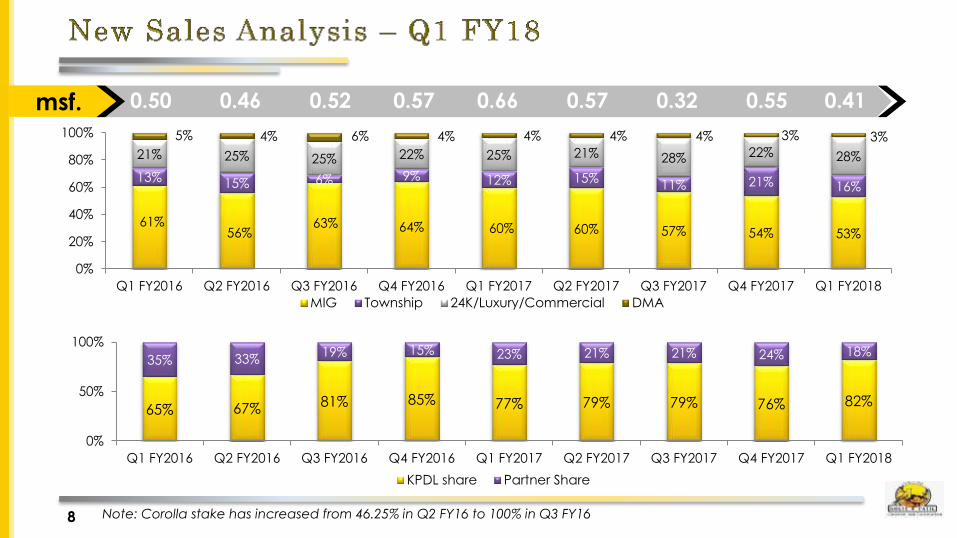
61% 56%
63% 64% 60% 60% 57% 54% 53%
13% 15% 6% 9% 12% 15% 11% 21% 16%
21% 25% 25% 22% 25% 21% 28% 22% 28%
5% 4% 6% 4% 4% 4% 4% 3% 3%
0%
20%
40%
60%
80%
100%
Q1 FY2016 Q2 FY2016 Q3 FY2016 Q4 FY2016 Q1 FY2017 Q2 FY2017 Q3 FY2017 Q4 FY2017 Q1 FY2018
MIG Township 24K/Luxury/Commercial DMA
0.50 0.46 0.52 0.57 0.66 0.57 0.32 0.55 0.41 msf.
65% 67% 81% 85% 77% 79% 79% 76% 82%
35% 33% 19% 15% 23% 21% 21% 24% 18%
0%
50%
100%
Q1 FY2016 Q2 FY2016 Q3 FY2016 Q4 FY2016 Q1 FY2017 Q2 FY2017 Q3 FY2017 Q4 FY2017 Q1 FY2018
KPDL share Partner Share
Note: Corolla stake has increased from 46.25% in Q2 FY16 to 100% in Q3 FY16

9
P&L Snapshot (Rs. crore) Ind-AS
Q1 FY18 Q1 FY17 YoY (%)
Revenue from Operations 246.6 179.8 37.1%
Other income 2.0 3.5 -42.7%
Total Income 248.6 183.4 35.6%
Cost of materials consumed 157.1 93.7 67.6%
Employee benefits expense 8.9 10.7 -16.6%
Finance cost 23.2 23.6 -1.9%
Depreciation and amortization expense 3.6 3.6 -1.9%
Other expenses 21.6 16.3 32.3%
Total Expenses 214.2 147.9 44.8%
EBITDA 59.1 59.1 -0.1%
EBITDA Margin (%) 24.0% 32.9% -8.9%
Profit before tax 34.4 35.5 -3.0%
Total tax expenses 9.0 16.5 -45.4%
Non-controlling interests 2.19 0.69 217.4%
Net Profit 23.2 18.3 26.8%
PAT margin (%) 9.4% 10.2% -0.8%
EPS 3.06 2.41
Reasons for Variance
• Strong top line growth led by first
time recognition of Jai-Vijay
Society in Mumbai; Ivy Estate
(Corolla), Western Avenue, Three
Jewels in Pune
• EBITDA margins impacted on
account of contribution from
lower margin projects like Western
Avenue and JDA projects -
Mirabilis & Stargaze
10
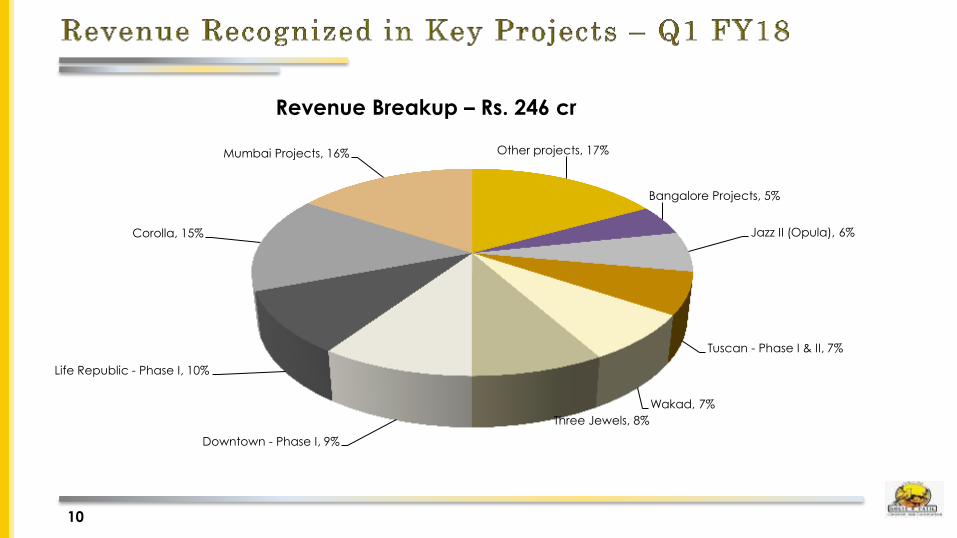
Other projects, 17%
Bangalore Projects, 5%
Jazz II (Opula), 6%
Tuscan - Phase I & II, 7%
Wakad, 7%
Three Jewels, 8%
Downtown - Phase I, 9%
Life Republic - Phase I, 10%
Corolla, 15%
Mumbai Projects, 16%
Revenue Breakup – Rs. 246 cr
11
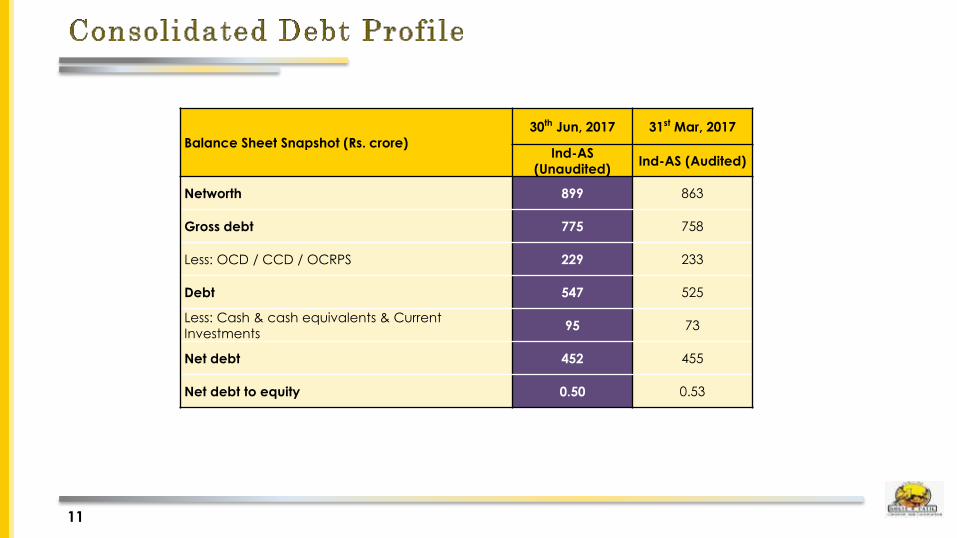
Balance Sheet Snapshot (Rs. crore)
30th Jun, 2017 31st Mar, 2017
Ind-AS
(Unaudited) Ind-AS (Audited)
Networth 899 863
Gross debt 775 758
Less: OCD / CCD / OCRPS 229 233
Debt 547 525
Less: Cash & cash equivalents & Current
Investments 95 73
Net debt 452 455
Net debt to equity 0.50 0.53
12
Initiatives like demonetisation and implementation of RERA and GST will lead to a level playing field
and bring about consolidation in the sector and will benefit organized developers like KPDL, though
some short term uncertainty may persist and consumer behavior will have to be watched
The company is looking to consolidate its dominant presence in Pune, leveraging its strong brand
name, through the execution of ongoing projects and launch of subsequent phases of existing
projects
In addition to Pune, the company has a strong pipeline of projects in Mumbai over 1.2 msf, which will
facilitate PAT and ROCE expansion, and reduce working capital cycle for the Company going
forward, while providing synergies to the existing Pune operations
Bengaluru is expected to be an additional growth engine going forward with the launch of the
Koramangala project in H2 FY18, in addition to the launch of Exente, Hosur Road in Q1 FY18
To play on the Government’s affordable stimulus theme, the company is also evaluating potential
expansion into Affordable Housing in subsequent phases of existing projects which could help drive
pre-sales growth
The company will continue to focus on execution, collections and given the company’s asset light
approach is expected to generate strong free cash flows over the next few years which will be utilized
to strengthen its balance sheet further
13
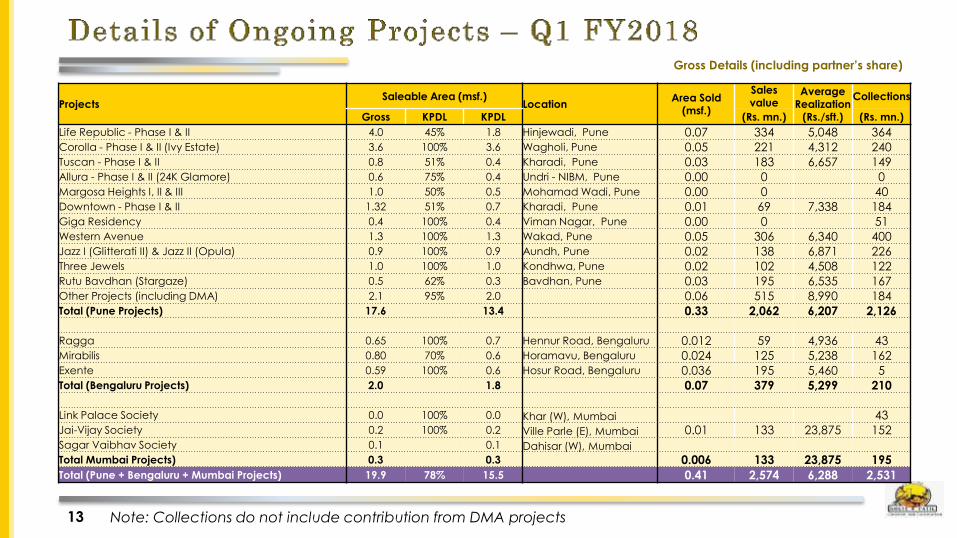
Gross Details (including partner’s share)
Note: Collections do not include contribution from DMA projects
Projects Saleable Area (msf.)
Location Area Sold
(msf.)
Sales value
Average Realization
(Rs./sft.)
Collections
Gross KPDL KPDL (Rs. mn.) (Rs. mn.)
Life Republic - Phase I & II 4.0 45% 1.8 Hinjewadi, Pune 0.07 334 5,048 364
Corolla - Phase I & II (Ivy Estate) 3.6 100% 3.6 Wagholi, Pune 0.05 221 4,312 240
Tuscan - Phase I & II 0.8 51% 0.4 Kharadi, Pune 0.03 183 6,657 149
Allura - Phase I & II (24K Glamore) 0.6 75% 0.4 Undri - NIBM, Pune 0.00 0 0
Margosa Heights I, II & III 1.0 50% 0.5 Mohamad Wadi, Pune 0.00 0 40
Downtown - Phase I & II 1.32 51% 0.7 Kharadi, Pune 0.01 69 7,338 184
Giga Residency 0.4 100% 0.4 Viman Nagar, Pune 0.00 0 51
Western Avenue 1.3 100% 1.3 Wakad, Pune 0.05 306 6,340 400
Jazz I (Glitterati II) & Jazz II (Opula) 0.9 100% 0.9 Aundh, Pune 0.02 138 6,871 226
Three Jewels 1.0 100% 1.0 Kondhwa, Pune 0.02 102 4,508 122
Rutu Bavdhan (Stargaze) 0.5 62% 0.3 Bavdhan, Pune 0.03 195 6,535 167
Other Projects (including DMA) 2.1 95% 2.0 0.06 515 8,990 184
Total (Pune Projects) 17.6 13.4 0.33 2,062 6,207 2,126
Ragga 0.65 100% 0.7 Hennur Road, Bengaluru 0.012 59 4,936 43
Mirabilis 0.80 70% 0.6 Horamavu, Bengaluru 0.024 125 5,238 162
Exente 0.59 100% 0.6 Hosur Road, Bengaluru 0.036 195 5,460 5
Total (Bengaluru Projects) 2.0 1.8 0.07 379 5,299 210
Link Palace Society 0.0 100% 0.0 Khar (W), Mumbai 43
Jai-Vijay Society 0.2 100% 0.2 Ville Parle (E), Mumbai 0.01 133 23,875 152
Sagar Vaibhav Society 0.1 0.1 Dahisar (W), Mumbai
Total Mumbai Projects) 0.3 0.3 0.006 133 23,875 195
Total (Pune + Bengaluru + Mumbai Projects) 19.9 78% 15.5 0.41 2,574 6,288 2,531

14
Forthcoming Projects Saleable Area (msf.)
Gross KPDL Share KPDL Share
Life Republic Phase II 1.3 45% 0.6
24K Province 0.4 100% 0.4
Western Avenue, Wakad 1.3 100% 1.3
Kondhwa Phase III 0.4 100% 0.4
Stargaze Phase II 0.6 62% 0.4
Downtown Phase III 0.5 51% 0.2
Corolla Phase III 1.3 100% 1.3
Total 5.7 79% 4.5
Note: Saleable area based on current FSI norms and subject to change
Future Development Saleable Area (msf.)
Gross KPDL Share KPDL Share
Sanjivani Township, Urse, Pune 15.0 50.5% 7.6
Life Republic - Phase III, Pune 2.9 45% 1.3
Ghotawade, Pune 3.2 50% 1.6
Aundh, Pune 1.0 100% 1.0
Kalyani Nagar, Pune 0.6 100% 0.6
Boat Club Road, Pune 0.3 100% 0.3
Mumbai Projects 1.2 100% 1.2
Total 24.3 13.7
Kolte-Patil Developers Ltd. (BSE: 532924, NSE: KOLTEPATIL), incorporated in 1991, is a leading real estate
company with dominant presence in the Pune residential market. Kolte-Patil is a trusted name with a
reputation for high quality standards, design uniqueness, transparency and the delivery of projects in a
timely manner. The company has developed and constructed over 50 projects including residential
complexes, commercial complexes and IT Parks covering a saleable area of over 13 million square feet
across Pune and Bengaluru.
Kolte-Patil markets its projects under two brands: ’Kolte-Patil’ (addressing the mid-income segment) and
‘24K’ (addressing the premium luxury segment). The Company has executed projects in multiple segments –
standalone residential buildings and integrated townships. Several of the company’s projects have been
certified by the Indian Green Building Council (IGBC).
Consolidating its leadership position in Pune, the company forayed into the Mumbai market in 2013
focusing on low capital intensive society re-development projects. The company has already signed six
projects till date at prime locations across the city.
The Company’s long-term bank debt and non-convertible debentures have been rated ‘A+ / Stable’ by
CRISIL, the highest rating accorded by CRISIL to any publicly listed residential real estate player in India.
For more details on Kolte-Patil Developers Ltd., visit www.koltepatil.com.
15