Embed Size (px)
Citation preview
Q3 FY2018 Results Presentation
Certain statements in this communication may be ‘forward looking statements’ within the
meaning of applicable laws and regulations. These forward-looking statements involve a
number of risks, uncertainties and other factors that could cause actual results to differ
materially from those suggested by the forward-looking statements. Important
developments that could affect the Company’s operations include changes in the industry
structure, significant changes in political and economic environment in India and overseas,
tax laws, import duties, litigation and labour relations.
Kolte-Patil Developers Limited (KPDL) will not be in any way responsible for any action
taken based on such statements and undertakes no obligation to publicly update these
forward-looking statements to reflect subsequent events or circumstances.
2
CEO’s Message 1
Operational & Performance Highlights 2
P&L / Balance Sheet Snapshot 3
3
Project-wise Details 4
Outlook 5
About Kolte-Patil Developers Ltd. 6
4
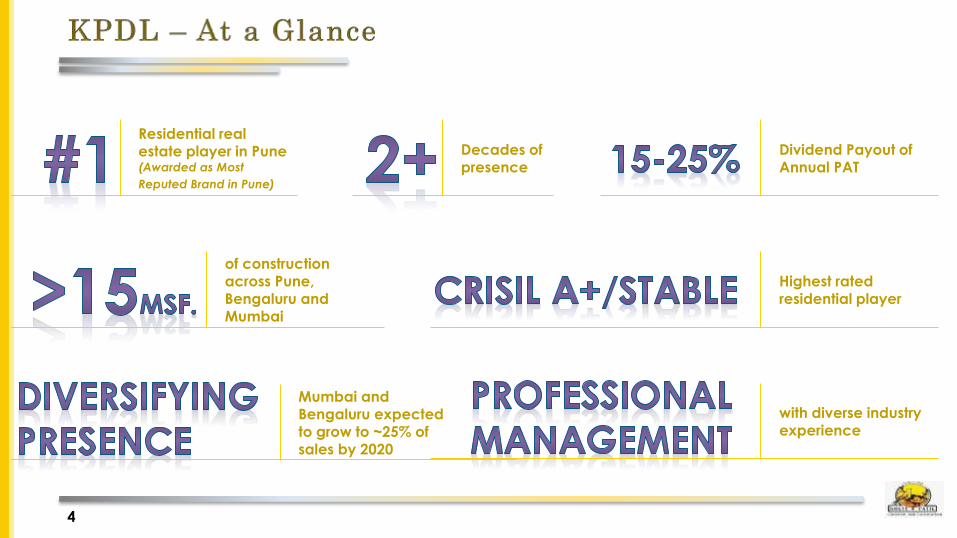
Residential real estate player in Pune (Awarded as Most
Reputed Brand in Pune)
Decades of presence
Highest rated residential player
of construction across Pune, Bengaluru and Mumbai
with diverse industry experience
Dividend Payout of Annual PAT
Mumbai and Bengaluru expected to grow to ~25% of sales by 2020
5
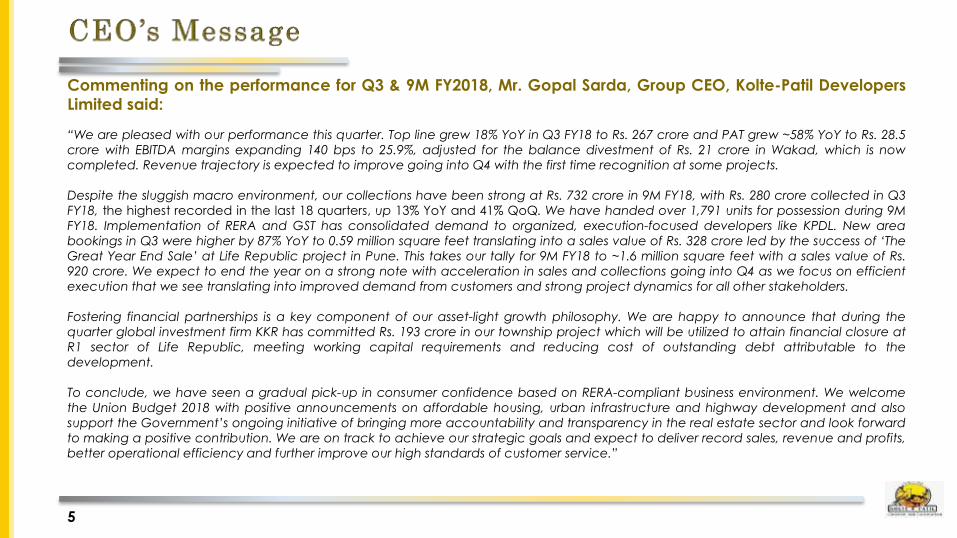
Commenting on the performance for Q3 & 9M FY2018, Mr. Gopal Sarda, Group CEO, Kolte-Patil Developers
Limited said:
“We are pleased with our performance this quarter. Top line grew 18% YoY in Q3 FY18 to Rs. 267 crore and PAT grew ~58% YoY to Rs. 28.5
crore with EBITDA margins expanding 140 bps to 25.9%, adjusted for the balance divestment of Rs. 21 crore in Wakad, which is now
completed. Revenue trajectory is expected to improve going into Q4 with the first time recognition at some projects.
Despite the sluggish macro environment, our collections have been strong at Rs. 732 crore in 9M FY18, with Rs. 280 crore collected in Q3
FY18, the highest recorded in the last 18 quarters, up 13% YoY and 41% QoQ. We have handed over 1,791 units for possession during 9M
FY18. Implementation of RERA and GST has consolidated demand to organized, execution-focused developers like KPDL. New area
bookings in Q3 were higher by 87% YoY to 0.59 million square feet translating into a sales value of Rs. 328 crore led by the success of „The
Great Year End Sale‟ at Life Republic project in Pune. This takes our tally for 9M FY18 to ~1.6 million square feet with a sales value of Rs.
920 crore. We expect to end the year on a strong note with acceleration in sales and collections going into Q4 as we focus on efficient
execution that we see translating into improved demand from customers and strong project dynamics for all other stakeholders.
Fostering financial partnerships is a key component of our asset-light growth philosophy. We are happy to announce that during the
quarter global investment firm KKR has committed Rs. 193 crore in our township project which will be utilized to attain financial closure at
R1 sector of Life Republic, meeting working capital requirements and reducing cost of outstanding debt attributable to the
development.
To conclude, we have seen a gradual pick-up in consumer confidence based on RERA-compliant business environment. We welcome
the Union Budget 2018 with positive announcements on affordable housing, urban infrastructure and highway development and also
support the Government‟s ongoing initiative of bringing more accountability and transparency in the real estate sector and look forward
to making a positive contribution. We are on track to achieve our strategic goals and expect to deliver record sales, revenue and profits,
better operational efficiency and further improve our high standards of customer service.”
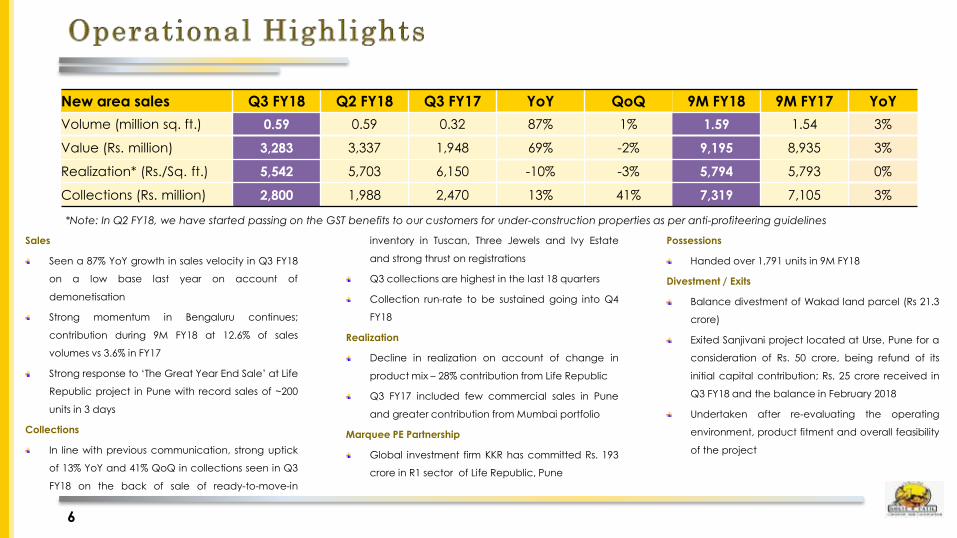
Sales
Seen a 87% YoY growth in sales velocity in Q3 FY18
on a low base last year on account of
demonetisation
Strong momentum in Bengaluru continues;
contribution during 9M FY18 at 12.6% of sales
volumes vs 3.6% in FY17
Strong response to ‘The Great Year End Sale’ at Life
Republic project in Pune with record sales of ~200
units in 3 days
Collections
In line with previous communication, strong uptick
of 13% YoY and 41% QoQ in collections seen in Q3
FY18 on the back of sale of ready-to-move-in
inventory in Tuscan, Three Jewels and Ivy Estate
and strong thrust on registrations
Q3 collections are highest in the last 18 quarters
Collection run-rate to be sustained going into Q4
FY18
Realization
Decline in realization on account of change in
product mix – 28% contribution from Life Republic
Q3 FY17 included few commercial sales in Pune
and greater contribution from Mumbai portfolio
Marquee PE Partnership
Global investment firm KKR has committed Rs. 193
crore in R1 sector of Life Republic, Pune
Possessions
Handed over 1,791 units in 9M FY18
Divestment / Exits
Balance divestment of Wakad land parcel (Rs 21.3
crore)
Exited Sanjivani project located at Urse, Pune for a
consideration of Rs. 50 crore, being refund of its
initial capital contribution; Rs. 25 crore received in
Q3 FY18 and the balance in February 2018
Undertaken after re-evaluating the operating
environment, product fitment and overall feasibility
of the project
6
New area sales Q3 FY18 Q2 FY18 Q3 FY17 YoY QoQ 9M FY18 9M FY17 YoY
Volume (million sq. ft.) 0.59 0.59 0.32 87% 1% 1.59 1.54 3%
Value (Rs. million) 3,283 3,337 1,948 69% -2% 9,195 8,935 3%
Realization* (Rs./Sq. ft.) 5,542 5,703 6,150 -10% -3% 5,794 5,793 0%
Collections (Rs. million) 2,800 1,988 2,470 13% 41% 7,319 7,105 3%
*Note: In Q2 FY18, we have started passing on the GST benefits to our customers for under-construction properties as per anti-profiteering guidelines
7
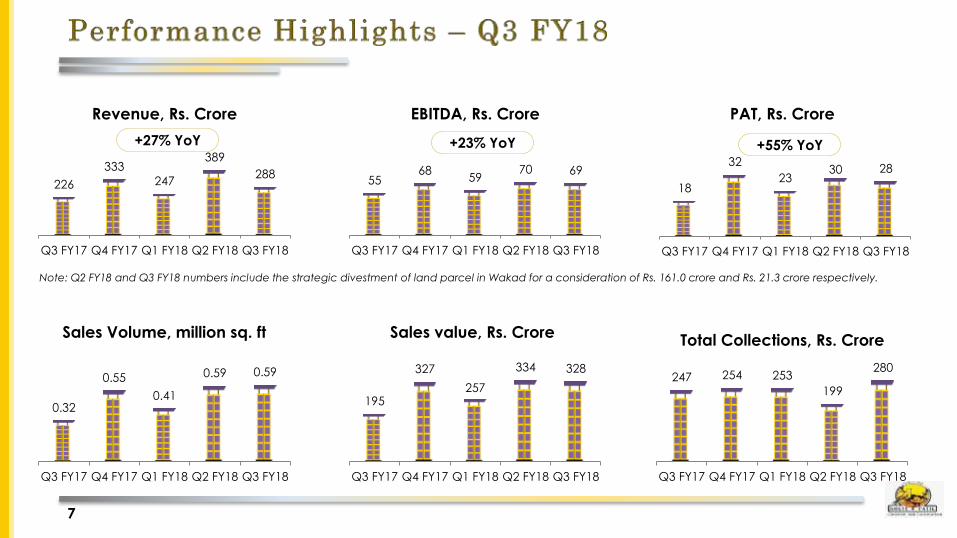
226
333
247
389
288
Q3 FY17 Q4 FY17 Q1 FY18 Q2 FY18 Q3 FY18
Revenue, Rs. Crore
55 68
59 70 69
Q3 FY17 Q4 FY17 Q1 FY18 Q2 FY18 Q3 FY18
EBITDA, Rs. Crore
0.32
0.55
0.41
0.59 0.59
Q3 FY17 Q4 FY17 Q1 FY18 Q2 FY18 Q3 FY18
Sales Volume, million sq. ft
247 254 253
199
280
Q3 FY17 Q4 FY17 Q1 FY18 Q2 FY18 Q3 FY18
Total Collections, Rs. Crore
195
327
257
334 328
Q3 FY17 Q4 FY17 Q1 FY18 Q2 FY18 Q3 FY18
Sales value, Rs. Crore
18
32
23 30 28
Q3 FY17 Q4 FY17 Q1 FY18 Q2 FY18 Q3 FY18
PAT, Rs. Crore
+23% YoY +27% YoY +55% YoY
Note: Q2 FY18 and Q3 FY18 numbers include the strategic divestment of land parcel in Wakad for a consideration of Rs. 161.0 crore and Rs. 21.3 crore respectively.
8
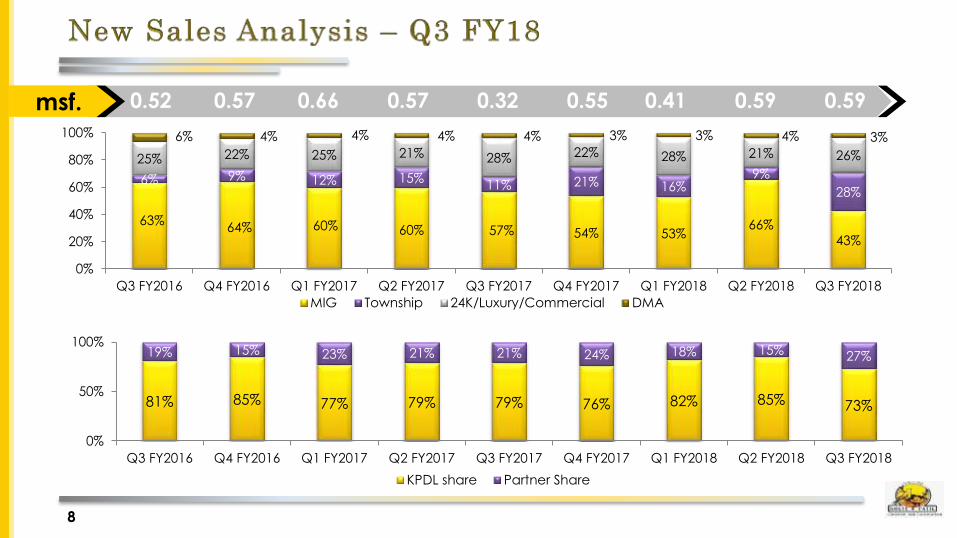
63% 64% 60% 60% 57% 54% 53%
66% 43%
6% 9% 12% 15% 11% 21% 16%
9%
28%
25% 22% 25% 21% 28% 22% 28% 21% 26%
6% 4% 4% 4% 4% 3% 3% 4% 3%
0%
20%
40%
60%
80%
100%
Q3 FY2016 Q4 FY2016 Q1 FY2017 Q2 FY2017 Q3 FY2017 Q4 FY2017 Q1 FY2018 Q2 FY2018 Q3 FY2018
MIG Township 24K/Luxury/Commercial DMA
0.52 0.57 0.66 0.57 0.32 0.55 0.41 0.59 0.59 msf.
81% 85% 77% 79% 79% 76% 82% 85% 73%
19% 15% 23% 21% 21% 24% 18% 15% 27%
0%
50%
100%
Q3 FY2016 Q4 FY2016 Q1 FY2017 Q2 FY2017 Q3 FY2017 Q4 FY2017 Q1 FY2018 Q2 FY2018 Q3 FY2018
KPDL share Partner Share
9
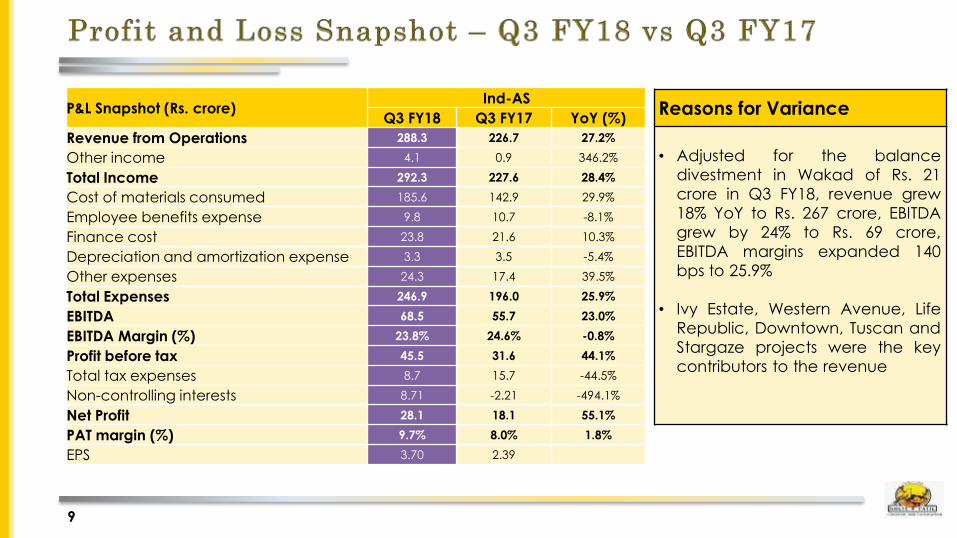
P&L Snapshot (Rs. crore) Ind-AS
Q3 FY18 Q3 FY17 YoY (%)
Revenue from Operations 288.3 226.7 27.2%
Other income 4.1 0.9 346.2%
Total Income 292.3 227.6 28.4%
Cost of materials consumed 185.6 142.9 29.9%
Employee benefits expense 9.8 10.7 -8.1%
Finance cost 23.8 21.6 10.3%
Depreciation and amortization expense 3.3 3.5 -5.4%
Other expenses 24.3 17.4 39.5%
Total Expenses 246.9 196.0 25.9%
EBITDA 68.5 55.7 23.0%
EBITDA Margin (%) 23.8% 24.6% -0.8%
Profit before tax 45.5 31.6 44.1%
Total tax expenses 8.7 15.7 -44.5%
Non-controlling interests 8.71 -2.21 -494.1%
Net Profit 28.1 18.1 55.1%
PAT margin (%) 9.7% 8.0% 1.8%
EPS 3.70 2.39
Reasons for Variance
• Adjusted for the balance
divestment in Wakad of Rs. 21
crore in Q3 FY18, revenue grew
18% YoY to Rs. 267 crore, EBITDA
grew by 24% to Rs. 69 crore,
EBITDA margins expanded 140
bps to 25.9%
• Ivy Estate, Western Avenue, Life
Republic, Downtown, Tuscan and
Stargaze projects were the key
contributors to the revenue
10
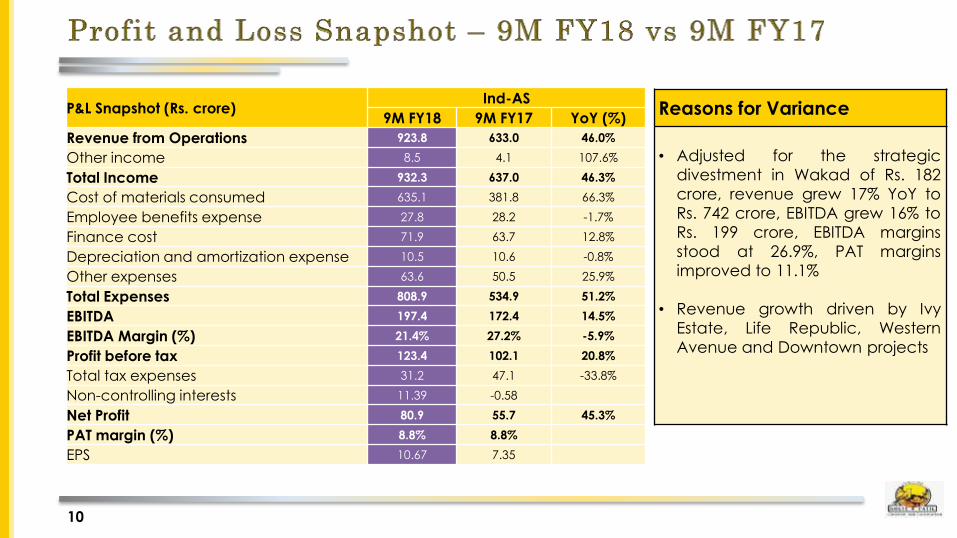
P&L Snapshot (Rs. crore) Ind-AS
9M FY18 9M FY17 YoY (%)
Revenue from Operations 923.8 633.0 46.0%
Other income 8.5 4.1 107.6%
Total Income 932.3 637.0 46.3%
Cost of materials consumed 635.1 381.8 66.3%
Employee benefits expense 27.8 28.2 -1.7%
Finance cost 71.9 63.7 12.8%
Depreciation and amortization expense 10.5 10.6 -0.8%
Other expenses 63.6 50.5 25.9%
Total Expenses 808.9 534.9 51.2%
EBITDA 197.4 172.4 14.5%
EBITDA Margin (%) 21.4% 27.2% -5.9%
Profit before tax 123.4 102.1 20.8%
Total tax expenses 31.2 47.1 -33.8%
Non-controlling interests 11.39 -0.58
Net Profit 80.9 55.7 45.3%
PAT margin (%) 8.8% 8.8%
EPS 10.67 7.35
Reasons for Variance
• Adjusted for the strategic
divestment in Wakad of Rs. 182
crore, revenue grew 17% YoY to
Rs. 742 crore, EBITDA grew 16% to
Rs. 199 crore, EBITDA margins
stood at 26.9%, PAT margins
improved to 11.1%
• Revenue growth driven by Ivy
Estate, Life Republic, Western
Avenue and Downtown projects
11
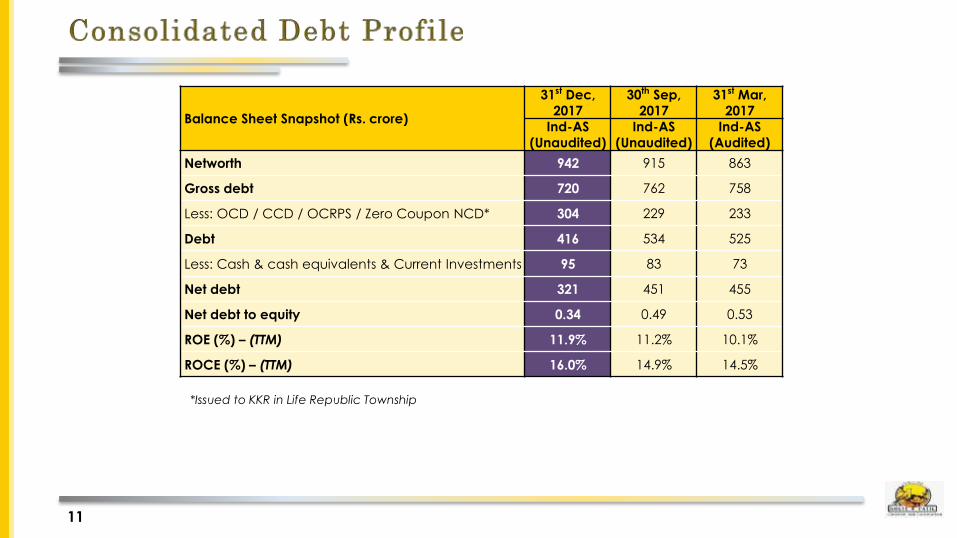
Balance Sheet Snapshot (Rs. crore)
31st Dec,
2017
30th Sep,
2017
31st Mar,
2017
Ind-AS
(Unaudited)
Ind-AS
(Unaudited)
Ind-AS
(Audited)
Networth 942 915 863
Gross debt 720 762 758
Less: OCD / CCD / OCRPS / Zero Coupon NCD* 304 229 233
Debt 416 534 525
Less: Cash & cash equivalents & Current Investments 95 83 73
Net debt 321 451 455
Net debt to equity 0.34 0.49 0.53
ROE (%) – (TTM) 11.9% 11.2% 10.1%
ROCE (%) – (TTM) 16.0% 14.9% 14.5%
*Issued to KKR in Life Republic Township
12
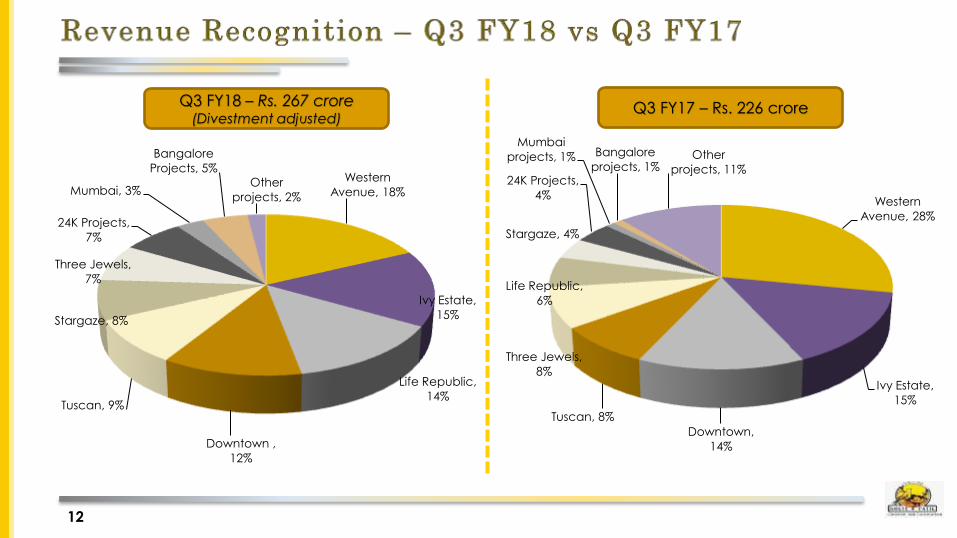
Western
Avenue, 18%
Ivy Estate,
15%
Life Republic,
14%
Downtown ,
12%
Tuscan, 9%
Stargaze, 8%
Three Jewels,
7%
24K Projects,
7%
Mumbai, 3%
Bangalore
Projects, 5% Other
projects, 2% Western
Avenue, 28%
Ivy Estate,
15%
Downtown,
14%
Tuscan, 8%
Three Jewels,
8%
Life Republic,
6%
Stargaze, 4%
24K Projects,
4%
Mumbai
projects, 1% Bangalore
projects, 1% Other
projects, 11%
Q3 FY18 – Rs. 267 crore (Divestment adjusted)
Q3 FY17 – Rs. 226 crore
13
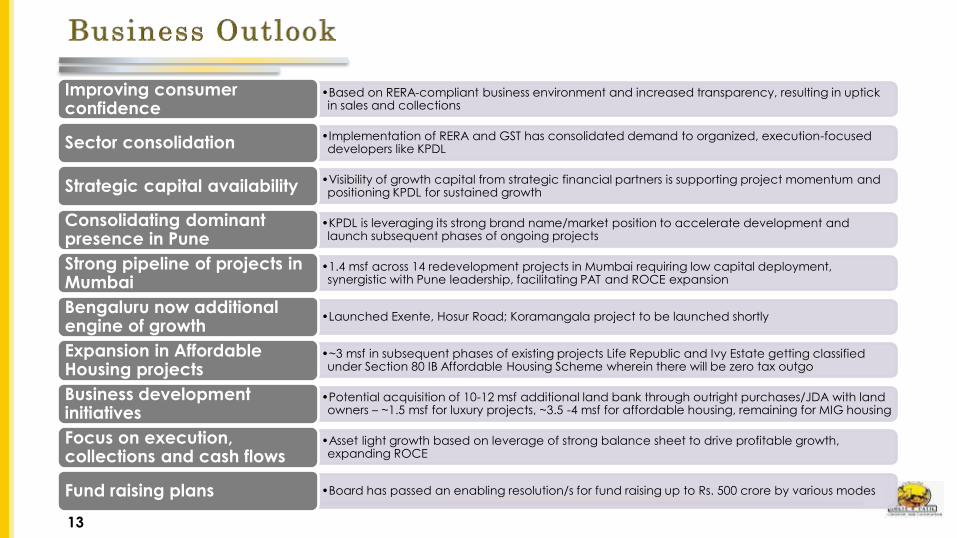
•Based on RERA-compliant business environment and increased transparency, resulting in uptick in sales and collections
Improving consumer confidence
•Implementation of RERA and GST has consolidated demand to organized, execution-focused developers like KPDL Sector consolidation
•Visibility of growth capital from strategic financial partners is supporting project momentum and positioning KPDL for sustained growth Strategic capital availability
•KPDL is leveraging its strong brand name/market position to accelerate development and launch subsequent phases of ongoing projects
Consolidating dominant presence in Pune
•1.4 msf across 14 redevelopment projects in Mumbai requiring low capital deployment, synergistic with Pune leadership, facilitating PAT and ROCE expansion
Strong pipeline of projects in Mumbai
•Launched Exente, Hosur Road; Koramangala project to be launched shortly Bengaluru now additional engine of growth
•~3 msf in subsequent phases of existing projects Life Republic and Ivy Estate getting classified under Section 80 IB Affordable Housing Scheme wherein there will be zero tax outgo
Expansion in Affordable Housing projects
•Potential acquisition of 10-12 msf additional land bank through outright purchases/JDA with land owners – ~1.5 msf for luxury projects, ~3.5 -4 msf for affordable housing, remaining for MIG housing
Business development initiatives
•Asset light growth based on leverage of strong balance sheet to drive profitable growth, expanding ROCE
Focus on execution, collections and cash flows
•Board has passed an enabling resolution/s for fund raising up to Rs. 500 crore by various modes Fund raising plans
14
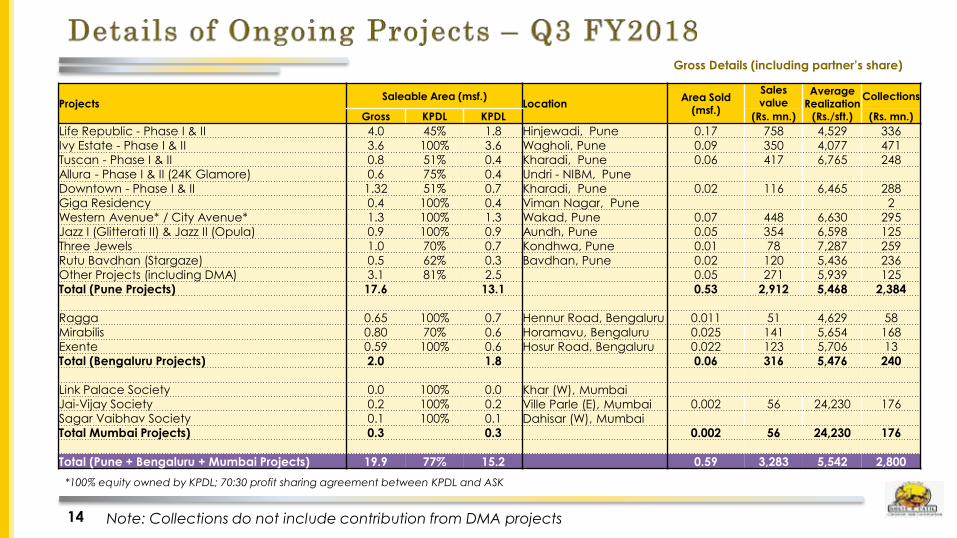
Gross Details (including partner’s share)
Note: Collections do not include contribution from DMA projects
Projects Saleable Area (msf.)
Location Area Sold
(msf.)
Sales value
Average
Realization (Rs./sft.)
Collections
Gross KPDL KPDL (Rs. mn.) (Rs. mn.)
Life Republic - Phase I & II 4.0 45% 1.8 Hinjewadi, Pune 0.17 758 4,529 336
Ivy Estate - Phase I & II 3.6 100% 3.6 Wagholi, Pune 0.09 350 4,077 471
Tuscan - Phase I & II 0.8 51% 0.4 Kharadi, Pune 0.06 417 6,765 248
Allura - Phase I & II (24K Glamore) 0.6 75% 0.4 Undri - NIBM, Pune
Downtown - Phase I & II 1.32 51% 0.7 Kharadi, Pune 0.02 116 6,465 288
Giga Residency 0.4 100% 0.4 Viman Nagar, Pune 2
Western Avenue* / City Avenue* 1.3 100% 1.3 Wakad, Pune 0.07 448 6,630 295
Jazz I (Glitterati II) & Jazz II (Opula) 0.9 100% 0.9 Aundh, Pune 0.05 354 6,598 125
Three Jewels 1.0 70% 0.7 Kondhwa, Pune 0.01 78 7,287 259
Rutu Bavdhan (Stargaze) 0.5 62% 0.3 Bavdhan, Pune 0.02 120 5,436 236
Other Projects (including DMA) 3.1 81% 2.5 0.05 271 5,939 125
Total (Pune Projects) 17.6 13.1 0.53 2,912 5,468 2,384
Ragga 0.65 100% 0.7 Hennur Road, Bengaluru 0.011 51 4,629 58 Mirabilis 0.80 70% 0.6 Horamavu, Bengaluru 0.025 141 5,654 168
Exente 0.59 100% 0.6 Hosur Road, Bengaluru 0.022 123 5,706 13
Total (Bengaluru Projects) 2.0 1.8 0.06 316 5,476 240
Link Palace Society 0.0 100% 0.0 Khar (W), Mumbai
Jai-Vijay Society 0.2 100% 0.2 Ville Parle (E), Mumbai 0.002 56 24,230 176
Sagar Vaibhav Society 0.1 100% 0.1 Dahisar (W), Mumbai
Total Mumbai Projects) 0.3 0.3 0.002 56 24,230 176
Total (Pune + Bengaluru + Mumbai Projects) 19.9 77% 15.2 0.59 3,283 5,542 2,800
*100% equity owned by KPDL; 70:30 profit sharing agreement between KPDL and ASK
15
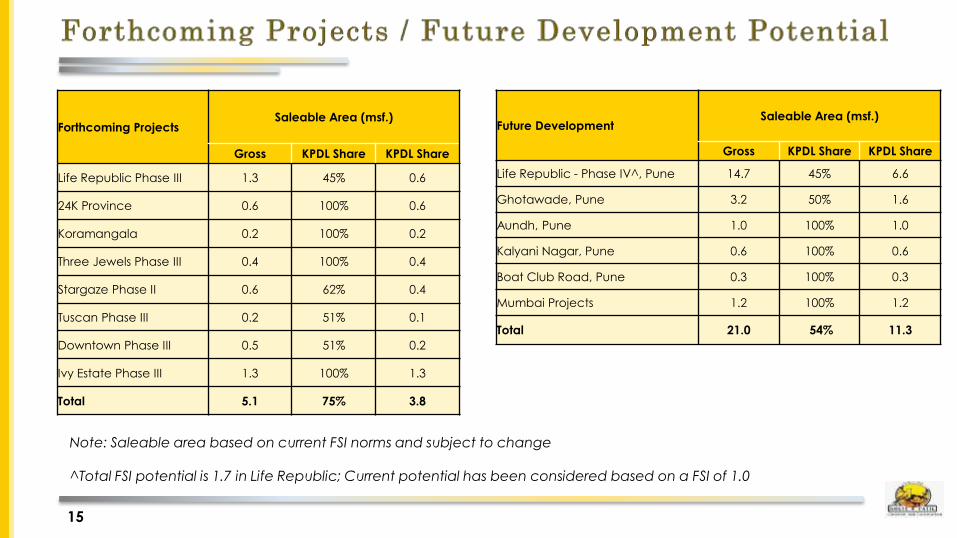
Forthcoming Projects Saleable Area (msf.)
Gross KPDL Share KPDL Share
Life Republic Phase III 1.3 45% 0.6
24K Province 0.6 100% 0.6
Koramangala 0.2 100% 0.2
Three Jewels Phase III 0.4 100% 0.4
Stargaze Phase II 0.6 62% 0.4
Tuscan Phase III 0.2 51% 0.1
Downtown Phase III 0.5 51% 0.2
Ivy Estate Phase III 1.3 100% 1.3
Total 5.1 75% 3.8
Note: Saleable area based on current FSI norms and subject to change ^Total FSI potential is 1.7 in Life Republic; Current potential has been considered based on a FSI of 1.0
Future Development Saleable Area (msf.)
Gross KPDL Share KPDL Share
Life Republic - Phase IV^, Pune 14.7 45% 6.6
Ghotawade, Pune 3.2 50% 1.6
Aundh, Pune 1.0 100% 1.0
Kalyani Nagar, Pune 0.6 100% 0.6
Boat Club Road, Pune 0.3 100% 0.3
Mumbai Projects 1.2 100% 1.2
Total 21.0 54% 11.3

16
Golden Bricks Awards at Dubai - 2017
Most Outstanding Industry
Contribution (Regional)
Best Township of the Year
(Life Republic)
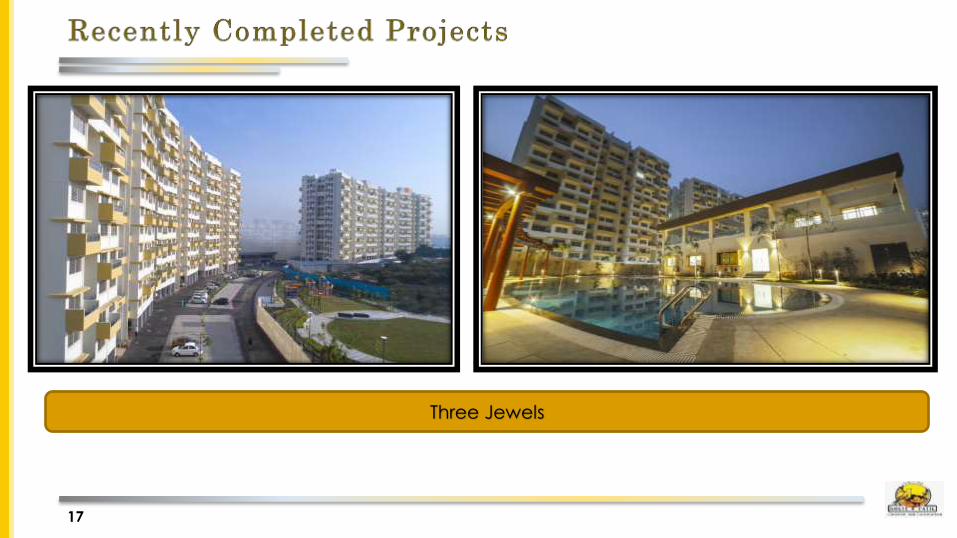
17
Three Jewels
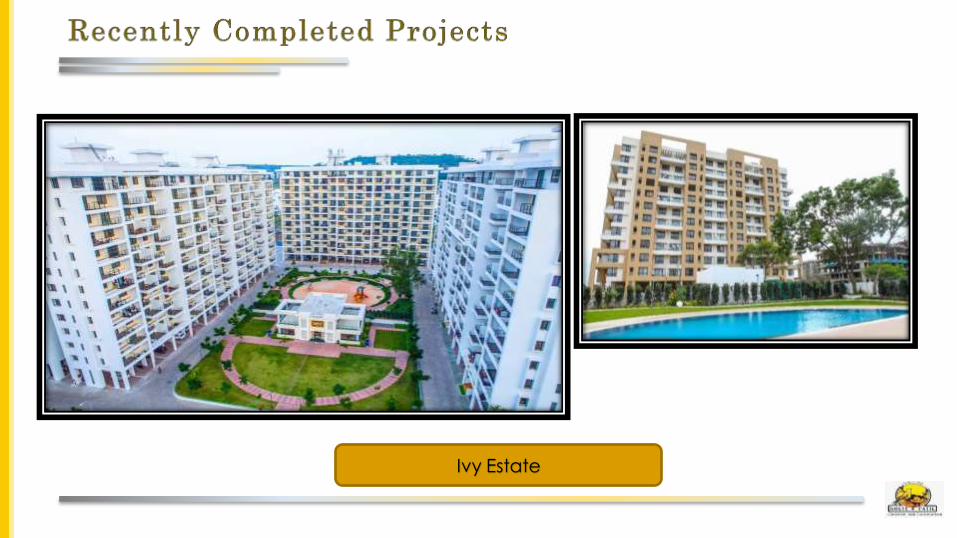
Ivy Estate
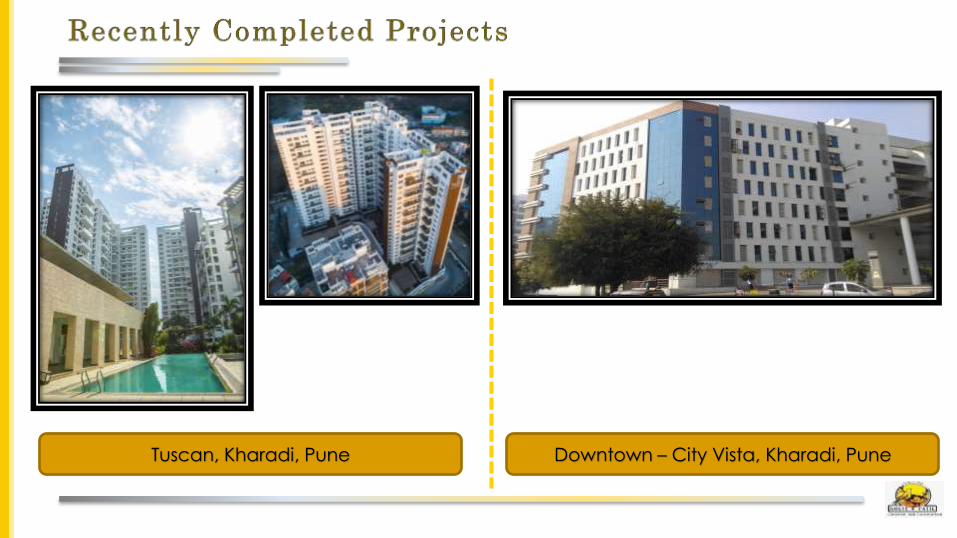
Tuscan, Kharadi, Pune Downtown – City Vista, Kharadi, Pune
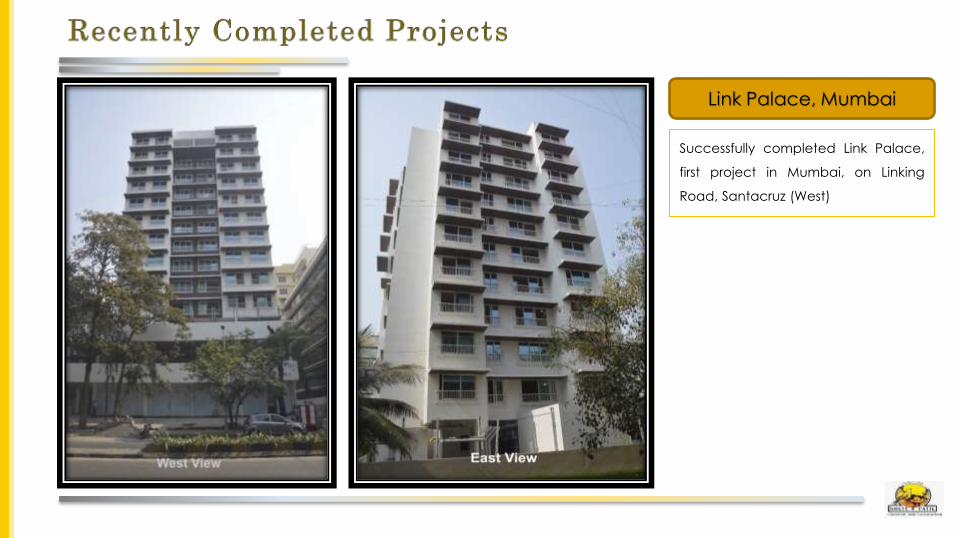
Link Palace, Mumbai
Successfully completed Link Palace,
first project in Mumbai, on Linking
Road, Santacruz (West)
Varun Divadkar / Shiv Muttoo
CDR, India
Tel: +91 97637 02204 / +91 22 6645 1207
Email: [email protected] / [email protected]
Girish Zingade
Kolte-Patil Developers Ltd.,
201, City Point, Pune
Tel: +91 77700 17399
Email: [email protected]
For further information, please contact: Kolte-Patil Developers Ltd. (BSE: 532924, NSE: KOLTEPATIL), incorporated in 1991, is a leading real
estate company with dominant presence in the Pune residential market. Kolte-Patil is a trusted
name with a reputation for high quality standards, design uniqueness, transparency and the
delivery of projects in a timely manner. The company has developed and constructed over 50
projects including residential complexes, commercial complexes and IT Parks covering a saleable
area of ~15 million square feet across Pune, Mumbai and Bengaluru.
Kolte-Patil markets its projects under two brands: ‟Kolte-Patil‟ (addressing the mid-income segment)
and „24K‟ (addressing the premium luxury segment). The Company has executed projects in
multiple segments – standalone residential buildings and integrated townships. Several of the
company‟s projects have been certified by the Indian Green Building Council (IGBC).
Consolidating its leadership position in Pune, the company forayed into the Mumbai market in 2013
focusing on low capital intensive society re-development projects. The company has already
signed 14 projects till date at prime locations across the city.
The Company‟s long-term bank debt and non-convertible debentures have been rated „A+ /
Stable‟ by CRISIL, the highest rating accorded by CRISIL to any publicly listed residential real estate
player in India.
For more details on Kolte-Patil Developers Ltd., visit www.koltepatil.com
21