Embed Size (px)
Citation preview
1
Q1 2021 Earnings Presentation
May 6, 2021
2
DISCLAIMER
Forward Looking Statements
• This presentation contains forward-looking statements. These forward-looking statements include, but are not limited to, all statements other than statements ofhistorical facts contained in this presentation, including, without limitation, those regarding our future financial position and results of operations, our strategy, plans,objectives, goals and targets, future developments in the markets in which we operate or are seeking to operate or anticipated regulatory changes in the markets inwhich we operate or intend to operate. In some cases, you can identify forward-looking statements by terminology such as "aim," "anticipate," "believe," "continue,""could," "estimate," "expect," "forecast," "guidance," "intend," "is likely to," "may," "plan," "potential," "predict," "projected," "should" or "will" or the negative of suchterms or other similar expressions or terminology.
• By their nature, forward-looking statements involve risks and uncertainties because they relate to events and depend on circumstances that may or may not occur inthe future. Forward-looking statements speak only as of the date of this presentation and are not guarantees of future performance and are based on numerousassumptions. Our actual results of operations, financial condition and the development of events may differ materially from (and be more negative than) those madein, or suggested by, the forward-looking statements. Except as required by law, we do not undertake any obligation to update any forward-looking statements toreflect events or circumstances after the date hereof or to reflect the occurrence of anticipated or unanticipated events or circumstances.
• Investors should read the section entitled "Item 3.D—Risk Factors" and the description of our segments and business sectors in the section entitled "Item 4B.Information on the Company—Business Overview", each in our Annual Report for the fiscal year ended December 31, 2020, filed on Form 20-F, for a more completediscussion of the risks and factors that could affect us.
• Forward-looking statements include, but are not limited to, statements relating to: expected value, payments and closing timelines for investments; business synergiesfrom investments; equity investment and project growth strategy; accretive investment opportunities; strategic business alternatives to ensure optimal company value;estimated returns and cash available for distribution (“CAFD”) estimates, including CAFD per share growth strategy and targets, CAFD estimates per currency,geography and sector, including as a result of project debt refinancing; net corporate leverage based on CAFD estimates; debt refinancing; the quality of our long-termcontracts; self-amortizing project debt structure and related debt reduction; the use of non-GAAP measures as a useful predicting tool for investors; the possibility toextend asset life; cost improvements from debt refinancing; dividends; and various other factors, including those factors discussed under “Item 3.D—Risk Factors” and“Item 5.A—Operating Results” in our Annual Report for the fiscal year ended December 31, 2020 filed on Form 20-F.
• The CAFD and other guidance incorporated into this presentation are estimates as of March 1, 2021. These estimates are based on assumptions believed to bereasonable as of the date Atlantica published its 2020 Financial Results. Atlantica disclaims any current intention to update such guidance, except as required by law.
Non-GAAP Financial Information
• This presentation also includes certain non-GAAP financial measures, including Adjusted EBITDA including unconsolidated affiliates, Adjusted EBITDA includingunconsolidated affiliates as a percentage of revenues (margin) and CAFD. Non-GAAP financial measures are not measurements of our performance or liquidity underIFRS as issued by IASB and should not be considered alternatives to operating profit or profit for the period or any other performance measures derived in accordancewith IFRS as issued by the IASB or any other generally accepted accounting principles or as alternatives to cash flow from operating, investing or financing activities.Please refer to the appendix of this presentation for a reconciliation of the non-GAAP financial measures included in this presentation to the most directly comparablefinancial measures prepared in accordance with IFRS as well as the reasons why management believes the use of non-GAAP financial measures (including CAFD andAdjusted EBITDA) in this presentation provides useful information to investors.
• In our discussion of operating results, we have included foreign exchange impacts in our revenue and Adjusted EBITDA including unconsolidated affiliates by providingconstant currency growth. The constant currency presentation is not a measure recognized under IFRS and excludes the impact of fluctuations in foreign currencyexchange rates. We believe providing constant currency information provides valuable supplemental information regarding our results of operations. We calculateconstant currency amounts by converting our current period local currency revenue and Adjusted EBITDA using the prior period foreign currency average exchangerates and comparing these adjusted amounts to our prior period reported results. This calculation may differ from similarly titled measures used by others and,accordingly, the constant currency presentation is not meant to substitute for recorded amounts presented in conformity with IFRS as issued by the IASB nor shouldsuch amounts be considered in isolation.
3
Q1 2021 Earnings Presentation
Key Messages
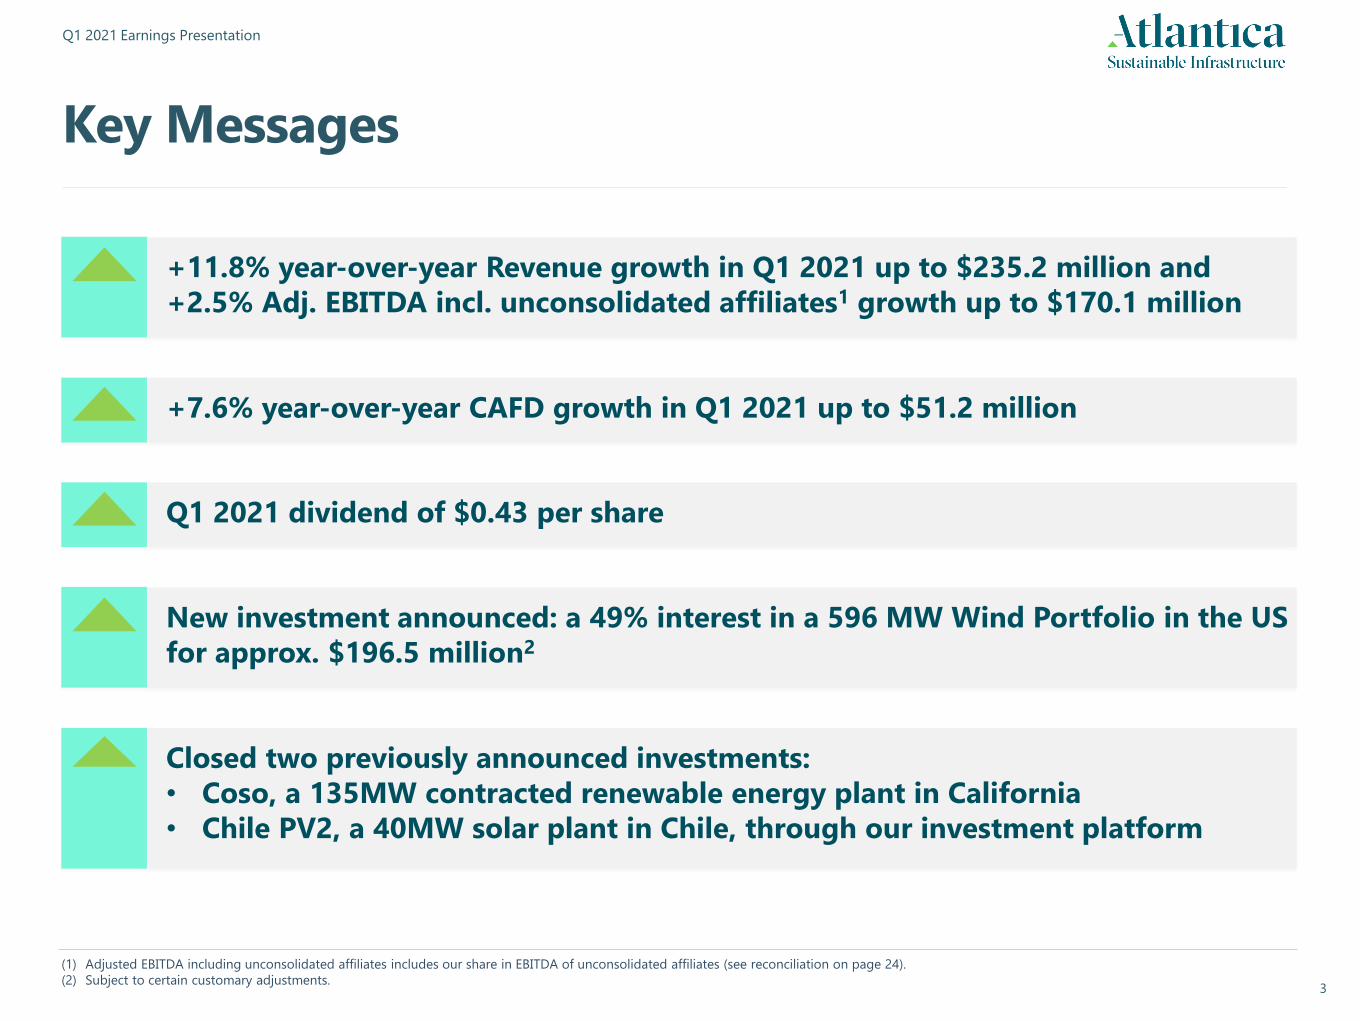
Q1 2021 dividend of $0.43 per share
New investment announced: a 49% interest in a 596 MW Wind Portfolio in the US for approx. $196.5 million2
+7.6% year-over-year CAFD growth in Q1 2021 up to $51.2 million
(1) Adjusted EBITDA including unconsolidated affiliates includes our share in EBITDA of unconsolidated affiliates (see reconciliation on page 24).(2) Subject to certain customary adjustments.
Closed two previously announced investments:• Coso, a 135MW contracted renewable energy plant in California• Chile PV2, a 40MW solar plant in Chile, through our investment platform
+11.8% year-over-year Revenue growth in Q1 2021 up to $235.2 million and +2.5% Adj. EBITDA incl. unconsolidated affiliates1 growth up to $170.1 million
4
Q1 2021 Earnings Presentation
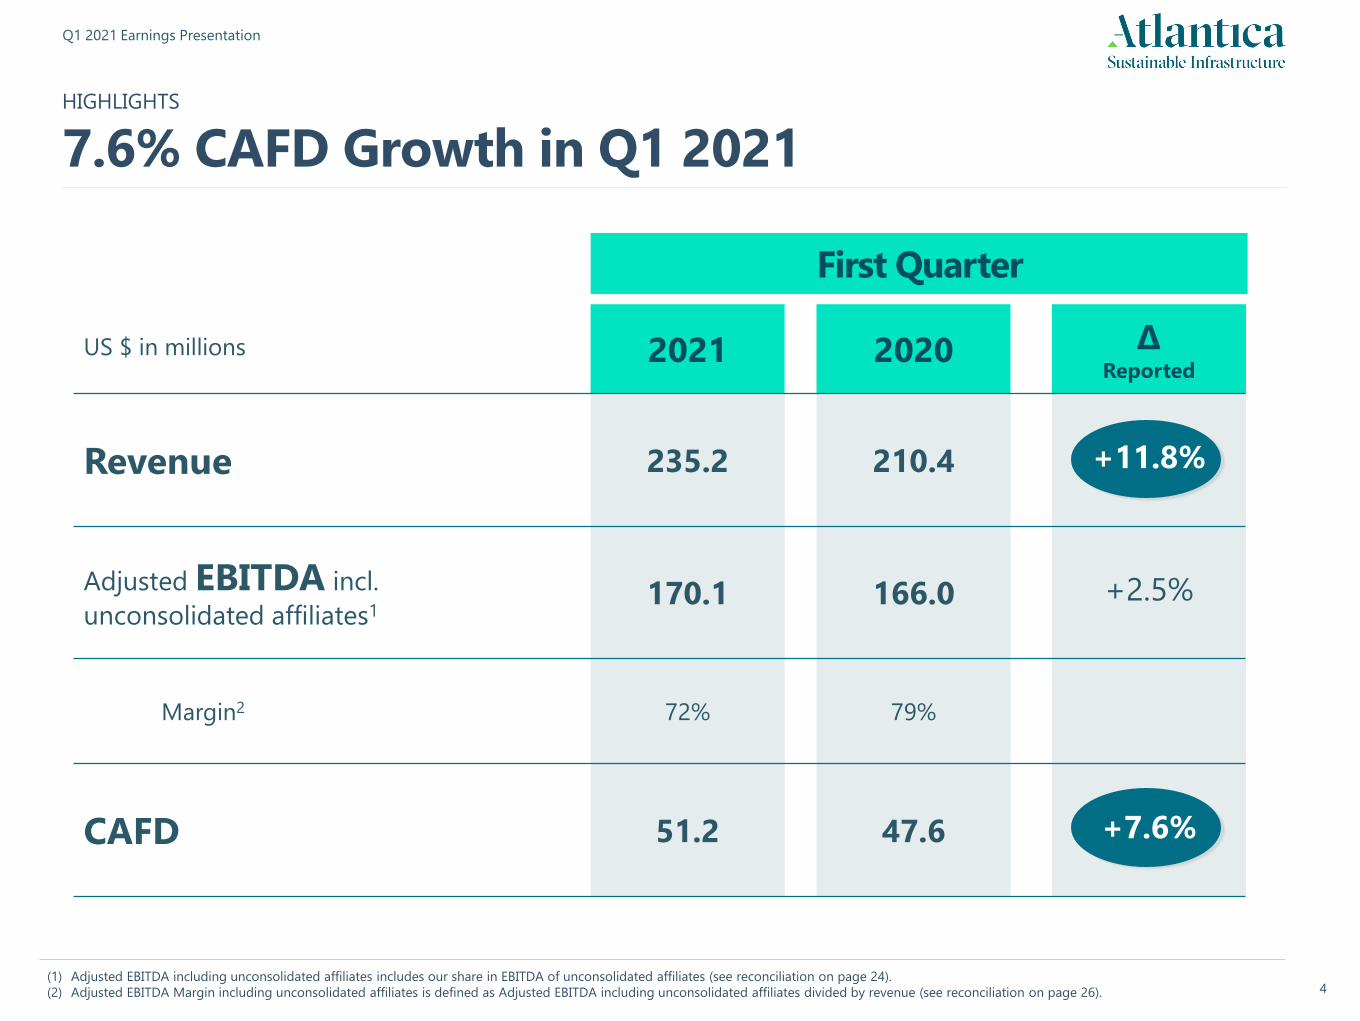
US $ in millions 2021 2020 ∆Reported
Revenue 235.2 210.4 +11.8%
Adjusted EBITDA incl.
unconsolidated affiliates1170.1 166.0 +2.5%
Margin2 72% 79%
CAFD 51.2 47.6 +7.6%
First Quarter
HIGHLIGHTS
7.6% CAFD Growth in Q1 2021
(1) Adjusted EBITDA including unconsolidated affiliates includes our share in EBITDA of unconsolidated affiliates (see reconciliation on page 24).(2) Adjusted EBITDA Margin including unconsolidated affiliates is defined as Adjusted EBITDA including unconsolidated affiliates divided by revenue (see reconciliation on page 26).
5
Q1 2021 Earnings Presentation
(1) Adjusted EBITDA including unconsolidated affiliates includes our share in EBITDA of unconsolidated affiliates (see reconciliation on page 24).(2) Adjusted EBITDA Margin including unconsolidated affiliates is defined as Adjusted EBITDA including unconsolidated affiliates divided by revenue (see reconciliation on page 26).
HIGHLIGHTS
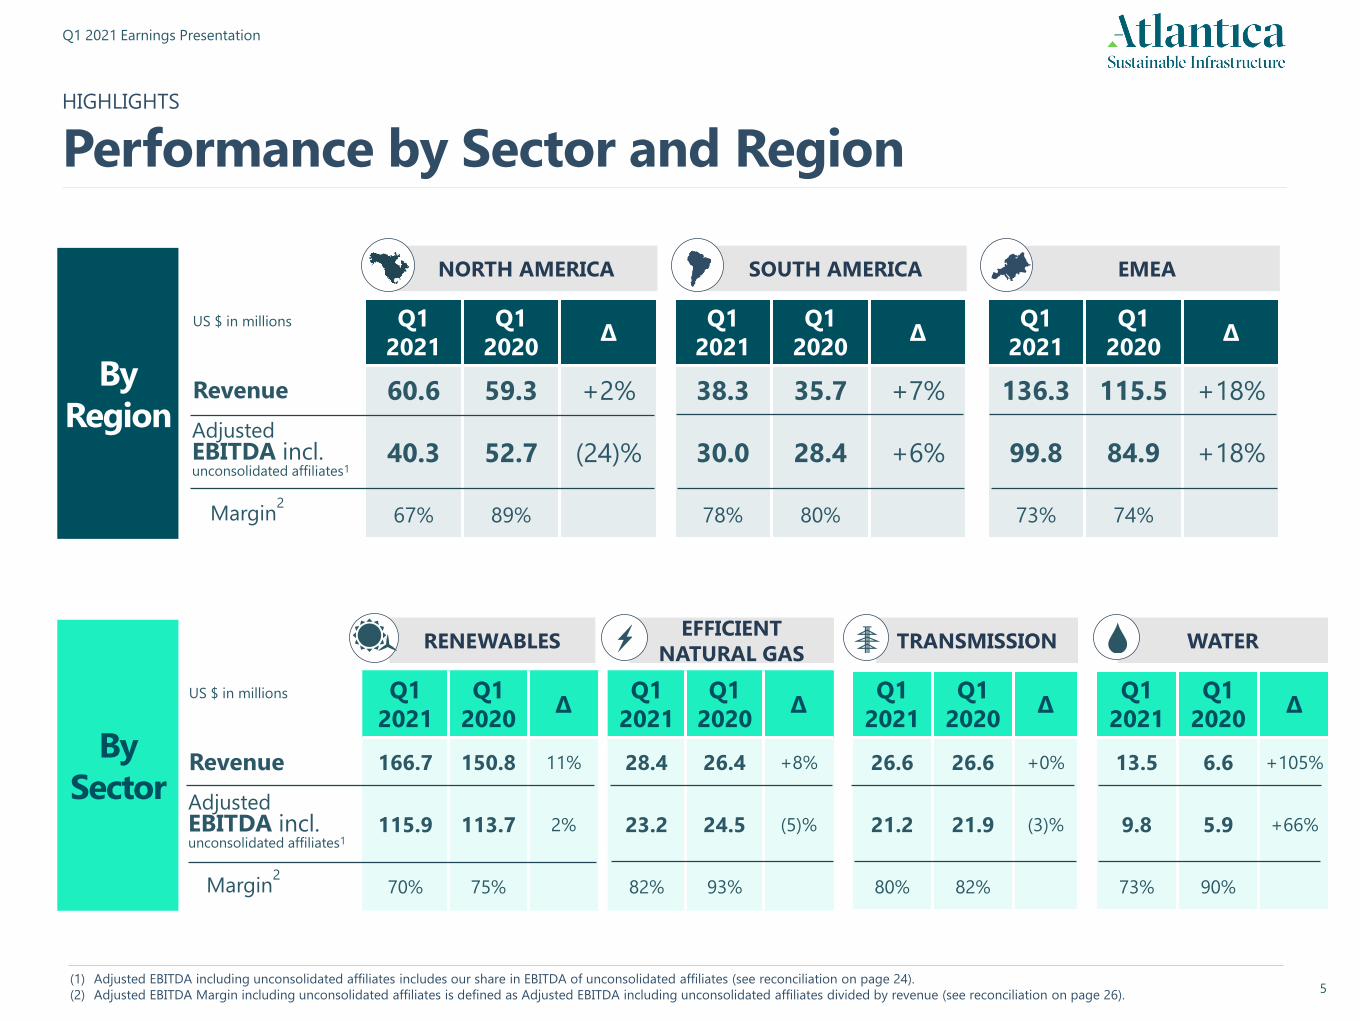
Performance by Sector and Region
WATER
Q1 2021
Q1 2020
∆
13.5 6.6 +105%
9.8 5.9 +66%
73% 90%
RENEWABLES
Q1 2021
Q1 2020
∆
166.7 150.8 11%
115.9 113.7 2%
70% 75%
EFFICIENT NATURAL GAS
Q1 2021
Q1 2020
∆
28.4 26.4 +8%
23.2 24.5 (5)%
82% 93%
TRANSMISSION
Q1 2021
Q1 2020
∆
26.6 26.6 +0%
21.2 21.9 (3)%
80% 82%
By Sector
US $ in millions
Revenue
Adjusted EBITDA incl.unconsolidated affiliates1
Margin2
EMEANORTH AMERICA
Q1 2021
Q1 2020
∆
60.6 59.3 +2%
40.3 52.7 (24)%
67% 89%
SOUTH AMERICA
Q1 2021
Q1 2020
∆
136.3 115.5 +18%
99.8 84.9 +18%
73% 74%
By Region
US $ in millions
Revenue
Adjusted EBITDA incl.unconsolidated affiliates1
Margin2
Q1 2021
Q1 2020
∆
38.3 35.7 +7%
30.0 28.4 +6%
78% 80%
6
Q1 2021 Earnings Presentation
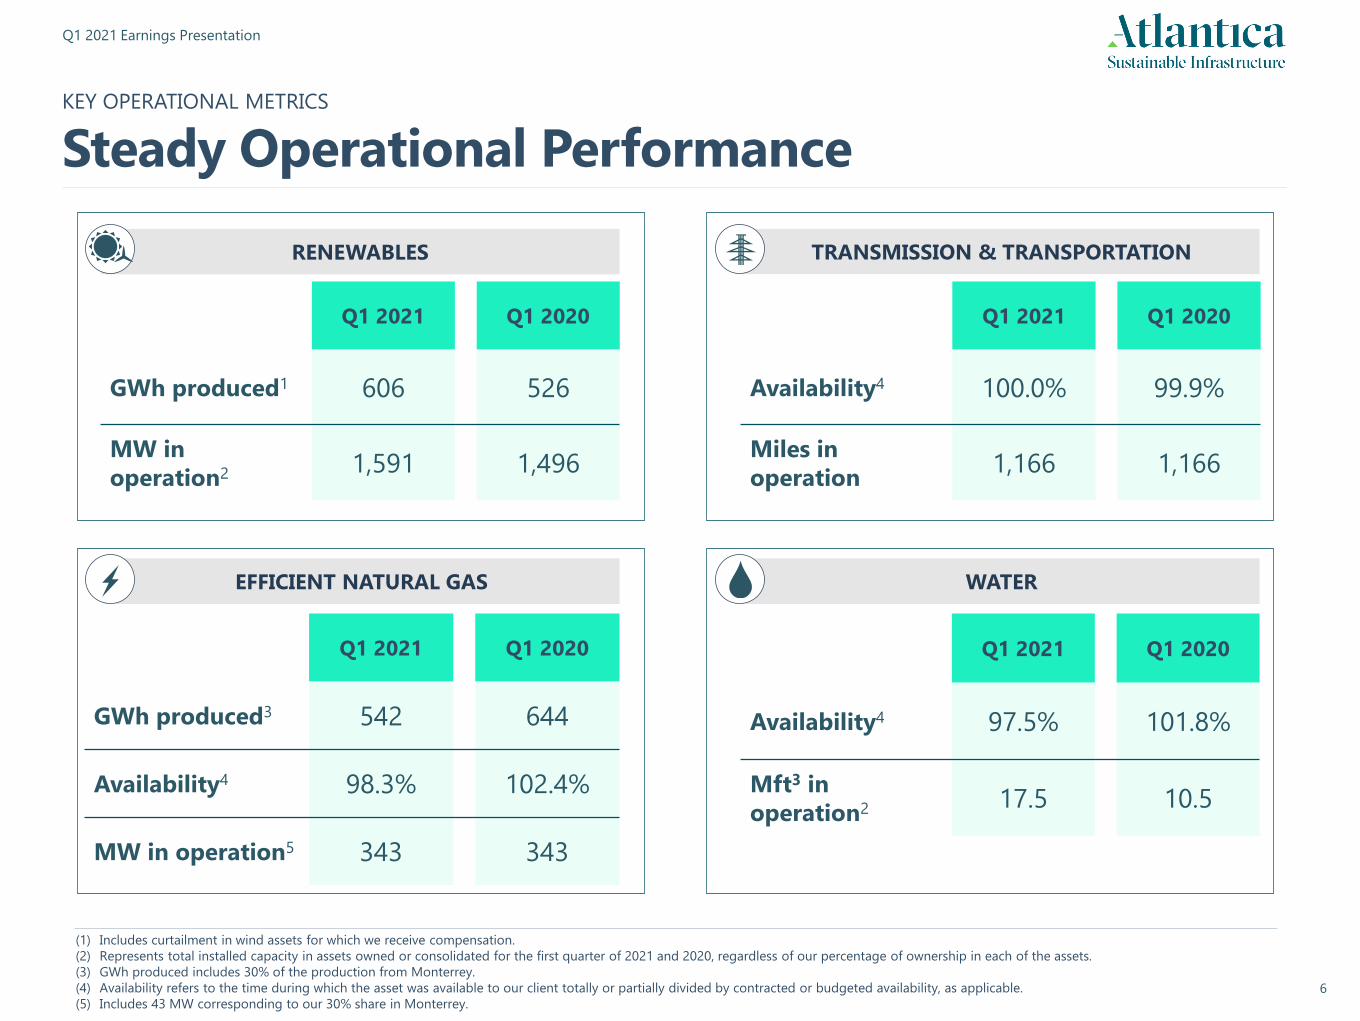
(1) Includes curtailment in wind assets for which we receive compensation.(2) Represents total installed capacity in assets owned or consolidated for the first quarter of 2021 and 2020, regardless of our percentage of ownership in each of the assets.(3) GWh produced includes 30% of the production from Monterrey.(4) Availability refers to the time during which the asset was available to our client totally or partially divided by contracted or budgeted availability, as applicable.(5) Includes 43 MW corresponding to our 30% share in Monterrey.
WATER
RENEWABLES TRANSMISSION & TRANSPORTATION
EFFICIENT NATURAL GAS
Q1 2021 Q1 2020
Availability4 97.5% 101.8%
Mft3 in operation2 17.5 10.5
Q1 2021 Q1 2020
GWh produced1 606 526
MW in operation2 1,591 1,496
Q1 2021 Q1 2020
GWh produced3 542 644
Availability4 98.3% 102.4%
MW in operation5 343 343
Q1 2021 Q1 2020
Availability4 100.0% 99.9%
Miles in operation
1,166 1,166
KEY OPERATIONAL METRICS
Steady Operational Performance
7
Q1 2021 Earnings Presentation
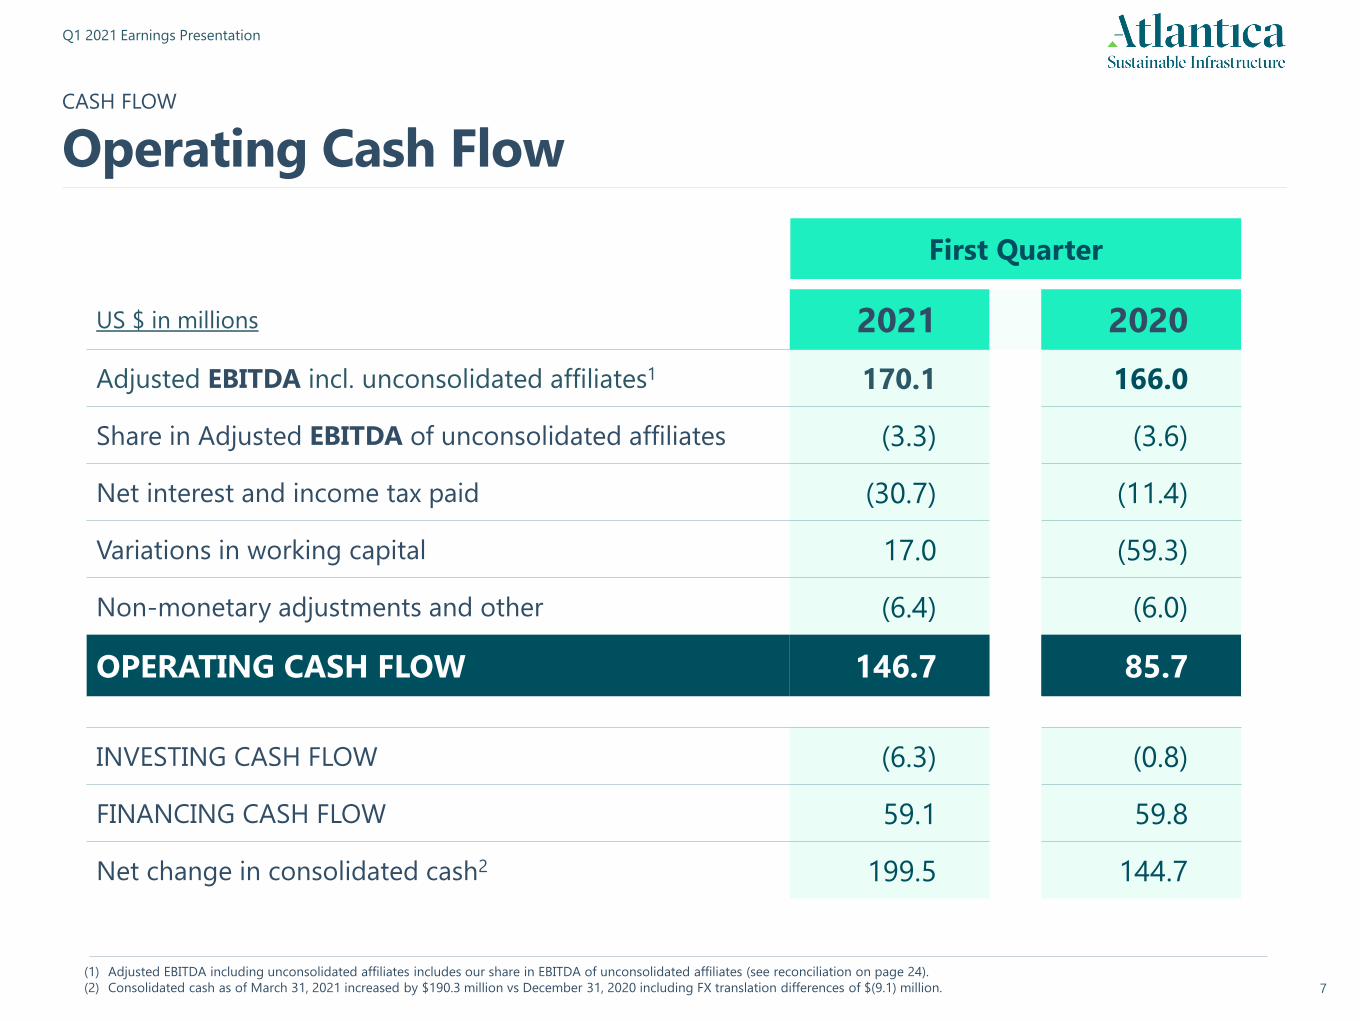
(1) Adjusted EBITDA including unconsolidated affiliates includes our share in EBITDA of unconsolidated affiliates (see reconciliation on page 24).(2) Consolidated cash as of March 31, 2021 increased by $190.3 million vs December 31, 2020 including FX translation differences of $(9.1) million.
US $ in millions 2021 2020
Adjusted EBITDA incl. unconsolidated affiliates1 170.1 166.0
Share in Adjusted EBITDA of unconsolidated affiliates (3.3) (3.6)
Net interest and income tax paid (30.7) (11.4)
Variations in working capital 17.0 (59.3)
Non-monetary adjustments and other (6.4) (6.0)
OPERATING CASH FLOW 146.7 85.7
INVESTING CASH FLOW (6.3) (0.8)
FINANCING CASH FLOW 59.1 59.8
Net change in consolidated cash2 199.5 144.7
CASH FLOW
Operating Cash Flow
First Quarter
8
Q1 2021 Earnings Presentation
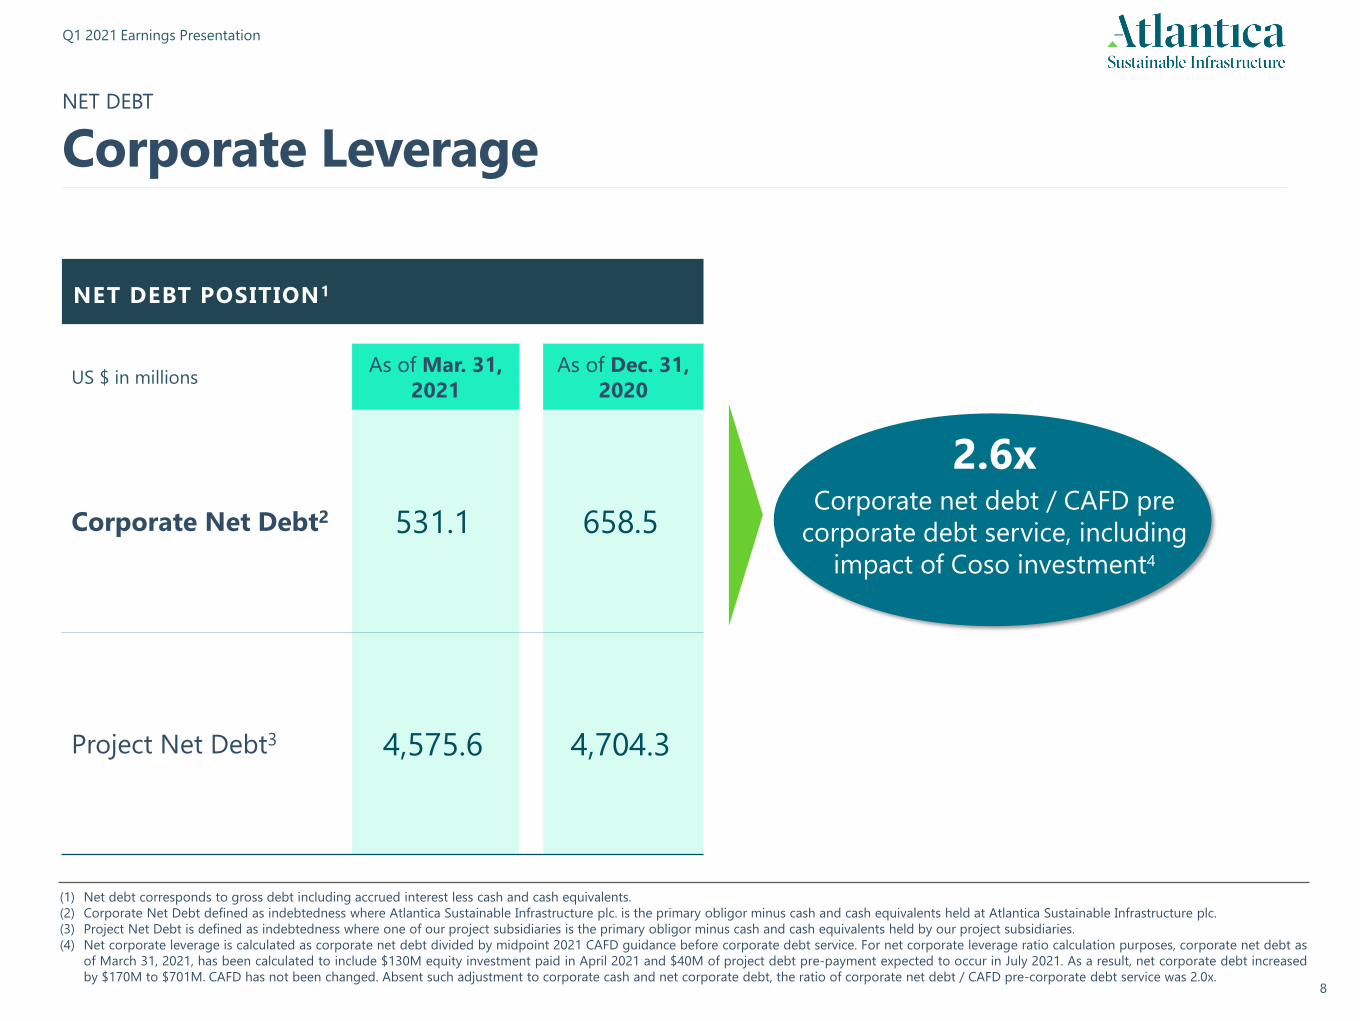
NET DEBT POSITION1
(1) Net debt corresponds to gross debt including accrued interest less cash and cash equivalents.(2) Corporate Net Debt defined as indebtedness where Atlantica Sustainable Infrastructure plc. is the primary obligor minus cash and cash equivalents held at Atlantica Sustainable Infrastructure plc.(3) Project Net Debt is defined as indebtedness where one of our project subsidiaries is the primary obligor minus cash and cash equivalents held by our project subsidiaries.(4) Net corporate leverage is calculated as corporate net debt divided by midpoint 2021 CAFD guidance before corporate debt service. For net corporate leverage ratio calculation purposes, corporate net debt as
of March 31, 2021, has been calculated to include $130M equity investment paid in April 2021 and $40M of project debt pre-payment expected to occur in July 2021. As a result, net corporate debt increasedby $170M to $701M. CAFD has not been changed. Absent such adjustment to corporate cash and net corporate debt, the ratio of corporate net debt / CAFD pre-corporate debt service was 2.0x.
US $ in millionsAs of Mar. 31,
2021As of Dec. 31,
2020
Corporate Net Debt2 531.1 658.5
Project Net Debt3 4,575.6 4,704.3
NET DEBT
Corporate Leverage
Corporate net debt / CAFD pre corporate debt service, including
impact of Coso investment4
2.6x

9
Q1 2021 Earnings Presentation
NEW INVESTMENT
A 596 MW Wind Portfolio in the US
▪ 4 wind assets in Illinois, Texas,Oregon and Minnesota
▪ ~$197 million investment1
▪ Proven track record
▪ Closing expected in Q3 2021
✓ Increases and diversifies presence in North America
✓ Increases presence in renewables
✓ Fully contracted revenues with PPAs with investment grade offtakers
Acquisition of a 49% interest in a 596 MW Wind Portfolio in the US
INVESTMENT HIGHLIGHTS
✓ ~5.9x EV2 / EBITDA3
✓ No project debt as of today
✓ Substantial value post PPA, including repowering opportunities
(1) Subject to certain customary adjustments.(2) Entreprise Value is defined as the expected investment divided by the 49% equity interest agreed to be acquired. The asset has no debt.
(3) EBITDA is calculated as profit/(loss) of the portfolio for the year 2020 after adding backdepreciation, amortization and impairment charges. There were no financing costs orincome tax in 2020 in this portfolio (see reconciliation on page 26).
Appendix
Q1 2021 Results Presentation
11
Q1 2021 Earnings Presentation
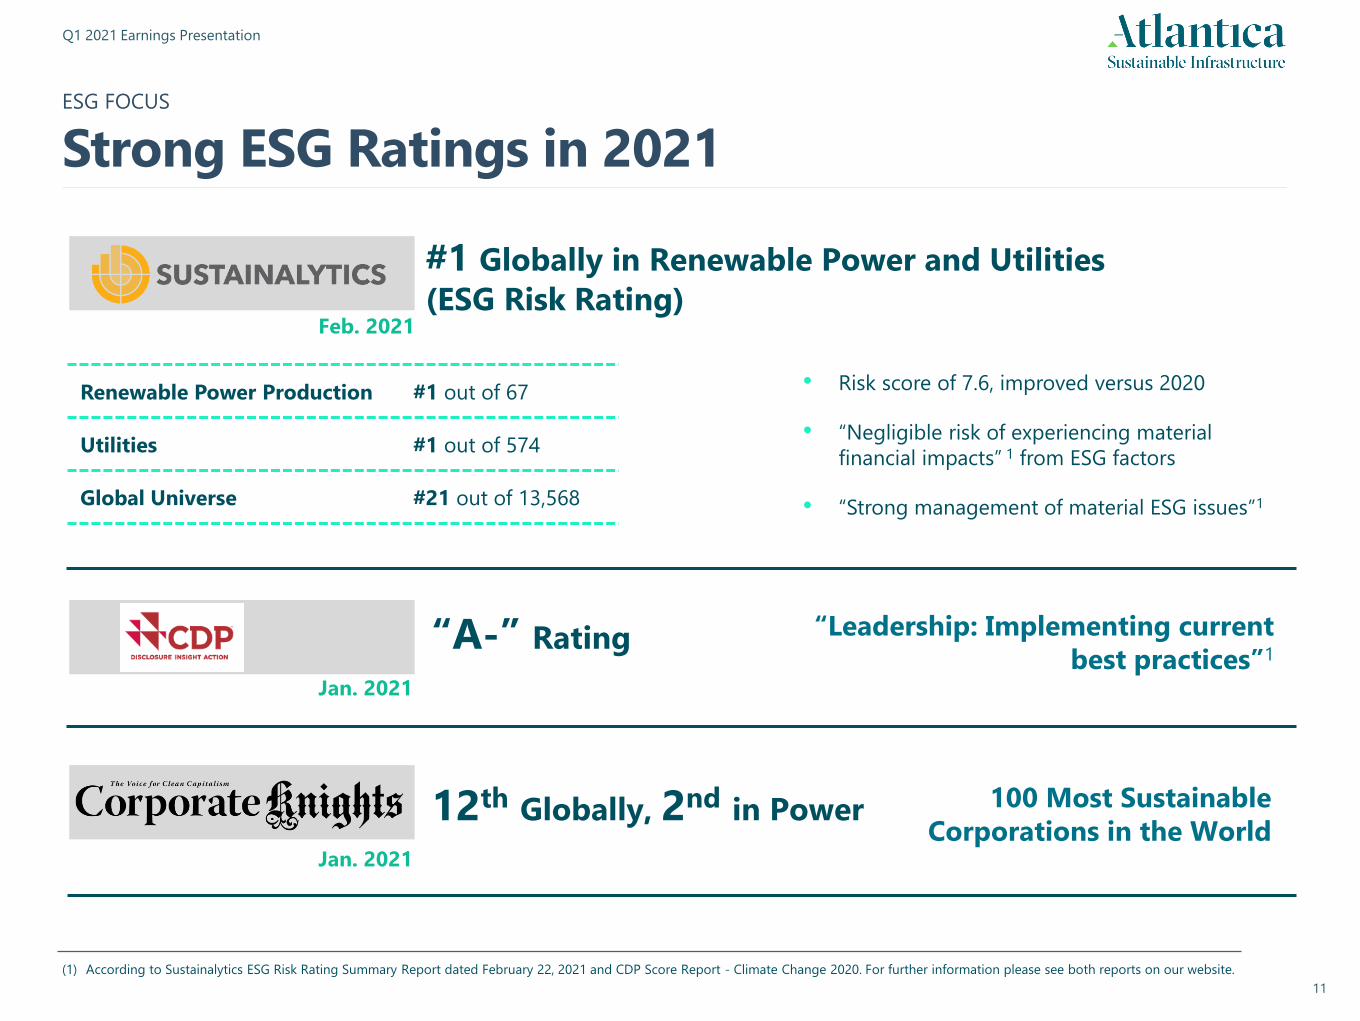
ESG FOCUS
Strong ESG Ratings in 2021
Renewable Power Production #1 out of 67
Utilities #1 out of 574
Global Universe #21 out of 13,568
• Risk score of 7.6, improved versus 2020
• “Negligible risk of experiencing material financial impacts” 1 from ESG factors
• “Strong management of material ESG issues”1
“Leadership: Implementing current best practices”1
#1 Globally in Renewable Power and Utilities (ESG Risk Rating)
“A-” Rating
100 Most Sustainable Corporations in the World
12th Globally, 2nd in Power
(1) According to Sustainalytics ESG Risk Rating Summary Report dated February 22, 2021 and CDP Score Report - Climate Change 2020. For further information please see both reports on our website.
Feb. 2021
Jan. 2021
Jan. 2021
12
Q1 2021 Earnings Presentation
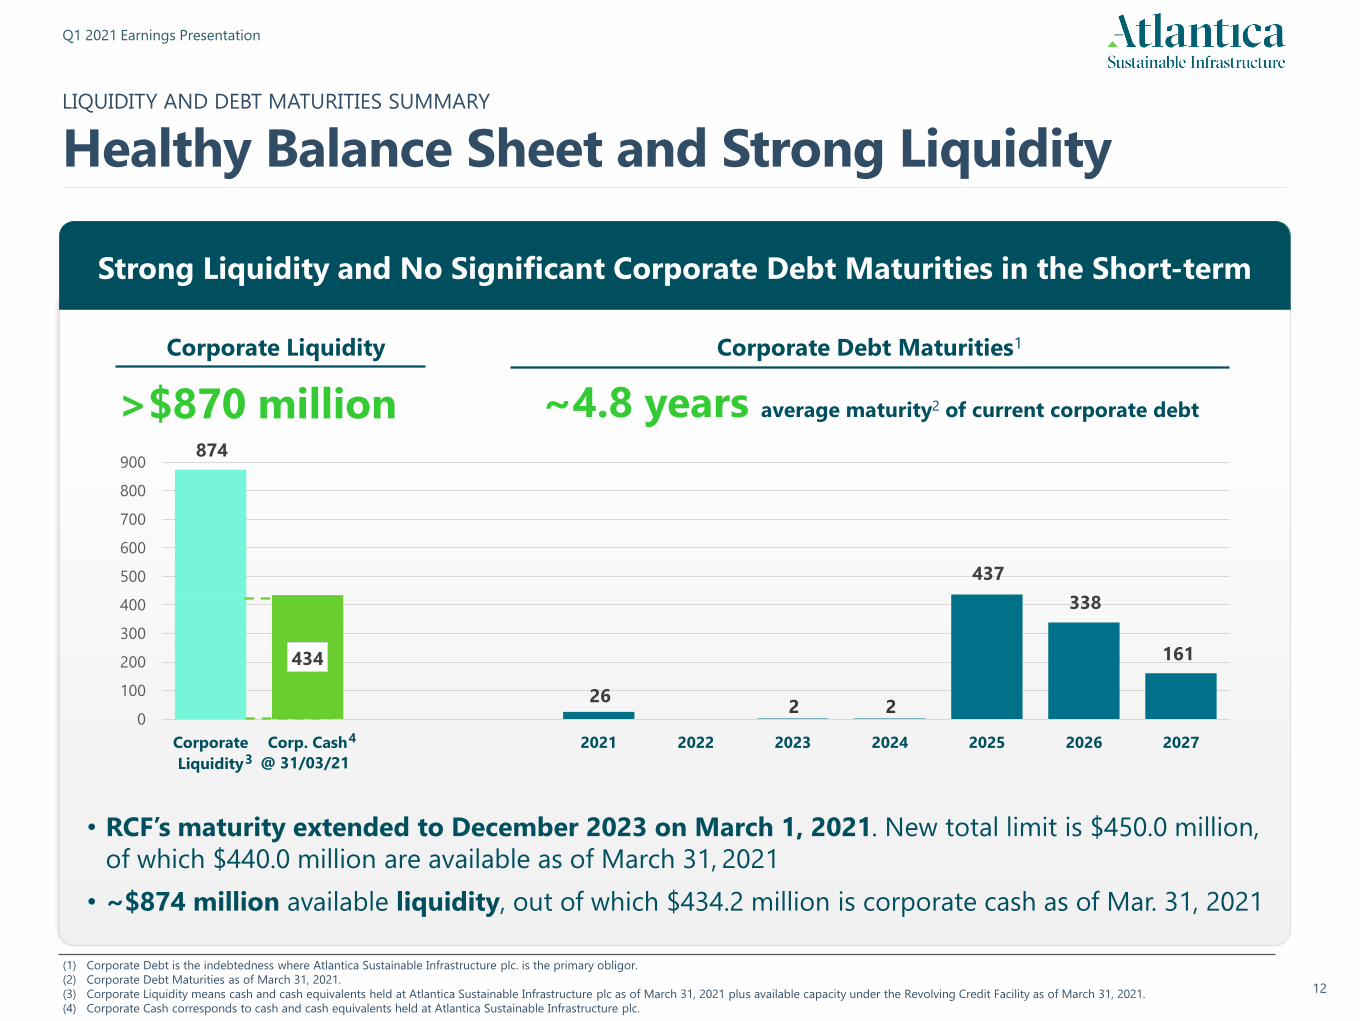
LIQUIDITY AND DEBT MATURITIES SUMMARY
Healthy Balance Sheet and Strong Liquidity
Strong Liquidity and No Significant Corporate Debt Maturities in the Short-term
434
26
437
338
161
874
0
100
200
300
400
500
600
700
800
900
Corporate
Liquidity
Corp. Cash 2021 2022 2023 2024 2025 2026 2027
>$870 million
@ 31/03/21
Corporate Liquidity
~4.8 years average maturity2 of current corporate debt
• RCF’s maturity extended to December 2023 on March 1, 2021. New total limit is $450.0 million, of which $440.0 million are available as of March 31, 2021
• ~$874 million available liquidity, out of which $434.2 million is corporate cash as of Mar. 31, 2021
Corporate Debt Maturities1
(1) Corporate Debt is the indebtedness where Atlantica Sustainable Infrastructure plc. is the primary obligor.(2) Corporate Debt Maturities as of March 31, 2021.(3) Corporate Liquidity means cash and cash equivalents held at Atlantica Sustainable Infrastructure plc as of March 31, 2021 plus available capacity under the Revolving Credit Facility as of March 31, 2021.(4) Corporate Cash corresponds to cash and cash equivalents held at Atlantica Sustainable Infrastructure plc.
2 2
3
4
13
Q1 2021 Earnings Presentation
CORPORATE DEBT DETAILS
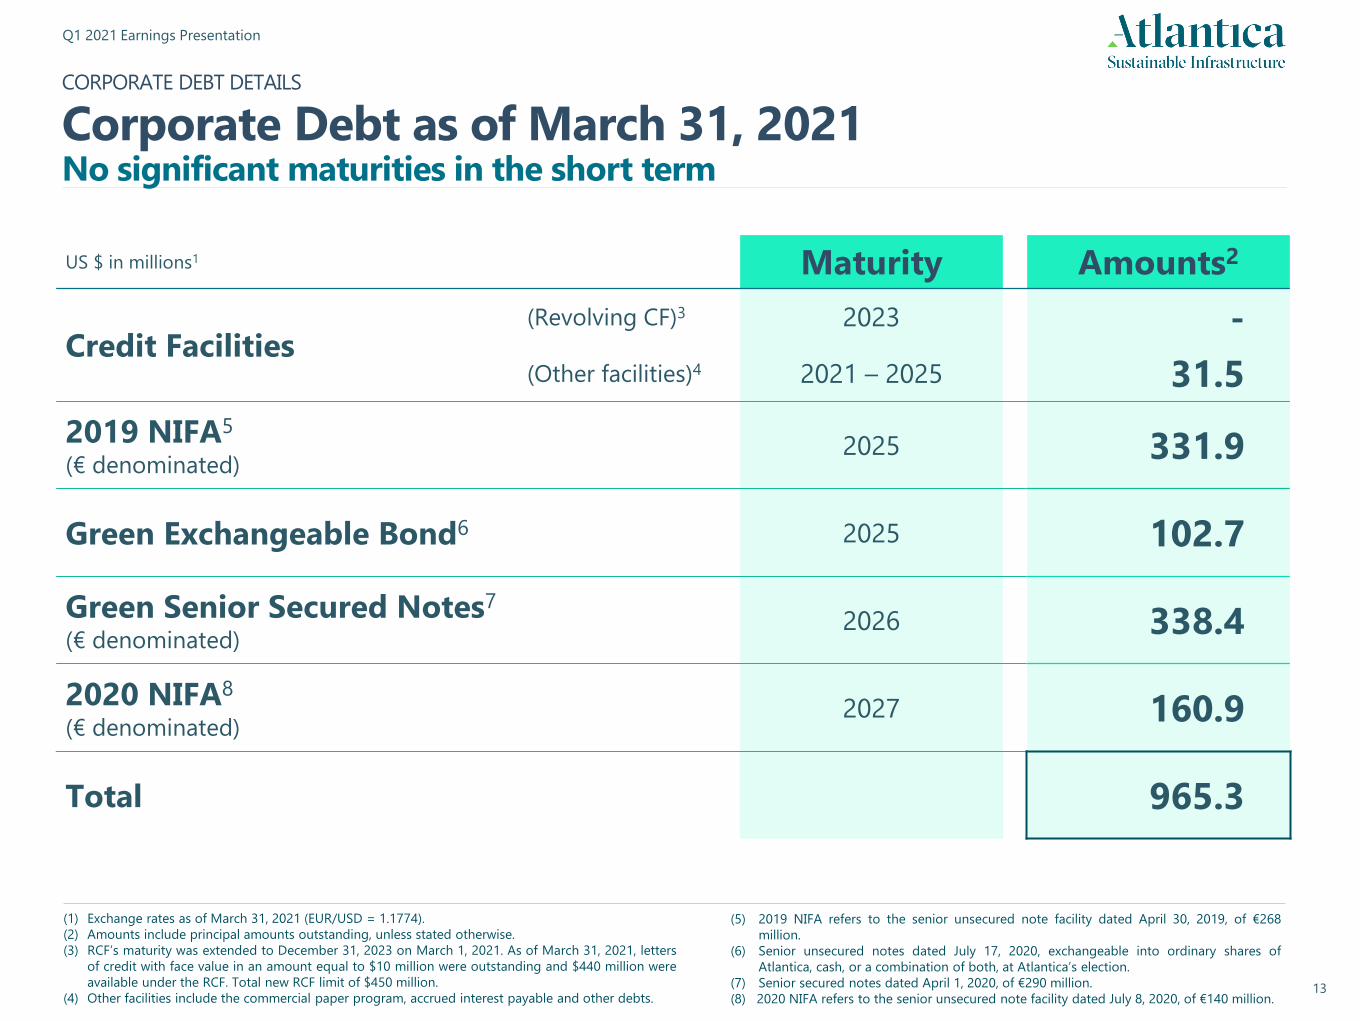
Corporate Debt as of March 31, 2021No significant maturities in the short term
(1) Exchange rates as of March 31, 2021 (EUR/USD = 1.1774).(2) Amounts include principal amounts outstanding, unless stated otherwise.(3) RCF’s maturity was extended to December 31, 2023 on March 1, 2021. As of March 31, 2021, letters
of credit with face value in an amount equal to $10 million were outstanding and $440 million wereavailable under the RCF. Total new RCF limit of $450 million.
(4) Other facilities include the commercial paper program, accrued interest payable and other debts.
US $ in millions1 Maturity Amounts2
Credit Facilities(Revolving CF)3 2023 -
(Other facilities)4 2021 – 2025 31.5
2019 NIFA5
(€ denominated)2025 331.9
Green Exchangeable Bond6 2025 102.7
Green Senior Secured Notes7
(€ denominated)2026 338.4
2020 NIFA8
(€ denominated)2027 160.9
Total 965.3
(5) 2019 NIFA refers to the senior unsecured note facility dated April 30, 2019, of €268million.
(6) Senior unsecured notes dated July 17, 2020, exchangeable into ordinary shares ofAtlantica, cash, or a combination of both, at Atlantica’s election.
(7) Senior secured notes dated April 1, 2020, of €290 million.(8) 2020 NIFA refers to the senior unsecured note facility dated July 8, 2020, of €140 million.
14
Q1 2021 Earnings Presentation
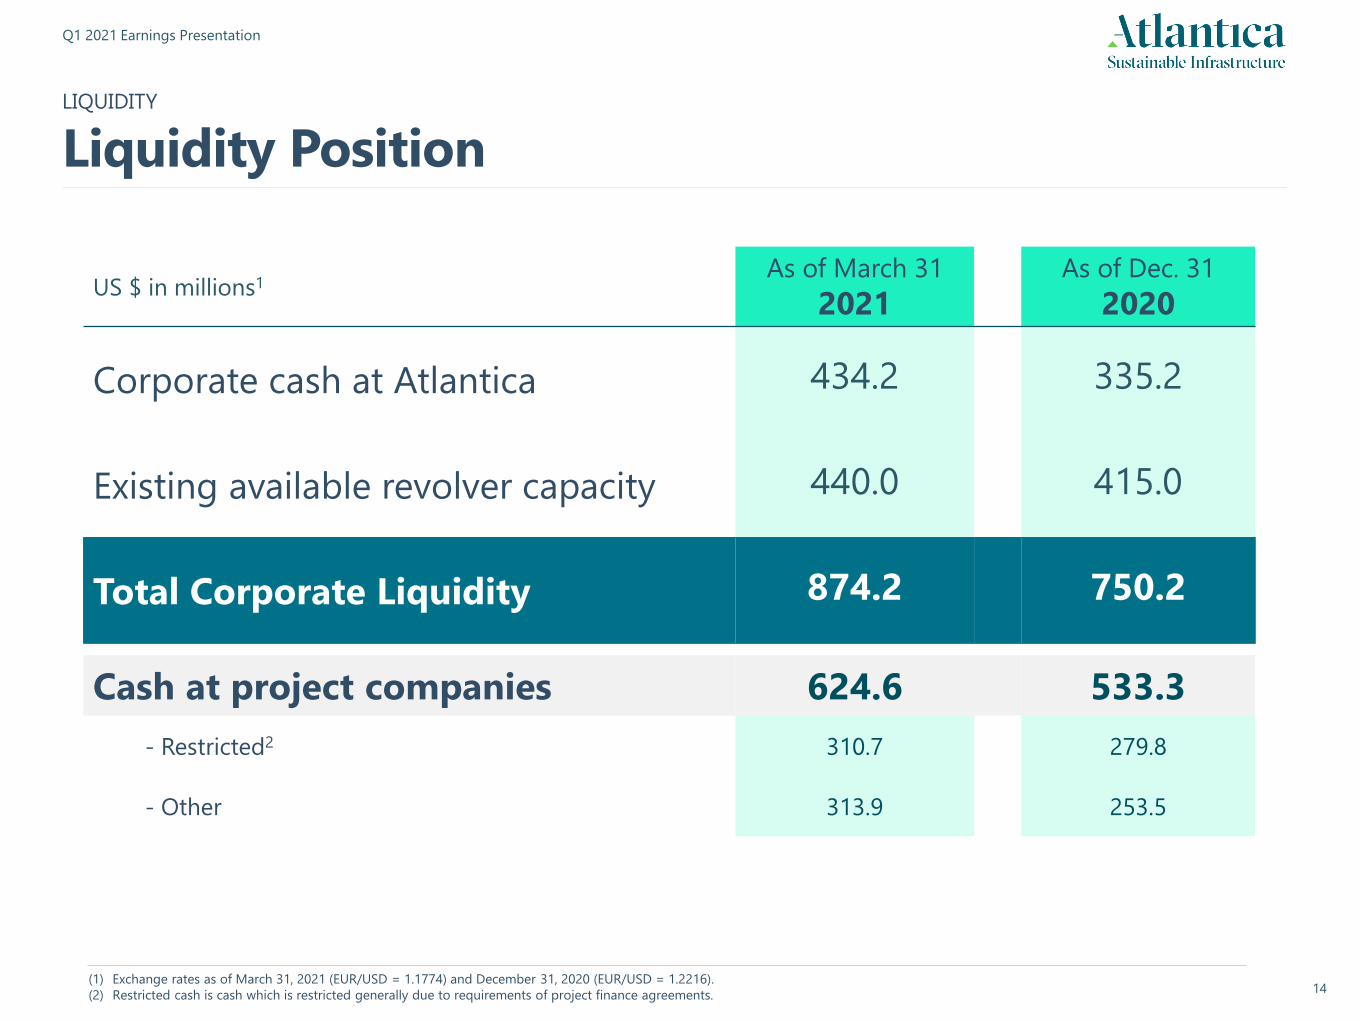
(1) Exchange rates as of March 31, 2021 (EUR/USD = 1.1774) and December 31, 2020 (EUR/USD = 1.2216).(2) Restricted cash is cash which is restricted generally due to requirements of project finance agreements.
US $ in millions1As of March 31
2021As of Dec. 31
2020
Corporate cash at Atlantica 434.2 335.2
Existing available revolver capacity 440.0 415.0
Total Corporate Liquidity 874.2 750.2
Cash at project companies 624.6 533.3
- Restricted2 310.7 279.8
- Other 313.9 253.5
LIQUIDITY
Liquidity Position
15
Q1 2021 Earnings Presentation
Year 21 22 23 24 25 26 27 28 29 30 31 32 33 34 35 36 37 38 39 40 41 42 43 44 45 46 47 48 49
Chile TL3TIRATS
Solana
ATN
Tenes
Mojave
Coso
Solaben 1
Solaben 6
Monterrey
Solaben 2
Solaben 3
Solacor 1TIRSolacor 2TIRHelios 1TIRHelios 2
Palmucho
Honaine
Helioenergy 1
Helioenergy 2
Seville PVTIRMelowind
Solnova 1
Solnova 3TIRSolnova 4TIRKaxuTIRQuadra 1
Quadra 2
Palmatir
CadonalsdsSkikda
PS 20
ATN 2
ACT
PS 10
Mini-Hydro
# OF YEARS 1 2 3 4 5 6 7 8 9 10 11 12 13 14 15 16 17 18 19 20 21 22 23 24 25 26 27 28 29
35
37
35
35
4341
39
38
3737
3737
373737
36
35
353434
3433
33
34
4449
36
35
3536
383838
40
3232
3939
Weighted Average Life
Project debt term
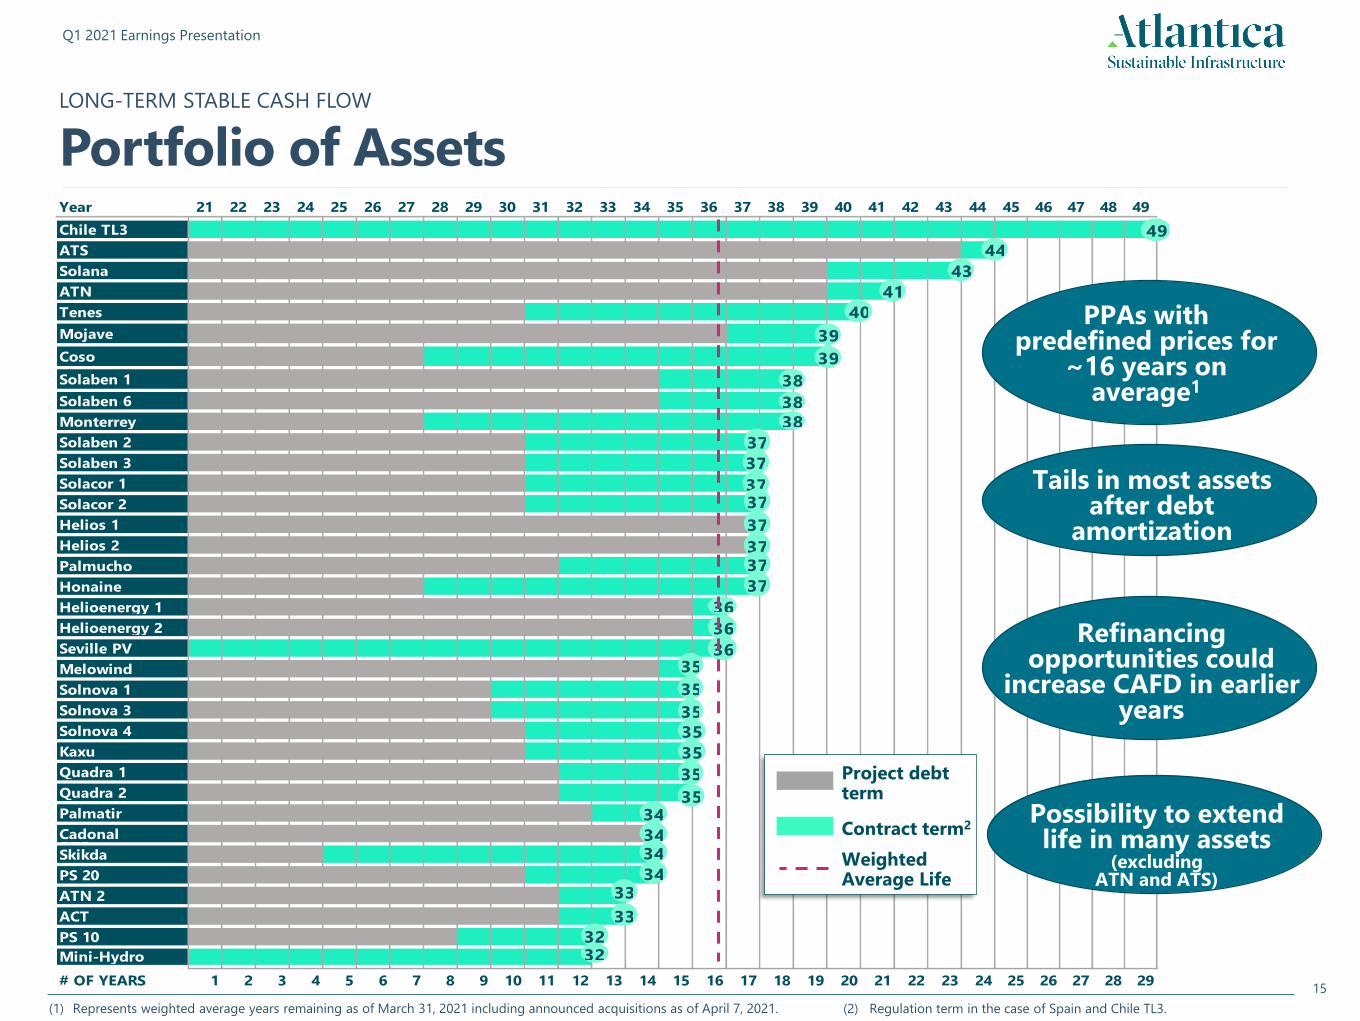
(2) Regulation term in the case of Spain and Chile TL3.
PPAs with predefined prices for
~16 years on average1
Refinancing opportunities could
increase CAFD in earlier years
Possibility to extend life in many assets
(excluding ATN and ATS)
Tails in most assets after debt
amortization
Contract term2
LONG-TERM STABLE CASH FLOW
Portfolio of Assets
(1) Represents weighted average years remaining as of March 31, 2021 including announced acquisitions as of April 7, 2021.
16
Q1 2021 Earnings Presentation
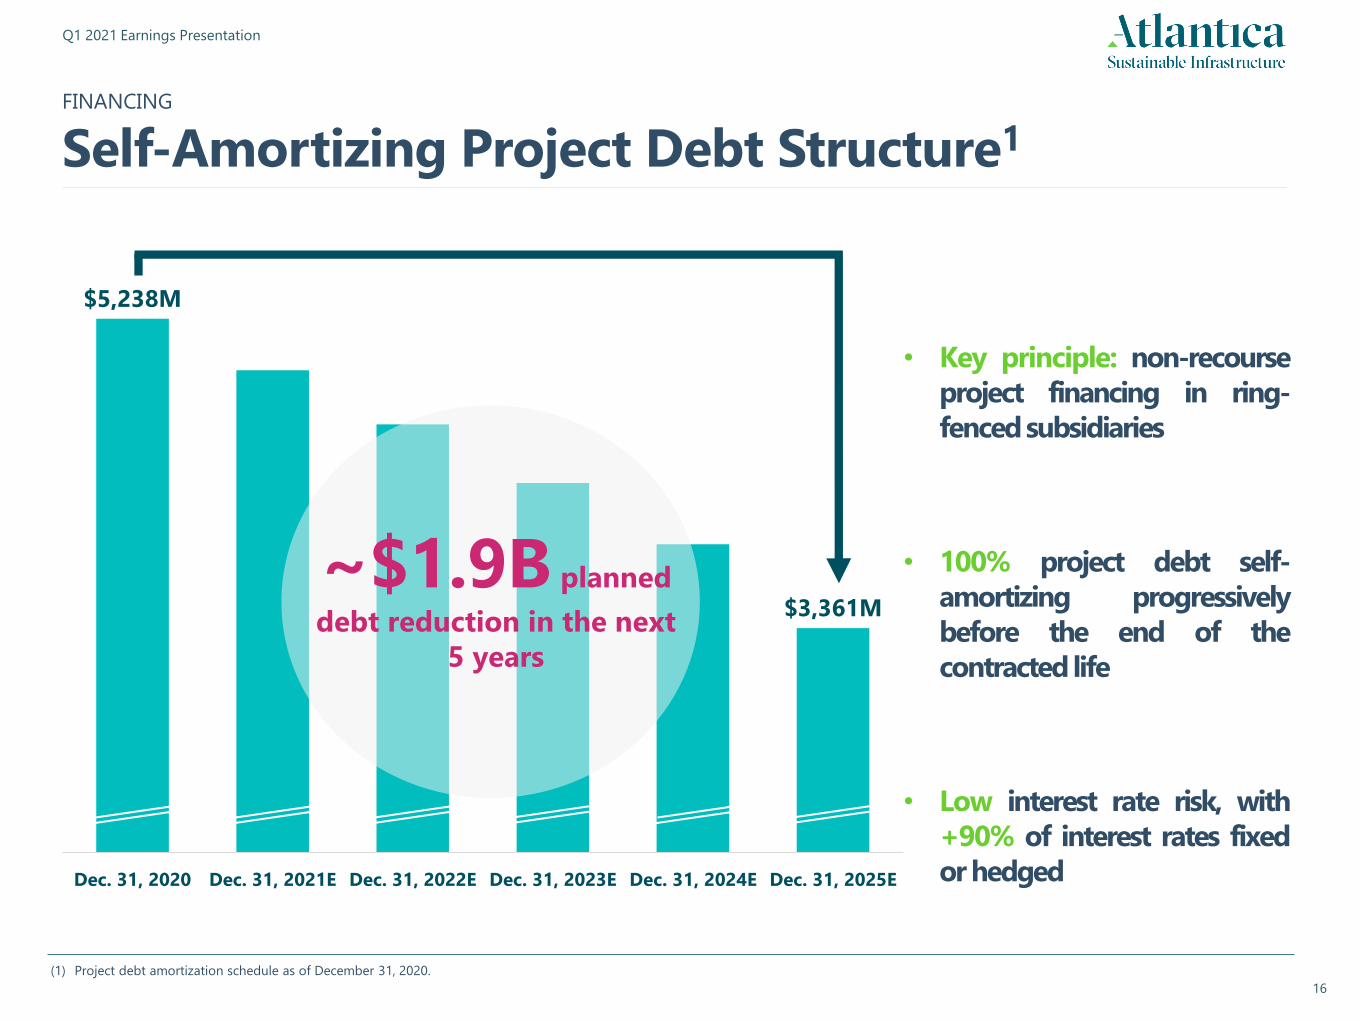
$5,238M
$3,361M
Dec. 31, 2020 Dec. 31, 2021E Dec. 31, 2022E Dec. 31, 2023E Dec. 31, 2024E Dec. 31, 2025E
• Key principle: non-recourseproject financing in ring-fencedsubsidiaries
• 100% project debt self-amortizing progressivelybefore the end of thecontractedlife
• Low interest rate risk, with+90% of interest rates fixedor hedged
~$1.9B planned
debt reduction in the next 5 years
FINANCING
Self-Amortizing Project Debt Structure1
(1) Project debt amortization schedule as of December 31, 2020.
17
Q1 2021 Earnings Presentation
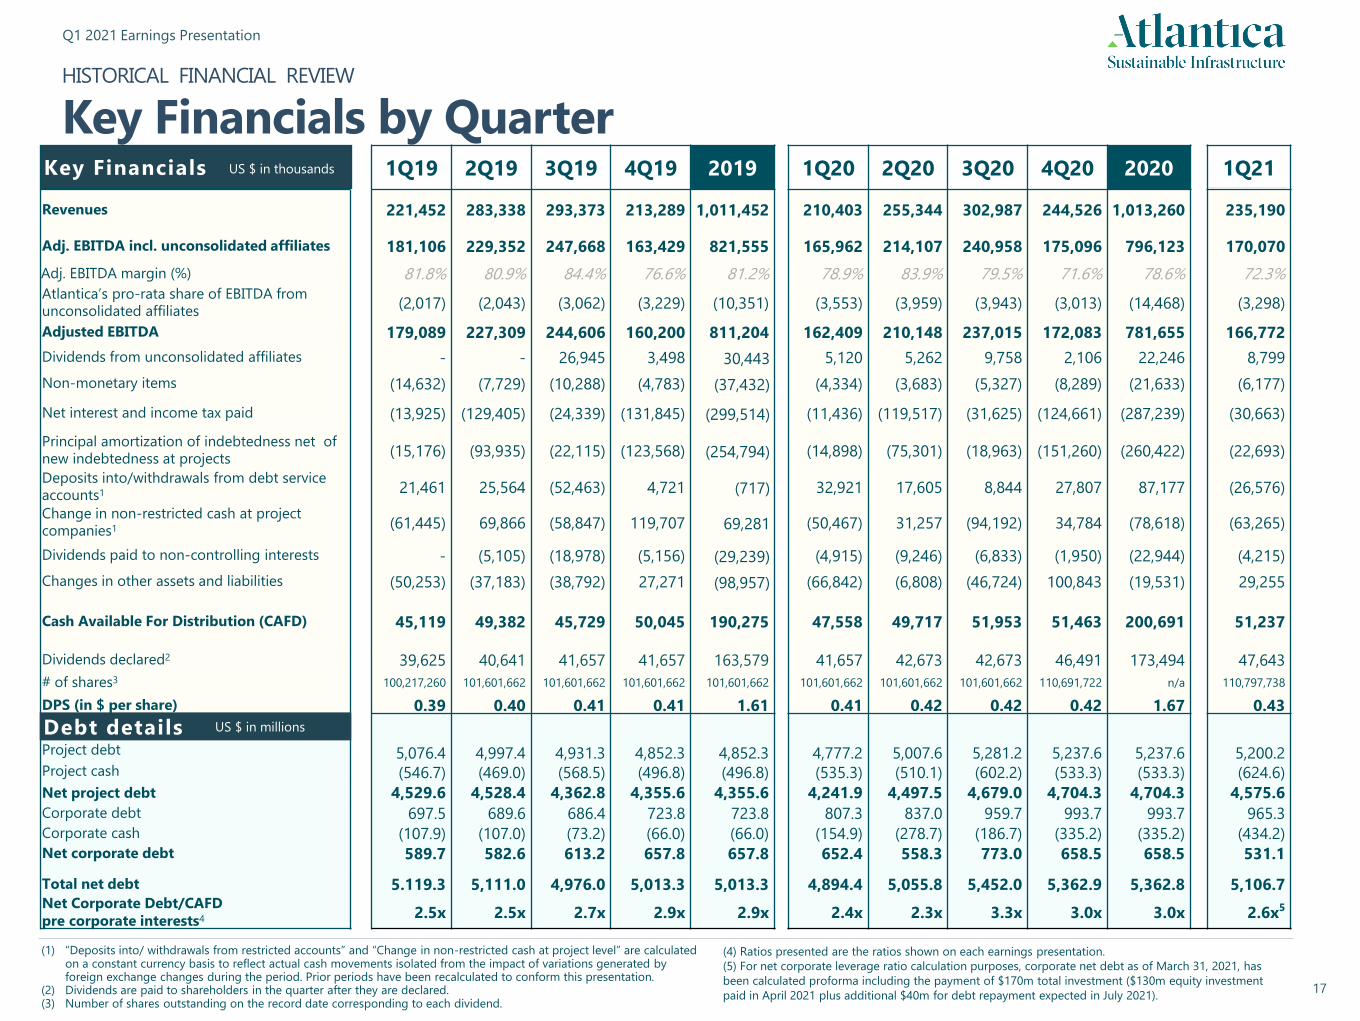
1Q19 2Q19 3Q19 4Q19 2019 1Q20 2Q20 3Q20 4Q20 2020 1Q21
Revenues 221,452 283,338 293,373 213,289 1,011,452 210,403 255,344 302,987 244,526 1,013,260 235,190
Adj. EBITDA incl. unconsolidated affiliates 181,106 229,352 247,668 163,429 821,555 165,962 214,107 240,958 175,096 796,123 170,070
Adj. EBITDA margin (%) 81.8% 80.9% 84.4% 76.6% 81.2% 78.9% 83.9% 79.5% 71.6% 78.6% 72.3%Atlantica’s pro-rata share of EBITDA from unconsolidated affiliates (2,017) (2,043) (3,062) (3,229) (10,351) (3,553) (3,959) (3,943) (3,013) (14,468) (3,298)
Adjusted EBITDA 179,089 227,309 244,606 160,200 811,204 162,409 210,148 237,015 172,083 781,655 166,772
Dividends from unconsolidated affiliates - - 26,945 3,498 30,443 5,120 5,262 9,758 2,106 22,246 8,799
Non-monetary items (14,632) (7,729) (10,288) (4,783) (37,432) (4,334) (3,683) (5,327) (8,289) (21,633) (6,177)
Net interest and income tax paid (13,925) (129,405) (24,339) (131,845) (299,514) (11,436) (119,517) (31,625) (124,661) (287,239) (30,663)
Principal amortization of indebtedness net of new indebtedness at projects (15,176) (93,935) (22,115) (123,568) (254,794) (14,898) (75,301) (18,963) (151,260) (260,422) (22,693)
Deposits into/withdrawals from debt service accounts1 21,461 25,564 (52,463) 4,721 (717) 32,921 17,605 8,844 27,807 87,177 (26,576)
Change in non-restricted cash at project companies1 (61,445) 69,866 (58,847) 119,707 69,281 (50,467) 31,257 (94,192) 34,784 (78,618) (63,265)
Dividends paid to non-controlling interests - (5,105) (18,978) (5,156) (29,239) (4,915) (9,246) (6,833) (1,950) (22,944) (4,215)
Changes in other assets and liabilities (50,253) (37,183) (38,792) 27,271 (98,957) (66,842) (6,808) (46,724) 100,843 (19,531) 29,255
Cash Available For Distribution (CAFD) 45,119 49,382 45,729 50,045 190,275 47,558 49,717 51,953 51,463 200,691 51,237
Dividends declared2 39,625 40,641 41,657 41,657 163,579 41,657 42,673 42,673 46,491 173,494 47,643
# of shares3 100,217,260 101,601,662 101,601,662 101,601,662 101,601,662 101,601,662 101,601,662 101,601,662 110,691,722 n/a 110,797,738
DPS (in $ per share) 0.39 0.40 0.41 0.41 1.61 0.41 0.42 0.42 0.42 1.67 0.43
Project debt 5,076.4 4,997.4 4,931.3 4,852.3 4,852.3 4,777.2 5,007.6 5,281.2 5,237.6 5,237.6 5,200.2Project cash (546.7) (469.0) (568.5) (496.8) (496.8) (535.3) (510.1) (602.2) (533.3) (533.3) (624.6)Net project debt 4,529.6 4,528.4 4,362.8 4,355.6 4,355.6 4,241.9 4,497.5 4,679.0 4,704.3 4,704.3 4,575.6Corporate debt 697.5 689.6 686.4 723.8 723.8 807.3 837.0 959.7 993.7 993.7 965.3Corporate cash (107.9) (107.0) (73.2) (66.0) (66.0) (154.9) (278.7) (186.7) (335.2) (335.2) (434.2)Net corporate debt 589.7 582.6 613.2 657.8 657.8 652.4 558.3 773.0 658.5 658.5 531.1
Total net debt 5.119.3 5,111.0 4,976.0 5,013.3 5,013.3 4,894.4 5,055.8 5,452.0 5,362.9 5,362.8 5,106.7Net Corporate Debt/CAFD pre corporate interests4 2.5x 2.5x 2.7x 2.9x 2.9x 2.4x 2.3x 3.3x 3.0x 3.0x 2.6x5
HISTORICAL FINANCIAL REVIEW
Key Financials by Quarter
Debt details
Key Financials US $ in thousands
(1) “Deposits into/ withdrawals from restricted accounts” and “Change in non-restricted cash at project level” are calculated on a constant currency basis to reflect actual cash movements isolated from the impact of variations generated by foreign exchange changes during the period. Prior periods have been recalculated to conform this presentation.
(2) Dividends are paid to shareholders in the quarter after they are declared.(3) Number of shares outstanding on the record date corresponding to each dividend.
US $ in millions
(4) Ratios presented are the ratios shown on each earnings presentation.(5) For net corporate leverage ratio calculation purposes, corporate net debt as of March 31, 2021, has been calculated proforma including the payment of $170m total investment ($130m equity investment paid in April 2021 plus additional $40m for debt repayment expected in July 2021).
18
Q1 2021 Earnings Presentation
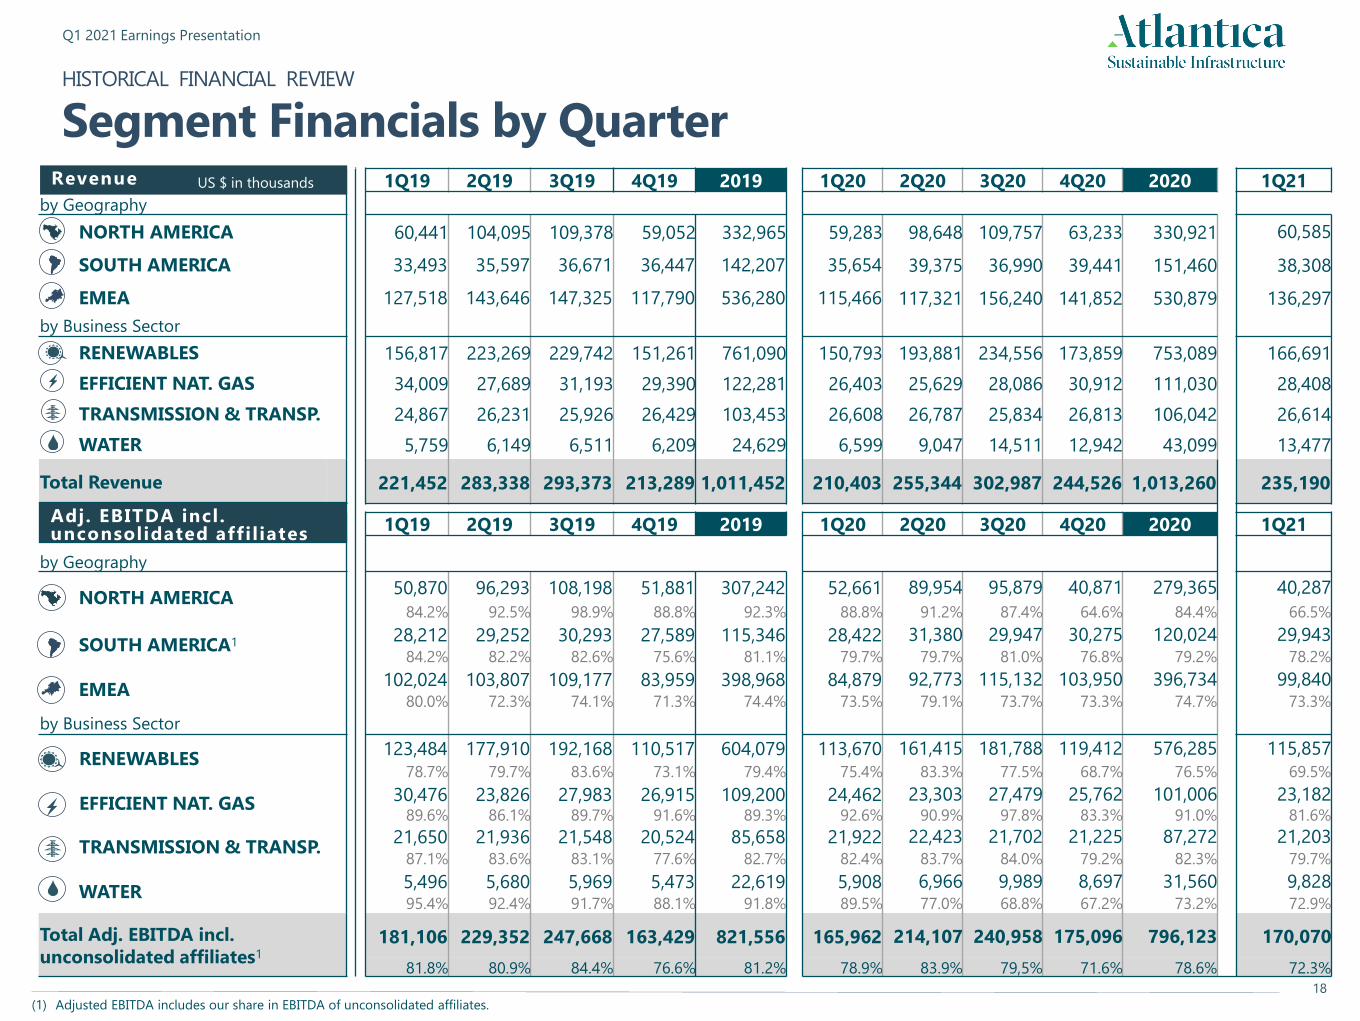
HISTORICAL FINANCIAL REVIEW
Segment Financials by Quarter2 1Q19 2Q19 3Q19 4Q19 2019 1Q20 2Q20 3Q20 4Q20 2020 1Q21
by Geography
NORTH AMERICA 60,441 104,095 109,378 59,052 332,965 59,283 98,648 109,757 63,233 330,921 60,585
SOUTH AMERICA 33,493 35,597 36,671 36,447 142,207 35,654 39,375 36,990 39,441 151,460 38,308
EMEA 127,518 143,646 147,325 117,790 536,280 115,466 117,321 156,240 141,852 530,879 136,297
by Business Sector
RENEWABLES 156,817 223,269 229,742 151,261 761,090 150,793 193,881 234,556 173,859 753,089 166,691
EFFICIENT NAT. GAS 34,009 27,689 31,193 29,390 122,281 26,403 25,629 28,086 30,912 111,030 28,408
TRANSMISSION & TRANSP. 24,867 26,231 25,926 26,429 103,453 26,608 26,787 25,834 26,813 106,042 26,614
WATER 5,759 6,149 6,511 6,209 24,629 6,599 9,047 14,511 12,942 43,099 13,477
Total Revenue 221,452 283,338 293,373 213,289 1,011,452 210,403 255,344 302,987 244,526 1,013,260 235,190
1Q19 2Q19 3Q19 4Q19 2019 1Q20 2Q20 3Q20 4Q20 2020 1Q21
by Geography
NORTH AMERICA50,870 96,293 108,198 51,881 307,242 52,661 89,954 95,879 40,871 279,365 40,287
84.2% 92.5% 98.9% 88.8% 92.3% 88.8% 91.2% 87.4% 64.6% 84.4% 66.5%
SOUTH AMERICA1 28,212 29,252 30,293 27,589 115,346 28,422 31,380 29,947 30,275 120,024 29,94384.2% 82.2% 82.6% 75.6% 81.1% 79.7% 79.7% 81.0% 76.8% 79.2% 78.2%
EMEA102,024 103,807 109,177 83,959 398,968 84,879 92,773 115,132 103,950 396,734 99,840
80.0% 72.3% 74.1% 71.3% 74.4% 73.5% 79.1% 73.7% 73.3% 74.7% 73.3%
by Business Sector
RENEWABLES123,484 177,910 192,168 110,517 604,079 113,670 161,415 181,788 119,412 576,285 115,857
78.7% 79.7% 83.6% 73.1% 79.4% 75.4% 83.3% 77.5% 68.7% 76.5% 69.5%
EFFICIENT NAT. GAS 30,476 23,826 27,983 26,915 109,200 24,462 23,303 27,479 25,762 101,006 23,18289.6% 86.1% 89.7% 91.6% 89.3% 92.6% 90.9% 97.8% 83.3% 91.0% 81.6%
TRANSMISSION & TRANSP.21,650 21,936 21,548 20,524 85,658 21,922 22,423 21,702 21,225 87,272 21,203
87.1% 83.6% 83.1% 77.6% 82.7% 82.4% 83.7% 84.0% 79.2% 82.3% 79.7%
WATER5,496 5,680 5,969 5,473 22,619 5,908 6,966 9,989 8,697 31,560 9,82895.4% 92.4% 91.7% 88.1% 91.8% 89.5% 77.0% 68.8% 67.2% 73.2% 72.9%
Total Adj. EBITDA incl. unconsolidated affiliates1
181,106 229,352 247,668 163,429 821,556 165,962 214,107 240,958 175,096 796,123 170,070
81.8% 80.9% 84.4% 76.6% 81.2% 78.9% 83.9% 79,5% 71.6% 78.6% 72.3%
Revenue
Adj. EBITDA incl. unconsolidated affil iates
(1) Adjusted EBITDA includes our share in EBITDA of unconsolidated affiliates.
US $ in thousands
19
Q1 2021 Earnings Presentation
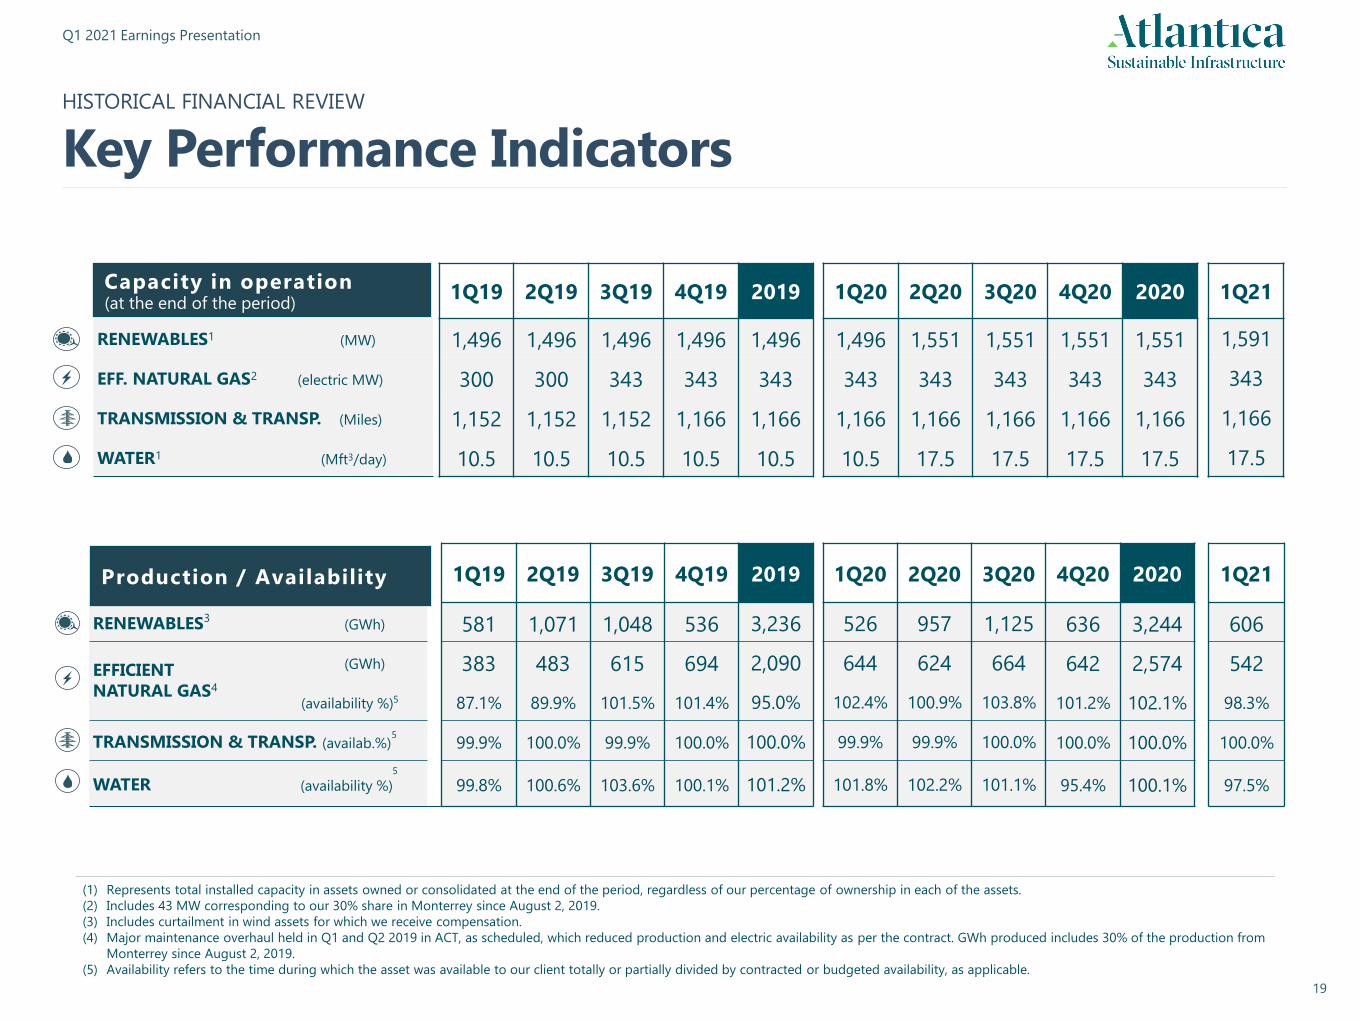
1Q19 2Q19 3Q19 4Q19 2019 1Q20 2Q20 3Q20 4Q20 2020 1Q21
RENEWABLES3(GWh) 581 1,071 1,048 536 3,236 526 957 1,125 636 3,244 606
(GWh) 383 483 615 694 2,090 644 624 664 642 2,574 542
(availability %) 87.1% 89.9% 101.5% 101.4% 95.0% 102.4% 100.9% 103.8% 101.2% 102.1% 98.3%
TRANSMISSION & TRANSP. (availab.%) 99.9% 100.0% 99.9% 100.0% 100.0% 99.9% 99.9% 100.0% 100.0% 100.0% 100.0%
WATER (availability %) 99.8% 100.6% 103.6% 100.1% 101.2% 101.8% 102.2% 101.1% 95.4% 100.1% 97.5%
1Q19 2Q19 3Q19 4Q19 2019 1Q20 2Q20 3Q20 4Q20 2020 1Q21
RENEWABLES1 (MW) 1,496 1,496 1,496 1,496 1,496 1,496 1,551 1,551 1,551 1,551 1,591
EFF. NATURAL GAS2 (electric MW) 300 300 343 343 343 343 343 343 343 343 343
TRANSMISSION & TRANSP. (Miles) 1,152 1,152 1,152 1,166 1,166 1,166 1,166 1,166 1,166 1,166 1,166
WATER1 (Mft3/day) 10.5 10.5 10.5 10.5 10.5 10.5 17.5 17.5 17.5 17.5 17.5
Capacity in operation(at the end of the period)
Production / Availability
5
5
5
(1) Represents total installed capacity in assets owned or consolidated at the end of the period, regardless of our percentage of ownership in each of the assets.(2) Includes 43 MW corresponding to our 30% share in Monterrey since August 2, 2019.(3) Includes curtailment in wind assets for which we receive compensation.(4) Major maintenance overhaul held in Q1 and Q2 2019 in ACT, as scheduled, which reduced production and electric availability as per the contract. GWh produced includes 30% of the production from
Monterrey since August 2, 2019.(5) Availability refers to the time during which the asset was available to our client totally or partially divided by contracted or budgeted availability, as applicable.
EFFICIENT NATURAL GAS4
HISTORICAL FINANCIAL REVIEW
Key Performance Indicators
20
Q1 2021 Earnings Presentation
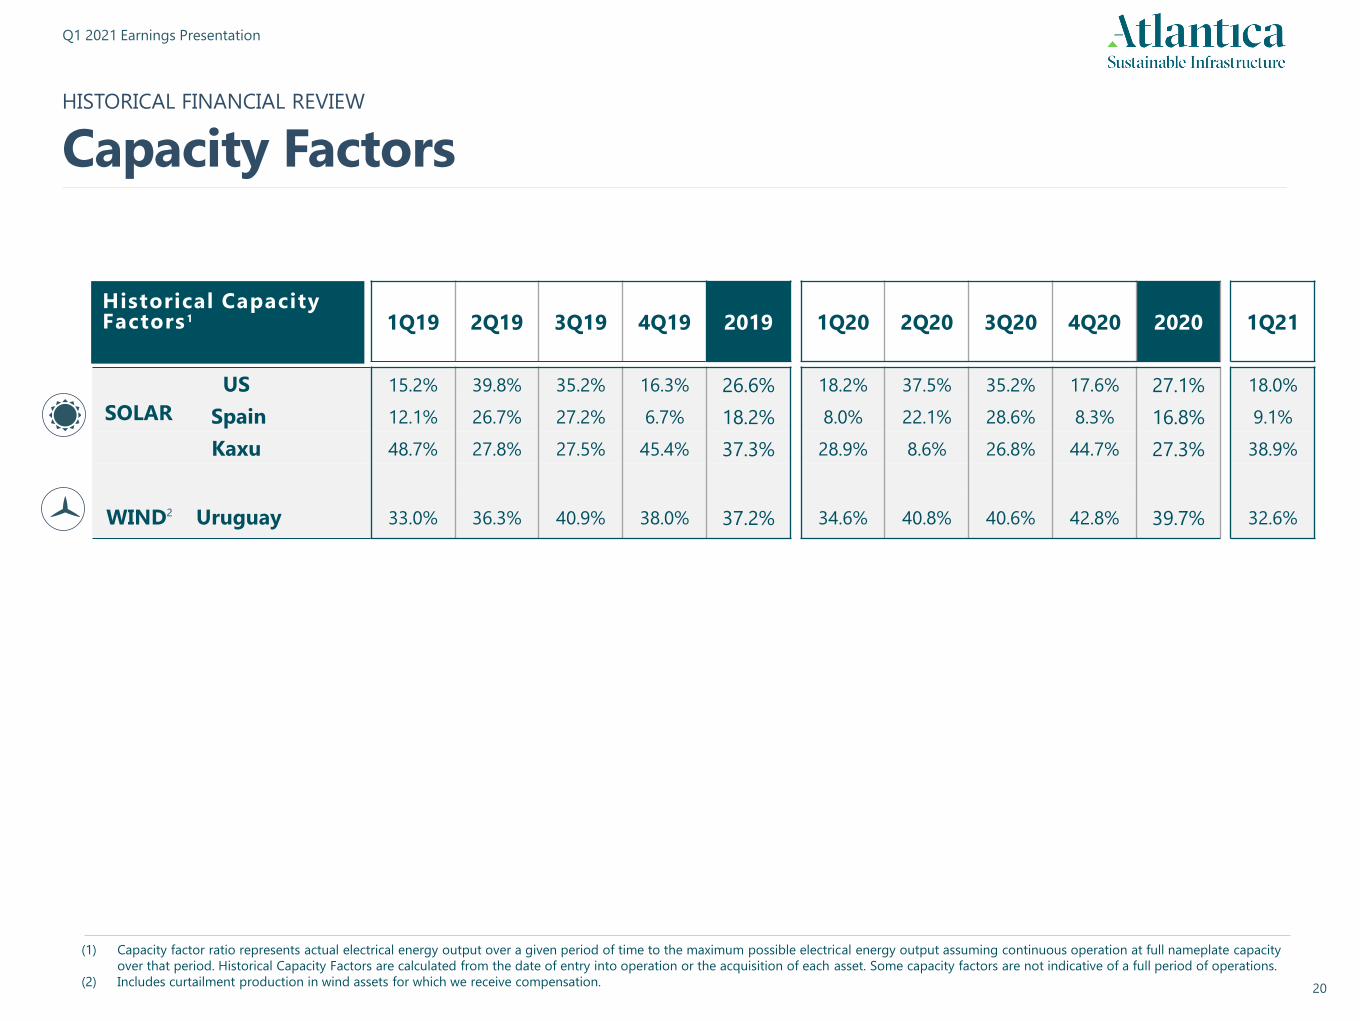
1Q19 2Q19 3Q19 4Q19 2019 1Q20 2Q20 3Q20 4Q20 2020 1Q21
US 15.2% 39.8% 35.2% 16.3% 26.6% 18.2% 37.5% 35.2% 17.6% 27.1% 18.0%
Spain 12.1% 26.7% 27.2% 6.7% 18.2% 8.0% 22.1% 28.6% 8.3% 16.8% 9.1%
Kaxu 48.7% 27.8% 27.5% 45.4% 37.3% 28.9% 8.6% 26.8% 44.7% 27.3% 38.9%
WIND2 Uruguay 33.0% 36.3% 40.9% 38.0% 37.2% 34.6% 40.8% 40.6% 42.8% 39.7% 32.6%
SOLAR
Historical Capacity Factors 1
(1) Capacity factor ratio represents actual electrical energy output over a given period of time to the maximum possible electrical energy output assuming continuous operation at full nameplate capacity over that period. Historical Capacity Factors are calculated from the date of entry into operation or the acquisition of each asset. Some capacity factors are not indicative of a full period of operations.
(2) Includes curtailment production in wind assets for which we receive compensation.
HISTORICAL FINANCIAL REVIEW
Capacity Factors
21
Q1 2021 Earnings Presentation
CURRENCY2 SECTOR
GEOGRAPHY
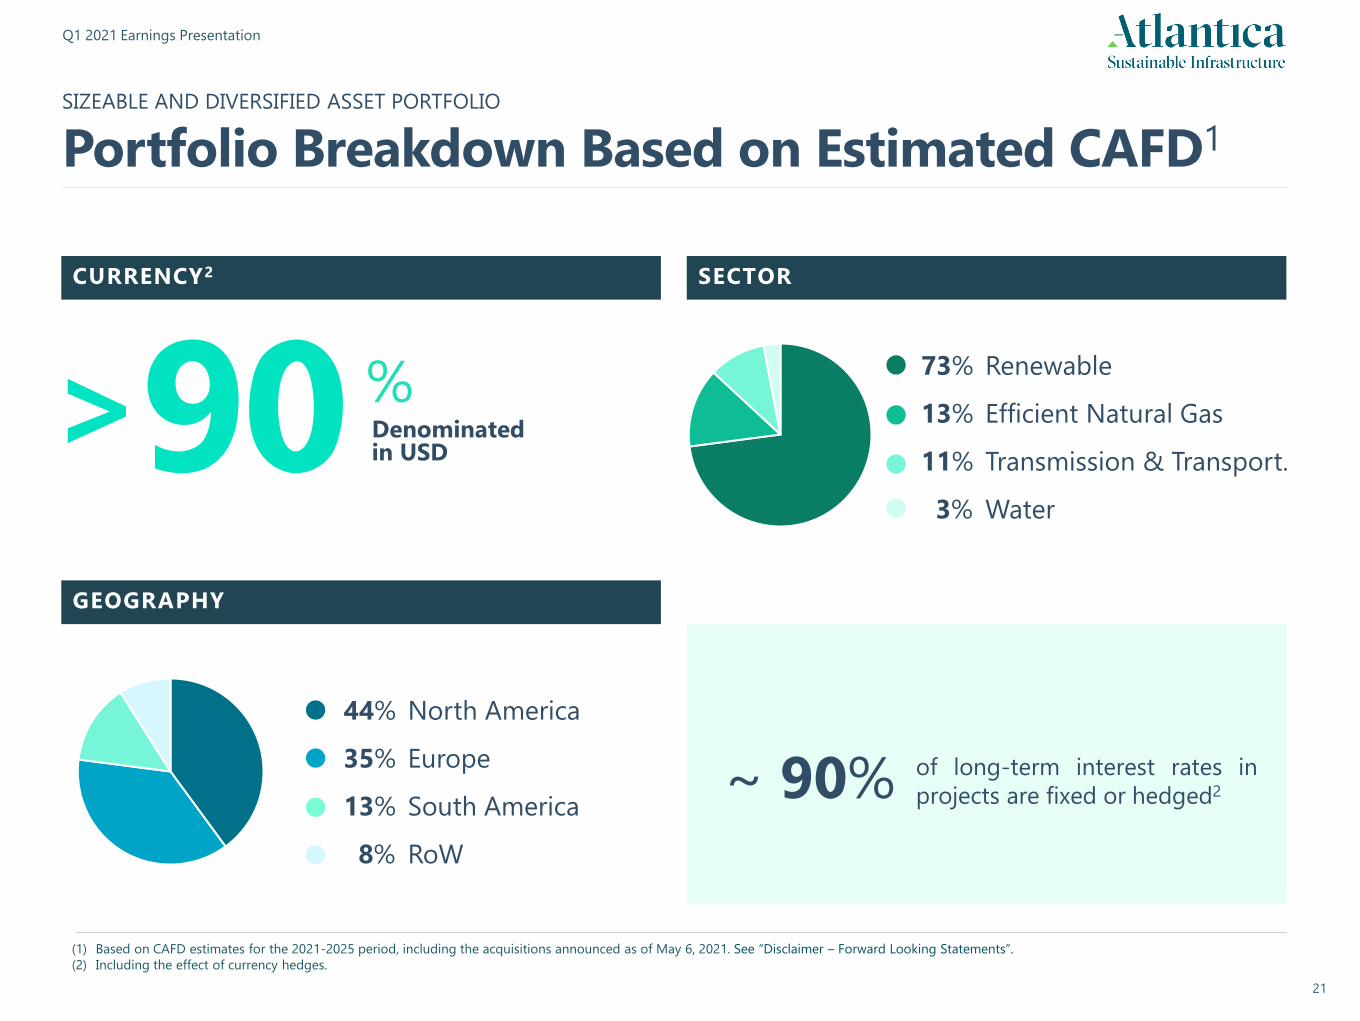
(1) Based on CAFD estimates for the 2021-2025 period, including the acquisitions announced as of May 6, 2021. See “Disclaimer – Forward Looking Statements”.(2) Including the effect of currency hedges.
of long-term interest rates inprojects are fixed or hedged2~ 90%
90 Denominatedin USD
%>• 73% Renewable
• 13% Efficient Natural Gas
• 11% Transmission & Transport.
• 3% Water
• 44% North America
• 35% Europe
• 13% South America
• 8% RoW
SIZEABLE AND DIVERSIFIED ASSET PORTFOLIO
Portfolio Breakdown Based on Estimated CAFD1
22
Q1 2021 Earnings Presentation
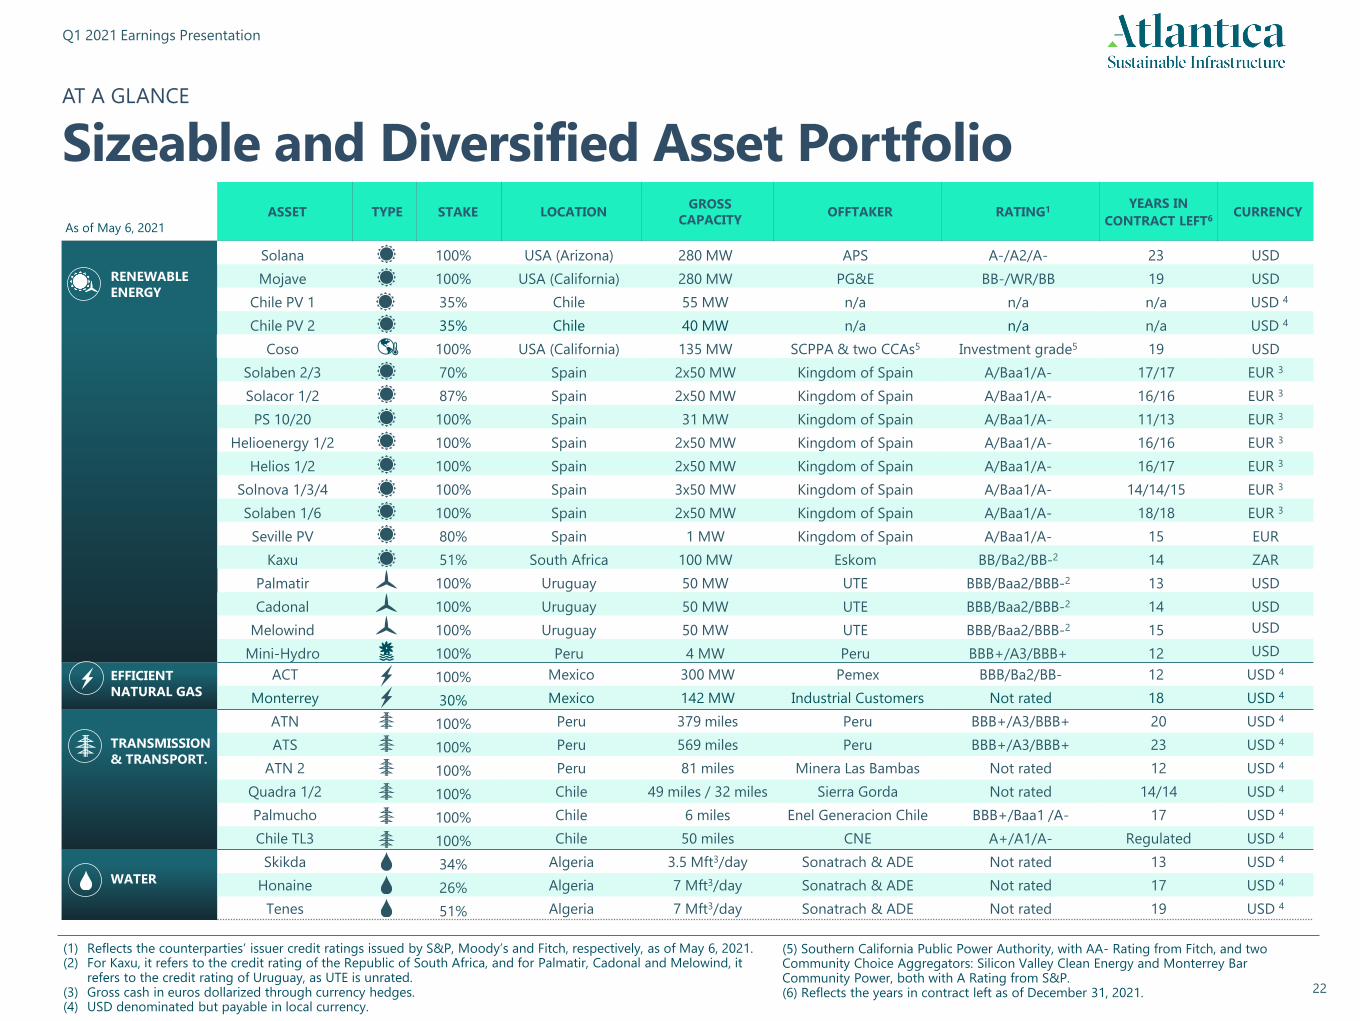
As of May 6, 2021 ASSET TYPE STAKE LOCATION
GROSSCAPACITY
OFFTAKER RATING1YEARS IN
CONTRACT LEFT6CURRENCY
RENEWABLEENERGY
Solana 100% USA (Arizona) 280 MW APS A-/A2/A- 23 USD
Mojave 100% USA (California) 280 MW PG&E BB-/WR/BB 19 USD
Chile PV 1 35% Chile 55 MW n/a n/a n/a USD 4
Chile PV 2 35% Chile 40 MW n/a n/a n/a USD 4
Coso 100% USA (California) 135 MW SCPPA & two CCAs5 Investment grade5 19 USD
Solaben 2/3 70% Spain 2x50 MW Kingdom of Spain A/Baa1/A- 17/17 EUR 3
Solacor 1/2 87% Spain 2x50 MW Kingdom of Spain A/Baa1/A- 16/16 EUR 3
PS 10/20 100% Spain 31 MW Kingdom of Spain A/Baa1/A- 11/13 EUR 3
Helioenergy 1/2 100% Spain 2x50 MW Kingdom of Spain A/Baa1/A- 16/16 EUR 3
Helios 1/2 100% Spain 2x50 MW Kingdom of Spain A/Baa1/A- 16/17 EUR 3
Solnova 1/3/4 100% Spain 3x50 MW Kingdom of Spain A/Baa1/A- 14/14/15 EUR 3
Solaben 1/6 100% Spain 2x50 MW Kingdom of Spain A/Baa1/A- 18/18 EUR 3
Seville PV 80% Spain 1 MW Kingdom of Spain A/Baa1/A- 15 EUR
Kaxu 51% South Africa 100 MW Eskom BB/Ba2/BB-2 14 ZAR
Palmatir 100% Uruguay 50 MW UTE BBB/Baa2/BBB-2 13 USD
Cadonal 100% Uruguay 50 MW UTE BBB/Baa2/BBB-2 14 USD
Melowind 100% Uruguay 50 MW UTE BBB/Baa2/BBB-2 15 USD
Mini-Hydro 100% Peru 4 MW Peru BBB+/A3/BBB+ 12 USD
EFFICIENT NATURAL GAS
ACT 100% Mexico 300 MW Pemex BBB/Ba2/BB- 12 USD 4
Monterrey 30% Mexico 142 MW Industrial Customers Not rated 18 USD 4
TRANSMISSION & TRANSPORT.
ATN 100% Peru 379 miles Peru BBB+/A3/BBB+ 20 USD 4
ATS 100% Peru 569 miles Peru BBB+/A3/BBB+ 23 USD 4
ATN 2 100% Peru 81 miles Minera Las Bambas Not rated 12 USD 4
Quadra 1/2 100% Chile 49 miles / 32 miles Sierra Gorda Not rated 14/14 USD 4
Palmucho 100% Chile 6 miles Enel Generacion Chile BBB+/Baa1 /A- 17 USD 4
Chile TL3 100% Chile 50 miles CNE A+/A1/A- Regulated USD 4
WATERSkikda 34% Algeria 3.5 Mft3/day Sonatrach & ADE Not rated 13 USD 4
Honaine 26% Algeria 7 Mft3/day Sonatrach & ADE Not rated 17 USD 4
Tenes 51% Algeria 7 Mft3/day Sonatrach & ADE Not rated 19 USD 4
(1) Reflects the counterparties’ issuer credit ratings issued by S&P, Moody’s and Fitch, respectively, as of May 6, 2021.(2) For Kaxu, it refers to the credit rating of the Republic of South Africa, and for Palmatir, Cadonal and Melowind, it
refers to the credit rating of Uruguay, as UTE is unrated.(3) Gross cash in euros dollarized through currency hedges.(4) USD denominated but payable in local currency.
AT A GLANCE
Sizeable and Diversified Asset Portfolio
(5) Southern California Public Power Authority, with AA- Rating from Fitch, and two Community Choice Aggregators: Silicon Valley Clean Energy and Monterrey Bar Community Power, both with A Rating from S&P.(6) Reflects the years in contract left as of December 31, 2021.
23
Q1 2021 Earnings Presentation
NON-GAAP FINANCIAL INFORMATION
Reconciliation of Non-GAAP Measures• Our management believes Adjusted EBITDA including unconsolidated affiliates and CAFD are useful to investors and other users of our financial statements in evaluating
our operating performance because it provides them with an additional tool to compare business performance across companies and across periods. Adjusted EBITDA iswidely used by investors to measure a company’s operating performance without regard to items such as interest expense, taxes, depreciation and amortization, whichcan vary substantially from company to company depending upon accounting methods and book value of assets, capital structure and the method by which assets wereacquired.
• Our management believes CAFD is a relevant supplemental measure of the Company’s ability to earn and distribute cash returns to investors and is useful to investors inevaluating our operating performance because securities analysts and other interested parties use such calculations as a measure of our ability to make quarterlydistributions. In addition, CAFD is used by our management team for determining future acquisitions and managing our growth. Adjusted EBITDA and CAFD are widelyused by other companies in the same industry.
• Our management uses Adjusted EBITDA and CAFD as measures of operating performance to assist in comparing performance from period to period on a consistentbasis. They also readily view operating trends as a measure for planning and forecasting overall expectations, for evaluating actual results against such expectations, andfor communicating with our board of directors, shareholders, creditors, analysts and investors concerning our financial performance.
• We present non-GAAP financial measures because we believe that they and other similar measures are widely used by certain investors, securities analysts and otherinterested parties as supplemental measures of performance and liquidity. The non-GAAP financial measures may not be comparable to other similarly titled measuresemployed by other companies and they may have limitations as analytical tools. These measures may not be fit for isolated consideration or as a substitute for analysis ofour operating results as reported under IFRS as issued by the IASB. Non-GAAP financial measures and ratios are not measurements of our performance or liquidity underIFRS as issued by the IASB. Thus, they should not be considered as alternatives to operating profit, profit for the period, any other performance measures derived inaccordance with IFRS as issued by the IASB, any other generally accepted accounting principles or as alternatives to cash flow from operating, investing or financingactivities. Some of the limitations of these non-GAAP measures are:
• they do not reflect our cash expenditures, future requirements for capital expenditures or contractual commitments;
• they do not reflect changes in, or cash requirements for, our working capital needs;
• they may not reflect the significant interest expense, or the cash requirements necessary, to service interest or principal payments, on our debts;
• although depreciation and amortization are non-cash charges, the assets being depreciated and amortized will often need to be replaced in the future and AdjustedEBITDA and CAFD do not reflect any cash requirements that would be required for such replacements;
• some of the exceptional items that we eliminate in calculating Adjusted EBITDA reflect cash payments that were made, or will be made in the future; and
• the fact that other companies in our industry may calculate Adjusted EBITDA and CAFD differently than we do, which limits their usefulness as comparative measures.
• EBITDA has been used in this presentation exclusively for the announced acquisition of a wind portfolio in the United States. EBITDA has been calculated as profit/(loss) ofthe portfolio for the year 2020 after adding back depreciation, amortization, and impairment changes. There were no financing costs or income tax in 2020 in thisportfolio.
• We define Adjusted EBITDA including unconsolidated affiliates as profit/(loss) for the period attributable to the Company, after adding back loss/(profit) attributable tonon-controlling interest from continued operations, profit/(loss) from discontinued operations, income tax, share of profit/(loss) of associates carried under the equitymethod, finance expense net, depreciation, amortization and impairment charges. CAFD is calculated as cash distributions received by the Company from its subsidiariesminus cash expenses of the Company, including third party debt service and general and administrative expenses.
24
Q1 2021 Earnings Presentation
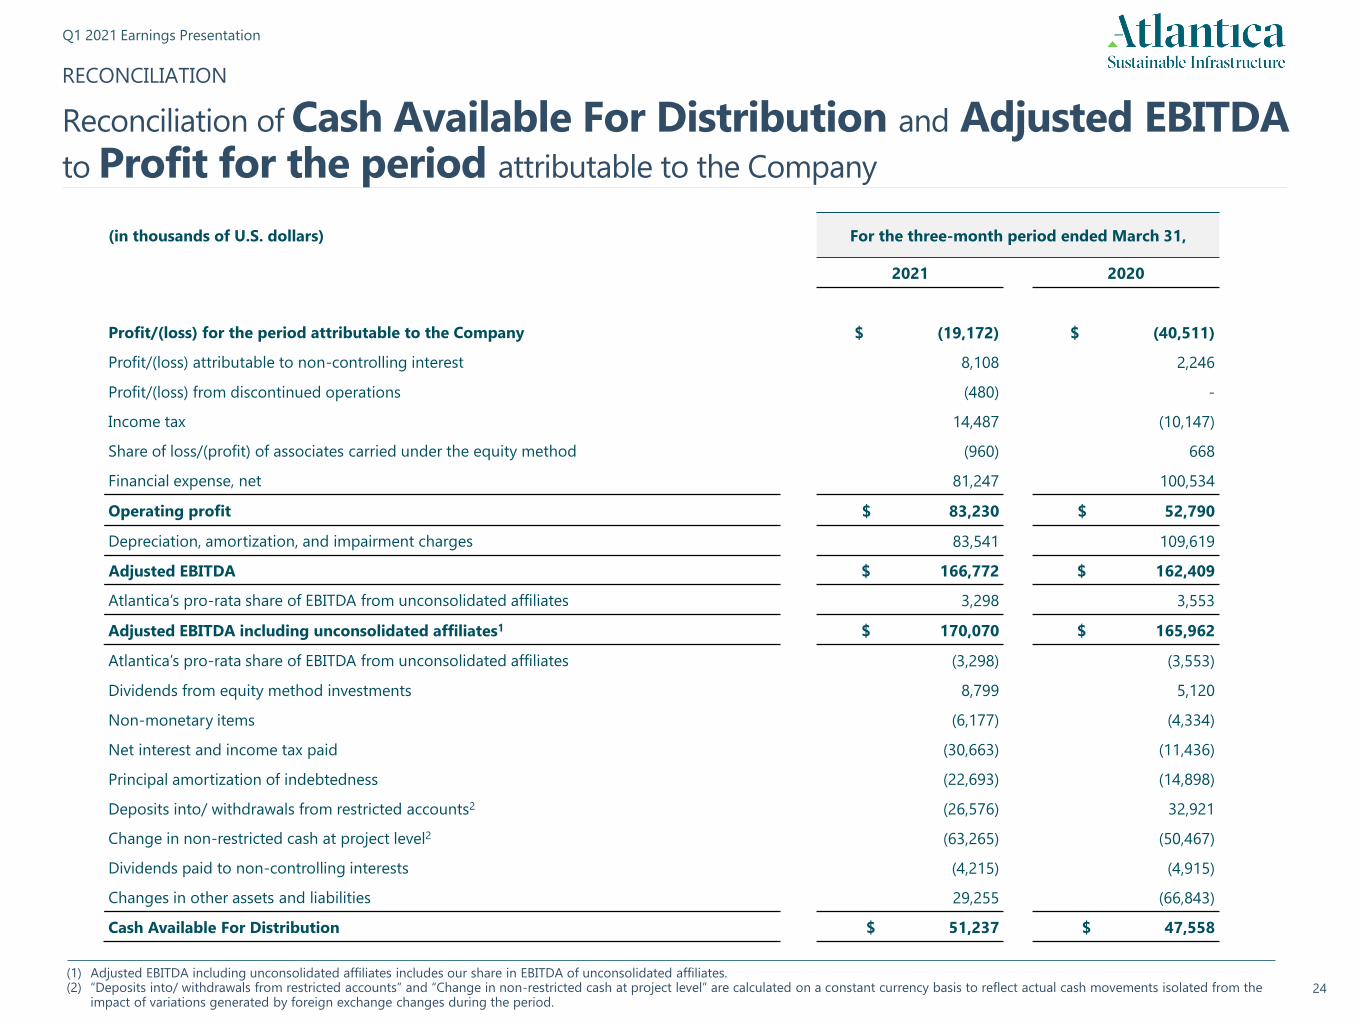
RECONCILIATION
Reconciliation of Cash Available For Distribution and Adjusted EBITDA to Profit for the period attributable to the Company
(1) Adjusted EBITDA including unconsolidated affiliates includes our share in EBITDA of unconsolidated affiliates.(2) “Deposits into/ withdrawals from restricted accounts” and “Change in non-restricted cash at project level” are calculated on a constant currency basis to reflect actual cash movements isolated from the
impact of variations generated by foreign exchange changes during the period.
(in thousands of U.S. dollars) For the three-month period ended March 31,
2021 2020
Profit/(loss) for the period attributable to the Company $ (19,172) $ (40,511)
Profit/(loss) attributable to non-controlling interest 8,108 2,246
Profit/(loss) from discontinued operations (480) -
Income tax 14,487 (10,147)
Share of loss/(profit) of associates carried under the equity method (960) 668
Financial expense, net 81,247 100,534
Operating profit $ 83,230 $ 52,790
Depreciation, amortization, and impairment charges 83,541 109,619
Adjusted EBITDA $ 166,772 $ 162,409
Atlantica’s pro-rata share of EBITDA from unconsolidated affiliates 3,298 3,553
Adjusted EBITDA including unconsolidated affiliates1 $ 170,070 $ 165,962
Atlantica’s pro-rata share of EBITDA from unconsolidated affiliates (3,298) (3,553)
Dividends from equity method investments 8,799 5,120
Non-monetary items (6,177) (4,334)
Net interest and income tax paid (30,663) (11,436)
Principal amortization of indebtedness (22,693) (14,898)
Deposits into/ withdrawals from restricted accounts2 (26,576) 32,921
Change in non-restricted cash at project level2 (63,265) (50,467)
Dividends paid to non-controlling interests (4,215) (4,915)
Changes in other assets and liabilities 29,255 (66,843)
Cash Available For Distribution $ 51,237 $ 47,558
25
Q1 2021 Earnings Presentation
RECONCILIATION
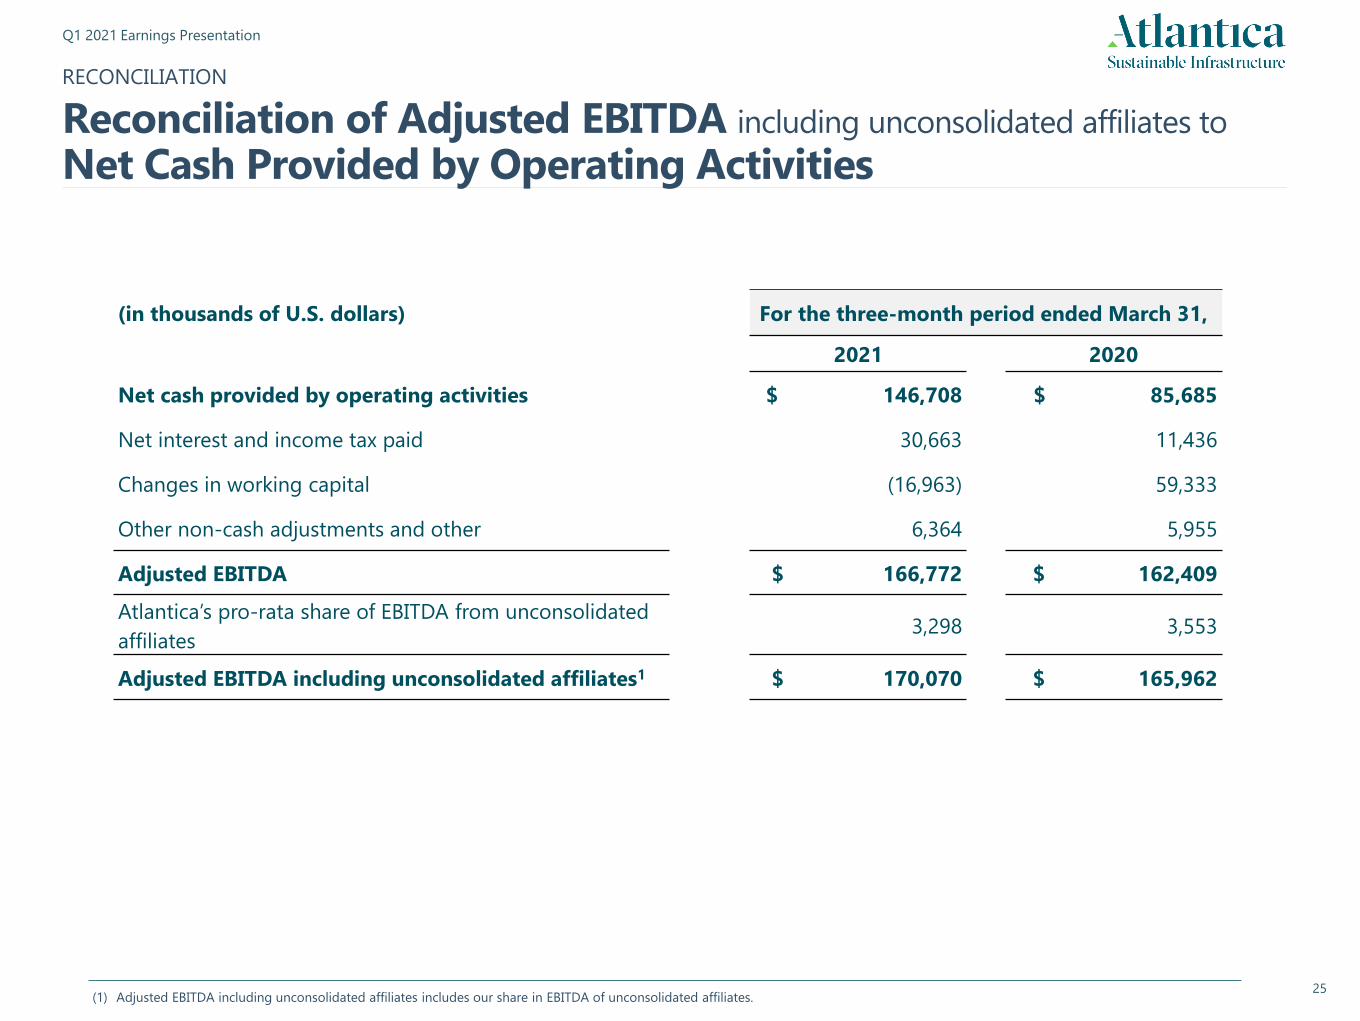
Reconciliation of Adjusted EBITDA including unconsolidated affiliates to
Net Cash Provided by Operating Activities
(in thousands of U.S. dollars) For the three-month period ended March 31,
2021 2020
Net cash provided by operating activities $ 146,708 $ 85,685
Net interest and income tax paid 30,663 11,436
Changes in working capital (16,963) 59,333
Other non-cash adjustments and other 6,364 5,955
Adjusted EBITDA $ 166,772 $ 162,409
Atlantica’s pro-rata share of EBITDA from unconsolidated
affiliates3,298 3,553
Adjusted EBITDA including unconsolidated affiliates1 $ 170,070 $ 165,962
(1) Adjusted EBITDA including unconsolidated affiliates includes our share in EBITDA of unconsolidated affiliates.
26
Q1 2021 Earnings Presentation
RECONCILIATION
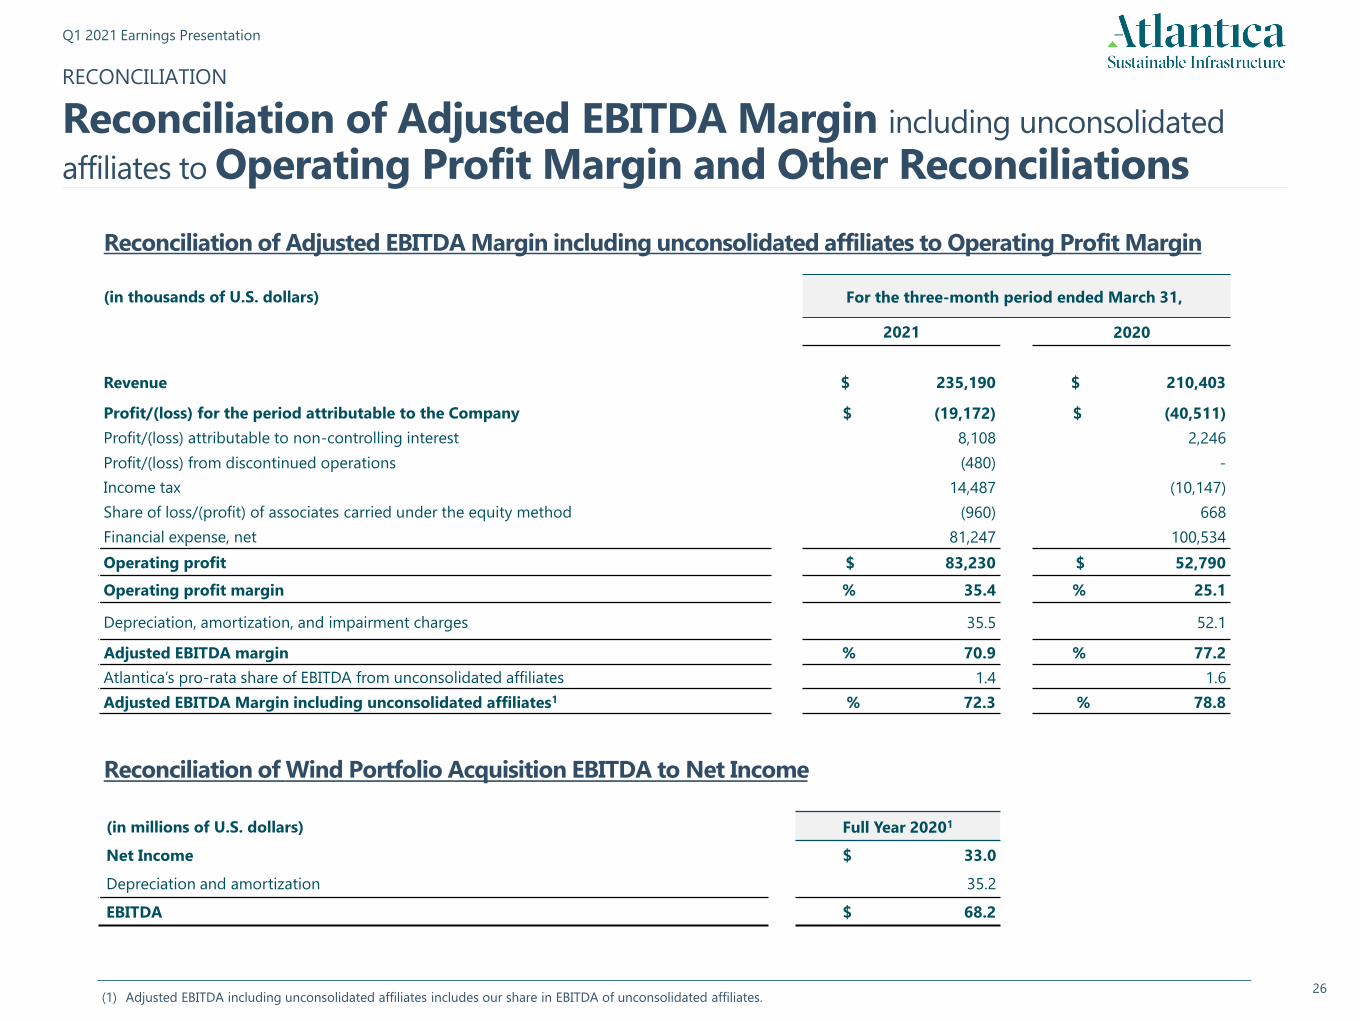
Reconciliation of Adjusted EBITDA Margin including unconsolidated
affiliates to Operating Profit Margin and Other Reconciliations
(1) Adjusted EBITDA including unconsolidated affiliates includes our share in EBITDA of unconsolidated affiliates.
(in thousands of U.S. dollars) For the three-month period ended March 31,
2021 2020
Revenue $ 235,190 $ 210,403
Profit/(loss) for the period attributable to the Company $ (19,172) $ (40,511)
Profit/(loss) attributable to non-controlling interest 8,108 2,246
Profit/(loss) from discontinued operations (480) -
Income tax 14,487 (10,147)
Share of loss/(profit) of associates carried under the equity method (960) 668
Financial expense, net 81,247 100,534
Operating profit $ 83,230 $ 52,790
Operating profit margin % 35.4 % 25.1
Depreciation, amortization, and impairment charges 35.5 52.1
Adjusted EBITDA margin % 70.9 % 77.2
Atlantica’s pro-rata share of EBITDA from unconsolidated affiliates 1.4 1.6
Adjusted EBITDA Margin including unconsolidated affiliates1 % 72.3 % 78.8
(in millions of U.S. dollars) Full Year 20201
Net Income $ 33.0
Depreciation and amortization 35.2
EBITDA $ 68.2
Reconciliation of Wind Portfolio Acquisition EBITDA to Net Income
Reconciliation of Adjusted EBITDA Margin including unconsolidated affiliates to Operating Profit Margin
Great West House, GW1, 17th floor,
Great West RoadBrentford TW8 9DFLondon (United Kingdom)