Embed Size (px)
Citation preview

Q1 FY2022 EARNINGS
Hydraulics Aerospace Automotive & Metallurgy

36%
21%
43% 44%
29%
27%
Automotive & MetallurgyHydraulicsAerospace
Q1 FY2022 PERFORMANCE HIGHLIGHTS
2
Highlights Q1 FY2022 vs. Q1 FY2021
Q1 FY2022
Q1 FY2021
• Revenue of Rs. 3,204 mn; up 72.8% from Rs. 1,854 mn in Q1 FY21
o Aerospace segment revenue of Rs. 873 mn; up 7.4% from Rs. 813 mn
o Hydraulics segment revenue of Rs. 931 mn; up 129.3% from Rs. 406 mn
o Automotive & Metallurgy segment revenue of Rs. 1,398 mn; up by 120.2% from Rs. 635 mn
• EBITDA of Rs. 400 mn; up 90.8% from Rs. 210 mn in Q1 FY21
o EBITDA margin of 12.5%; up 118 bps
• PAT From Continuing Operations of Rs. 58 mn, from Rs. (117) mn in Q1 FY21
Q1 FY2022 Revenue Breakup
Note: 1. Revenue and EBITDA refer to continuing operations2. Previous quarters Automotive & Metallurgy segment results restated to make comparable
Revenue (Rs. mn) and EBITDA Margin (%)
1,854
3,204
11.3%
12.5%
Q1 FY21 Q1 FY22
Revenue EBITDA Margin

PERFORMANCE HIGHLIGHTSManagement Commentary
Commenting on the results, Mr. Udayant Malhoutra, CEO and Managing Director said:“We saw animproved performance during the first quarter as compared to the previous year. This growth in our toplinewas driven by a gradual return to a low COVID environment.
Our performance in the hydraulics and auto segments was driven by gradual recovery in the economy. Q1FY21 faced strict lockdowns and the country was in the initial stages of dealing with the pandemic butthis year the Company was better prepared to deal with pandemic related business challenges. The monthof July saw the auto sector witness positive growth and was on the road to recovery. The tractor industrycontinues to grow substantially, and this has aided in the growth of the hydraulics segment. The Aerosector has temporarily been affected by travel restrictions and will continue to remain muted due to thelockdown and travel restrictions, although our order book remains very strong. The civil aviation sector inparticular has been impacted with only bubble flights allowed to ply. The defense segment has continuedto grow and has helped to reduce the impact from slowdown in the aviation sector. The recent initiativesto make India self reliant and focus on localization will aid in the growth of the industry going forward.
The asset sale of foundry business of JKM Ferrotech Limited (JFTL), situated at SIPCOT Industrialcomplex to Danblock Brakes India Private Limited has been concluded and the Company has received anet consideration of INR 70 crore on 22 July 2021. The net proceeds available after meeting JFTL’sobligations, will be used by the Group for debt optimization and augmentation of working capital. Post-sale of the perennially loss-making Indian ferrous foundry, this segment will no longer will be drag onconsolidated earnings and this divestment would also improve the company’s operating margins andoverall credit metrics.
Although Q1 FY22 was impacted by the lockdown, the severity on economic activity was mitigated dueto better management and partial reopening as compared to Q1 FY21. With the large-scale vaccinationdrives and gradual recovery of the economy, the medium term will witness positive growth. This, coupledwith the Government schemes, Company’s focus strategic initiatives, will help strengthen the outlook ofthe Company going forward.”
3

FINANCIAL PERFORMANCE SUMMARYConsolidated Performance Highlights
4
• Q1 FY2022 revenues from the Aerospace segment increased by 7.4%, Hydraulics segmentincreased by 129.3% and Automotive & Metallurgy segment increased by 120.2% on a y-o-ybasis
• Q1 FY2022 EBITDA increased by 72.8% y-o-y with margin of 12.5%
Rs. MillionQ1 y-o-y
Grow th (%)
Q4 q-o-q Grow th (%)FY22 FY21 FY21
Revenue 3,204 1,854 72.8% 3,533 (9.3)%
EBITDA 400 210 90.8% 493 (18.8)%
Margin (%) 12.5% 11.3% 14.0%
Profit Before Tax (PBT) 83 (152) nm 129 (35.2)%
PAT From Continuing Operations 58 (117) nm 42 40.2%
Margin (%) 1.8% nm 1.2%
Basic EPS (Rs.) 3.97 (26.72) nm (12.24) nm
Consolidated PAT 25 (169) nm (78) nm
Margin (%) 0.8% nm nm

Exchange Rate Q1 FY2022 Q1 FY2021 Impact Impact % Q4 FY2021 Impact Impact %
EURO vs. INR 88.9 83.6 5.2 6.3% 86.6 2.3 2.6%
GBP vs. INR 103.1 94.2 8.9 9.5% 97.0 6.1 6.3%
USD vs. INR 73.8 75.9 (2.1) (2.8)% 74.2 (0.5) (0.6)%
PERFORMANCE HIGHLIGHTSForeign Exchange Fluctuation
5
Impact due to change in average exchange rates (Y-o-Y)
Q1 FY2022 vs. Q1 FY2021 Q1 FY2022 vs. Q4 FY2021
Particulars Erla DL UK DTL Total Impact Erla DL UK DTL Total
Impact
Currency EURO GBP USD EURO GBP USD
Revenue (Rs. mn) 82.5 43.8 (6.8) 119.4 35.5 29.8 3.1 68.4
EBITDA (Rs. mn) 3.8 (2.8) (4.1) (3.1) 1.7 (1.9) 1.9 1.6
• On a constant currency basis, Q1 FY2022 revenue, if adjusted for a foreign exchange impact ofRs. 119.4 mn would be Rs. 3,084 mn (representing a gain of 61.5% compared to a gain of67.7% before adjustment).
• On a constant currency basis, Q1 FY2022 EBITDA, if adjusted for a foreign exchange impact ofRs. (3.1) mn would be Rs. 403.1 mn (compared to Rs. 400 mn before adjustment).
• The Company has exposure to EUR, GBP and USD. The impact from Euro and GBP transactionswere favorable on a Y-o-Y basis

AEROSPACE SEGMENTFinancial Overview
6
Performance Overview
a
• The aerospace segment saw a slowdown due the lockdown in the months of April and May. Theaviation sector has recovered as compared to Q1 FY21, where the first lockdown was underway
• Outlook: : Demand is expected to be driven by the defense sector and equally supported bycommercial sector. With large scale vaccination drives and the gradual opening up of cross bordertravel, the aviation sector is expected to pick up in the second half of the year. Airbus, the largestmanufacturer of Aircrafts has indicated an increase in demand starting early 2022
• Strategy: Enhance capability in large aero-structure assemblies, high precision aero-structuremanufacturing, design and engineering
Rs. MillionQ1
y-o-yGrow th (%)
Q4q-o-q
Grow th (%)FY22 FY21 FY21
Revenue 873 813 7.4% 1,087 (19.7)%
EBITDA 223 250 (11.0)% 315 (29.3)%
Margin (%) 25.5% 30.8% 29.0%
HYDRAULICS SEGMENT
7
Financial Overview .
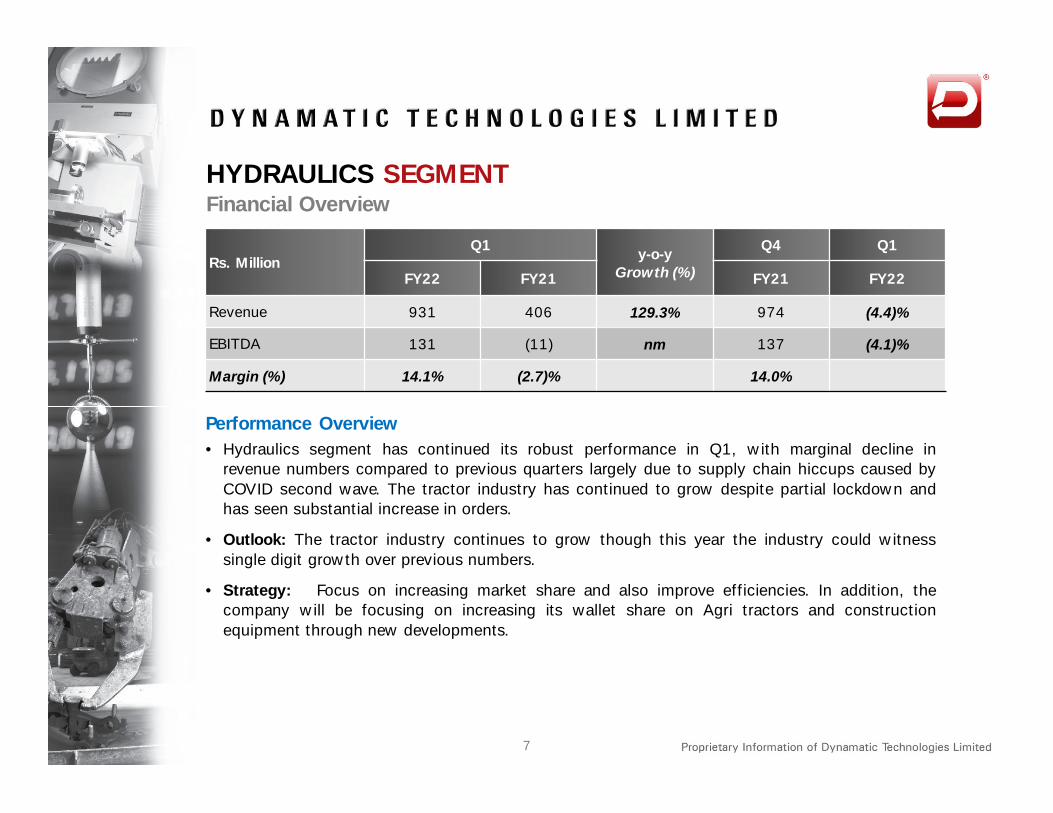
• Hydraulics segment has continued its robust performance in Q1, with marginal decline inrevenue numbers compared to previous quarters largely due to supply chain hiccups caused byCOVID second wave. The tractor industry has continued to grow despite partial lockdown andhas seen substantial increase in orders.
• Outlook: The tractor industry continues to grow though this year the industry could witnesssingle digit growth over previous numbers.
• Strategy: Focus on increasing market share and also improve efficiencies. In addition, thecompany will be focusing on increasing its wallet share on Agri tractors and constructionequipment through new developments.
Performance Overview
Rs. MillionQ1
y-o-yGrow th (%)
Q4 Q1
FY22 FY21 FY21 FY22
Revenue 931 406 129.3% 974 (4.4)%
EBITDA 131 (11) nm 137 (4.1)%
Margin (%) 14.1% (2.7)% 14.0%

AUTOMOTIVE AND METALLURGY SEGMENT
8
Financial Overview .
• The auto industry witnessed a complete standstill in the April and May, however there wasconsiderable recovery at the end of the Q1 FY22
• Outlook: The segment will continue to grow once the economy opens up, depending on thethird wave and vaccination efforts.
• Strategy: Focus on high margin product mix, exports, ramp-up of existing products,performance-critical components, customer diversification and capacity utilization. With thesuccessful divestment of Indian foundry, we will focus on transitioning the German foundry intoaerospace applications over the next few years.
Performance Overview
Rs. MillionQ1
y-o-yGrow th (%)
Q4 Q1
FY22 FY21 FY21 FY22
Revenue 1,398 635 120.2% 1,471 (5.0)%
EBITDA 89 210 (57.4)% 84 6.4%
Margin (%) 6.4% 33.1% 5.7%
Note: 1. Revenue and EBITDA refer to continuing operations2. Previous years segment results restated to make comparable

EBITDA (Rs. mn) and Margin (%)
Revenue (Rs. mn) and Growth % (Q-o-Q)
QUARTERLY FINANCIAL TRENDSSegment Wise Revenue Contribution
9
Note: 1. Revenue and EBITDA refer to continuing operations
36% 41% 43% 42% 44%
21%27% 27% 28% 29%
43% 32% 30% 31% 27%
Q1 FY21 Q2 FY21 Q3 FY21 Q4 FY21 Q1 FY22
Automotive & Metallurgy Hydraulics Aerospace
1,854 2,671 3,100 3,533 3,204
(38.7)%
44.1%16.1% 14.0%
(9.3)%
Q1 FY21 Q2 FY21 Q3 FY21 Q4 FY21 Q1 FY22
210 410 377 494 400
11.3%
15.4%
12.2%14.0%
12.5%
Q1 FY21 Q2 FY21 Q3 FY21 Q4 FY21 Q1 FY22

QUARTERLY FINANCIAL TRENDSCapital Structure Net Debt/LTM EBITDA & Debt/Equity (x)(Rs. million) Jun-20 Sep-20 Dec-20 Mar-21 Jun-21
Long Term 3,922 3,909 3,839 4,268 3,823
Short Term 2,084 2,025 1,872 1,505 1,623
Total Debt 6,006 5,934 5,711 5,773 5,446
Less: Cash & Cash Equivalents
569 568 453 606 477
Net Debt 5,437 5,366 5,258 5,167 4,969
Add: Lease Liabilities 1,295 1,256 1,224 1,665 1,606
Overall Debt 6,732 6,622 6,482 6,832 6,575
Net Worth 3,598 3,679 3,775 3,688 3,756
LTM EBITDA 1,533 1,467 1,402 1,492 1,682
10
Interest Expense (Rs. mn) & Interest Coverage (x)
Note: 1. Interest Coverage ratio = Operating Profit / Interest Expense2. LTM EBITDA refers to EBITDA from continuing operations
1.7x1.9x
1.4x
3.5x 3.7x
3.0x
Q1 FY21 Q4 FY21 Q1 FY22
Net Debt/Equity Net Debt/LTM EBITDA
190 188 168 154 149
0.1x
0.8x 1.0x1.2x 1.5x
Q1 FY21 Q2 FY21 Q3 FY21 Q4 FY21 Q1 FY22

DYNAMATIC OVERVIEW
Competitive
market
position
Competitive
market
position
• One of the world’s largest manufacturers of hydraulic gear pumps; leadership in hydraulic gear pumps market for over 45 years
• Has 75% share of the Indian organized tractor market, supplies to almost all OEMs in India
• Pioneer and leader in the Indian private sector and the UK for manufacture of high precision airframe structures and aerospace components. Tier I supplier to the global aerospace OEMs such as Airbus, Boeing, Bell Helicopters and HAL
• Manufactures high precision, complex metallurgical ferrous castings for performance critical components such as turbochargers and exhaust manifolds and has capabilities to develop complex metallurgical components on single-source basis
• A combination of stable and high growth businesses with highly engineered products forthe automotive, hydraulic and aerospace industries
• Successful track record of enhancing manufacturing capabilities through R&D and selectiveacquisitions
• A combination of stable and high growth businesses with highly engineered products forthe automotive, hydraulic and aerospace industries
• Successful track record of enhancing manufacturing capabilities through R&D and selectiveacquisitions
Diversified
business
Diversified
business
• World-class manufacturing facilities in India, UK and Germany will give the company business advantages in the post-COVID world, as customers look for local deliveries from suppliers.
• World-class manufacturing facilities in India, UK and Germany will give the company business advantages in the post-COVID world, as customers look for local deliveries from suppliers.
Locational
advantages
Locational
advantages
11

R&D and
Intellectual
Property
R&D and
Intellectual
Property
• Owns 21 patents for various products in India and internationally
• Has the design IP for all the products manufactured in the Hydraulics segment
• R&D units recognized by Department of Scientific and Industrial Research, Government ofIndia
• Owns 21 patents for various products in India and internationally
• Has the design IP for all the products manufactured in the Hydraulics segment
• R&D units recognized by Department of Scientific and Industrial Research, Government ofIndia
• Owns one of the most advanced ferrous foundries in Europe (Germany) capable of manufacturing highly intricate castings
• In-house division for design validation and optimization, analysis and prototypes
• 9 Facilities globally, spread across India (Bangalore and Coimbatore), UK (Swindon, Bristol) and Germany (Schwarzenberg)
Vertically
Integrated
Facilities
Vertically
Integrated
Facilities
Blue Chip
Customers
Blue Chip
Customers
• Automotive: BMW, MAN, Daimler, Volkswagen
• Hydraulics: Cummins, Escorts, John Deere, Mahindra & Mahindra, Same Deutz-Fahr
• Aerospace : Airbus, Bell Helicopter, Boeing, GKN Aerospace, HAL, Spirit Aerosystems
• Automotive: BMW, MAN, Daimler, Volkswagen
• Hydraulics: Cummins, Escorts, John Deere, Mahindra & Mahindra, Same Deutz-Fahr
• Aerospace : Airbus, Bell Helicopter, Boeing, GKN Aerospace, HAL, Spirit Aerosystems
• Highly qualified board and management team with significant industry experience
• 4 out of 9 Directors are Independent
• Highly qualified board and management team with significant industry experience
• 4 out of 9 Directors are Independent
Board and
Management
Board and
Management
12
DYNAMATIC OVERVIEW

DYNAMATIC OVERVIEWCombination of Stable and High Growth Businesses
HYDRAULICS
29% of Q1 FY22 Revenue
HYDRAULICS
29% of Q1 FY22 Revenue
• Hydraulic valves
• Hydraulic gear pumps
• Combined displacement pump packages
• Fan drive systems
• Fixed displacement pumps
• Hydraulic valves
• Hydraulic gear pumps
• Combined displacement pump packages
• Fan drive systems
• Fixed displacement pumps
AEROSPACE
27% of Q1 FY22 Revenue
AEROSPACE
27% of Q1 FY22 Revenue
• Wings, rear fuselages, ailerons, wing flaps and major airframe structures
• Ramp structure assembly• AFT Pylon assembly
• Wings, rear fuselages, ailerons, wing flaps and major airframe structures
• Ramp structure assembly• AFT Pylon assembly
• Cummins
• Eicher
• Escorts
• John Deere
• JCB
• Mahindra & Mahindra
• New Holland
• Same Deutz-Fahr
• Terex
• Airbus
• Boeing
• Bell
• Spirit Aerosystems
• HAL
13
AUTOMOTIVE & METALLURGY
44% of Q1 FY22Revenue
AUTOMOTIVE & METALLURGY
44% of Q1 FY22Revenue
• Ferrous automotive components including engine, transmission, turbocharger and chassis parts
• Ferrous automotive components including engine, transmission, turbocharger and chassis parts
• Audi
• BMW
• Daimler
• MAN
• Volkswagen
• BorgWarner

BLUE CHIP INVESTOR BASEKey Investors
Shareholders Sep-20 Dec-20 Mar-21 Jun-21
Promoters 48.8% 48.8% 48.8% 48.8%
FIIs 14.4% 10.8% 10.8% 11.6%
DIIs 10.6% 8.9% 8.7% 7.0%
Others 26.2% 31.5% 31.7% 32.6%
Total 100.0% 100.0% 100.0% 100.0%
Shareholding Pattern Trend Equity History
Year EventYear End
Equity Capital (Rs. mn)
1974 Initial Public Offering 2.9
1987 Rights Issue 11.2
1992 Rights Issue 21.0
1994 Rights Issue 31.5
1995 Bonus Issue 41.9
2008 Amalgamation 48.1
2008 Qualified Institutional Placement 54.1
2014 Preferential Convertible Warrants 60.4
2014 Qualified Institutional Placement 63.4
Shareholding Structure
14
• Samena Capital• HDFC Mutual Fund• Alchemy and Group• Mukul Agarwal and Group• Girish Gulati – HUF• Rohini Nilekani• Chandravardhan Shah
Promoters48.8%
FIIs11.6%
DIIs7.0%
Others32.6%

FINANCIAL STATEMENTS
Profit & Loss Statement (Rs. million) Q1 FY21 Q4 FY21 Q1 FY22RevenuesNet Sales / Income from Operations 1,854 3,533 3,204Other Operating Income - - -Total Revenues 1,854 3,533 3,204ExpensesCost of Raw Materials Consumed 654 1,806 1,611Changes in Inventories of Finished Goods and WIP 135 11 17Employee Benefit Expenses 495 606 621Other Expenditure 362 618 556Total expenses excluding D&A 1,644 3,040 2,804Operating Profit (EBITDA) 210 493 400Depreciation and Amortization Expenses 187 223 181EBIT 23 270 219Other Income 14 25 13Finance Costs 190 166 149PBT - Pre –Exceptional (152) 129 83Exceptional Item 0 0 0PBT (152) 129 83Tax Expenses (35) 87 25PAT From Continuing Operations (117) 42 58PAT/(Loss) from Discontinued Operations (53) (119) (33)PAT (169) (78) 23Basic EPS (Rs) (26.72) (12.24) 3.97Margins (%)Gross Margins 57.5% 48.6% 49.2%EBITDA margins 11.3% 14.0% 12.5%PAT margins (9.1)% nm nmY-o-Y Growth (%)Total Revenues 72.8%EBITDA 90.8%PAT nm
Consolidated Income Statement (Y-o-Y and Q-o-Q Comparison)
15

IMPORTANT NOTICE
This presentation contains statements that contain ‘forward looking statements’including, but without limitation, statements relating to the implementation ofstrategic initiatives, and other statements relating to Dynamatic Technologies’(‘Dynamatic’ or the ‘Company’) future business developments and economicperformance.
While these forward looking statements indicate our assessment and futureexpectations concerning the development of our business, a number of risks,uncertainties and other unknown factors could cause actual developments and resultsto differ materially from our expectations.
These factors include, but are not limited to, general market, macro-economic,governmental and regulatory trends, movements in currency exchange and interestrates, competitive pressures, technological developments, changes in the financialconditions of third parties dealing with us, legislative developments, and other keyfactors that could affect our business and financial performance.
Dynamatic undertakes no obligation to publicly revise any forward looking statementsto reflect future / likely events or circumstances.
16
CONTACT DETAILSMr. Chalapathi PChief Financial OfficerF: +91 80 2839 5823E: [email protected]
Mr. Shivaram VHead – Legal, Compliance & Company SecretaryF: +91 80 2839 5823E: [email protected]
Dynamatic Technologies LimitedDynamatic ParkPeenya Industrial Area Bangalore 560 058IndiaT: +91 80 2839 4933 / 34 / 35www.dynamatics.netCIN: L72200KA1973PLC002308