Embed Size (px)
Citation preview
Page | 1 | PHILLIP SECURITIES RESEARCH (SINGAPORE) MCI (P) 118/10/2015 Ref. No.: SG2016_0074
Q & M Dental Group
The Tooth Fairy: A Tooth for A Coin SINGAPORE | HEALTHCARE | UPDATE (CHANGE OF ANALYST)
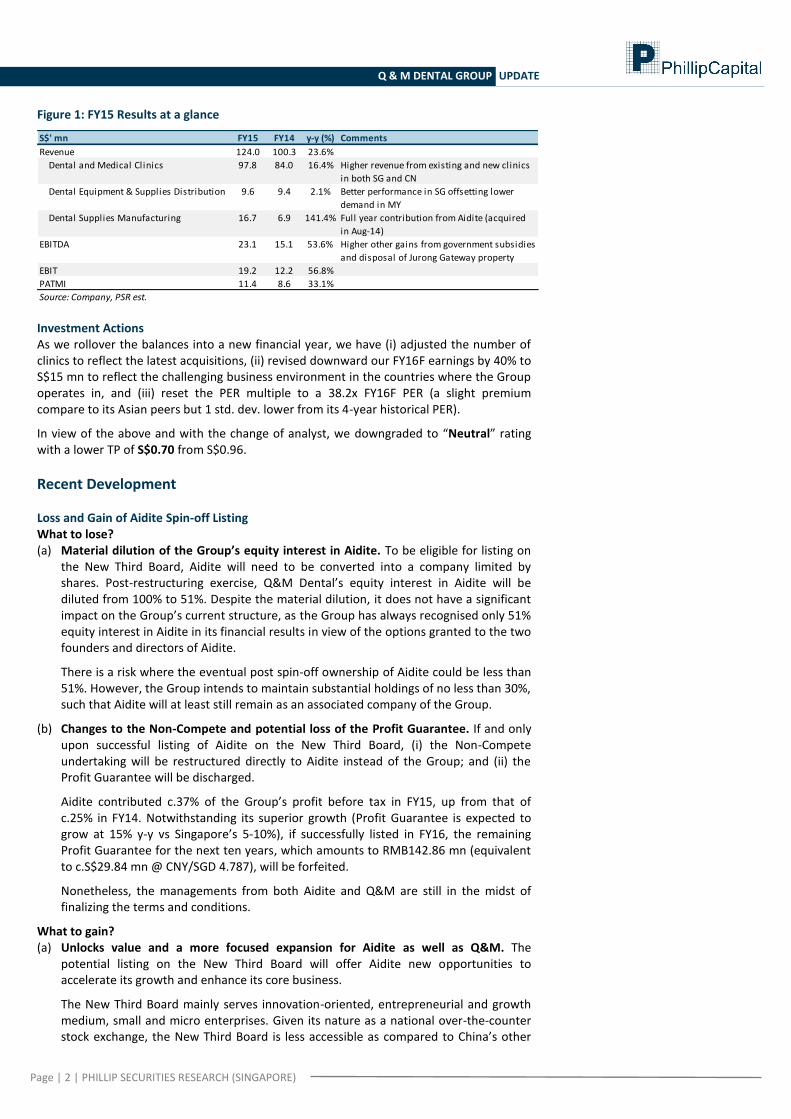
The impending spin-off listing of Aidite is deemed positive for both Aidite and Q&M as capital could be channelled to focus on growing respective core businesses.
Q&M Dental Holdings (China) is next in the pipeline for spin-off. Favorable demographics and business landscape support its effort to build up presence
in Northeast China; while its expansion plans in Singapore and Malaysia could shift to lower gear.
Downgrade to Neutral rating with lower TP at S$0.70. What’s new? In the process of spinning off Aidite. The Group intends to enhance long-term shareholder value by spinning off of its manufacturing business in China by listing Aidite separately on the National Equities Exchange and Quotations, an emerging over-the-counter market in China (the "New Third Board"). The listing will provide Aidite direct access to the capital market for funding, given its capital-intensive manufacturing business, and also free up Q&M’s capital to invest in other areas which could bring higher returns on investments for its shareholders as compared to its manufacturing business. Aidite will remain as an associated company of the Group with substantial holdings of no less than 30% post spin-off. In November 2015, the Group received approval from SGX to spin-off Aidite.
The management is also looking to spin-off Q&M Dental Holdings (China) Pte Ltd, its healthcare services business in Shenyang, separately, following Aidite’s listing.
Three out of four acquisition deals in Singapore (announced in early-15) were completed – a testimony to its commitment and effectiveness in delivering what was announced. The management shared that the delay in acquiring Orchard Scotts Dental Clinic and De Pacific Dental Group is due to terms renegotiation. It is not peculiar that deals announced will undergo renegotiation. We are positive that the last deal could be sealed this year with better terms.
Continue to expand its footprint in China, but slowing down on South-East Asia
(a) Continue its roll-up strategy and some add-on acquisitions. Expects slower momentum to grow organically in Singapore as the market saturates and to avoid cannibalization within the same vicinity. Opened a new clinic in Blk 502 Bishan (Mar-16).
(b) Riding on the wave of China’s evolving health care system. Expects the Group to gear up to grow its businesses organically or inorganically in China, particularly in the Northeast region. The Group is acquired five clinics in Liaoning Province in Dec-15 and is in the midst of acquiring a medical equipment distribution company.
(c) Cautious but remains vested in the Malaysia market. Facing heightened risks in political and foreign exchange rate, the deal on Smilebay Dental Clinics (announced in Jun-15) is still under review.
14 April 2016
NEUTRAL (Downgrade)LAST DONE PRICE
FORECAST DIV
TARGET PRICE
TOTAL RETURN
COMPANY DATA
O/S SHARES (M N) : 790
M ARKET CAP (USD mn / SGD mn) : 393 / 537
52 - WK HI/LO (SGD) : 1 / 0.57
3M Average Daily T/O (mn) : 0.94
MAJOR SHAREHOLDERS (%)
56.05%
Heritas Helios Investmetns Pte Ltd 8.11%
Koh ShunJie, Kelvin 4.67%
1.42%
PRICE PERFORMANCE (%)
1M T H 3 M T H 1Y R
COM PANY 3.0 (2.1) (3.2)
STI RETURN 2.27 7.44 (14.25)
PRICE VS. STI
Source: B loomberg, PSR
KEY FINANCIALS
SGD M N F Y 14 F Y 15 F Y 16 F F Y 17F
Revenue 100 124 167 198
EBITDA 9 15 23 33
NPAT (adj.) 9 11 15 17
EPS (S Cents) 1.20 1.46 1.83 2.01
PER, x (adj.) 29.2 32.7 37.2 33.8
P /BV, x 3.3 4.0 5.6 5.3
DPS (S Cents) 0.7 0.8 1.1 1.2
Div Yield, % 2% 2% 2% 2%
ROE, % 14% 14% 16% 16%
Source: Company Data, PSR est.
Valuation Method
P/E Multiple @ 38x
Soh Lin Sin (+65 6212 1847)
Quan M in Holdings Pte Ltd
Dr Ng Chin Siau
4.5%
SGD 0.680
SGD 0.012
SGD 0.699
0.25
0.50
0.75
1.00
1.25
Apr-15 Jul-15 Oct-15 Jan-16QNM SP EQUITY FSSTI index
Page | 2 | PHILLIP SECURITIES RESEARCH (SINGAPORE)
Q & M DENTAL GROUP UPDATE
Figure 1: FY15 Results at a glance
S$' mn FY15 FY14 y-y (%) Comments
Revenue 124.0 100.3 23.6%
Dental and Medical Clinics 97.8 84.0 16.4% Higher revenue from existing and new clinics
in both SG and CN
Dental Equipment & Supplies Distribution 9.6 9.4 2.1% Better performance in SG offsetting lower
demand in MY
Dental Supplies Manufacturing 16.7 6.9 141.4% Full year contribution from Aidite (acquired
in Aug-14)
EBITDA 23.1 15.1 53.6% Higher other gains from government subsidies
and disposal of Jurong Gateway property
EBIT 19.2 12.2 56.8%
PATMI 11.4 8.6 33.1%
Source: Company, PSR est. Investment Actions As we rollover the balances into a new financial year, we have (i) adjusted the number of clinics to reflect the latest acquisitions, (ii) revised downward our FY16F earnings by 40% to S$15 mn to reflect the challenging business environment in the countries where the Group operates in, and (iii) reset the PER multiple to a 38.2x FY16F PER (a slight premium compare to its Asian peers but 1 std. dev. lower from its 4-year historical PER).
In view of the above and with the change of analyst, we downgraded to “Neutral” rating with a lower TP of S$0.70 from S$0.96.
Recent Development Loss and Gain of Aidite Spin-off Listing What to lose? (a) Material dilution of the Group’s equity interest in Aidite. To be eligible for listing on
the New Third Board, Aidite will need to be converted into a company limited by shares. Post-restructuring exercise, Q&M Dental’s equity interest in Aidite will be diluted from 100% to 51%. Despite the material dilution, it does not have a significant impact on the Group’s current structure, as the Group has always recognised only 51% equity interest in Aidite in its financial results in view of the options granted to the two founders and directors of Aidite.
There is a risk where the eventual post spin-off ownership of Aidite could be less than 51%. However, the Group intends to maintain substantial holdings of no less than 30%, such that Aidite will at least still remain as an associated company of the Group.
(b) Changes to the Non-Compete and potential loss of the Profit Guarantee. If and only upon successful listing of Aidite on the New Third Board, (i) the Non-Compete undertaking will be restructured directly to Aidite instead of the Group; and (ii) the Profit Guarantee will be discharged.
Aidite contributed c.37% of the Group’s profit before tax in FY15, up from that of c.25% in FY14. Notwithstanding its superior growth (Profit Guarantee is expected to grow at 15% y-y vs Singapore’s 5-10%), if successfully listed in FY16, the remaining Profit Guarantee for the next ten years, which amounts to RMB142.86 mn (equivalent to c.S$29.84 mn @ CNY/SGD 4.787), will be forfeited.
Nonetheless, the managements from both Aidite and Q&M are still in the midst of finalizing the terms and conditions.
What to gain? (a) Unlocks value and a more focused expansion for Aidite as well as Q&M. The
potential listing on the New Third Board will offer Aidite new opportunities to accelerate its growth and enhance its core business.
The New Third Board mainly serves innovation-oriented, entrepreneurial and growth medium, small and micro enterprises. Given its nature as a national over-the-counter stock exchange, the New Third Board is less accessible as compared to China’s other
Page | 3 | PHILLIP SECURITIES RESEARCH (SINGAPORE)
Q & M DENTAL GROUP UPDATE
markets, thus dominated by professional fund managers instead of retail investors. Therefore, it offers new channel for companies to access capital markets and gain greater exposure to the investment community, but less susceptible to erratic trades.
On the other hand, Q&M could free up its capital to invest into other areas which could bring higher returns on investments for its shareholders as compared to its manufacturing business.
(b) Potential incentives and compelling offers by the local authorities to attract companies to list in the New Third Board. In addition to the lower cost of listing, companies could also enjoy policy incentives and government subsidies. The lack of red tape in the New Third Board could also be a plus for Aidite. There is no requirement for companies to be profitable prior to listing. There are no limits on the amount that shares can move in one day.
(c) Potential special dividend from the likely cash accretive restructuring exercise and investment gain (spin-off proceeds less initial acquisition and Aidite’s shares purchase costs).
Aidite was acquired in Aug-14 at 9.7x implied PER (RMB39.5 mn cash upfront with further capital injection of RMB35 mn). A value-buy compared to the group’s average historical PER at 42.1x.
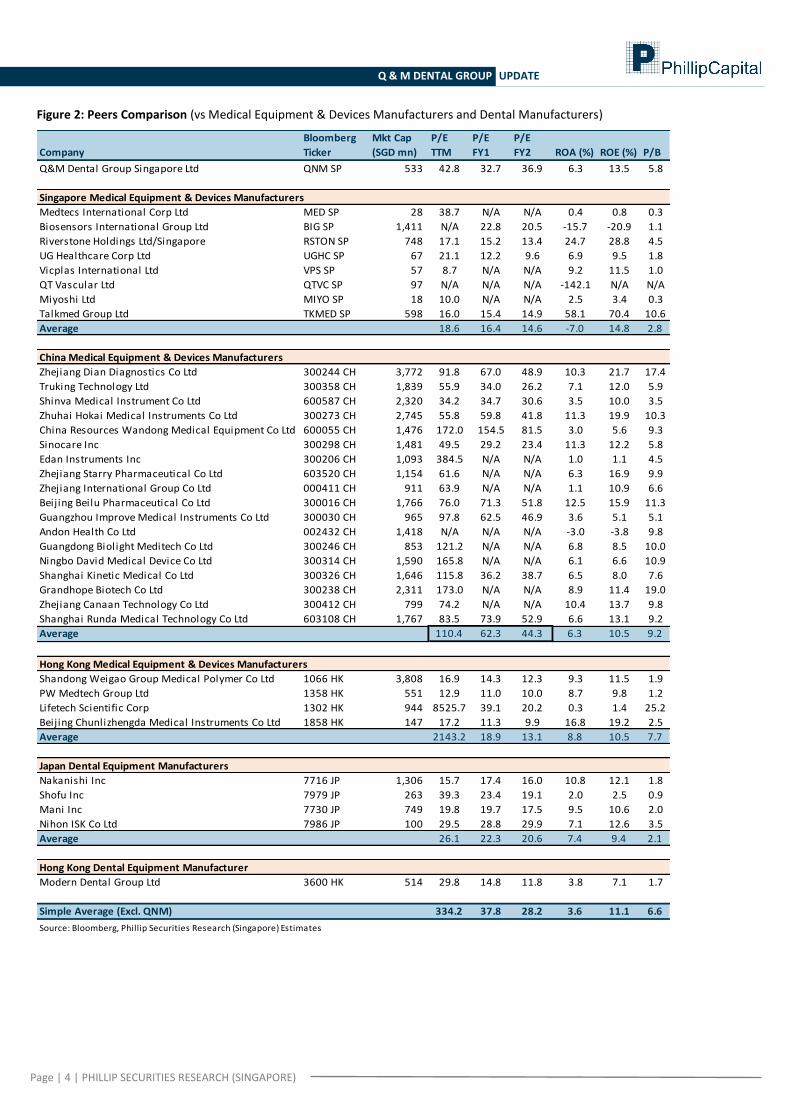
Taking into consideration of: (i) Higher valuation in China markets
Average forward PERs of SGX- and HKex-listed medical equipment & devices manufacturers at 16x and 19x, respectively, compared to that of 62x in China markets.
(ii) Pure dental manufacturing peers trading at 15-29x forward PER (iii) Market liquidity risk premium for Aidite to be listed on the New Third Board It is highly likely that Aidite could fetch a higher valuation in its bourse at home as compared to Q&M’s acquisition PER multiple of 9.7x.
Taking guidance from the Aidite’s Profit Guarantee for the year is RMB19.84 mn, and assuming Q&M intends to maintain equity interest in Aidite at 51%, (i) if Aidite is listed at 15x FY16F PER, Q&M would have a net gain of RMB71 mn (or
S$15 mn); (ii) if Aidite is listed at 30x FY16F PER, Q&M would have a net gain of RMB217 mn (or
S$45 mn); (iii) if Aidite is listed at 60x FY16F PER, Q&M would have a net gain of RMB509 mn (or
S$106 mn).
On the other hand, Q&M could also issue new shares to Aidite and retain all the proceeds to fund its own expansion.
Page | 4 | PHILLIP SECURITIES RESEARCH (SINGAPORE)
Q & M DENTAL GROUP UPDATE
Figure 2: Peers Comparison (vs Medical Equipment & Devices Manufacturers and Dental Manufacturers)
Company
Bloomberg
Ticker
Mkt Cap
(SGD mn)
P/E
TTM
P/E
FY1
P/E
FY2 ROA (%) ROE (%) P/B
Q&M Dental Group Singapore Ltd QNM SP 533 42.8 32.7 36.9 6.3 13.5 5.8
Singapore Medical Equipment & Devices Manufacturers
Medtecs International Corp Ltd MED SP 28 38.7 N/A N/A 0.4 0.8 0.3
Biosensors International Group Ltd BIG SP 1,411 N/A 22.8 20.5 -15.7 -20.9 1.1
Riverstone Holdings Ltd/Singapore RSTON SP 748 17.1 15.2 13.4 24.7 28.8 4.5
UG Healthcare Corp Ltd UGHC SP 67 21.1 12.2 9.6 6.9 9.5 1.8
Vicplas International Ltd VPS SP 57 8.7 N/A N/A 9.2 11.5 1.0
QT Vascular Ltd QTVC SP 97 N/A N/A N/A -142.1 N/A N/A
Miyoshi Ltd MIYO SP 18 10.0 N/A N/A 2.5 3.4 0.3
Talkmed Group Ltd TKMED SP 598 16.0 15.4 14.9 58.1 70.4 10.6
Average 18.6 16.4 14.6 -7.0 14.8 2.8
China Medical Equipment & Devices Manufacturers
Zhejiang Dian Diagnostics Co Ltd 300244 CH 3,772 91.8 67.0 48.9 10.3 21.7 17.4
Truking Technology Ltd 300358 CH 1,839 55.9 34.0 26.2 7.1 12.0 5.9
Shinva Medical Instrument Co Ltd 600587 CH 2,320 34.2 34.7 30.6 3.5 10.0 3.5
Zhuhai Hokai Medical Instruments Co Ltd 300273 CH 2,745 55.8 59.8 41.8 11.3 19.9 10.3
China Resources Wandong Medical Equipment Co Ltd 600055 CH 1,476 172.0 154.5 81.5 3.0 5.6 9.3
Sinocare Inc 300298 CH 1,481 49.5 29.2 23.4 11.3 12.2 5.8
Edan Instruments Inc 300206 CH 1,093 384.5 N/A N/A 1.0 1.1 4.5
Zhejiang Starry Pharmaceutical Co Ltd 603520 CH 1,154 61.6 N/A N/A 6.3 16.9 9.9
Zhejiang International Group Co Ltd 000411 CH 911 63.9 N/A N/A 1.1 10.9 6.6
Beijing Beilu Pharmaceutical Co Ltd 300016 CH 1,766 76.0 71.3 51.8 12.5 15.9 11.3
Guangzhou Improve Medical Instruments Co Ltd 300030 CH 965 97.8 62.5 46.9 3.6 5.1 5.1
Andon Health Co Ltd 002432 CH 1,418 N/A N/A N/A -3.0 -3.8 9.8
Guangdong Biolight Meditech Co Ltd 300246 CH 853 121.2 N/A N/A 6.8 8.5 10.0
Ningbo David Medical Device Co Ltd 300314 CH 1,590 165.8 N/A N/A 6.1 6.6 10.9
Shanghai Kinetic Medical Co Ltd 300326 CH 1,646 115.8 36.2 38.7 6.5 8.0 7.6
Grandhope Biotech Co Ltd 300238 CH 2,311 173.0 N/A N/A 8.9 11.4 19.0
Zhejiang Canaan Technology Co Ltd 300412 CH 799 74.2 N/A N/A 10.4 13.7 9.8
Shanghai Runda Medical Technology Co Ltd 603108 CH 1,767 83.5 73.9 52.9 6.6 13.1 9.2
Average 110.4 62.3 44.3 6.3 10.5 9.2
Hong Kong Medical Equipment & Devices Manufacturers
Shandong Weigao Group Medical Polymer Co Ltd 1066 HK 3,808 16.9 14.3 12.3 9.3 11.5 1.9
PW Medtech Group Ltd 1358 HK 551 12.9 11.0 10.0 8.7 9.8 1.2
Lifetech Scientific Corp 1302 HK 944 8525.7 39.1 20.2 0.3 1.4 25.2
Beijing Chunlizhengda Medical Instruments Co Ltd 1858 HK 147 17.2 11.3 9.9 16.8 19.2 2.5
Average 2143.2 18.9 13.1 8.8 10.5 7.7
Japan Dental Equipment Manufacturers
Nakanishi Inc 7716 JP 1,306 15.7 17.4 16.0 10.8 12.1 1.8
Shofu Inc 7979 JP 263 39.3 23.4 19.1 2.0 2.5 0.9
Mani Inc 7730 JP 749 19.8 19.7 17.5 9.5 10.6 2.0
Nihon ISK Co Ltd 7986 JP 100 29.5 28.8 29.9 7.1 12.6 3.5
Average 26.1 22.3 20.6 7.4 9.4 2.1
Hong Kong Dental Equipment Manufacturer
Modern Dental Group Ltd 3600 HK 514 29.8 14.8 11.8 3.8 7.1 1.7
Simple Average (Excl. QNM) 334.2 37.8 28.2 3.6 11.1 6.6
Source: Bloomberg, Phillip Securities Research (Singapore) Estimates
Page | 5 | PHILLIP SECURITIES RESEARCH (SINGAPORE)
Q & M DENTAL GROUP UPDATE
Updates on M&A Gearing up in China, but slowing down on Singapore and Malaysia.
(a) Continue its roll-up strategy and some add-on acquisitions. Expects slower momentum to of organic grow in Singapore as the market saturates, and targeting strategic location or area where it does not have a presence in, to avoid cannibalization within the same vicinity. One new clinic was opened in Blk 502 Bishan in Mar-16.
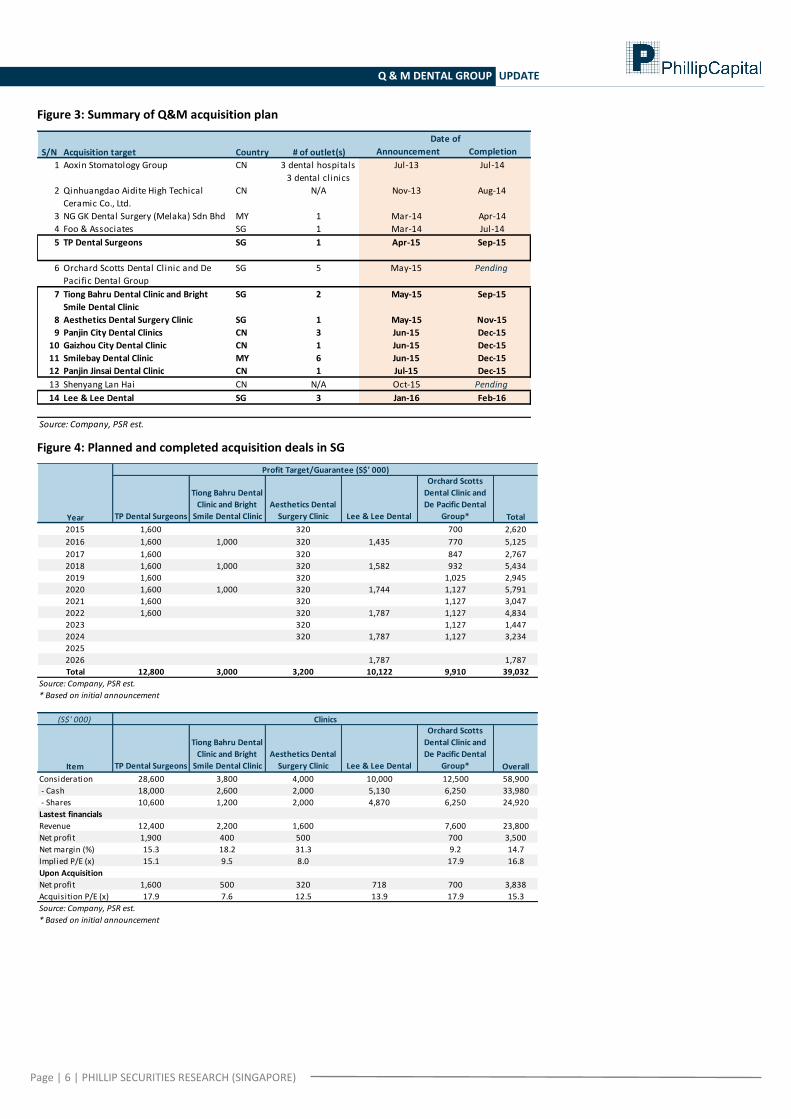
On the other hand, three out of four acquisition deals in Singapore (announced in early-15) were completed. Q&M started its roll-up strategy last year and has successfully acquired TP Dental Surgeons, Aesthetics Dental Surgery Clinics, and Tiong Bahru Dental Clinic and Bright Smile Dental Clinic within 2015 itself. Furthermore, it also managed to close the deal on Lee & Lee Dental within a month after its announcement to acquire. This is a testimony to its commitment and effectiveness in delivering what was announced.
The management shared that the delay in acquiring Orchard Scotts Dental Clinic and De Pacific Dental Group is due to terms renegotiation. It is not peculiar that deals announced will undergo renegotiation. For example, terms for both TP Dental Surgeons and Aesthetics Dental Surgery Clinics were converted to profit guarantee instead of profit target. We are positive that the last deal could be sealed this year with better terms.
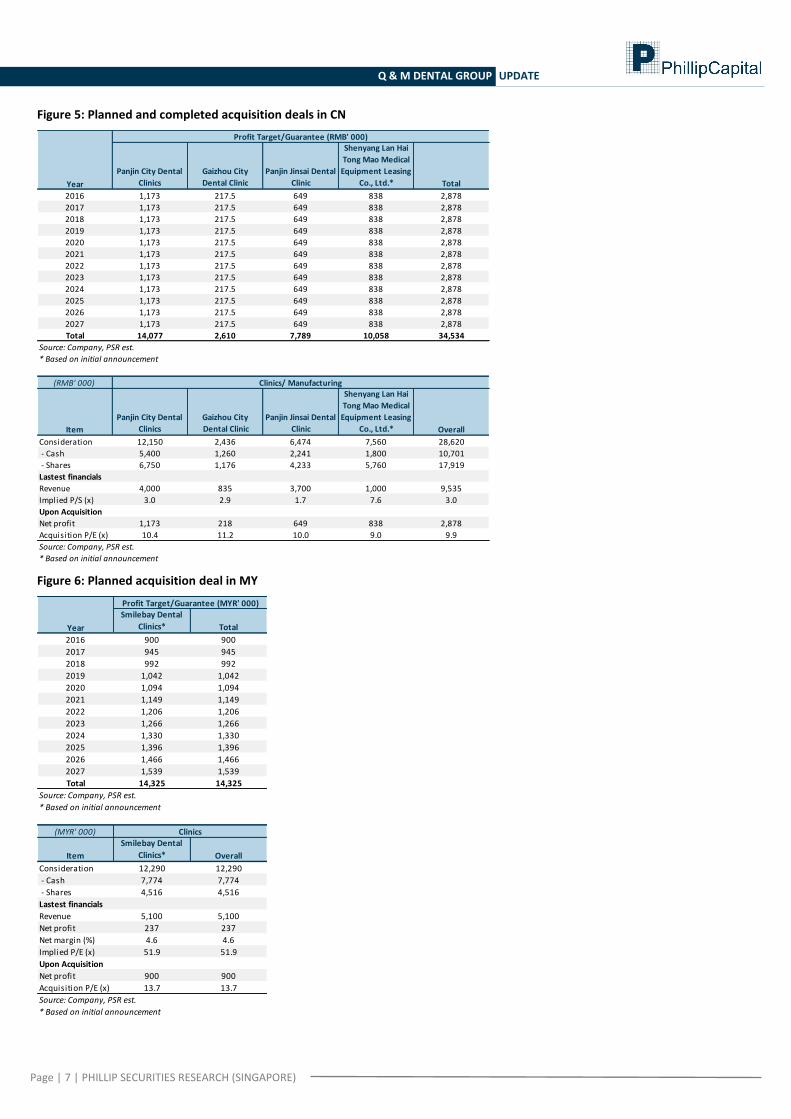
(b) Riding on the wave of China’s evolving health care system. Expects the Group to heighten its effort to expand its footprints in China, particularly in the Northeast region. The Group acquired five clinics in Liaoning Province (Panjin City Dental Clinics, Gaizhou City Dental Clinic and Panjin Jinsai Dental Clinic) in Dec-15 and intends to acquire a medical equipment distribution company (Shenyang Lan Hai Tong Mao Medical Equipment).
The strategic acquisition of 60% stake in Shenyang Lan Hai Tong Mao Medical Equipment allows the Group to add an operational distribution company outside of Singapore and Malaysia, extending its dental equipment and supplies distribution business to China.
The Group noted that it will continue to seek for expansion opportunities, organically and inorganically. It is looking to (i) build up its presence the Northeast region of China, while (ii) leveraging on the current privatization trend of government hospital, preferably, Secondary and Tertiary institutions, or established private hospitals with state insurance benefits, by replicating its 60:40 JV model.
(c) Cautious but remains vested in the Malaysia market. Facing heightened risks in political and foreign exchange rate, the deal on Smilebay Dental Clinics (announced in Jun-15) is still under review.
Page | 6 | PHILLIP SECURITIES RESEARCH (SINGAPORE)
Q & M DENTAL GROUP UPDATE
Figure 3: Summary of Q&M acquisition plan Summary of Q&M acquisition plan
Announcement Completion
1 Aoxin Stomatology Group CN 3 dental hospitals
3 dental clinics
Jul-13 Jul-14
2 Qinhuangdao Aidite High Techical
Ceramic Co., Ltd.
CN N/A Nov-13 Aug-14
3 NG GK Dental Surgery (Melaka) Sdn Bhd MY 1 Mar-14 Apr-14
4 Foo & Associates SG 1 Mar-14 Jul-14
5 TP Dental Surgeons SG 1 Apr-15 Sep-15
6 Orchard Scotts Dental Clinic and De
Pacific Dental Group
SG 5 May-15 Pending
7 Tiong Bahru Dental Clinic and Bright
Smile Dental Clinic
SG 2 May-15 Sep-15
8 Aesthetics Dental Surgery Clinic SG 1 May-15 Nov-15
9 Panjin City Dental Clinics CN 3 Jun-15 Dec-15
10 Gaizhou City Dental Clinic CN 1 Jun-15 Dec-15
11 Smilebay Dental Clinic MY 6 Jun-15 Dec-15
12 Panjin Jinsai Dental Clinic CN 1 Jul-15 Dec-15
13 Shenyang Lan Hai CN N/A Oct-15 Pending
14 Lee & Lee Dental SG 3 Jan-16 Feb-16
Source: Company, PSR est.
# of outlet(s)
Date of
S/N Acquisition target Country
Figure 4: Planned and completed acquisition deals in SG
TP Dental Surgeons
Tiong Bahru Dental
Clinic and Bright
Smile Dental Clinic
Aesthetics Dental
Surgery Clinic Lee & Lee Dental
Orchard Scotts
Dental Clinic and
De Pacific Dental
Group* Total
2015 1,600 320 700 2,620
2016 1,600 1,000 320 1,435 770 5,125
2017 1,600 320 847 2,767
2018 1,600 1,000 320 1,582 932 5,434
2019 1,600 320 1,025 2,945
2020 1,600 1,000 320 1,744 1,127 5,791
2021 1,600 320 1,127 3,047
2022 1,600 320 1,787 1,127 4,834
2023 320 1,127 1,447
2024 320 1,787 1,127 3,234
2025
2026 1,787 1,787
Total 12,800 3,000 3,200 10,122 9,910 39,032
Source: Company, PSR est.
* Based on initial announcement
(S$' 000)
Item TP Dental Surgeons
Tiong Bahru Dental
Clinic and Bright
Smile Dental Clinic
Aesthetics Dental
Surgery Clinic Lee & Lee Dental
Orchard Scotts
Dental Clinic and
De Pacific Dental
Group* Overall
Consideration 28,600 3,800 4,000 10,000 12,500 58,900
- Cash 18,000 2,600 2,000 5,130 6,250 33,980
- Shares 10,600 1,200 2,000 4,870 6,250 24,920
Lastest financials
Revenue 12,400 2,200 1,600 7,600 23,800
Net profit 1,900 400 500 700 3,500
Net margin (%) 15.3 18.2 31.3 9.2 14.7
Implied P/E (x) 15.1 9.5 8.0 17.9 16.8
Upon Acquisition
Net profit 1,600 500 320 718 700 3,838
Acquisition P/E (x) 17.9 7.6 12.5 13.9 17.9 15.3
Source: Company, PSR est.
* Based on initial announcement
Clinics
Profit Target/Guarantee (S$' 000)
Year
Page | 7 | PHILLIP SECURITIES RESEARCH (SINGAPORE)
Q & M DENTAL GROUP UPDATE
Figure 5: Planned and completed acquisition deals in CN
Panjin City Dental
Clinics
Gaizhou City
Dental Clinic
Panjin Jinsai Dental
Clinic
Shenyang Lan Hai
Tong Mao Medical
Equipment Leasing
Co., Ltd.* Total
2016 1,173 217.5 649 838 2,878
2017 1,173 217.5 649 838 2,878
2018 1,173 217.5 649 838 2,878
2019 1,173 217.5 649 838 2,878
2020 1,173 217.5 649 838 2,878
2021 1,173 217.5 649 838 2,878
2022 1,173 217.5 649 838 2,878
2023 1,173 217.5 649 838 2,878
2024 1,173 217.5 649 838 2,878
2025 1,173 217.5 649 838 2,878
2026 1,173 217.5 649 838 2,878
2027 1,173 217.5 649 838 2,878
Total 14,077 2,610 7,789 10,058 34,534
Source: Company, PSR est.
* Based on initial announcement
(RMB' 000)
Item
Panjin City Dental
Clinics
Gaizhou City
Dental Clinic
Panjin Jinsai Dental
Clinic
Shenyang Lan Hai
Tong Mao Medical
Equipment Leasing
Co., Ltd.* Overall
Consideration 12,150 2,436 6,474 7,560 28,620
- Cash 5,400 1,260 2,241 1,800 10,701
- Shares 6,750 1,176 4,233 5,760 17,919
Lastest financials
Revenue 4,000 835 3,700 1,000 9,535
Implied P/S (x) 3.0 2.9 1.7 7.6 3.0
Upon Acquisition
Net profit 1,173 218 649 838 2,878
Acquisition P/E (x) 10.4 11.2 10.0 9.0 9.9
Source: Company, PSR est.
* Based on initial announcement
Profit Target/Guarantee (RMB' 000)
Year
Clinics/ Manufacturing
Figure 6: Planned acquisition deal in MY
Smilebay Dental
Clinics* Total
2016 900 900
2017 945 945
2018 992 992
2019 1,042 1,042
2020 1,094 1,094
2021 1,149 1,149
2022 1,206 1,206
2023 1,266 1,266
2024 1,330 1,330
2025 1,396 1,396
2026 1,466 1,466
2027 1,539 1,539
Total 14,325 14,325
Source: Company, PSR est.
* Based on initial announcement
(MYR' 000)
Item
Smilebay Dental
Clinics* Overall
Consideration 12,290 12,290
- Cash 7,774 7,774
- Shares 4,516 4,516
Lastest financials
Revenue 5,100 5,100
Net profit 237 237
Net margin (%) 4.6 4.6
Implied P/E (x) 51.9 51.9
Upon Acquisition
Net profit 900 900
Acquisition P/E (x) 13.7 13.7
Source: Company, PSR est.
* Based on initial announcement
Clinics
Year
Profit Target/Guarantee (MYR' 000)
Page | 8 | PHILLIP SECURITIES RESEARCH (SINGAPORE)
Q & M DENTAL GROUP UPDATE
Investment Thesis Remains Intact
Favorable demographics. Growing consumer affluence driving demand for high quality private dental healthcare services.
Benefits from government subsidies, which lower patient’s out-of-pocket money when seeking private dental services. For example, Community Health Assist Scheme (CHAS) and Pioneer Generation Scheme in Singapore, and national health insurance scheme (Yibao) in China.
A niche and resilient business. Healthcare may not be immune to economic adversity, but its nature as a basic necessity provides a certain degree of resiliency.
Low dentist to population ratio as compared to the developed countries. According to the Group, developed nations have an average dentist to population ratio of 1:1,000, compared to that of Singapore’s 1:3,300, and Malaysia’s 1:6,000 and China’s 1:10,000.
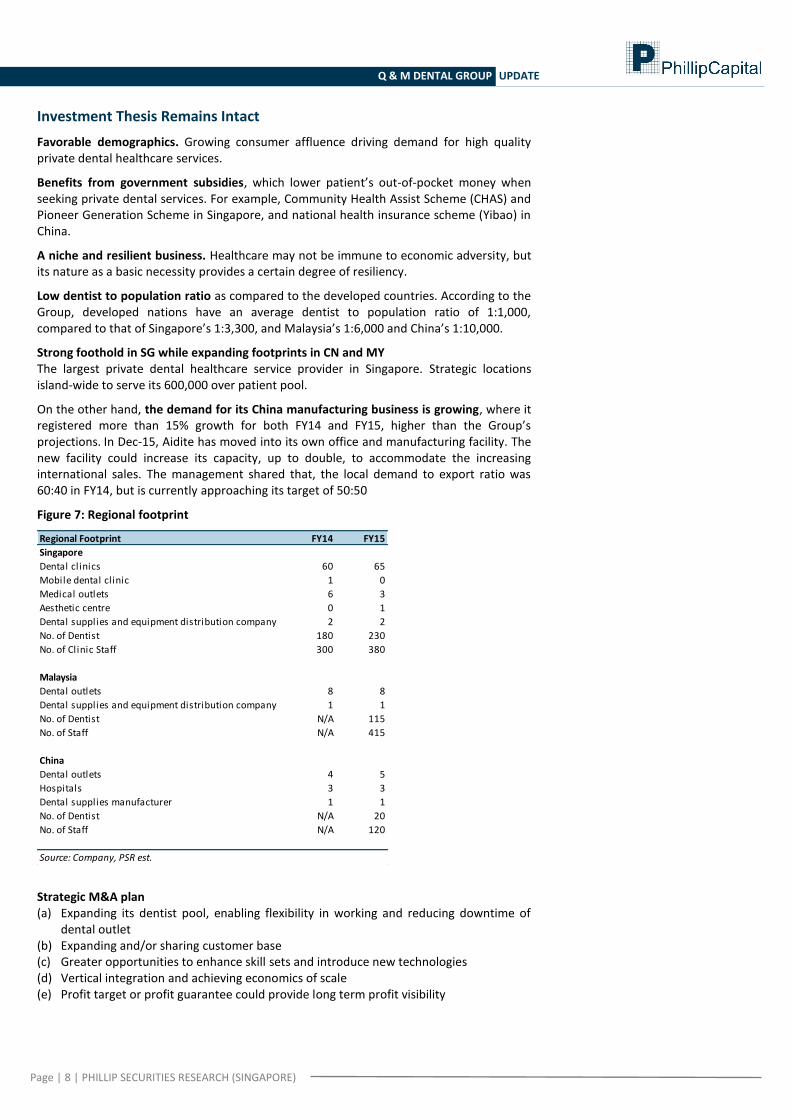
Strong foothold in SG while expanding footprints in CN and MY The largest private dental healthcare service provider in Singapore. Strategic locations island-wide to serve its 600,000 over patient pool.
On the other hand, the demand for its China manufacturing business is growing, where it registered more than 15% growth for both FY14 and FY15, higher than the Group’s projections. In Dec-15, Aidite has moved into its own office and manufacturing facility. The new facility could increase its capacity, up to double, to accommodate the increasing international sales. The management shared that, the local demand to export ratio was 60:40 in FY14, but is currently approaching its target of 50:50
Figure 7: Regional footprint
Regional Footprint FY14 FY15
Singapore
Dental clinics 60 65
Mobile dental clinic 1 0
Medical outlets 6 3
Aesthetic centre 0 1
Dental supplies and equipment distribution company 2 2
No. of Dentist 180 230
No. of Clinic Staff 300 380
Malaysia
Dental outlets 8 8
Dental supplies and equipment distribution company 1 1
No. of Dentist N/A 115
No. of Staff N/A 415
China
Dental outlets 4 5
Hospitals 3 3
Dental supplies manufacturer 1 1
No. of Dentist N/A 20
No. of Staff N/A 120
Source: Company, PSR est.
Strategic M&A plan (a) Expanding its dentist pool, enabling flexibility in working and reducing downtime of
dental outlet (b) Expanding and/or sharing customer base (c) Greater opportunities to enhance skill sets and introduce new technologies (d) Vertical integration and achieving economics of scale (e) Profit target or profit guarantee could provide long term profit visibility
Page | 9 | PHILLIP SECURITIES RESEARCH (SINGAPORE)
Q & M DENTAL GROUP UPDATE
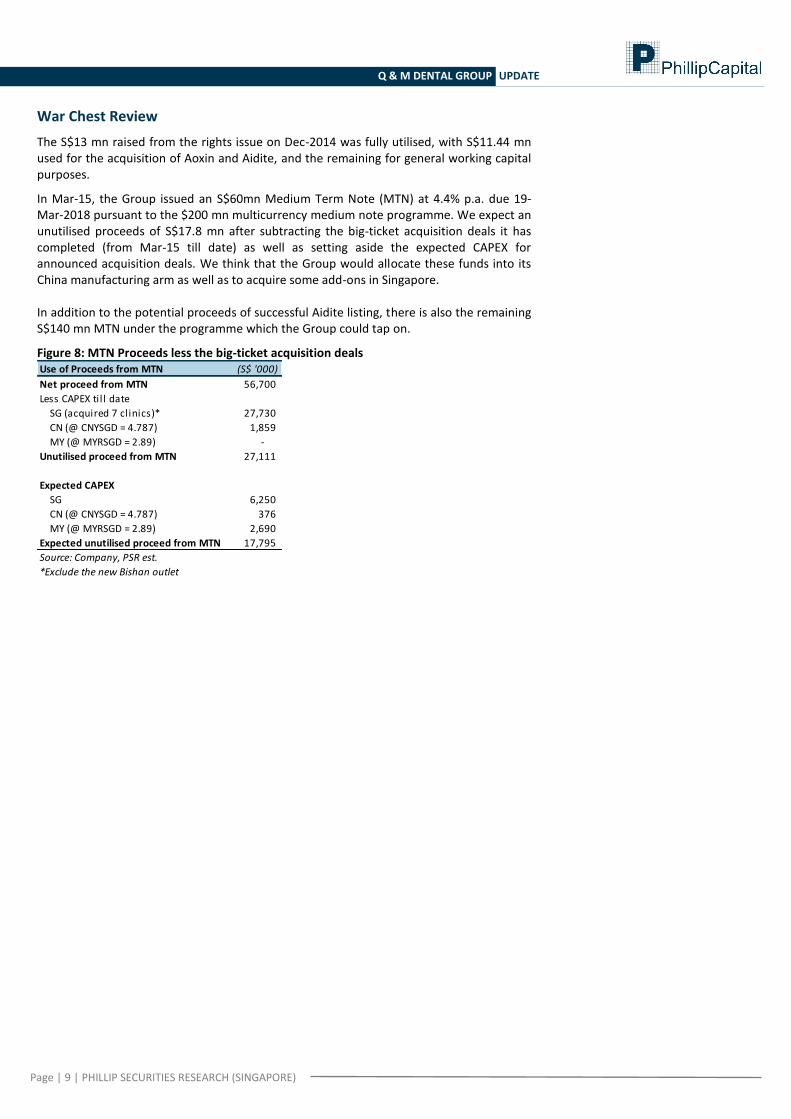
War Chest Review
The S$13 mn raised from the rights issue on Dec-2014 was fully utilised, with S$11.44 mn used for the acquisition of Aoxin and Aidite, and the remaining for general working capital purposes.
In Mar-15, the Group issued an S$60mn Medium Term Note (MTN) at 4.4% p.a. due 19-Mar-2018 pursuant to the $200 mn multicurrency medium note programme. We expect an unutilised proceeds of S$17.8 mn after subtracting the big-ticket acquisition deals it has completed (from Mar-15 till date) as well as setting aside the expected CAPEX for announced acquisition deals. We think that the Group would allocate these funds into its China manufacturing arm as well as to acquire some add-ons in Singapore. In addition to the potential proceeds of successful Aidite listing, there is also the remaining S$140 mn MTN under the programme which the Group could tap on.
Figure 8: MTN Proceeds less the big-ticket acquisition deals Use of Proceeds from MTN (S$ '000)
Net proceed from MTN 56,700
Less CAPEX til l date
SG (acquired 7 clinics)* 27,730
CN (@ CNYSGD = 4.787) 1,859
MY (@ MYRSGD = 2.89) -
Unutilised proceed from MTN 27,111
Expected CAPEX
SG 6,250
CN (@ CNYSGD = 4.787) 376
MY (@ MYRSGD = 2.89) 2,690
Expected unutilised proceed from MTN 17,795
Source: Company, PSR est.
*Exclude the new Bishan outlet
Page | 10 | PHILLIP SECURITIES RESEARCH (SINGAPORE)
Q & M DENTAL GROUP UPDATE
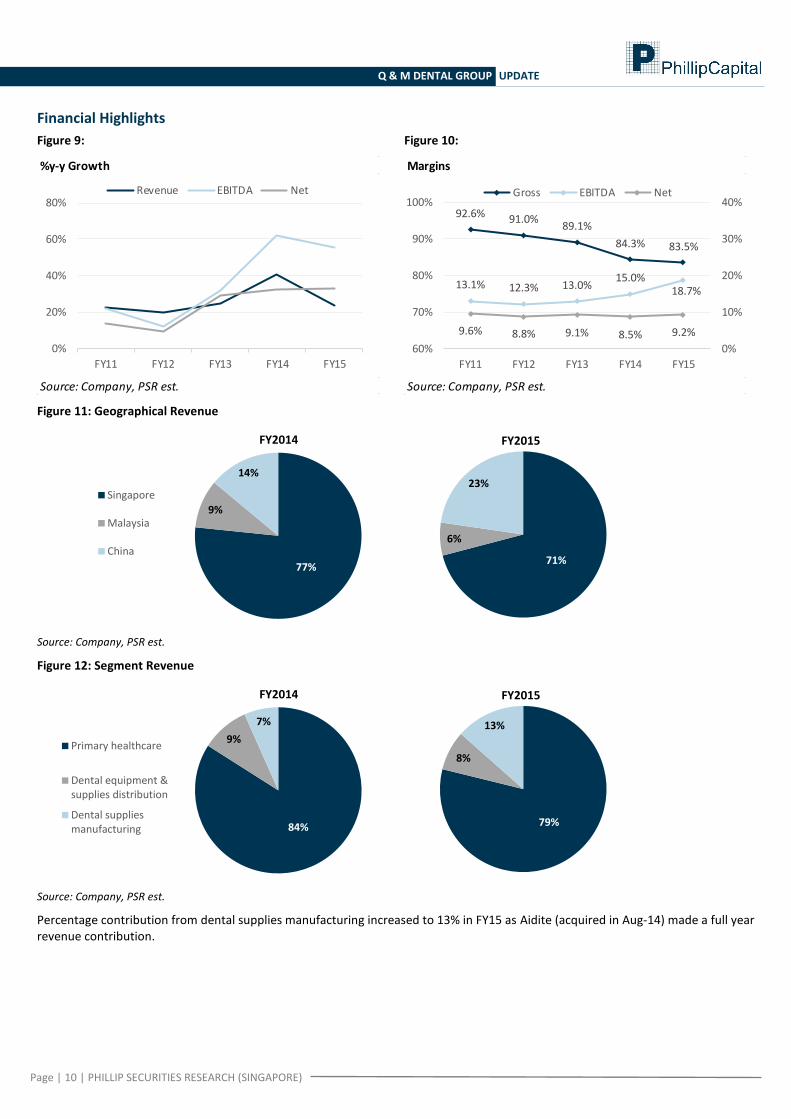
Financial Highlights
Figure 9:
%y-y Growth
Source: Company, PSR est.
FY11 FY12 FY13 FY14 FY15
0%
20%
40%
60%
80%Revenue EBITDA Net
Figure 10:
Margins
Source: Company, PSR est.
92.6% 91.0%89.1%
84.3% 83.5%
13.1% 12.3% 13.0%15.0%
18.7%
9.6% 8.8% 9.1% 8.5% 9.2%
0%
10%
20%
30%
40%
60%
70%
80%
90%
100%
FY11 FY12 FY13 FY14 FY15
Gross EBITDA Net
Figure 11: Geographical Revenue
71%
6%
23%
FY2015
77%
9%
14%
Singapore
Malaysia
China
FY2014
Source: Company, PSR est.
Figure 12: Segment Revenue
79%
8%
13%
FY2015
84%
9%
7%
Primary healthcare
Dental equipment &supplies distribution
Dental suppliesmanufacturing
FY2014
Source: Company, PSR est.
Percentage contribution from dental supplies manufacturing increased to 13% in FY15 as Aidite (acquired in Aug-14) made a full year revenue contribution.
Page | 11 | PHILLIP SECURITIES RESEARCH (SINGAPORE)
Q & M DENTAL GROUP UPDATE
Figure 13:
Segment Gross Margin
Source: Company, PSR est.
93.7% 93.5% 92.9% 92.1% 92.3%
38.8%
24.2%30.3% 28.9%
34.0%
64.6%60.6%
0%
10%
20%
30%
40%
50%
50%
60%
70%
80%
90%
100%
FY11 FY12 FY13 FY14 FY15
Dental & Medical ClinicsDental Supplies ManufacturingDental Equipment & Supplies (RHS)
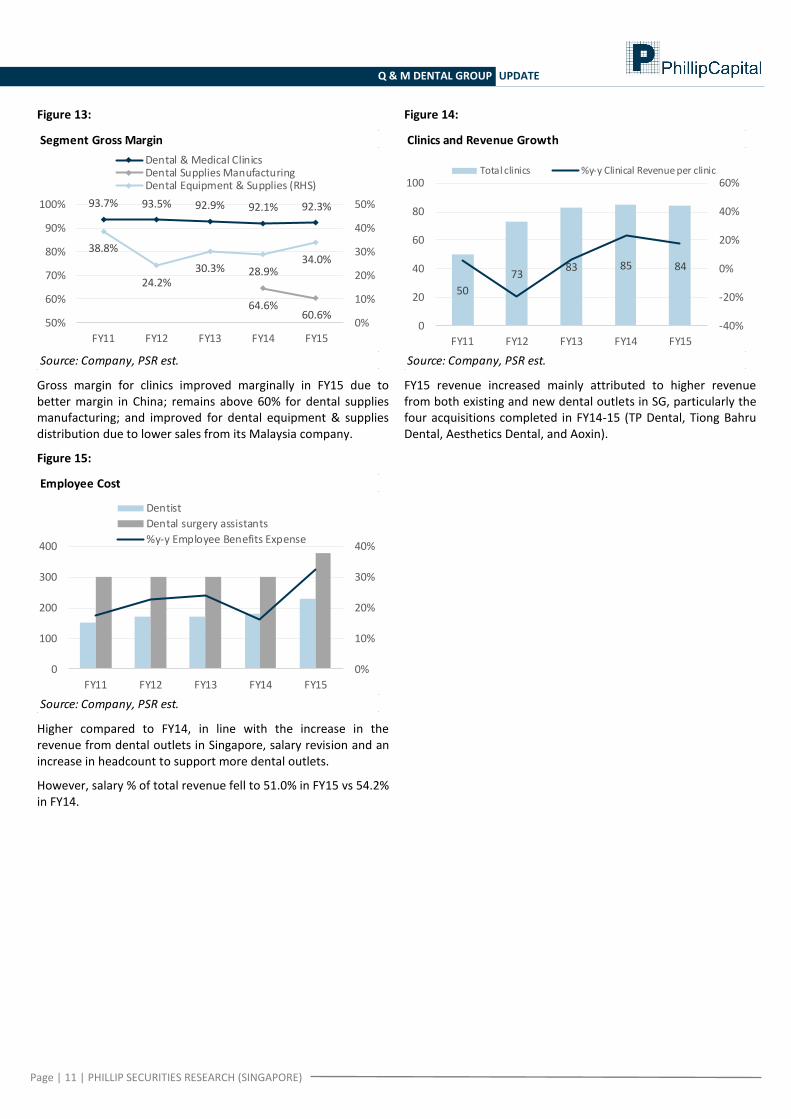
Gross margin for clinics improved marginally in FY15 due to better margin in China; remains above 60% for dental supplies manufacturing; and improved for dental equipment & supplies distribution due to lower sales from its Malaysia company.
Figure 14:
Clinics and Revenue Growth
Source: Company, PSR est.
50
7383 85 84
-40%
-20%
0%
20%
40%
60%
0
20
40
60
80
100
FY11 FY12 FY13 FY14 FY15
Total clinics %y-y Clinical Revenue per clinic
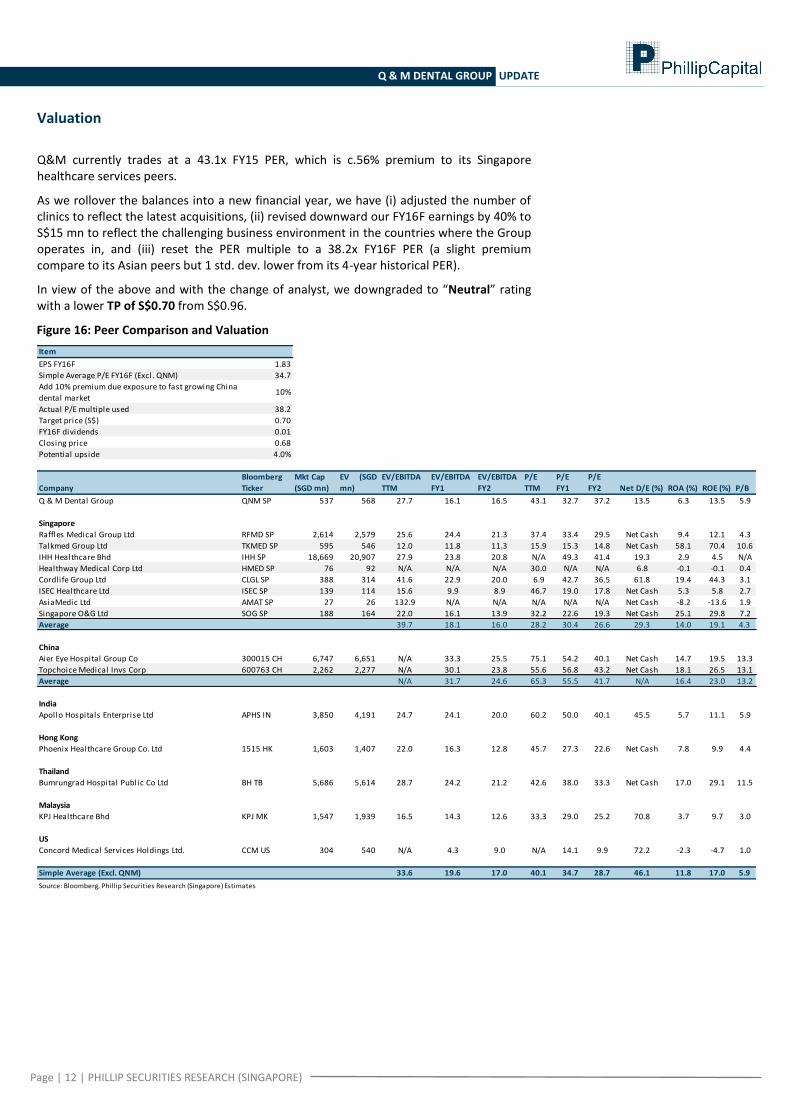
FY15 revenue increased mainly attributed to higher revenue from both existing and new dental outlets in SG, particularly the four acquisitions completed in FY14-15 (TP Dental, Tiong Bahru Dental, Aesthetics Dental, and Aoxin).
Figure 15:
Employee Cost
Source: Company, PSR est.
0%
10%
20%
30%
40%
0
100
200
300
400
FY11 FY12 FY13 FY14 FY15
Dentist
Dental surgery assistants
%y-y Employee Benefits Expense
Higher compared to FY14, in line with the increase in the revenue from dental outlets in Singapore, salary revision and an increase in headcount to support more dental outlets.
However, salary % of total revenue fell to 51.0% in FY15 vs 54.2% in FY14.
Page | 12 | PHILLIP SECURITIES RESEARCH (SINGAPORE)
Q & M DENTAL GROUP UPDATE
Valuation
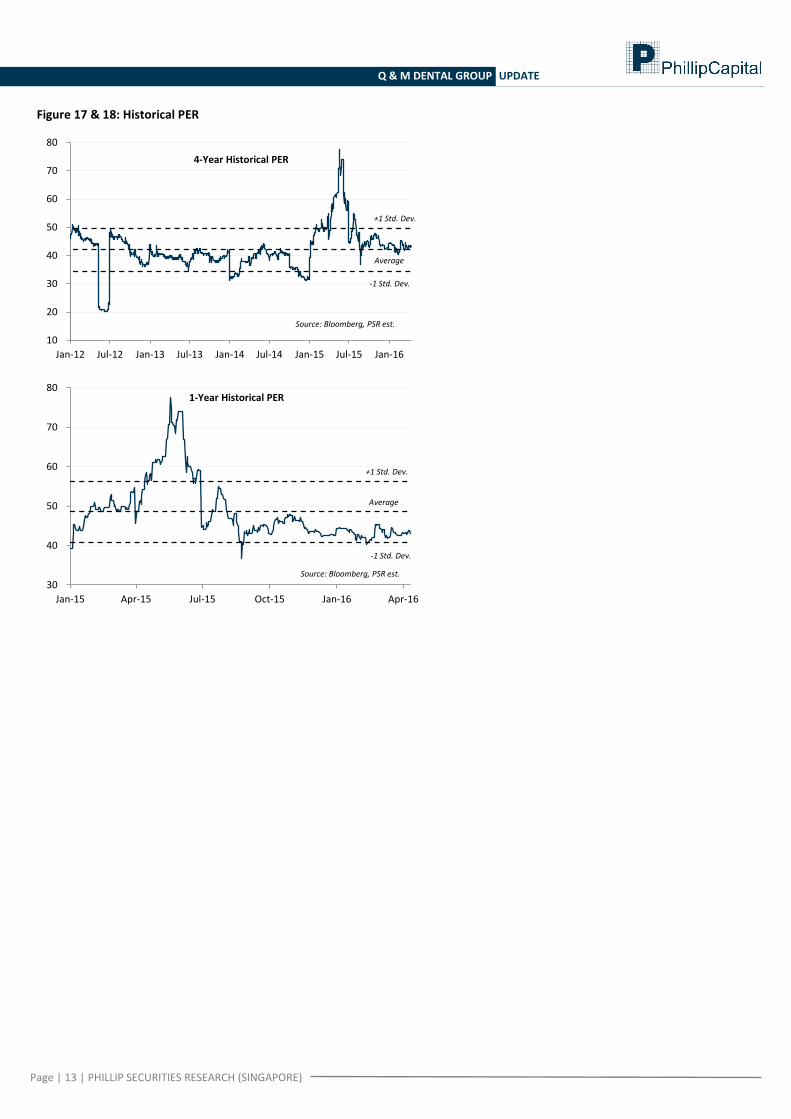
Q&M currently trades at a 43.1x FY15 PER, which is c.56% premium to its Singapore healthcare services peers.
As we rollover the balances into a new financial year, we have (i) adjusted the number of clinics to reflect the latest acquisitions, (ii) revised downward our FY16F earnings by 40% to S$15 mn to reflect the challenging business environment in the countries where the Group operates in, and (iii) reset the PER multiple to a 38.2x FY16F PER (a slight premium compare to its Asian peers but 1 std. dev. lower from its 4-year historical PER).
In view of the above and with the change of analyst, we downgraded to “Neutral” rating with a lower TP of S$0.70 from S$0.96.
Figure 16: Peer Comparison and Valuation
Item
EPS FY16F 1.83
Simple Average P/E FY16F (Excl. QNM) 34.7
Add 10% premium due exposure to fast growing China
dental market10%
Actual P/E multiple used 38.2
Target price (S$) 0.70
FY16F dividends 0.01
Closing price 0.68
Potential upside 4.0%
Company
Bloomberg
Ticker
Mkt Cap
(SGD mn)
EV (SGD
mn)
EV/EBITDA
TTM
EV/EBITDA
FY1
EV/EBITDA
FY2
P/E
TTM
P/E
FY1
P/E
FY2 Net D/E (%) ROA (%) ROE (%) P/B
Q & M Dental Group QNM SP 537 568 27.7 16.1 16.5 43.1 32.7 37.2 13.5 6.3 13.5 5.9
Singapore
Raffles Medical Group Ltd RFMD SP 2,614 2,579 25.6 24.4 21.3 37.4 33.4 29.5 Net Cash 9.4 12.1 4.3
Talkmed Group Ltd TKMED SP 595 546 12.0 11.8 11.3 15.9 15.3 14.8 Net Cash 58.1 70.4 10.6
IHH Healthcare Bhd IHH SP 18,669 20,907 27.9 23.8 20.8 N/A 49.3 41.4 19.3 2.9 4.5 N/A
Healthway Medical Corp Ltd HMED SP 76 92 N/A N/A N/A 30.0 N/A N/A 6.8 -0.1 -0.1 0.4
Cordlife Group Ltd CLGL SP 388 314 41.6 22.9 20.0 6.9 42.7 36.5 61.8 19.4 44.3 3.1
ISEC Healthcare Ltd ISEC SP 139 114 15.6 9.9 8.9 46.7 19.0 17.8 Net Cash 5.3 5.8 2.7
AsiaMedic Ltd AMAT SP 27 26 132.9 N/A N/A N/A N/A N/A Net Cash -8.2 -13.6 1.9
Singapore O&G Ltd SOG SP 188 164 22.0 16.1 13.9 32.2 22.6 19.3 Net Cash 25.1 29.8 7.2
Average 39.7 18.1 16.0 28.2 30.4 26.6 29.3 14.0 19.1 4.3
China
Aier Eye Hospital Group Co 300015 CH 6,747 6,651 N/A 33.3 25.5 75.1 54.2 40.1 Net Cash 14.7 19.5 13.3
Topchoice Medical Invs Corp 600763 CH 2,262 2,277 N/A 30.1 23.8 55.6 56.8 43.2 Net Cash 18.1 26.5 13.1
Average N/A 31.7 24.6 65.3 55.5 41.7 N/A 16.4 23.0 13.2
India
Apollo Hospitals Enterprise Ltd APHS IN 3,850 4,191 24.7 24.1 20.0 60.2 50.0 40.1 45.5 5.7 11.1 5.9
Hong Kong
Phoenix Healthcare Group Co. Ltd 1515 HK 1,603 1,407 22.0 16.3 12.8 45.7 27.3 22.6 Net Cash 7.8 9.9 4.4
Thailand
Bumrungrad Hospital Public Co Ltd BH TB 5,686 5,614 28.7 24.2 21.2 42.6 38.0 33.3 Net Cash 17.0 29.1 11.5
Malaysia
KPJ Healthcare Bhd KPJ MK 1,547 1,939 16.5 14.3 12.6 33.3 29.0 25.2 70.8 3.7 9.7 3.0
US
Concord Medical Services Holdings Ltd. CCM US 304 540 N/A 4.3 9.0 N/A 14.1 9.9 72.2 -2.3 -4.7 1.0
Simple Average (Excl. QNM) 33.6 19.6 17.0 40.1 34.7 28.7 46.1 11.8 17.0 5.9
Source: Bloomberg, Phillip Securities Research (Singapore) Estimates
Page | 13 | PHILLIP SECURITIES RESEARCH (SINGAPORE)
Q & M DENTAL GROUP UPDATE
Figure 17 & 18: Historical PER
10
20
30
40
50
60
70
80
Jan-12 Jul-12 Jan-13 Jul-13 Jan-14 Jul-14 Jan-15 Jul-15 Jan-16
4-Year Historical PER
Source: Bloomberg, PSR est.
-1 Std. Dev.
Average
+1 Std. Dev.
30
40
50
60
70
80
Jan-15 Apr-15 Jul-15 Oct-15 Jan-16 Apr-16
1-Year Historical PER
Source: Bloomberg, PSR est.
Average
+1 Std. Dev.
-1 Std. Dev.
Page | 14 | PHILLIP SECURITIES RESEARCH (SINGAPORE)
Q & M DENTAL GROUP UPDATE
Financials
Income Statement Balance Sheet
Y/E Dec, SGD mn FY12 FY13 FY14 FY15 FY16F FY17F Y/E Dec, SGD mn FY12 FY13 FY14 FY15 FY16F FY17F
Revenue 57.0 71.2 100.3 124.0 167.5 197.8 ASSETS
EBITDA 7.0 9.2 15.1 23.1 33.2 39.9 PPE 17.2 15.4 37.4 34.3 74.1 88.3
Depreciation & Amortisation (1.5) (2.0) (2.8) (3.9) (5.5) (6.9) Others 5.6 10.2 36.4 78.0 78.0 78.0
EBIT 5.5 7.3 12.2 19.2 27.7 33.0 Total non-current assets 22.7 25.6 73.8 112.3 152.1 166.3
Net Finance Inc/(Exp) (0.2) (0.3) (0.5) (2.4) (4.0) (6.5) Accounts receivables 5.6 7.7 16.3 22.8 34.9 42.3
Profit before tax 5.3 7.0 11.8 16.8 23.7 26.5 Cash 18.5 28.7 35.7 64.9 34.6 32.8
Taxation (0.3) (0.5) (1.3) (2.0) (2.6) (2.9) Inventories 1.5 4.1 8.6 11.2 17.2 21.5
Net profit before NCI 5.0 6.5 10.5 14.8 21.1 23.6 Others 1.0 1.5 6.2 5.4 5.4 5.4
Non-control l ing interest (0.0) (0.0) (1.9) (3.4) (6.3) (7.1) Total current assets 26.6 42.1 66.9 104.3 92.1 101.9
Net profit, reported 5.0 6.5 8.6 11.4 14.8 16.5 Total Assets 49.3 67.6 140.7 216.6 244.2 268.2
LIABILITIES
Accounts payables 9.9 10.8 21.0 25.7 41.1 51.5
Short term loans 0.6 0.2 3.8 15.5 15.5 15.5
Others 0.1 0.1 1.0 0.6 0.6 0.6
Total current liabilities 10.6 11.1 25.8 41.8 57.2 67.6
Long term loans 8.7 8.7 28.5 64.7 64.7 64.7
Others 1.1 1.2 1.3 1.8 1.8 1.8
Total non-current liabilities 9.8 9.9 29.8 66.5 66.5 66.5
Per share data (SGD Cents) Total Liabilities 20.4 20.9 55.6 108.4 123.7 134.1
Y/E Dec FY12 FY13 FY14 FY15 FY16F FY17F
EPS, reported 0.91 0.93 1.20 1.46 1.83 2.01 EQUITY
DPS 0.68 1.10 0.73 0.84 1.10 1.21 Non-control l ing interests 0.1 0.6 8.4 16.1 22.4 29.5
BVPS 5.24 6.65 10.72 11.81 12.15 12.77 Shareholder Equity 28.8 46.1 76.6 92.1 98.0 104.6
Cash Flow Valuation Ratios
Y/E Dec, SGD mn FY12 FY13 FY14 FY15 FY16F FY17F Y/E Dec FY12 FY13 FY14 FY15 FY16F FY17F
CFO P/E (X), adj. 89.4 34.8 29.2 32.7 37.2 33.8
Profit before tax 5.3 7.0 11.8 16.8 23.7 26.5 P/B (X) 15.5 4.9 3.3 4.0 5.6 5.3
Depreciation & Amortisation 1.5 2.0 2.8 3.9 5.5 6.9 EV/EBITDA (X), adj. 63.7 24.4 16.6 16.1 16.5 14.0
WC changes 2.1 (3.2) (3.2) (6.7) (2.7) (1.3) Dividend Yield (%) 0.8% 3.4% 2.1% 1.8% 1.6% 1.8%
Net finance inc/(exp) 0.2 0.3 0.5 2.4 4.0 6.5 Growth & Margins (%)
Tax pa id (0.2) (0.5) (0.6) (2.6) (2.6) (2.9) Growth
Others (0.2) (1.4) (0.7) (3.0) 0.0 0.0 Revenue 19.4% 24.7% 40.9% 23.6% 35.1% 18.1%
Cashflow from ops 8.7 4.1 10.6 10.9 27.9 35.7 EBITDA 12.0% 31.6% 63.2% 53.6% 43.5% 20.1%
CFI EBIT 7.5% 32.0% 68.8% 56.8% 44.1% 19.1%
CAPEX, net (10.4) 1.8 (17.3) 1.5 (17.3) (21.2) Net profi t, adj. 9.2% 29.2% 32.6% 33.1% 29.4% 11.9%
Others (0.5) (5.3) (21.6) (21.5) (27.6) 0.3 Margins
Cashflow from investments (11.0) (3.6) (38.8) (20.1) (45.0) (20.8) EBITDA margin 12.3% 13.0% 15.0% 18.7% 19.8% 20.2%
CFF EBIT margin 9.6% 10.2% 12.2% 15.5% 16.5% 16.7%
Share i ssuance, net 0.0 16.8 12.9 (0.8) 0.0 0.0 Net profi t margin 8.8% 9.1% 8.5% 9.2% 8.8% 8.3%
Loans , net of repayments 8.0 (0.7) 29.2 (12.5) 0.0 0.0 Key Ratios
Dividends (3.7) (6.1) (6.5) (5.8) (8.9) (9.9) ROE (%) 17.8% 17.2% 14.0% 13.5% 15.5% 16.3%
Others 2.8 (0.3) (0.4) 57.4 (4.4) (6.8) ROA (%) 11.7% 11.1% 8.2% 6.4% 6.4% 6.4%
Cashflow from financing 7.1 9.7 35.1 38.4 (13.2) (16.7)
Net change in cash 4.8 10.3 6.9 29.2 (30.3) (1.8) Net Debt / (Cash) (9.2) (19.8) (3.3) 15.3 45.6 47.4
CCE, end 18.5 28.7 35.6 64.9 34.6 32.8 Net Gearing (X) Net Cash Net Cash Net Cash 14.1% 37.8% 35.3%
Source: Company, Phi l l ip Securi ties Research (Singapore) Estimates
*Forward multiples & yields based on current market price; his torica l multiples & yields based on his torica l market price.
Page | 15 | PHILLIP SECURITIES RESEARCH (SINGAPORE)
Q & M DENTAL GROUP UPDATE
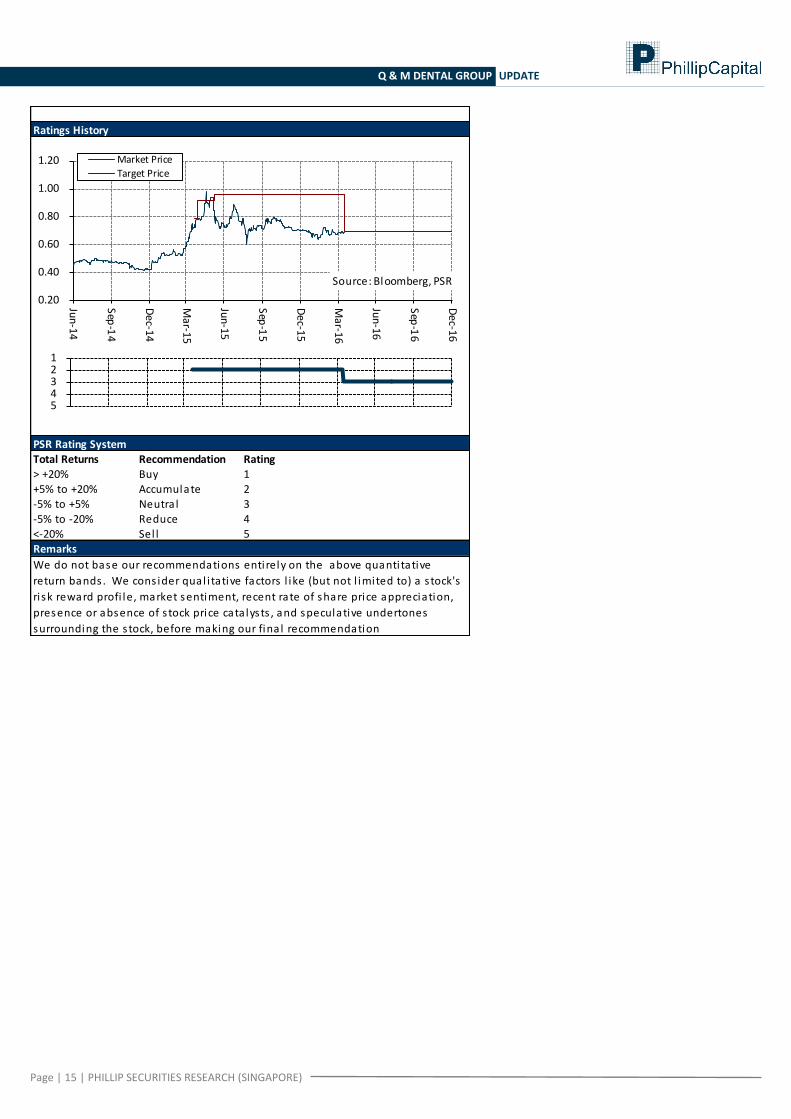
Total Returns Recommendation Rating> +20% Buy 1+5% to +20% Accumulate 2-5% to +5% Neutra l 3-5% to -20% Reduce 4<-20% Sel l 5
We do not base our recommendations entirely on the above quanti tative
return bands . We cons ider qual i tative factors l ike (but not l imited to) a s tock's
ri sk reward profi le, market sentiment, recent rate of share price appreciation,
presence or absence of s tock price catalysts , and speculative undertones
surrounding the s tock, before making our fina l recommendation
Ratings History
PSR Rating System
Remarks
1 2 3 4 5
0.20
0.40
0.60
0.80
1.00
1.20
Jun
-14
Sep-1
4
Dec-14
Mar-15
Jun-15
Sep-1
5
Dec-1
5
Mar-1
6
Jun-16
Sep-1
6
Dec-16
Source: Bloomberg, PSR
Market Price
Target Price
Page | 16 | PHILLIP SECURITIES RESEARCH (SINGAPORE)
Q & M DENTAL GROUP UPDATE
Contact Information (Singapore Research Team) Management Research Operations Officer Jacky Lee Chee Waiy (CEO & Head, Research) - [email protected]
Mohamed Ghazali - [email protected]
Consumer | Healthcare Infrastructure | REITs (Hospitality) Macro Soh Lin Sin - [email protected] Peter Ng - [email protected] Pei Sai Teng - [email protected] Transport | REITs (Industrial) REITs (Commercial, Retail, Healthcare) | Property Technical Analysis
Richard Leow, CFTe, FRM - [email protected]
Dehong Tan - [email protected] Jeremy Ng - [email protected]
Banking and Finance US Equity Oil & Gas | Energy Jeremy Teong - [email protected] Ho Kang Wei - [email protected] Chen Guangzhi – [email protected]
Contact Information (Regional Member Companies) SINGAPORE
Phillip Securities Pte Ltd Raffles City Tower
250, North Bridge Road #06-00 Singapore 179101 Tel +65 6533 6001 Fax +65 6535 6631
Website: www.poems.com.sg
MALAYSIA Phillip Capital Management Sdn Bhd
B-3-6 Block B Level 3 Megan Avenue II, No. 12, Jalan Yap Kwan Seng, 50450
Kuala Lumpur Tel +603 2162 8841 Fax +603 2166 5099
Website: www.poems.com.my
HONG KONG Phillip Securities (HK) Ltd
11/F United Centre 95 Queensway Hong Kong
Tel +852 2277 6600 Fax +852 2868 5307
Websites: www.phillip.com.hk
JAPAN
Phillip Securities Japan, Ltd. 4-2 Nihonbashi Kabuto-cho Chuo-ku,
Tokyo 103-0026 Tel +81-3 3666 2101 Fax +81-3 3666 6090
Website: www.phillip.co.jp
INDONESIA PT Phillip Securities Indonesia
ANZ Tower Level 23B, Jl Jend Sudirman Kav 33A Jakarta 10220 – Indonesia
Tel +62-21 5790 0800 Fax +62-21 5790 0809
Website: www.phillip.co.id
CHINA Phillip Financial Advisory (Shanghai) Co Ltd
No 550 Yan An East Road, Ocean Tower Unit 2318,
Postal code 200001 Tel +86-21 5169 9200 Fax +86-21 6351 2940
Website: www.phillip.com.cn
THAILAND Phillip Securities (Thailand) Public Co. Ltd
15th Floor, Vorawat Building, 849 Silom Road, Silom, Bangrak,
Bangkok 10500 Thailand Tel +66-2 6351700 / 22680999
Fax +66-2 22680921 Website www.phillip.co.th
FRANCE King & Shaxson Capital Limited
3rd Floor, 35 Rue de la Bienfaisance 75008 Paris France
Tel +33-1 45633100 Fax +33-1 45636017
Website: www.kingandshaxson.com
UNITED KINGDOM King & Shaxson Capital Limited
6th Floor, Candlewick House, 120 Cannon Street, London, EC4N 6AS
Tel +44-20 7426 5950 Fax +44-20 7626 1757
Website: www.kingandshaxson.com
UNITED STATES Phillip Futures Inc
141 W Jackson Blvd Ste 3050 The Chicago Board of Trade Building
Chicago, IL 60604 USA Tel +1-312 356 9000 Fax +1-312 356 9005
Website: www.phillipusa.com
AUSTRALIA Phillip Capital Limited
Level 12, 15 William Street, Melbourne, Victoria 3000, Australia
Tel +61-03 9629 8288 Fax +61-03 9629 8882
Website: www.phillipcapital.com.au
SRI LANKA Asha Phillip Securities Limited 2nd Floor, Lakshmans Building,
No. 321, Galle Road, Colombo 03, Sri Lanka Tel: (94) 11 2429 100 Fax: (94) 11 2429 199
Website: www.ashaphillip.net
INDIA PhillipCapital (India) Private Limited
No.1, 18th Floor, Urmi Estate 95, Ganpatrao Kadam Marg
Lower Parel West, Mumbai 400-013 Maharashtra, India
Tel: +91-22-2300 2999 / Fax: +91-22-2300 2969 Website: www.phillipcapital.in
TURKEY PhillipCapital Menkul Degerler
Dr. Cemil Bengü Cad. Hak Is Merkezi No. 2 Kat. 6A Caglayan 34403 Istanbul, Turkey
Tel: 0212 296 84 84 Fax: 0212 233 69 29
Website: www.phillipcapital.com.tr
DUBAI Phillip Futures DMCC
Member of the Dubai Gold and Commodities Exchange (DGCX)
Unit No 601, Plot No 58, White Crown Bldg, Sheikh Zayed Road, P.O.Box 212291
Dubai-UAE Tel: +971-4-3325052 / Fax: + 971-4-3328895
CAMBODIA
Phillip Bank Plc Ground Floor of B-Office Centre,#61-64, Norodom Blvd Corner Street 306,Sangkat Boeung Keng Kang 1, Khan Chamkamorn,
Phnom Penh, Cambodia Tel: 855 (0) 7796 6151/855 (0) 1620 0769
Website: www.phillipbank.com.kh
Page | 17 | PHILLIP SECURITIES RESEARCH (SINGAPORE)
Q & M DENTAL GROUP UPDATE
Important Information
This report is prepared and/or distributed by Phillip Securities Research Pte Ltd ("Phillip Securities Research"), which is a holder of a financial adviser’s license under the Financial Advisers Act, Chapter 110 in Singapore.
By receiving or reading this report, you agree to be bound by the terms and limitations set out below. Any failure to comply with these terms and limitations may constitute a violation of law. This report has been provided to you for personal use only and shall not be reproduced, distributed or published by you in whole or in part, for any purpose. If you have received this report by mistake, please delete or destroy it, and notify the sender immediately.
The information and any analysis, forecasts, projections, expectations and opinions (collectively, the “Research”) contained in this report has been obtained from public sources which Phillip Securities Research believes to be reliable. However, Phillip Securities Research does not make any representation or warranty, express or implied that such information or Research is accurate, complete or appropriate or should be relied upon as such. Any such information or Research contained in this report is subject to change, and Phillip Securities Research shall not have any responsibility to maintain or update the information or Research made available or to supply any corrections, updates or releases in connection therewith.
Any opinions, forecasts, assumptions, estimates, valuations and prices contained in this report are as of the date indicated and are subject to change at any time without prior notice. Past performance of any product referred to in this report is not indicative of future results.
This report does not constitute, and should not be used as a substitute for, tax, legal or investment advice. This report should not be relied upon exclusively or as authoritative, without further being subject to the recipient’s own independent verification and exercise of judgment. The fact that this report has been made available constitutes neither a recommendation to enter into a particular transaction, nor a representation that any product described in this report is suitable or appropriate for the recipient. Recipients should be aware that many of the products, which may be described in this report involve significant risks and may not be suitable for all investors, and that any decision to enter into transactions involving such products should not be made, unless all such risks are understood and an independent determination has been made that such transactions would be appropriate. Any discussion of the risks contained herein with respect to any product should not be considered to be a disclosure of all risks or a complete discussion of such risks.
Nothing in this report shall be construed to be an offer or solicitation for the purchase or sale of any product. Any decision to purchase any product mentioned in this report should take into account existing public information, including any registered prospectus in respect of such product.
Phillip Securities Research, or persons associated with or connected to Phillip Securities Research, including but not limited to its officers, directors, employees or persons involved in the issuance of this report, may provide an array of financial services to a large number of corporations in Singapore and worldwide, including but not limited to commercial / investment banking activities (including sponsorship, financial advisory or underwriting activities), brokerage or securities trading activities. Phillip Securities Research, or persons associated with or connected to Phillip Securities Research, including but not limited to its officers, directors, employees or persons involved in the issuance of this report, may have participated in or invested in transactions with the issuer(s) of the securities mentioned in this report, and may have performed services for or solicited business from such issuers. Additionally, Phillip Securities Research, or persons associated with or connected to Phillip Securities Research, including but not limited to its officers, directors, employees or persons involved in the issuance of this report, may have provided advice or investment services to such companies and investments or related investments, as may be mentioned in this report.
Phillip Securities Research or persons associated with or connected to Phillip Securities Research, including but not limited to its officers, directors, employees or persons involved in the issuance of this report may, from time to time maintain a long or short position in securities referred to herein, or in related futures or options, purchase or sell, make a market in, or engage in any other transaction involving such securities, and earn brokerage or other compensation in respect of the foregoing. Investments will be denominated in various currencies including US dollars and Euro and thus will be subject to any fluctuation in exchange rates between US dollars and Euro or foreign currencies and the currency of your own jurisdiction. Such fluctuations may have an adverse effect on the value, price or income return of the investment.
To the extent permitted by law, Phillip Securities Research, or persons associated with or connected to Phillip Securities Research, including but not limited to its officers, directors, employees or persons involved in the issuance of this report, may at any time engage in any of the above activities as set out above or otherwise hold an interest, whether material or not, in respect of companies and investments or related investments, which may be mentioned in this report. Accordingly, information may be available to Phillip Securities Research, or persons associated with or connected to Phillip Securities Research, including but not limited to its officers, directors, employees or persons involved in the issuance of this report, which is not reflected in this report, and Phillip Securities Research, or persons associated with or connected to Phillip Securities Research, including but not limited to its officers, directors, employees or persons involved in the issuance of this report, may, to the extent permitted by law, have acted upon or used the information prior to or immediately following its publication. Phillip Securities Research, or persons associated with or connected to Phillip Securities Research, including but not limited its officers, directors, employees or persons involved in the issuance of this report, may have issued other material that is inconsistent with, or reach different conclusions from, the contents of this report.
The information, tools and material presented herein are not directed, intended for distribution to or use by, any person or entity in any jurisdiction or country where such distribution, publication, availability or use would be contrary to the applicable law or regulation or which would subject Phillip Securities Research to any registration or licensing or other requirement, or penalty for contravention of such requirements within such jurisdiction.
This report is intended for general circulation only and does not take into account the specific investment objectives, financial situation or particular needs of any particular person. The products mentioned in this report may not be suitable for all investors and a person receiving or reading this report should seek advice from a professional and financial adviser regarding the legal, business, financial, tax and other aspects including the suitability of such products, taking into account the specific investment objectives, financial situation or particular needs of that person, before making a commitment to invest in any of such products.
This report is not intended for distribution, publication to or use by any person in any jurisdiction outside of Singapore or any other jurisdiction as Phillip Securities Research may determine in its absolute discretion. IMPORTANT DISCLOSURES FOR INCLUDED RESEARCH ANALYSES OR REPORTS OF FOREIGN RESEARCH HOUSES Where the report contains research analyses or reports from a foreign research house, please note:
(i) recipients of the analyses or reports are to contact Phillip Securities Research (and not the relevant foreign research house) in Singapore at 250 North Bridge Road, #06-00 Raffles City Tower, Singapore 179101, telephone number +65 6533 6001, in respect of any matters arising from, or in connection with, the analyses or reports; and
(ii) to the extent that the analyses or reports are delivered to and intended to be received by any person in Singapore who is not an accredited investor, expert investor or institutional investor, Phillip Securities Research accepts legal responsibility for the contents of the analyses or reports.