Embed Size (px)
Citation preview

Q. 92 – R. 38
COMMISSION INTERNATIONALEDES GRANDS BARRAGES
-------VINGT-QUATRIÈME CONGRÈS
DES GRANDS BARRAGESKyoto, Juin 2012
-------
PERFORMANCE OF MIWA DAM SEDIMENT BYPASS TUNNEL: EVALUATION OF UPSTREAM AND DOWNSTREAM STATE AND
BYPASSING EFFICIENCY 1
Tetsuya SUMIProfessor, Dr. of Eng., DPRI, Kyoto University
Sameh A. KANTOUSHSenior Researcher, Dr. of Eng., DPRI, Kyoto University
Shoji SUZUKIDirector, Mibu River Comprehensive Development Work Office, MLIT
JAPAN
1. INTRODUCTION
Japan and Switzerland are the leading countries for sediment bypass tunnels (SBPT) technique. Currently in Japan, there are 3 SBPT in operation and 4 planned [1]. In Switzerland, there are 5 SBPT in operation and one of Solis dam under constructions [2], [3]. Worldwide, limited numbers of sediment bypass tunnels have been constructed because of topographical, hydrological or economical conditions. In Japan, sediment bypass tunnels have been studied most exhaustively. Although this technique involves high cost caused by tunnel construction, there are many advantages such that it is applicable to existing dams; it does not involve drawdown of reservoir water level and therefore no storage capacity loss; and it has relatively small impact on environment because sediment is discharged during natural flood events compared to sediment drawdown flushing which discharge accumulated sediment in a short period.
1 La performance de la galerie de dérivation des sédiments au barrage de Miwa: évaluation de l'état en amont, aval, et efficacité des dérivations.
576
Q. 95 – R. 38
The subjects of designing sediment bypass tunnels are to secure the safety of sediment transport flow inside tunnels and to take countermeasures for abrasion damages on the channel bed surface. Among factors that significantly relate to these problems are grain size, tunnel’s cross-sectional area, channel slope, and design velocity. Table 1 shows examples of existing and under construction sediment bypass tunnels in Japan and Switzerland. In Switzerland, five bypass tunnels have been constructed and proved an effective means to counter reservoir sedimentation [2]. It is found that problems may arise with tunnel abrasion, particularly if the sediment has a considerable quartz rich component.
In Japan, sediment bypass tunnels at Nunobiki Dam, completed in 1908, and at Asahi Dam, completed in 1995, have been successfully introduced to realize sustainable reservoir management [4]. Sediment bypasses at Miwa Dam have been completed in 2004 [5], ones at Matsukawa Dam and Koshibu Dam are under construction, and one of Sakuma Dam is under-planning. For the purpose of designing these bypass systems, hydraulic characteristics of tunnel and diversion weir have been studied ([6], [7], [8]).
Table 1Sediment Bypass Tunnels in Japan and Switzerland
Galeries de dérivation des sédiments au Japon et en Suisse
4 days/yr91101.45723.8×4.5Horseshoe1961SwitzerlandRuncahez10
1~5 days/yr~148044503.5×3.3Horseshoe1983SwitzerlandRempen9
~200days/yr10~152203280A= 21.0m2Horseshoe1922SwitzerlandPfaffensprung8
2~5days/yr911021,8002r = 6.2Horseshoe1974SwitzerlandPalagnedra7
10days/yr9742.6360r = 2.8Circular1976SwitzerlandEgshi6
-937023.9822r = 7.9HorseshoeUnder constr.JapanKoshibu5
-1520041,4175.2×5.2HoodUnder constr.JapanMatsukawa4
2 times/yr10.830014,3002r = 7.8Horseshoe2004JapanMiwa3
13 times/yr11.41402.92,3503.8×3.8Hood1998JapanAsahi2
--391.32582.9×2.9Hood1908JapanNunobiki1
Operation Frequency
Design Velocity
(m/s)
Design Discharge
(m3/s)
General Slope(%)
Tunnel Length
(m)
Tunnel Cross
Section (B×H(m))
Tunnel Shape
Tunnel Completion
CountryName of DamNo
2. MIWA DAM SEDIMENT MANAGEMENT TECHNIQUE
2.1. OUTLINES OF MIWA DAM
Miwa dam sediment bypass tunnel is the first experience for multipurpose dams in Japan, which diverts mainly suspended sediment. Miwa dam was constructed in 1959 by the Ministry of Construction, located on the Mibu River, a tributary of the Tenryu. Miwa Dam is composed of a 69 m high gravity concrete
577
Q. 92 – R. 38
dam and 29.95 MCM gross storage reservoir volumes with 311 km2 catchment area. The flood control plan at the time of constructing Miwa Dam assumed that the design flood discharge for 100-year return period to be 1200 m3/s and the maximum outflow to be 300m3/s [5]. Also, original sedimentation capacity of about 6.6 million m3 was planned and secured, which corresponds to a 40-year sedimentation volume.
In August 1959, right before the completion of construction, a heavy flood which recorded flood discharge that almost equal to the design flood discharge with a maximum flow of 1,182 m3/s and large volume of sediment depositionoccurred. After that, sediment excavation works from reservoir have been startedfrom 1965. In 1982, the largest flood of Mibu River that recorded the flood discharge of 1321 m3/s exceeding the design flood discharge at the Miwa Dam occurred, resulting in about 4.3 million m3 new sedimentation only within this year, and the succeeding flood in 1983 delivered of about 1.6 million m3 sedimentation. Such repeated floods have brought an enormous quantity of sediment into the Miwa Dam reservoir, which has amounted up to 20 million m3 since the completion of the dam.
Check Dam
Mibu Weir (Diversion Weir)
Miwa Dam Bypass Tunnel)
Outlet of Bypass Tunnel
Miwa Dam
Reservoir of Miwa Dam
Entrance of the Bypass Tunnel
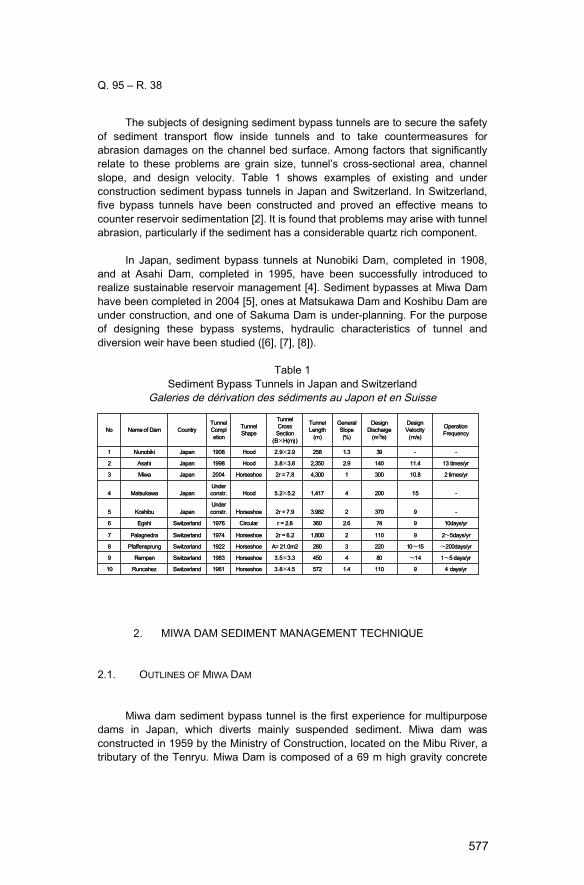
Fig. 1Outline of permanent sediment management measures in the Miwa Dam
Schéma des mesures permanentes de gestion des sédiments au barrage de Miwa
Based on these conditions, Mibu River Comprehensive Development Project including redevelopment of Miwa dam and another construction of Tokusa Dam located upstream of Miwa Dam has been started since 1989. In 1994, the
578
Q. 95 – R. 38
check dam was completed as a tentative facility of Miwa Dam, and the large volume of excavation of the reservoir sediment started in 2000. In 2001, construction of the permanent sediment management facilities was commencedand a sediment bypass tunnel and a diversion weir were completed in 2005. An overview of the present and future sediment management facilities of Miwa dam is shown in Fig. 1. The bypass scheme includes upstream check dam of 140 m long, a 4.3 km long sediment bypass tunnel, a 230 m long diversion weir, and some auxiliary facilities.
2.2. SWITCHING OPERATION MODES FOR MIWA DAM BYPASS TUNNEL
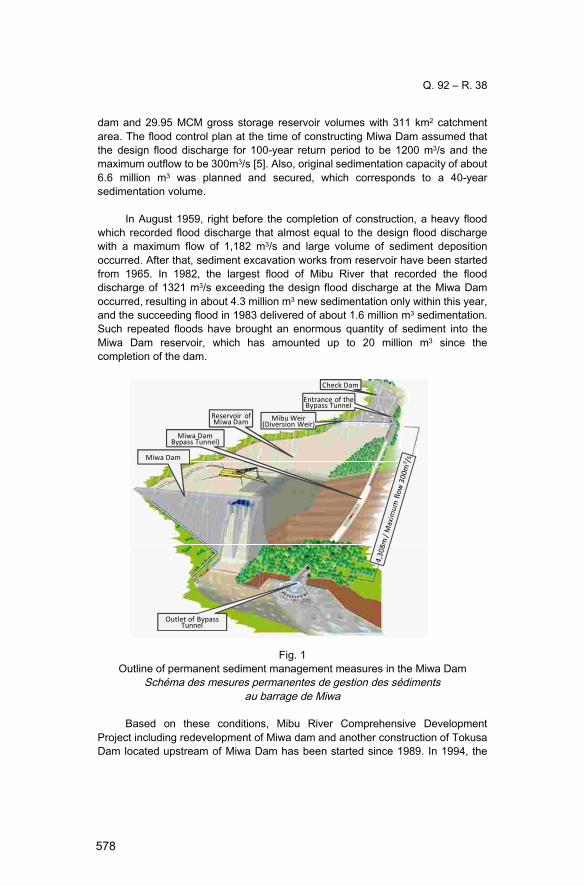
After completion of sediment bypass tunnel, several parameters have beenmonitored such as precipitation in the upstream, turbidity, water quality, fish, benthic animals, attached algae and so on. These data can be used for switching operation modes as shown in Fig. 2. The first normal mode is that all incoming flood flow will overflow the diversion weir into main reservoir (Mode 1). While the second mode is some part of incoming flood flow will be diverted to bypass tunnel after opening the bypass main gate (Mode 2). The last mode is refilling mode by closing the bypass main gate (Mode 3).
Mode 1 Mode 2 Mode 3
Bypa
ss fl
ow
diversion weir
Check dam
Miwa Dam
Incoming flood flow
All Some All
Refill
diversion weir
Check dam
Incoming flood flow
Fig. 2Switching operation modes during flood at Miwa Dam
Commutation des modes de fonctionnement de la galerie de dérivation pendant les crues au barrage de Miwa
The inflow discharge can be used to design and guide the timing for switching these operation modes. But we should also pay attention to sediment concentration because the inflow discharge and sediment concentration are not in the linear relationship but having sometime hysteresis. For example, sediment concentration during discharge increasing stage in the hydrograph is usually higher than that during decreasing stage. Therefore, in order to increase the performance of sediment bypassing and removal efficiency, we should focus on
579

Q. 92 – R. 38
surface flow patterns and suspended sediment concentration in the approach area to the bypass tunnel.
The main purposes of this paper are, to evaluate the effectiveness of sediment bypassing system, monitor the bed and suspend loads in the upstream reaches, and discuss the environmental impacts of SBPT on the downstream reaches. These will assist in operating of sediment bypass tunnel effectively for managing diverted flood with wash load from reservoir. The observed efficiencies of bypassed sediment will provide a basis for determining the best management practice for existing and future planned bypass tunnels. Finally we will discuss how to increase the sediment bypassing efficiency through changing in the timing of the opening and closing the gate of the tunnel.
3. METHODOLOGY
3.1. FIELD SITE
Fig. 3 shows the schematic diagram of the bypass system components combined with the locations of the monitoring instrumentation and studied areas.Based on some theoretical considerations and recorded field data, the annual sediment inflow was evaluated at an average amount of 0.68 MCM, of which 0.525 MCM is wash load and 0.16 MCM is bed load combined with suspended load. The complex sediment countermeasure system is shown in Fig. 3 and consists of the following installations:
1) Check dam of 0.22 MCM sediment storage capacity; the sediment is periodically excavated and transported by private gravel mining company.
2) Diversion weir of 0.51 MCM combines the functions of training and trapping sediment. Wash load that flows down through the check dam is directed together with the flood water through the main gate to the bypass tunnel. Where two cameras are installed to monitor the flow velocity in the bypass channel. During high flood, the submerged training dikes and the trap weir trap the coarse sediments that overflow from the check dam. The approach flow in front of the main gate is monitored by another two cameras for flow field analysis before and after the gate opening for switching modes.
3) Flood bypass tunnel of 4.3 km long, 7.5 m diameter, 1% slope, and 300 m3/s capacity.
580

Q. 95 – R. 38
Check dam Training dikes upstream of the
main gate
Gate to decrease
water level
Trap weir
Fish passage
Main gate
Log boom
Diversion weir
Turbidity meter
measuring SS1
Sub-gate
Fish passage
Flood bypass tunnel
SMDPstation SS2
Study area 1
Study area 2
Camera 1, 2
Camera 3, 4
Miwa Dam reservoir
Fig. 3Sediment management facility at Miwa dam and cameras and suspended
sediment measurement locationsStructures hydrauliques de gestion des sédiments au barrage de Miwa et
emplacement des caméras et des points de mesure de la turbidité
3.2. MONITORING TECHNIQUES OF FLOW FIELD AND SUSPENDED SEDIMENT CONCENTRATION
The development of Particle Image Velocimetry (PIV) has been studied for surface velocity measurement in laboratory and field experiments [9]. More recently, the standard PIV method has been applied to velocity measurements for larger scales, commonly named as Large Scale PIV (LSPIV) [10]. The optical flow Fx-8100 developed by Mitsubishi Electric Co. was also applied during sediment flushing of Unazuki Dam in July 2006 [11]. In the present applications, we utilized the CCTV (CIT-7430) camera from Mitsubishi Electric Co. which recorded at 30fps and 740 by 480 pixels.
In case of SS monitoring, various existing SS measurement techniques were compared by Wren et al. (2000). SS monitoring systems based on a differential pressure transmitter (SMDP) are implemented in Miwa dam and Kurobe River [12]. SMDP and INFINITY-Turbiditymeter by JFE-Advantech Co., Ltd. (Miniature Super-High Turbidity Data Logger with Wiper) [13], were installed for sediment monitoring in the river as shown in Fig. 3. Furthermore, river water samples were taken constantly to calibrate these monitoring systems.
581
Q. 92 – R. 38
4. RESULTS OF EVALUATION AND MONITORING MEASUREMENTS IN THE UPSTREAM REACHES OF MIWA DAM
4.1. SEDIMENT YIELD AND INFLUENCE OF SEDIMENT
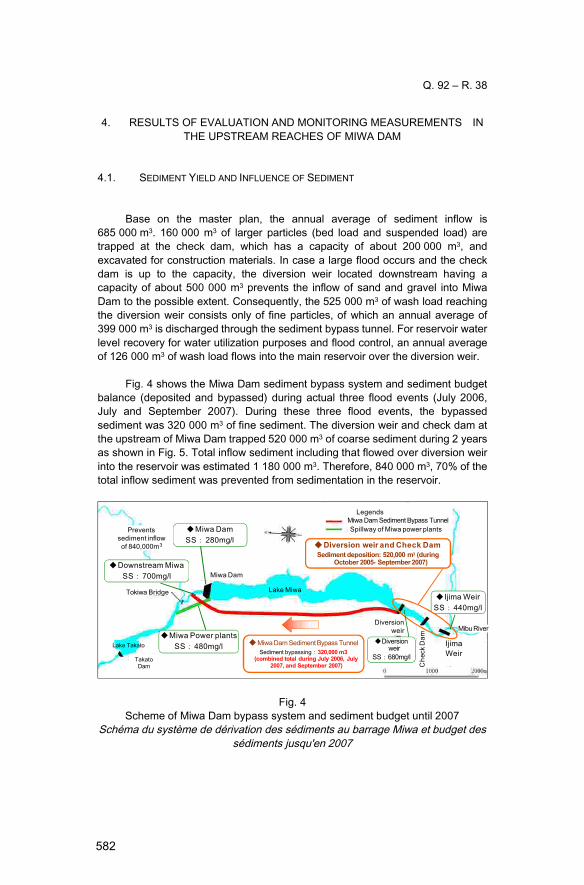
Base on the master plan, the annual average of sediment inflow is 685 000 m3. 160 000 m3 of larger particles (bed load and suspended load) are trapped at the check dam, which has a capacity of about 200 000 m3, and excavated for construction materials. In case a large flood occurs and the check dam is up to the capacity, the diversion weir located downstream having a capacity of about 500 000 m3 prevents the inflow of sand and gravel into Miwa Dam to the possible extent. Consequently, the 525 000 m3 of wash load reaching the diversion weir consists only of fine particles, of which an annual average of 399 000 m3 is discharged through the sediment bypass tunnel. For reservoir water level recovery for water utilization purposes and flood control, an annual average of 126 000 m3 of wash load flows into the main reservoir over the diversion weir.
Fig. 4 shows the Miwa Dam sediment bypass system and sediment budget balance (deposited and bypassed) during actual three flood events (July 2006, July and September 2007). During these three flood events, the bypassed sediment was 320 000 m3 of fine sediment. The diversion weir and check dam at the upstream of Miwa Dam trapped 520 000 m3 of coarse sediment during 2 years as shown in Fig. 5. Total inflow sediment including that flowed over diversion weir into the reservoir was estimated 1 180 000 m3. Therefore, 840 000 m3, 70% of the total inflow sediment was prevented from sedimentation in the reservoir.
◆Diversion weir and Check DamSediment deposition: 520,000 m3 (during
October 2005- September 2007)
◆Miwa Dam Sediment Bypass TunnelSediment bypassing:320,000 m3
(combined total during July 2006, July 2007, and September 2007)
◆Miwa DamSS:280mg/l
◆Miwa Power plantsSS:480mg/l
◆Downstream MiwaSS:700mg/l
◆Diversion weir
SS:680mg/l
◆ Ijima WeirSS:440mg/l
IjimaWeir
MibuRiver
Che
ck D
am
Diversion weir
Lake Miwa
Miwa Dam
Tokiwa Bridge
TakatoDam
Lake Takato
Prevents sediment inflow of 840,000m3
Miwa Dam Sediment Bypass TunnelSpillway of Miwa power plants
Legends
Fig. 4Scheme of Miwa Dam bypass system and sediment budget until 2007
Schéma du système de dérivation des sédiments au barrage Miwa et budget des sédiments jusqu'en 2007
582
Q. 95 – R. 38
4.2. SEDIMENTATION CONDITIONS UPSTREAM OF MIWA BYPASS TUNNEL
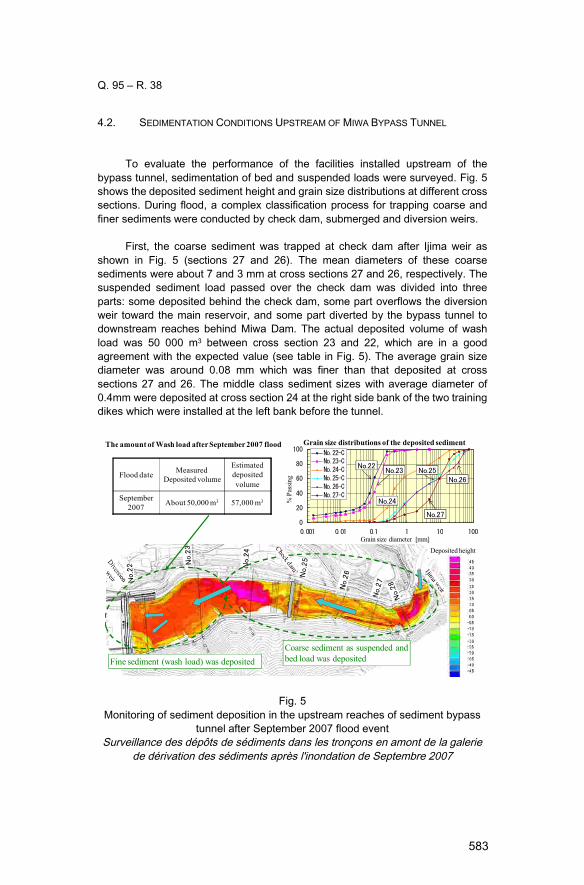
To evaluate the performance of the facilities installed upstream of the bypass tunnel, sedimentation of bed and suspended loads were surveyed. Fig. 5shows the deposited sediment height and grain size distributions at different cross sections. During flood, a complex classification process for trapping coarse and finer sediments were conducted by check dam, submerged and diversion weirs.
First, the coarse sediment was trapped at check dam after Ijima weir as shown in Fig. 5 (sections 27 and 26). The mean diameters of these coarse sediments were about 7 and 3 mm at cross sections 27 and 26, respectively. The suspended sediment load passed over the check dam was divided into three parts: some deposited behind the check dam, some part overflows the diversion weir toward the main reservoir, and some part diverted by the bypass tunnel to downstream reaches behind Miwa Dam. The actual deposited volume of wash load was 50 000 m3 between cross section 23 and 22, which are in a good agreement with the expected value (see table in Fig. 5). The average grain size diameter was around 0.08 mm which was finer than that deposited at cross sections 27 and 26. The middle class sediment sizes with average diameter of 0.4mm were deposited at cross section 24 at the right side bank of the two training dikes which were installed at the left bank before the tunnel.
The amount of Wash load after September 2007 flood
Fine sediment (wash load) was depositedCoarse sediment as suspended andbed load was deposited
Grain size distributions of the deposited sediment
Flood date Measured Deposited volume
Estimated deposited volume
September 2007 About 50,000 m3 57,000 m3
累加百分率(%)
0
20
40
60
80
100
0.001 0.01 0.1 1 10 100
No.22-CNo.23-CNo.24-CNo.25-CNo.26-CNo.27-C
Deposited height
Grain size diameter [mm]
% P
assin
g
No.22No.23
No.24
No.25No.26
No.27
Fig. 5Monitoring of sediment deposition in the upstream reaches of sediment bypass
tunnel after September 2007 flood eventSurveillance des dépôts de sédiments dans les tronçons en amont de la galerie
de dérivation des sédiments après l'inondation de Septembre 2007
583

Q. 92 – R. 38
5. EVALUATION OF SEDIMENT BYPASS TUNNEL PERFORMANCE
5.1. BYPASS OPERATION RESULTS
In Miwa dam, there were eight times of bypass operation after 2006 till 2011. These data are summarized in Table 2. The maximum trial operation was on September 2007 with the maximum wash load bypassed about 155 000 m3 during 48 hours bypass operation time. During the three floods of 2006 and 2007, approximately 710 000 m3 of fine sediments (wash load) were transported with floodwater into the reservoir, while the bypassed sediment was 320 000 m3. The bypassing efficiency was around 45%.
In July 2010, we have middle class flood event which was peak flow of 230 m3/s. The bypassing efficiency was up to 60% since several preliminary small flood events filled up the storage volume of Miwa reservoir and then the peaks of SSC could effectively pass through tunnel on time without delay.
Table 2Sediment bypass operation records after 2006
Archives d’opération de la galerie de dérivation des sédiments après 2006
Flood Date July 2006
July 2007
September 2007
June 2008
June 2010
July 2010
May 2011
May 2011
Average Rainfall (mm) 253 117 254 144 87 214 138 99Max. Inflow Discharge
(m3/s) 366 166 568 107 145 229 293 140
Max. Bypass Discharge (m3/s) 242 136 264 30 56 198 204 101
Bypass Operation time (hrs) 47 35 48 7 13 145 50 27
Max. Inflow Sediment Concentration (mg/l) 16 900 3610 25 000 2100 2990 12300 8680 1660
Max. Bypass Sediment Concentration (mg/l) 16 900 2810 20 200 1030 1880 12100 8270 1940
Total Inflow Wash Load (1000 m3) 326 37 461 12 16 131 67 13
Total Bypass Wash Load (1000 m3) 150 14 155 0.3 3 80 42 5
Bypassing efficiency (%) 46.0 37.8 33.6 2.5 18.8 61.1 62.7 38.5
584
Q. 95 – R. 38
5.2. FLOW PATTERN BEFORE AND AFTER BYPASSING
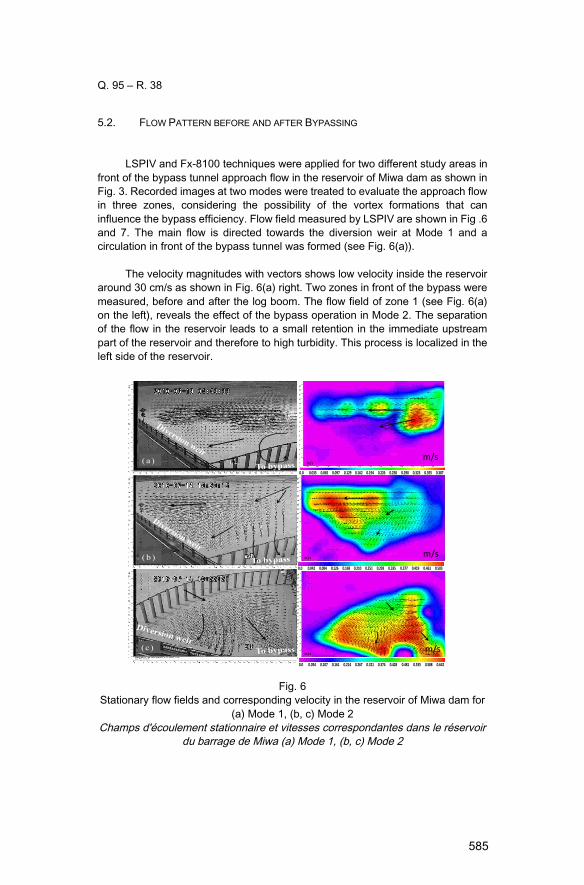
LSPIV and Fx-8100 techniques were applied for two different study areas in front of the bypass tunnel approach flow in the reservoir of Miwa dam as shown in Fig. 3. Recorded images at two modes were treated to evaluate the approach flow in three zones, considering the possibility of the vortex formations that can influence the bypass efficiency. Flow field measured by LSPIV are shown in Fig .6and 7. The main flow is directed towards the diversion weir at Mode 1 and a circulation in front of the bypass tunnel was formed (see Fig. 6(a)).
The velocity magnitudes with vectors shows low velocity inside the reservoir around 30 cm/s as shown in Fig. 6(a) right. Two zones in front of the bypass were measured, before and after the log boom. The flow field of zone 1 (see Fig. 6(a) on the left), reveals the effect of the bypass operation in Mode 2. The separation of the flow in the reservoir leads to a small retention in the immediate upstream part of the reservoir and therefore to high turbidity. This process is localized in the left side of the reservoir.
( a )
(b )
(c)
0.374 0.428 0.535 0.5880.4810.3210.2670.2140.161 0.6420.1070.0 0.054
0.293 0.335 0.419 0.4610.3770.2510.2100.1680.126 0.5030.0840.0 0.042
0.226 0.258 0.323 0.3550.2900.1940.1620.1290.097 0.3870.0650.0 0.033
m/s
m/s
m/s
m/s
m/s
m/s
Fig. 6Stationary flow fields and corresponding velocity in the reservoir of Miwa dam for
(a) Mode 1, (b, c) Mode 2Champs d'écoulement stationnaire et vitesses correspondantes dans le réservoir
du barrage de Miwa (a) Mode 1, (b, c) Mode 2
585
Q. 92 – R. 38
Bypass channel
Bypas s tunnel1.147 1.311 1.638 1.8021.4750.9830.8190.6550.492 1.9660.3280.0 0.164
m / s
m/s
Fig. 7Actual field measurements by LSPIV, surface velocity vectors in the bypass
channel and tunnel of Miwa damMesures réelles de site par LSPIV, champs de vitesse de surface dans le canal
de galerie de dérivation du barrage de Miwa
0
0.5
1
1.5
2
2.5
Vel
ocity
in th
e tu
nnel
dur
ing
sedi
men
t byp
asse
d (m
/s) LSPIV Mitsubishi Fx-8100
zone A
zone A
1.813 2.072 2.590 2.8492.3311.5541.2951.0360.777 3.1080.5180.0 0.259
1.147 1.311 1.638 1.8021.4750.9830.8190.6550.492 1.9660.3280.0 0.164
Fig. 8Average velocity measured at zone A during sediment bypassing operation in the
Miwa dam bypass tunnel at selected periodsVitesse moyenne mesurée à la zone A pendant la dérivation de sédiments dans le
tunnel de Miwa barrage à des périodes différents
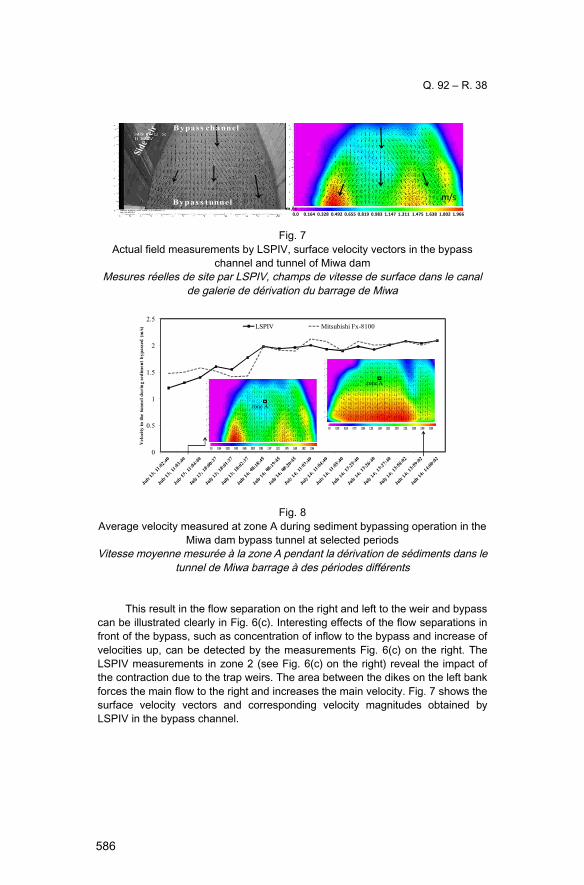
This result in the flow separation on the right and left to the weir and bypass can be illustrated clearly in Fig. 6(c). Interesting effects of the flow separations in front of the bypass, such as concentration of inflow to the bypass and increase of velocities up, can be detected by the measurements Fig. 6(c) on the right. The LSPIV measurements in zone 2 (see Fig. 6(c) on the right) reveal the impact of the contraction due to the trap weirs. The area between the dikes on the left bank forces the main flow to the right and increases the main velocity. Fig. 7 shows the surface velocity vectors and corresponding velocity magnitudes obtained by LSPIV in the bypass channel.
586
Q. 95 – R. 38
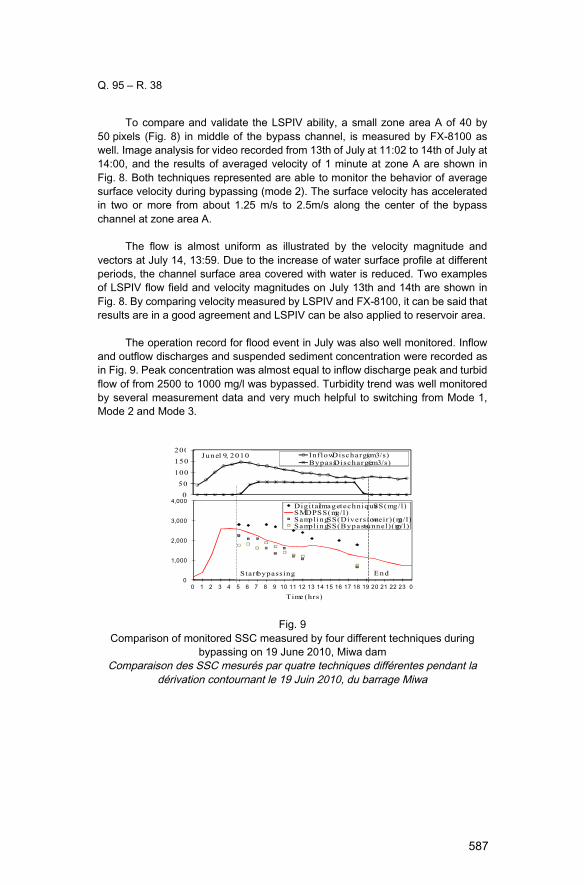
To compare and validate the LSPIV ability, a small zone area A of 40 by 50 pixels (Fig. 8) in middle of the bypass channel, is measured by FX-8100 as well. Image analysis for video recorded from 13th of July at 11:02 to 14th of July at 14:00, and the results of averaged velocity of 1 minute at zone A are shown in Fig. 8. Both techniques represented are able to monitor the behavior of average surface velocity during bypassing (mode 2). The surface velocity has accelerated in two or more from about 1.25 m/s to 2.5m/s along the center of the bypass channel at zone area A.
The flow is almost uniform as illustrated by the velocity magnitude and vectors at July 14, 13:59. Due to the increase of water surface profile at different periods, the channel surface area covered with water is reduced. Two examples of LSPIV flow field and velocity magnitudes on July 13th and 14th are shown in Fig. 8. By comparing velocity measured by LSPIV and FX-8100, it can be said that results are in a good agreement and LSPIV can be also applied to reservoir area.
The operation record for flood event in July was also well monitored. Inflow and outflow discharges and suspended sediment concentration were recorded as in Fig. 9. Peak concentration was almost equal to inflow discharge peak and turbid flow of from 2500 to 1000 mg/l was bypassed. Turbidity trend was well monitored by several measurement data and very much helpful to switching from Mode 1, Mode 2 and Mode 3.
0
1,000
2,000
3,000
4,000
0 1 2 3 4 5 6 7 8 9 10 11 12 13 14 15 16 17 18 19 20 21 22 23 0
Time (hrs)
Digital image technique SS (mg/l)SMDP SS(mg/l)Sampling SS(Diversion weir)(mg/l)Sampling SS(Bypass tunnel)(mg/l)
Start bypassing End
050
100
150200
Inflow Discharge (m3/s)Bypass Discharge (m3/s)
June 19, 2010
Fig. 9Comparison of monitored SSC measured by four different techniques during
bypassing on 19 June 2010, Miwa damComparaison des SSC mesurés par quatre techniques différentes pendant la
dérivation contournant le 19 Juin 2010, du barrage Miwa
587

Q. 92 – R. 38
5.3. BYPASS OPERATION AND ITS OPTIMIZATION
In order to increase sediment bypass efficiency, we should understand the relation between inflow hydrograph and sediment concentration curve as shown in Fig. 10. In general, sediment concentration during discharge increasing stage is higher than discharge decreasing stage. So it is important to optimize the bypass efficiency by discharging the high sediment concentration as much as possible and storing the low sediment concentration. We are studying rainfall-runoff and sediment concentration model to predict inflow sediment concentration in the flood events. Fig. 11 shows two different outflow discharges. Scenario B, Qin=Qout, is higher than scenario A which was real record in Sep.2007. Bypass efficiency were 65% in scenario B and 45% in scenario A as shown in Fig. 12.
0
5,000
10,000
15,000
20,000
25,000
30,000
0 100 200 300 400 500 600
Sus
pend
ed S
edim
ent
Con
cent
ratio
n [m
g/l]
Inflow discharge [m3/s]
Fig. 10Inflow discharge and suspended sediment concentration in September, 2007
Débit entrant et concentration de sédiments en suspension en Septembre 2007
0
5,000
10,000
15,000
20,000
25,000
30,000
0
100
200
300
400
500
600
09/06 12:00 09/07 00:00 09/07 12:00 09/08 00:00 09/08 12:00 09/09 00:00
Inflow (m3/s)Senario A (Real) (m3/s)Senario B (Qin=Qout) (m3/s)Inflow SS (mg/l)
Inflo
w d
isch
arge
[m3 /
s]
Su
spen
ded
Sed
imen
t Con
cent
ratio
n [
mg/
l]
Fig. 11Inflow discharge, sediment concentration and bypass scenarios
Débit entrant, concentration des sédiments et scénarios de dérivation
588

Q. 95 – R. 38
0
5,000
10,000
15,000
20,000
25,000
30,000
35,000
40,000
09/06 12:00 09/07 00:00 09/07 12:00 09/08 00:00 09/08 12:00 09/09 00:00
Qs in (m3)
Qs bypass (Senario A (Real)) (m3)Qs bypss (Senario B (Qin=Qout)) (m3)
Hou
rly s
uspe
nded
sed
imen
t vol
ume
[m3 ]
Fig. 12Inflow and outflow SS by bypass scenarios
Débit entrant et sortant des sédiments en suspension selon lesscénarios de dérivation
6. EVALUATION AND MONITORING OF ENVIRONMENTAL DOWNSTREAM IMPACTS
6.1. EVALUATION OF TURBIDITY OUTFLOW
Bypass tunnel outflow will result in more turbid water flowing downstream compared with the case of discharge through dam outlet gates. On the other hand, it is expected to reduce the turbidity of dam reservoir and control prolonged turbidity of post-flood outflow for power generation or irrigation water. The effect of the turbidity were evaluated with comparison of the changes in turbidity behavior at different locations from upstream to downstream before and after the commencement of the bypass tunnel operation at sites of tributary junctions, the sites of varying discharge and suspended sediments, as shown in Fig. 13.
589
Q. 92 – R. 38
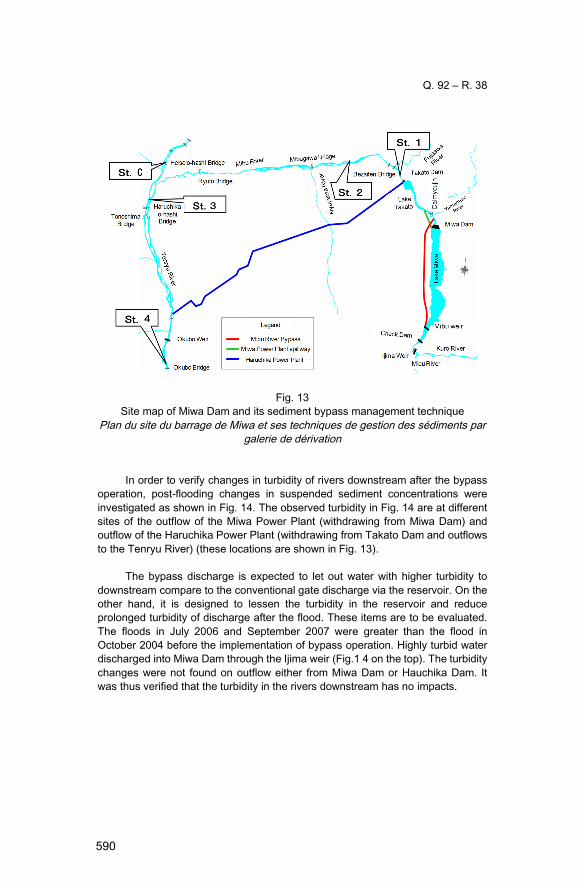
Fig. 13Site map of Miwa Dam and its sediment bypass management technique
Plan du site du barrage de Miwa et ses techniques de gestion des sédiments par galerie de dérivation
In order to verify changes in turbidity of rivers downstream after the bypass operation, post-flooding changes in suspended sediment concentrations were investigated as shown in Fig. 14. The observed turbidity in Fig. 14 are at different sites of the outflow of the Miwa Power Plant (withdrawing from Miwa Dam) and outflow of the Haruchika Power Plant (withdrawing from Takato Dam and outflows to the Tenryu River) (these locations are shown in Fig. 13).
The bypass discharge is expected to let out water with higher turbidity to downstream compare to the conventional gate discharge via the reservoir. On the other hand, it is designed to lessen the turbidity in the reservoir and reduce prolonged turbidity of discharge after the flood. These items are to be evaluated. The floods in July 2006 and September 2007 were greater than the flood in October 2004 before the implementation of bypass operation. Highly turbid water discharged into Miwa Dam through the Ijima weir (Fig.1 4 on the top). The turbidity changes were not found on outflow either from Miwa Dam or Hauchika Dam. It was thus verified that the turbidity in the rivers downstream has no impacts.
590

Q. 95 – R. 38
Fig. 14Observed suspended sediment concentrations at different sites upstream and
downstream of sediment bypass tunnel of Miwa DamConcentrations de sédiments en suspension observées à différents sites en
amont et en aval de la galerie de dérivation des sédiments du barrage de Miwa
6.2. ATTACHED ALGAE, CONDITION OF FISHES AND BENTHIC ANIMALS
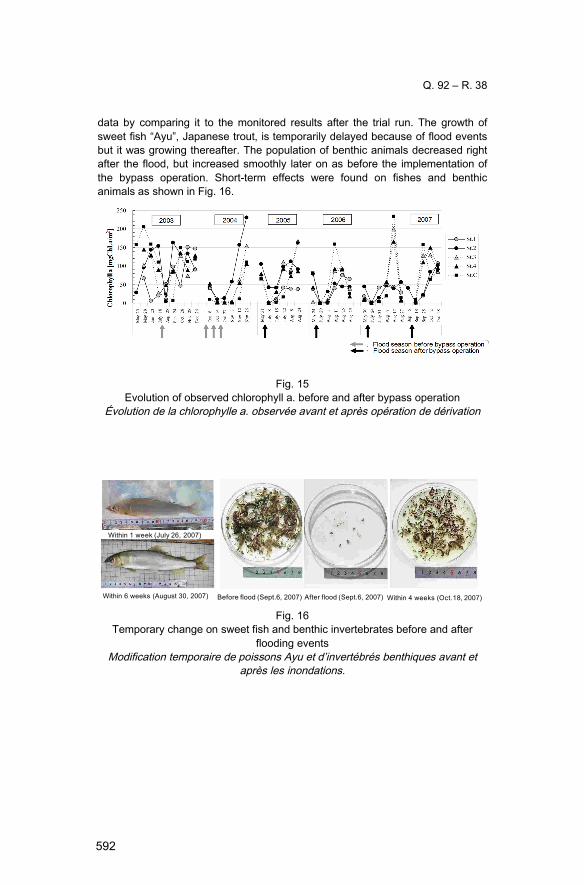
The significant impacts on organisms living in the downstream areas in connection with the change in turbidity of dam discharge are to be discussed. Approximately a duration of 5 years from the commencement of trial run is planned as the monitoring period, where the frequency or items to be monitored shall be reviewed as needed. In order to verify the effects of bypass operation on species, the restoration of attached algae before and after the bypass operation was evaluated based on chlorophyll a as shown in Fig. 15. The restoration of attached algae was observed before and after bypass operation both in Mibu and Tenryu Rivers. No significant changes were found due to operation of sediment bypass. Moreover, pre-operation monitoring has been conducted since 2004, a year before the trial run, to have the Chubu Regional Dam and Estuary Barrage Management Follow-Up Committee, organized by the Chubu Regional Development Bureau, conduct scientific and objective evaluation of the acquired
591
Q. 92 – R. 38
data by comparing it to the monitored results after the trial run. The growth of sweet fish “Ayu”, Japanese trout, is temporarily delayed because of flood events but it was growing thereafter. The population of benthic animals decreased right after the flood, but increased smoothly later on as before the implementation of the bypass operation. Short-term effects were found on fishes and benthic animals as shown in Fig. 16.
Fig. 15Evolution of observed chlorophyll a. before and after bypass operation
Évolution de la chlorophylle a. observée avant et après opération de dérivation
Before flood (Sept.6, 2007) After flood (Sept.6, 2007)Within 6 weeks (August 30, 2007)
Within 1 week (July 26, 2007)
Within 4 weeks (Oct.18, 2007)
Fig. 16Temporary change on sweet fish and benthic invertebrates before and after
flooding eventsModification temporaire de poissons Ayu et d’invertébrés benthiques avant et
après les inondations.
592

Q. 95 – R. 38
CONCLUSIONS
The major conclusions of this paper are as follows.
1) As a result, the use of such evaluation processes is important to develop a prediction model and effective monitoring techniques to optimize sediment bypass operation. The check dam effectively trapped coarse sediment and the submerged trap weir effectively blocked large materials that may cause abrasion damages for the tunnel surfaces. Sediment bypass system in Miwa dam is effectively routing incoming fine sediment directly to reservoir downstream. The bypassing efficiency depends on flood magnitude and bypass operation (timing). It is necessary to formulate the most effective plan for such operations as when commencing of bypass discharge or when operation ending flow rate, timing, and for how long etc, by analyzing and feeding back the monitoring results obtained from trial run. Moreover, the measured surface flow velocities and suspended sediment concentrations in the context of sediment management in reservoirs are important for the validity of the numerical analysis of Miwa dam.
2) The image technique methods were improved in order to obtain flow pattern and suspended sediment concentration despite water surface elevation variations, windy, rainy and foggy weather conditions. The described methods can be used to evaluate other sediment bypass systems.
3) Up to now, no major impacts on downstream ecological point of view (attached algae, benthic animals, and fishes) have been reported. Further studies are needed to clarify long term impacts and find necessary improvement measures for bypassing operation.
REFERENCES
[1] SUMI T., KANTOUSH S.A. Comprehensive sediment management strategies in Japan: sediment bypass tunnel. 34th IAHR biennial congress, Brisbane, Australia, 2011.
[2] VISCHER D., HAGER W.H., CASANOVA C., JOOS B., LIER P., MARTINI O. Bypass tunnels to prevent reservoir sedimentation. Q. 74, R. 37, Proc. 19th ICOLD Congress, Florence, Italy, 1997.
[3] AUEL C., BERCHTOLD T., BOES R. Sediment management in the Solis reservoir using a bypass tunnel. Proc. of the 8th ICOLD European Club Symposium, Innsbruck, Austria, 2010.
[4] SUMI T., OKANO M., TAKATA Y. Reservoir sedimentation management with bypass tunnels in Japan. The 9th International Symposium on River Sedimentation, ii, pp. 1036-1043, 2005.
[5] SUZUKI M. Outline and effects of permanent sediment management
593

Q. 92 – R. 38
measures for Miwa dam. The 23rd ICOLD Congress, Brasilia, Q.90-R.1., 2009.
[6] ANDO N., TERAZONO K., KITAZUME R. Sediment removal project at Miwa dam. The 18th congress of icold, Durban, Q.69, r.27, pp.421-441, 1994.
[7] KASHIWAI J., SUMI T., HONDA T. Hydraulic study on diversion facilities required for sediment bypass systems. The 19th Congress of ICOLD, Florence, Q.74, R.59, pp.957-976, 1997.
[8] HARADA M., TERADA M., KOKUBO T. Planning and hydraulic design of bypass tunnel for sluicing sediments past Asahi reservoir. The 19th congress of ICOLD, Florence, c.9, pp.509-539,1997.
[9] KANTOUSH S.A., SCHLEISS A.J. Large scale PIV- measurements at the surface of different shallow reservoir geometries. Journal of visualization, vol. 12, no. 4 pp. 361-373, 2009.
[10] FUJITA I., MUSTE M., KRUGER A. Large-scale Particle Image Velocimetry for flow analysis in hydraulic engineering applications, Journal of hydraulic research, Vol.36, No.3, pp.397-414, 1998.
[11] SUMI T., MURASAKI M., TAIRA K., SHINBO K., NAGURA H., TAMAKI H. Study on measurement of fine sediment discharge process during sediment flushing operation using PIV. Ann. Journal of Hydraulic Eng., JSCE, vol.51, 1075-1080, 2006 (in Japanese).
[12] SUMI T., MORITA S., OCHI T., KOMIYA H. Development of the suspended-sediment concentration measuring system with differential pressure transmitter in rivers and reservoirs, Proc. Hydraulics measurements and experimental methods Conference, ASCE, 2002.
[13] SUMI T., BAIYINBAOLIGAO, MORITA S. Characteristics of fine sediment DISCHARGE during sediment flushing of Unazuki dam, JSCE, Journal of Hydro-science and hydraulic engineering, VOL.25, NO.1, PP. 99-106, 2007.
SUMMARY
Sediment bypass tunnels are very important and effective engineering practices in reducing the sedimentation rate of reservoirs and extend the reservoir lifespan. This type of sediment management technique is sometimes expensive, applicable only in the case of medium size reservoirs. The medium size refers not only to that of the reservoir, but also to the hydrological size of the catchment. In Japan, Miwa Dam (Tenryu River) and Asahi Dam (Shingu River) are good examples for sediment bypass tunnels where routing incoming sediments directly to downstream reaches. These dams are practically using sediment bypass tunnel successfully to realize a sustainable reservoir management.
The sediment bypass technique of Miwa Dam includes three topics to be studied: (1) How to trap coarse sediment in the upstream reaches of reservoir by check dam, (2) How to effectively divert the suspended sediment and high turbid flow around the reservoir basin through tunnel, and (3) How to minimize the
594
Q. 95 – R. 38
downstream impacts on Mibu River. As results, the use of such evaluation processes is important to develop a prediction model and effective monitoring techniques to optimize sediment bypass operation. The check dam effectively trapped coarse sediment, and the submerged trap weir effectively blocked large materials that may cause abrasion damages for the tunnel surfaces. Sediment bypass system in Miwa dam is effectively routing incoming fine sediment directly to the reservoir’s downstream. The bypassing efficiency depends on the flood magnitude and the bypass operation (timing). It is necessary to formulate the most effective plan for such operations, i.e. when to initiate the bypass discharge or when to end the operation flow rate, define the timing, and duration etc…This is possible by analyzing and feeding back the monitoring results obtained from the trial run. No impact on downstream ecological point of view (attached algae, benthic animals, and fishes).
RÉSUMÉ
Les galeries de dérivation des sédiments sont des pratiques techniques, très importantes et efficaces pour réduire le taux de sédimentation des réservoirs, et pour prolonger leur durée de vie. Ce type de technique de gestion des sédiments est parfois cher, applicable uniquement dans le cas de réservoir de taille moyenne. La taille moyenne ne se réfère pas seulement aux réservoirs, mais aussi à la taille hydrologique des bassins versants. Au Japon, le barrage Miwa (sur la rivière de Tenryu) et le barrage d’Asahi (sur la rivière Shingu) sont de bons exemples pour les galeries de dérivation, où les sédiments sont dérivés directement en aval. Ces barrages emploient avec succès des galeries de dérivation pour gérer durablement leur réservoir.
La technique de dérivation des sédiments du barrage de Miwa comprend trois aspects qui seront étudiés: (1) Comment retenir les sédiments grossiers dans les tronçons en amont du barrage réservoir par recours aux barrages de rétention des alluvions (2) Comment renvoyer efficacement les flux de sédiments en suspension et courants de turbidité autour du réservoir par le tunnel, et (3) Comment réduire les impacts en aval sur le fleuve Mibu. Il résulte de cette étude que l'utilisation de ces processus d'évaluation est importante pour développer un modèle de prédiction ainsi que des techniques de surveillance efficaces pour optimiser le fonctionnement de dérivation des sédiments. Le barrage de rétention des alluvions a efficacement retenu les sédiments grossiers, et le déversoir submergé a bloqué les matériaux de grande taille qui pourraient endommager les surfaces du tunnel. Le système de dérivation des sédiments dans le barrage Miwa conduit efficacement les sédiments fins directement vers l'aval du réservoir. L'efficacité de la dérivation dépend de l'ampleur des crues et des opérations de dérivation (synchronisation). Il est nécessaire de formuler des plans de gestion efficaces pour ces opérations, afin de définir quand commencer le débit de contournement, ou quand terminer les opérations, en synchroniser et définir la
595

Q. 92 – R. 38
durée. Cela est possible en analysant et en exploitant les résultats de la surveillance obtenus à partir des essais. Il n’y a pas d'impact sur le plan écologique en aval (algues fixées, animaux benthiques et poissons).
596
![g Z H P ? G D : B K D H ? A H G B G G H F B G : G K B J H ...На правах рукописи K l _ i Z g h e H e _ ] h \ g Z H P ? G D : B K D H ? A H G B G G H F B G : G K B J](https://img.pdfslide.us/doc/110x75/60665ac94fb99e770f7b94fb/g-z-h-p-g-d-b-k-d-h-a-h-g-b-g-g-h-f-b-g-g-k-b-j-h-.jpg)


![K I ? P B : E V G U ? B D H F ; B G B J H < : G G U ? F ? L H > U H ; H … · 2021. 2. 10. · I _ j _ q _ g v b \ b ^ u a Z ^ Z g b c b ] j Z n b d b o \ u i h e g _ g b y:](https://img.pdfslide.us/doc/110x75/60ec6f5790d1f23e58150d5e/k-i-p-b-e-v-g-u-b-d-h-f-b-g-b-j-h-g-g-u-f-l-h-u-h-h-2021.jpg)


![F B G B K L ? J K L < H H ; J : A H < : G B Y B G : M D B ...география. > B K K ? J L : P B Y g Z k h b k d Z g b _ m q _ g h c k l _ i _ g b d Z g ^ b ^ Z l Z ]](https://img.pdfslide.us/doc/110x75/6001e5360110212f272b5d52/f-b-g-b-k-l-j-k-l-h-h-j-a-h-g-b-y-b-g-m-d-b-.jpg)


![W E ? D L J H F : = G ? L B A F D H E ? ; : G B Y B - UTMfizica.utm.md/documents_pdf/Indrumar de lab... · i; ] ^ _ b - . / b p. b g b g b g g n gg - . b b g g z g b b g, z g. b g,](https://img.pdfslide.us/doc/110x75/5ec41a37735be534d03bba1d/w-e-d-l-j-h-f-g-l-b-a-f-d-h-e-g-b-y-b-de-lab-i-b-.jpg)


![h j ] Z g b a Z p b y H [ t ^ b g g g u o G Z p b c INANCE](https://img.pdfslide.us/doc/110x75/619ac88361c3767ac812efbc/h-j-z-g-b-a-z-p-b-y-h-t-b-g-g-g-u-o-g-z-p-b-c-inance-.jpg)