Embed Size (px)
Citation preview
Paper # 070CO-0134 Topic: Coal & Biomass Combustion and Gasification
8th U. S. National Combustion Meeting Organized by the Western States Section of the Combustion Institute
and hosted by the University of Utah May 19-22, 2013
Pyrolysis and CO2 Gasification Rates of Petroleum Coke at High Heating Rates and Elevated Pressure
Aaron D. Lewis, Emmett G. Fletcher, and Thomas H. Fletcher1
1Department of Chemical Engineering, Brigham Young University, Provo, Utah 84602, USA
The pyrolysis and CO2 gasification of two petroleum coke samples from industry was studied in a
pressurized flat-flame burner at particle heating rates of 105 K/s at pressures up to 15 atm. The ASTM volatiles value of petroleum coke appeared to be a good approximation of the mass release experienced during pyrolysis at conditions of high initial particle heating rate. The morphology of the two petroleum cokes was drastically different after experiencing rapid initial particle heating rates. The char structure of one petroleum coke sample appeared very similar to that of raw petroleum coke, with the only difference being cracks that formed on the char surface. Although this petroleum coke sample contained less than 10 wt% (daf) volatiles, it is believed that the cracks were likely a result of the volatiles escaping the particle interior quickly, which was influenced by the high particle heating rates experienced in the flat-flame burner experiments. The structure of the second anode-grade petroleum coke char contained an appreciable fraction of swollen, thin-shelled particles that appeared to have a near-hollow interior. The pet coke CO2 gasification experiments were conducted at total pressures of 10 and 15 atm in a high-pressure flat-flame burner (HPFFB) reactor at conditions were the bulk phase consisted of ~40 and ~90 mol% CO2. The apparent CO2 char gasification rates of these two samples (45-75 μm) were measured following in-situ pyrolysis in the HPFFB reactor in the gas temperature and bulk CO2 partial pressure ranges of 1169-1909 K and 4.1-13.5 atm, respectively. The CO2 gasification rates for the two petroleum coke chars were fit to a global 1st-order model. The measured and modeled char CO2 gasification rates are believed to be representative of those from an entrained-flow gasifier since they were measured in similar conditions of elevated pressure and high initial particle heating rates (105 K/s) with short particle residence times. The measured kinetics of the two pet coke samples took place under Zone II conditions, which is a transition region between surface-reaction control and film-diffusion control. It was shown that both petroleum coke samples gasified at a higher rate at pressurized conditions than a bituminous coal sample. These results differ from reports in the literature based on atmospheric-pressure experiments that petroleum coke has a lower CO2 gasification reactivity than coal. 1. Introduction
A growing world population and increased modernization in developing countries place an ever-increasing demand for energy. The solution to meeting the energy needs of the future will most likely come from a combination of energy sources, one of which is petroleum coke. This by-product from oil refining consists primarily of carbon, resembles coal in appearance, and is often referred to as pet coke. Pet coke results from the coker process, which heats heavy residual fuel oil until it cracks into more valuable light compounds that are eventually incorporated into jet fuel, diesel, and other components. Current estimates of petroleum coke generation are 60 million tons per year, and pet coke production is expected to increase as coker units are added to oil refineries (Fisher, 2011).
One way that petroleum coke can be transformed into useful products such as energy and chemicals is through gasification, which converts any hydrocarbon through partial oxidation into a
2
gaseous fuel termed synthesis gas (or syngas) that is mainly composed of H2 and CO. Both homogeneous and heterogeneous reactions occur during gasification of a solid fuel. While thermodynamic equilibrium calculations adequately predict the homogeneous gas phase reactions in most commercial gasifiers (Smoot and Smith, 1985; Higman and Burgt, 2003), the heterogeneous reaction between solid char and gasification agents (such as steam and CO2) can become very complicated when considering all the influencing factors. Some of these include diffusion of reactants through the external boundary layer, reactions with both H2O and CO2, particle size effects, pore diffusion, char ash content, temperature and pressure variations, and changes in surface area (Smoot and Smith, 1985). Predicting char gasification kinetics therefore relies heavily on measured rate data. Being able to predict char gasification rates is of research interest because the heterogeneous reaction between char and gas often governs the overall reaction rate in gasification processes (Liu et al., 2010). Other processes such as pyrolysis or volatiles combustion occur more quickly during the gasification of a solid fuel.
Although coal is the leading gasifier feedstock in commercial gasification, there is industrial interest in the gasification of pet coke as well. According to the National Energy Technology Laboratory’s (NETL) Gasification Worldwide Database (2010), the projected syngas capacity in 2016 for coke and pet coke is 75,500 and 12,900 MWth, respectively.
As long as solid fuel particles gasify in a regime that is not limited by film diffusion, gasification reactivity of solid fuel particles is significantly influenced by the structure evolution during devolatilization (Wu et al., 2012). It is believed that the char structure evolution of the petroleum coke chars in this work are similar to those that would be generated in a commercial entrained-flow reactor, due to their generation at both high heating rate and pressure. This makes the measured gasification rates in this work very realistic and meaningful. A better understanding of the gasification reactivity will enable the prediction of residence time and temperature requirements for complete reaction in highly thermal-efficient processes such as Integrated Gasification Combined Cycle (IGCC) to generate power (Cetin et al., 2005). 2. Experimental Procedure
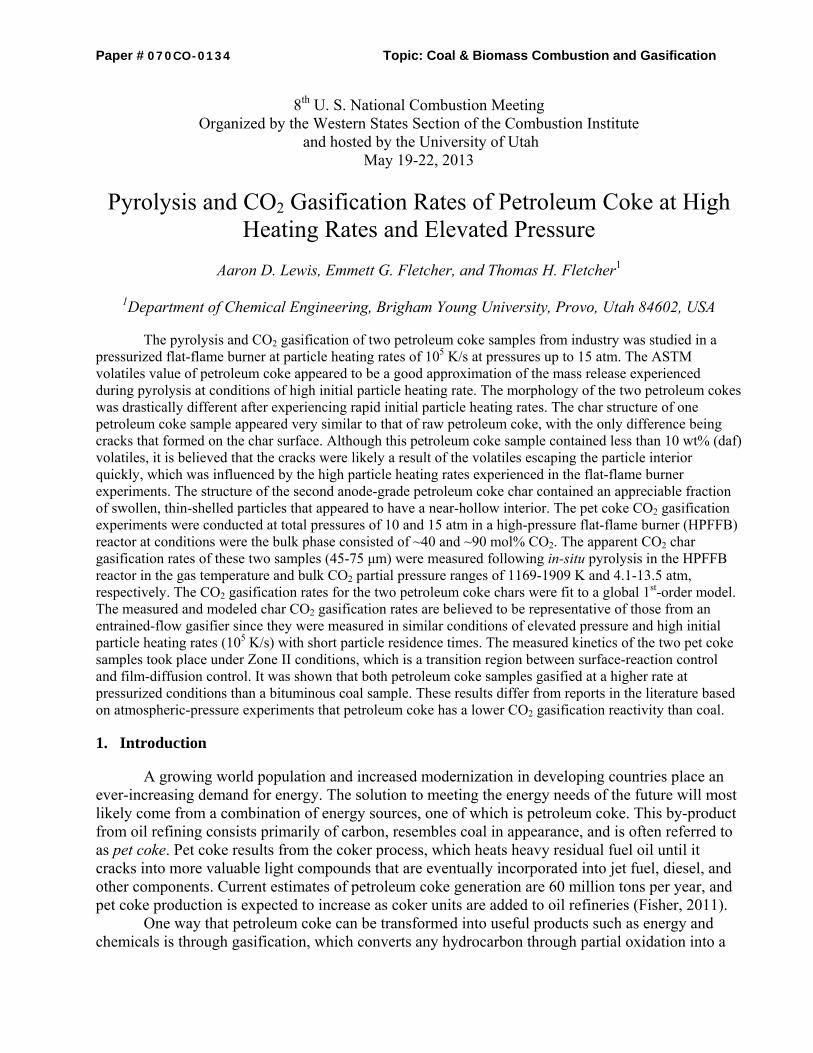
Samples. Two commercially-obtained petroleum coke samples were studied in this research. The samples are referred to as ‘Pet Coke A’ and ‘Pet Coke B’ in this paper. Sample A is likely fuel-grade pet coke, and has been used in previous research (Lewis, 2011). Sample B is anode-grade pet coke. The primary difference in different grades of petroleum coke is the metal content (V, Fe, Ni) in the ash, which is determined by the crude oil from which the samples are derived (Fisher, 2011). The samples were ground using an electric wheat grinder (Blendtec Kitchen Mill) and sieved to collect the 45-75 μm size range, which was used in all the experiments. The mass mean of Pet Cokes A and B were 62.0 and 68.8 μm, respectively. The small particles were used to represent the pulverized particle size used in industry, to ensure a high initial heating rate of the particles, and to assume no temperature gradients within the particle for modeling. Figure 1 shows SEM images of the sized pet coke samples. These pictures, along with other SEM images in this work, were taken using a FEI XL30 ESEM instrument with a FEG emitter.
3
(Pet Coke A)
(Pet Coke B)
Figure 1. SEM images of raw pet coke samples collected from the 45-75 micron sieve tray. The results of the ultimate and proximate analyses of the samples used in this research are shown in Table 1. The ultimate analyses for the pet coke samples were performed by Huffman Laboratories while the proximate analyses were performed at Brigham Young University (BYU) following ASTM procedures. Information regarding Illinois #6 coal is included in Table 1 since it was used in a limited number of experiments.
Table 1. Ultimate and proximate analyses of the feed stocks
Sample Moisturea (wt%)
Ash (wt%, dry)
Volatiles (wt%, dafb)
C (wt%, daf)
H (wt%, daf)
N (wt%, daf)
Oc (wt%, daf)
S (wt%, daf)
Pet Coke A 1.29 0.35 8.78 87.62 1.81 1.77 2.15 6.30 Pet Coke B 0.20 0.30 10.52 90.97 3.78 1.33 1.04 2.88 Ill #6 coal 3.32 6.98 44.79 77.72d 5.00 d 1.37 d 13.52 d 2.38 d
aas received basis. bdaf = dry and ash-free basis. ccalculated by difference. d(Smith et al., 1994)
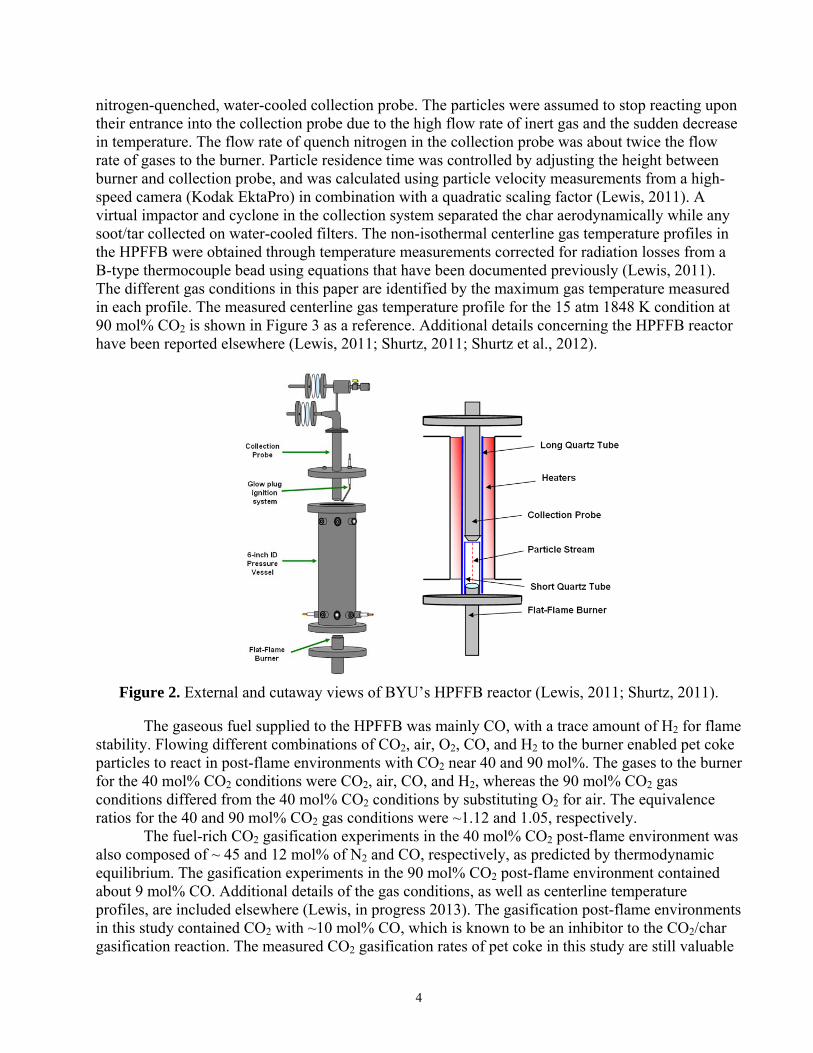
Apparatus and Operation. A high-pressure flat-flame burner (HPFFB) reactor was used in this study to measure gasification rates of the petroleum coke samples. A schematic of the reactor is shown in Figure 2. The HPFFB is useful since it well approximates the reaction conditions in industrial entrained-flow reactors by reacting small particles in cocurrent flow at high temperatures and pressures with rapid initial particle heating rates (~105 K/s) and short reaction times (< 1 s). Similar to commercial entrained-flow reactors, particles in the HPFFB typically react in a regime where solid conversion is limited by a combination of both chemical reaction and pore diffusion.
The flat-flame burner used hundreds of small-diameter tubes to create numerous diffusion flamelets by feeding gaseous fuel through the tubes while introducing gaseous oxidizer in the vacant spaces between the tubes. The combination of all the diffusion flamelets created a flat flame about 1 mm thick above the burner.
Particles were entrained in nitrogen and carried to the middle of the burner surface through a small metal tube (0.053” ID) at a feed rate of <1.5 g/hr to ensure single-particle behavior. The low flow rate of carrier nitrogen (~0.2 SLPM) in the feed tube was considered negligible when compared with the 16−25 SLPM flow rates of other gases to the burner. Upon exiting the feed tube, the particles reacted while traveling upward in laminar flow before the particles were collected in a
4
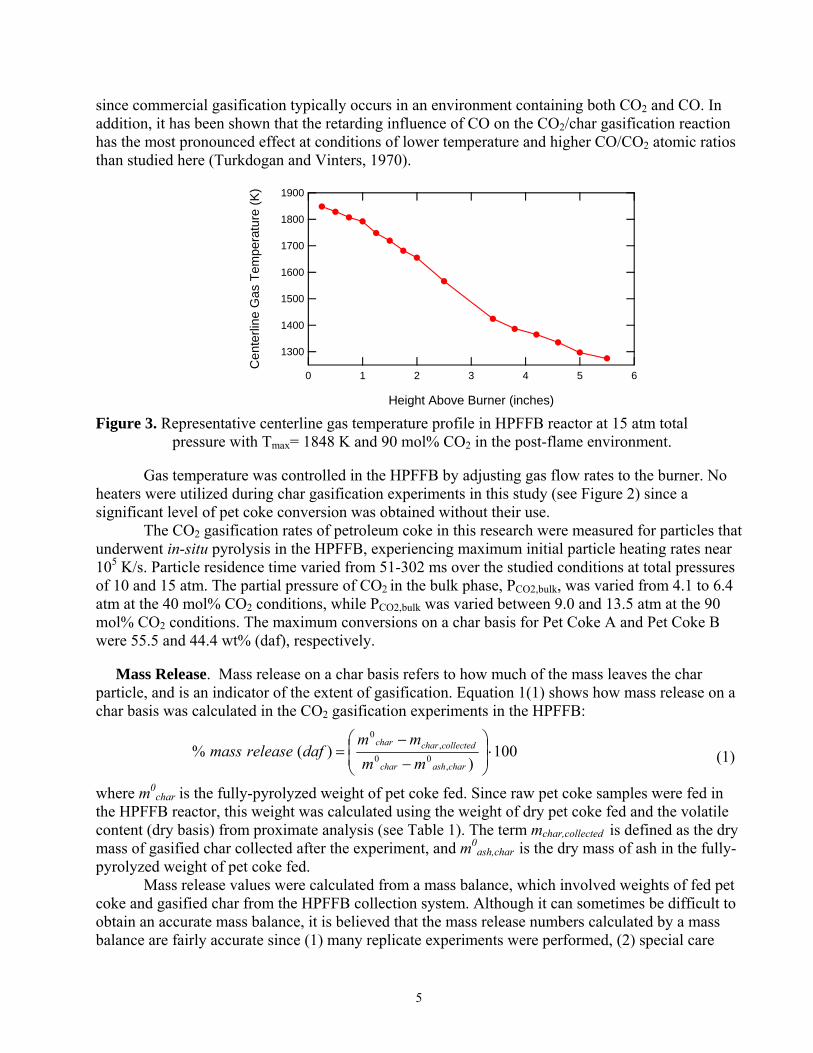
nitrogen-quenched, water-cooled collection probe. The particles were assumed to stop reacting upon their entrance into the collection probe due to the high flow rate of inert gas and the sudden decrease in temperature. The flow rate of quench nitrogen in the collection probe was about twice the flow rate of gases to the burner. Particle residence time was controlled by adjusting the height between burner and collection probe, and was calculated using particle velocity measurements from a high-speed camera (Kodak EktaPro) in combination with a quadratic scaling factor (Lewis, 2011). A virtual impactor and cyclone in the collection system separated the char aerodynamically while any soot/tar collected on water-cooled filters. The non-isothermal centerline gas temperature profiles in the HPFFB were obtained through temperature measurements corrected for radiation losses from a B-type thermocouple bead using equations that have been documented previously (Lewis, 2011). The different gas conditions in this paper are identified by the maximum gas temperature measured in each profile. The measured centerline gas temperature profile for the 15 atm 1848 K condition at 90 mol% CO2 is shown in Figure 3 as a reference. Additional details concerning the HPFFB reactor have been reported elsewhere (Lewis, 2011; Shurtz, 2011; Shurtz et al., 2012).
Figure 2. External and cutaway views of BYU’s HPFFB reactor (Lewis, 2011; Shurtz, 2011).
The gaseous fuel supplied to the HPFFB was mainly CO, with a trace amount of H2 for flame stability. Flowing different combinations of CO2, air, O2, CO, and H2 to the burner enabled pet coke particles to react in post-flame environments with CO2 near 40 and 90 mol%. The gases to the burner for the 40 mol% CO2 conditions were CO2, air, CO, and H2, whereas the 90 mol% CO2 gas conditions differed from the 40 mol% CO2 conditions by substituting O2 for air. The equivalence ratios for the 40 and 90 mol% CO2 gas conditions were ~1.12 and 1.05, respectively.
The fuel-rich CO2 gasification experiments in the 40 mol% CO2 post-flame environment was also composed of ~ 45 and 12 mol% of N2 and CO, respectively, as predicted by thermodynamic equilibrium. The gasification experiments in the 90 mol% CO2 post-flame environment contained about 9 mol% CO. Additional details of the gas conditions, as well as centerline temperature profiles, are included elsewhere (Lewis, in progress 2013). The gasification post-flame environments in this study contained CO2 with ~10 mol% CO, which is known to be an inhibitor to the CO2/char gasification reaction. The measured CO2 gasification rates of pet coke in this study are still valuable
5
since commercial gasification typically occurs in an environment containing both CO2 and CO. In addition, it has been shown that the retarding influence of CO on the CO2/char gasification reaction has the most pronounced effect at conditions of lower temperature and higher CO/CO2 atomic ratios than studied here (Turkdogan and Vinters, 1970).
Figure 3. Representative centerline gas temperature profile in HPFFB reactor at 15 atm total pressure with Tmax= 1848 K and 90 mol% CO2 in the post-flame environment.
Gas temperature was controlled in the HPFFB by adjusting gas flow rates to the burner. No
heaters were utilized during char gasification experiments in this study (see Figure 2) since a significant level of pet coke conversion was obtained without their use.
The CO2 gasification rates of petroleum coke in this research were measured for particles that underwent in-situ pyrolysis in the HPFFB, experiencing maximum initial particle heating rates near 105 K/s. Particle residence time varied from 51-302 ms over the studied conditions at total pressures of 10 and 15 atm. The partial pressure of CO2 in the bulk phase, PCO2,bulk, was varied from 4.1 to 6.4 atm at the 40 mol% CO2 conditions, while PCO2,bulk was varied between 9.0 and 13.5 atm at the 90 mol% CO2 conditions. The maximum conversions on a char basis for Pet Coke A and Pet Coke B were 55.5 and 44.4 wt% (daf), respectively. Mass Release. Mass release on a char basis refers to how much of the mass leaves the char particle, and is an indicator of the extent of gasification. Equation 1(1) shows how mass release on a char basis was calculated in the CO2 gasification experiments in the HPFFB:
100)
)(%,
00
,0
charashchar
collectedcharchar
mm
mmdafreleasemass
(1)
where m0char is the fully-pyrolyzed weight of pet coke fed. Since raw pet coke samples were fed in
the HPFFB reactor, this weight was calculated using the weight of dry pet coke fed and the volatile content (dry basis) from proximate analysis (see Table 1). The term mchar,collected is defined as the dry mass of gasified char collected after the experiment, and m0
ash,char is the dry mass of ash in the fully-pyrolyzed weight of pet coke fed.
Mass release values were calculated from a mass balance, which involved weights of fed pet coke and gasified char from the HPFFB collection system. Although it can sometimes be difficult to obtain an accurate mass balance, it is believed that the mass release numbers calculated by a mass balance are fairly accurate since (1) many replicate experiments were performed, (2) special care
1900
1800
1700
1600
1500
1400
1300
Cen
terli
ne G
as T
empe
ratu
re (
K)
6543210
Height Above Burner (inches)
6
was given to ensure the best mass balance possible, and (3) there was often good repeatability between duplicate experiments. The best mass balance possible was ensured by shutting down between different experimental conditions in order to clean out the collection system, and weighing the amount of pet coke fed as well as the collected char. The use of a quartz tube immediately around the burner that extended all the way to the collection probe favored good collection efficiency (see Figure 2) as well. The length of this quartz tube depended on the collection height of the experiment since this tube extended from the bottom vessel cap to ~1/8” below the collection probe. Although it is possible to calculate mass release using ash as a tracer (Lewis, 2011), this method was not used in this study since up to 40 wt% of the ash vaporized in a previous study (Lewis, 2011) when Pet Coke A was fed in the HPPFB. The ash-tracer method of calculating mass release only yields correct values when ash truly acts as a tracer and does not leave the particle. Each mass release data point is the average taken from typically 2 to 3 replicate experiments. The average standard deviations in mass release values (char basis) for Pet Coke A and Pet Coke B experiments were 3.7 and 2.1 wt% daf, respectively. 3. Results and Discussion Pyrolysis of Pet Coke at High Heating Rate. Both Pet Coke A and Pet Coke B were fed through a flat-flame burner reactor in order to test the effect of particle heating rate on the pyrolysis volatiles yield of petroleum coke. High initial particle heating rate has been shown to increase the volatiles yield during pyrolysis for other solid fuels such as biomass and coal (Jamaluddin et al., 1986; Solomon et al., 1993; Borrego and Alvarez, 2007; Borrego et al., 2009). For example, Borrego et al. (2009) measured up to 12% greater volatile yields than the ASTM volatiles test when pyrolyzing wood chips, forest residues, and rice husks at high heating rate in a drop tube furnace.
Both Pet Coke A and Pet Coke B were fed through a flat-flame burner reactor that has been documented previously (Ma, 1996; Ma et al., 1996; Zhang, 2001; Zhang and Fletcher, 2001), and operated in a very similar manner as the HPFFB reactor with the exception of operating at atmospheric pressure. Pet Coke A was fed at two fuel-rich gas conditions where the peak centerline gas temperatures were 1751 and 1929 K, with particle residence times ranging from 33-102 ms. The average mass release from 10 runs feeding Pet Coke A was 8.86 wt% (daf) with a standard deviation of 0.9 wt%. These runs were preliminary runs to determine if pet coke would gasify in less than 102 ms with partial pressure of CO2, PCO2, near 0.23 atm, but also serve as pyrolysis data at high heating- rate conditions since no CO2 gasification was measured. Pet Coke B was fed at two different fuel-rich gas conditions where the peak centerline gas temperatures were 1320 and 1433 K, with particle residence times near 50 ms using a 2” collection height above the burner. The average mass release of Pet Coke B from 3 runs was 10.57 wt% (daf) with a standard deviation of 1.1 wt%.
The results of pyrolysis mass release of Pet Coke A and Pet Coke B at both low and high heating-rate conditions are summarized in Table 2. The ASTM volatiles value was taken from Table 1 and serves as a low heating-rate pyrolysis value, whereas the high heating-rate pyrolysis value was taken as the measured mass release during flat-flame burner experiments. There is less than 0.9% difference in the low and high heating-rate pyrolysis mass release values for both pet coke samples.

7
Table 2. Summary of mass release from pet coke pyrolysis at low and high heating rates
Sample ASTM Volatiles
wt% (daf)
High Heating Rate Volatiles
wt% (daf) Pet Coke A 8.78 8.86 Pet Coke B 10.52 10.57
Kocaefe et al. (1995) pyrolyzed 4 kinds of petroleum coke with ASTM volatile yields
ranging from 7.2 to 12 wt% in a TGA under N2 at a heating rate of 146 K/min. It was observed that the ASTM volatiles yield was a good approximation of the volatiles that escaped during pyrolysis in the TGA for each of the 4 varieties of pet coke. From these TGA experiments in the literature as well as the experiments performed at BYU in a flat-flame burner reactor, the ASTM volatiles yield of petroleum coke was a good estimate for the volatiles yield during both low and high heating-rate conditions. Morphology of pet coke char. Figure 4 shows gasified Pet Coke A char that was collected from the HPFFB reactor after 125 ms at the 10 atm 1909 K gas condition with ~40 mol% CO2 in the post-flame environment. This figure serves as a representative image of other Pet Coke A char gasified samples. Recall that SEM images of the raw pet coke samples were included in Figure 1. The morphology of Pet Coke A char was very similar to that of its unfed feed stock material, with the only difference being that the char contains cracks in its surface. This observation is consistent with what other researchers have observed (Zamalloa and Utigard, 1995). Although less than 10 wt% (daf) volatiles resulted from the pyrolysis of Pet Coke A, it is believed that the cracks are likely a result of volatiles escaping the particle interior quickly, which is influenced by the high initial particle heating rates characteristic of flat-flame burner reactors.
Figure 4. SEM image of Pet Coke A char collected from the HPFFB at the 10 atm 1909 K 40 mol% CO2 gas condition after 125 ms.
Gasified Pet Coke B char is shown in Figures 5a and b that was collected from the HPFFB
reactor after 66 ms at the 15 atm 1686 K gas condition with ~90 mol% CO2 in the post-flame environment. This figure serves as a representative image of other Pet Coke B char gasified samples. The char collected when feeding Pet Coke B contained a mixture of two types of particles. The first

8
type of particles was similar to Pet Coke A char (see Figure 4), and closely resembled the unreacted feed stock particles. The second type of char resembled highly swollen cenospheres, similar to the char particles resulting from pyrolyzed bituminous coals. The explanation for the cenospheric char particles from softening coals is that the metaplast becomes fluid during devolatilization, which results in an entirely new pore structure (Yu et al., 2007). Perhaps this explanation for the differences in coal char morphology can also be applied to petroleum coke, although greater than half the char particles from Pet Coke B did not pass through a plastic stage. Figure 5b provides some insight on the internal structure of the Pet Coke B char particles of the second type. It appears that the swollen char particles from Pet Coke B have thin walls with little to no pore network internally. Broken and fragmented char particles from Pet Coke B, as seen in Figure 5b, were rare to see when the SEM images were taken. The swollen particles of Pet Coke B on average had diameters about 1.5 times larger than the average diameter of their raw feedstock material. The different morphologies observed in the pet coke chars from Pet Cokes A and B are likely attributed to differences in the crude oil feedstock from which the samples originated, although the exact explanation requires further research.
(a)
(b)
Figure 5. SEM images of Pet Coke B char collected from the HPFFB at the 15 atm 1686 K 90 mol% CO2 gas condition after 66 ms. The symbol identifies char particles of the second type in figure (a).
Tar collected on the filters of the HPFFB collection system (see Figure 2) when Pet Coke B was fed, although no tar collected when feeding Pet Coke A. The tar that resulted when Pet Coke B was fed was likely caused by the char particles of the second type, as described above. The average tar yield from over 50 experimental runs when feeding Pet Coke B in the HPFFB reactor was 1.4 wt% with a standard deviation of 0.5 wt%, although tar yields as high as 3.1 wt% were measured. This is important because even low tar yields in industrial processes can cause problems by corroding equipment, causing damage to motors and turbines, lowering catalyst efficiency, and condensing in transfer lines (Vassilatos et al., 1992; Brage et al., 1996; Baumlin et al., 2005). Gasification Model. Although more complicated models exist (Liu and Niksa, 2004; Shurtz, 2011), the char mass release data from the CO2 gasification experiments in the HPFFB reactor were modeled with a simple first-order global model where the rate is normalized by particle external surface area:
9
surfCOp
surfCOrxnp
p PTR
EAPk
Adt
dm,2,2 exp
1
(2)
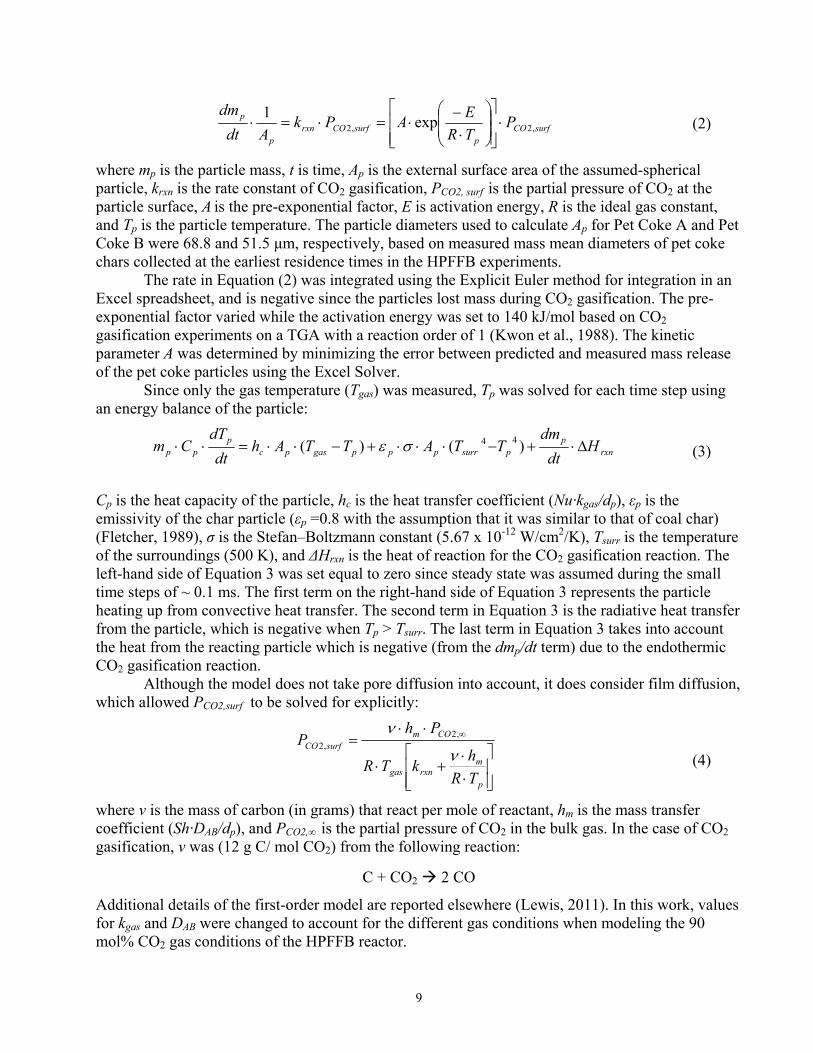
where mp is the particle mass, t is time, Ap is the external surface area of the assumed-spherical particle, krxn is the rate constant of CO2 gasification, PCO2, surf is the partial pressure of CO2 at the particle surface, A is the pre-exponential factor, E is activation energy, R is the ideal gas constant, and Tp is the particle temperature. The particle diameters used to calculate Ap for Pet Coke A and Pet Coke B were 68.8 and 51.5 μm, respectively, based on measured mass mean diameters of pet coke chars collected at the earliest residence times in the HPFFB experiments.
The rate in Equation (2) was integrated using the Explicit Euler method for integration in an Excel spreadsheet, and is negative since the particles lost mass during CO2 gasification. The pre-exponential factor varied while the activation energy was set to 140 kJ/mol based on CO2 gasification experiments on a TGA with a reaction order of 1 (Kwon et al., 1988). The kinetic parameter A was determined by minimizing the error between predicted and measured mass release of the pet coke particles using the Excel Solver. Since only the gas temperature (Tgas) was measured, Tp was solved for each time step using an energy balance of the particle:
rxnp
psurrpppgaspcp
pp Hdt
dmTTATTAh
dt
dTCm )()( 44
(3)
Cp is the heat capacity of the particle, hc is the heat transfer coefficient (Nu·kgas/dp), εp is the emissivity of the char particle (εp =0.8 with the assumption that it was similar to that of coal char) (Fletcher, 1989), σ is the Stefan–Boltzmann constant (5.67 x 10⁻¹² W/cm2/K), Tsurr is the temperature of the surroundings (500 K), and ΔHrxn is the heat of reaction for the CO2 gasification reaction. The left-hand side of Equation 3 was set equal to zero since steady state was assumed during the small time steps of ~ 0.1 ms. The first term on the right-hand side of Equation 3 represents the particle heating up from convective heat transfer. The second term in Equation 3 is the radiative heat transfer from the particle, which is negative when Tp > Tsurr. The last term in Equation 3 takes into account the heat from the reacting particle which is negative (from the dmp/dt term) due to the endothermic CO2 gasification reaction.
Although the model does not take pore diffusion into account, it does consider film diffusion, which allowed PCO2,surf to be solved for explicitly:
p
mrxngas
COmsurfCO
TR
hkTR
PhP
,2,2
(4)
where ν is the mass of carbon (in grams) that react per mole of reactant, hm is the mass transfer coefficient (Sh·DAB/dp), and PCO2,∞ is the partial pressure of CO2 in the bulk gas. In the case of CO2 gasification, ν was (12 g C/ mol CO2) from the following reaction:
C + CO2 2 CO
Additional details of the first-order model are reported elsewhere (Lewis, 2011). In this work, values for kgas and DAB were changed to account for the different gas conditions when modeling the 90 mol% CO2 gas conditions of the HPFFB reactor.

10
Modeling Results. The kinetic parameter A was regressed for both Pet Coke A and Pet Coke B using different combinations of measured mass release CO2 gasification data from the HPFFB reactor. As described above, E was set to 140 kJ/mol in all cases. For ease of explanation, Cases #1 through #3 will be used to identify which pet coke mass release data were used to regress A. As summarized in Table 3, Cases #1 and #2 included the mass release data at conditions where the post-flame environment in the HPFFB was near 40 and 90 mol%, respectively. Case #3 included all the pet coke mass release data from Cases #1 and #2.
Table 3. Identifier of which mass release data from the HPFFB was used to regress A
Total Pressure (atm); Peak Tgas (K)
mol% CO2 in post-flame environment
Case #1 10 atm; 1909 K 15 atm; 1734 K 15 atm; 1968 K
~40
Case #2 10 atm; 1808 K 15 atm; 1723 K 15 atm; 1848 K
~90
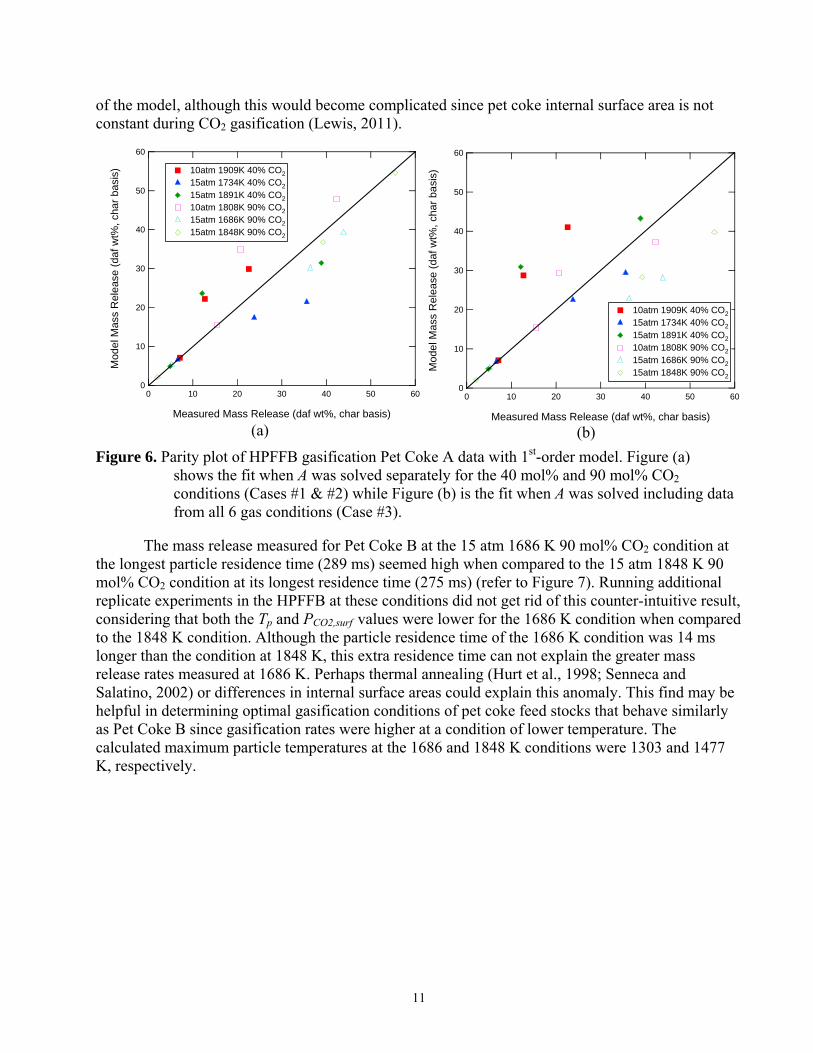
Case #3 all data from Cases #1 & #2 all data from Cases #1 & #2 The regressed A values for the three data sets are summarized for Pet Coke A and Pet Coke B in Table 4. The parity plots shown in Figure 6a and b show how the measured pet coke mass release data of Pet Coke A (on a char basis) compared with that predicted by the 1st-order gasification model using kinetic parameters in Table 4. Parity plots for Pet Coke B are included in Figures 7a and b, where mass release values of pet coke are also shown on a char basis. Also included in Table 4 is the range of PCO2,surf and Tp values of the experimental data from which A values were regressed, as calculated by Equations 3 and 4.
Table 4. 1st-order kinetic rate coefficients for CO2 gasification of Pet Cokes A and B
Pet coke data
used to optimize A
Pet
Coke Sample
E
(kJ/mol)
A
2
2 COatmscm
Carbong
PCO2,surf (atm)
Tp (K)
Case #1 A 140 29.4 3.5 – 6.1 1216 – 1717 Case #1 B 140 38.0 3.4 – 6.0 1205 – 1665 Case #2 A 140 131.6 7.0 - 12.4 1109 – 1498 Case #2 B 140 73.2 6.8 - 12.6 1089 – 1530 Case #3 A 140 58.3 3.5 - 12.4 1109 - 1717 Case #3 B 140 54.8 3.4 - 12.6 1089 - 1665
The fits of the 1st-order gasification model in Figures 6 and 7 are decent considering the
simplicity of the model. The discrepancy between modeled and measured mass release values for the two pet coke samples would likely be lessened by adding complexities to the model (Equation 2). For example, adding an effectiveness factor to the model would allow insight into the effect of pore diffusion on the measured rates. Currently, the reaction order, n, of PCO2,surf is unity in Equation 2, but allowing n to vary would likely improve the fit of the model. Also, rates were normalized by external surface area. Perhaps normalizing the rates by internal surface area would improve the fits
11
of the model, although this would become complicated since pet coke internal surface area is not constant during CO2 gasification (Lewis, 2011).
(a)
(b)
Figure 6. Parity plot of HPFFB gasification Pet Coke A data with 1st-order model. Figure (a) shows the fit when A was solved separately for the 40 mol% and 90 mol% CO2 conditions (Cases #1 & #2) while Figure (b) is the fit when A was solved including data from all 6 gas conditions (Case #3).
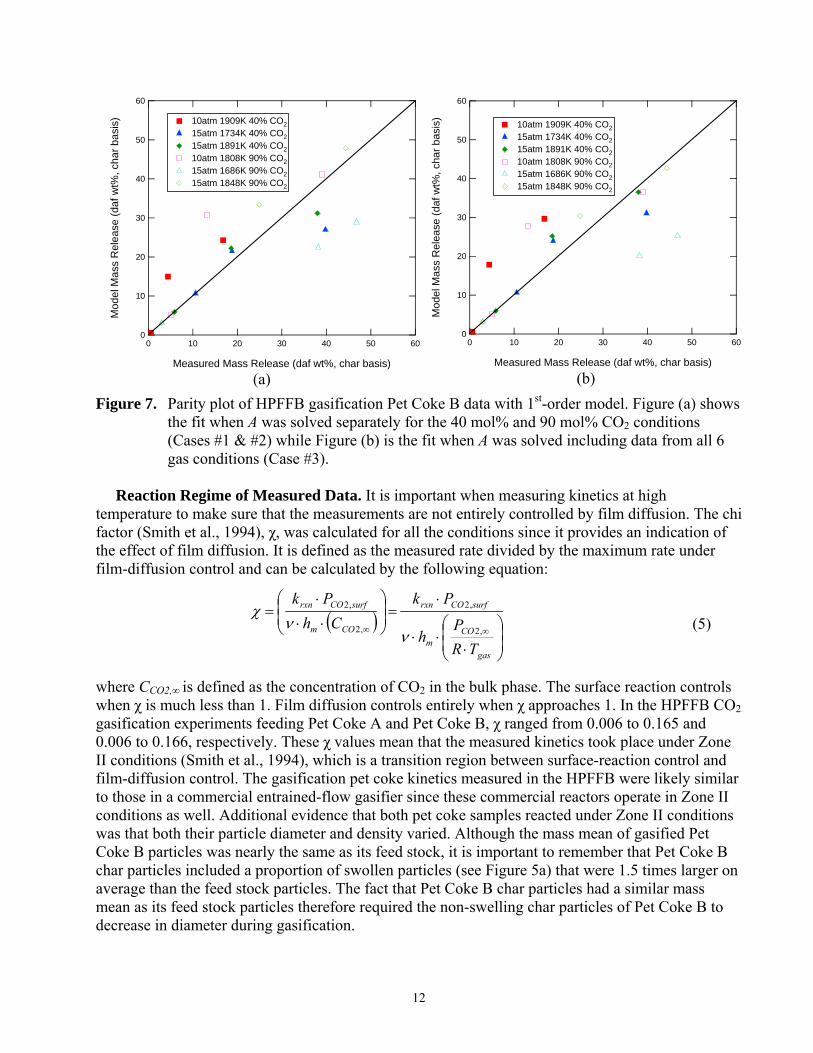
The mass release measured for Pet Coke B at the 15 atm 1686 K 90 mol% CO2 condition at
the longest particle residence time (289 ms) seemed high when compared to the 15 atm 1848 K 90 mol% CO2 condition at its longest residence time (275 ms) (refer to Figure 7). Running additional replicate experiments in the HPFFB at these conditions did not get rid of this counter-intuitive result, considering that both the Tp and PCO2,surf values were lower for the 1686 K condition when compared to the 1848 K condition. Although the particle residence time of the 1686 K condition was 14 ms longer than the condition at 1848 K, this extra residence time can not explain the greater mass release rates measured at 1686 K. Perhaps thermal annealing (Hurt et al., 1998; Senneca and Salatino, 2002) or differences in internal surface areas could explain this anomaly. This find may be helpful in determining optimal gasification conditions of pet coke feed stocks that behave similarly as Pet Coke B since gasification rates were higher at a condition of lower temperature. The calculated maximum particle temperatures at the 1686 and 1848 K conditions were 1303 and 1477 K, respectively.
60
50
40
30
20
10
0
Mod
el M
ass
Rel
eas
e (
da
f wt%
, cha
r b
asis
)
6050403020100
Measured Mass Release (daf wt%, char basis)
10atm 1909K 40% CO2
15atm 1734K 40% CO2
15atm 1891K 40% CO2
10atm 1808K 90% CO2
15atm 1686K 90% CO2
15atm 1848K 90% CO2
60
50
40
30
20
10
0
Mod
el M
ass
Rel
ease
(da
f wt%
, cha
r ba
sis)
6050403020100
Measured Mass Release (daf wt%, char basis)
10atm 1909K 40% CO2
15atm 1734K 40% CO2
15atm 1891K 40% CO2
10atm 1808K 90% CO2
15atm 1686K 90% CO2
15atm 1848K 90% CO2
12
(a)
(b)
Figure 7. Parity plot of HPFFB gasification Pet Coke B data with 1st-order model. Figure (a) shows the fit when A was solved separately for the 40 mol% and 90 mol% CO2 conditions (Cases #1 & #2) while Figure (b) is the fit when A was solved including data from all 6 gas conditions (Case #3).
Reaction Regime of Measured Data. It is important when measuring kinetics at high temperature to make sure that the measurements are not entirely controlled by film diffusion. The chi factor (Smith et al., 1994), χ, was calculated for all the conditions since it provides an indication of the effect of film diffusion. It is defined as the measured rate divided by the maximum rate under film-diffusion control and can be calculated by the following equation:
gas
COm
surfCOrxn
COm
surfCOrxn
TR
Ph
Pk
Ch
Pk
,2
,2
,2
,2
(5)
where CCO2,∞ is defined as the concentration of CO2 in the bulk phase. The surface reaction controls when χ is much less than 1. Film diffusion controls entirely when χ approaches 1. In the HPFFB CO2 gasification experiments feeding Pet Coke A and Pet Coke B, χ ranged from 0.006 to 0.165 and 0.006 to 0.166, respectively. These χ values mean that the measured kinetics took place under Zone II conditions (Smith et al., 1994), which is a transition region between surface-reaction control and film-diffusion control. The gasification pet coke kinetics measured in the HPFFB were likely similar to those in a commercial entrained-flow gasifier since these commercial reactors operate in Zone II conditions as well. Additional evidence that both pet coke samples reacted under Zone II conditions was that both their particle diameter and density varied. Although the mass mean of gasified Pet Coke B particles was nearly the same as its feed stock, it is important to remember that Pet Coke B char particles included a proportion of swollen particles (see Figure 5a) that were 1.5 times larger on average than the feed stock particles. The fact that Pet Coke B char particles had a similar mass mean as its feed stock particles therefore required the non-swelling char particles of Pet Coke B to decrease in diameter during gasification.
60
50
40
30
20
10
0
Mod
el M
ass
Rel
ease
(da
f wt%
, cha
r ba
sis)
6050403020100
Measured Mass Release (daf wt%, char basis)
10atm 1909K 40% CO2
15atm 1734K 40% CO2
15atm 1891K 40% CO2
10atm 1808K 90% CO2
15atm 1686K 90% CO2
15atm 1848K 90% CO2
60
50
40
30
20
10
0
Mo
del M
ass
Rel
ease
(d
af w
t%, c
har
bas
is)
6050403020100
Measured Mass Release (daf wt%, char basis)
10atm 1909K 40% CO2
15atm 1734K 40% CO2
15atm 1891K 40% CO2
10atm 1808K 90% CO2
15atm 1686K 90% CO2
15atm 1848K 90% CO2
13
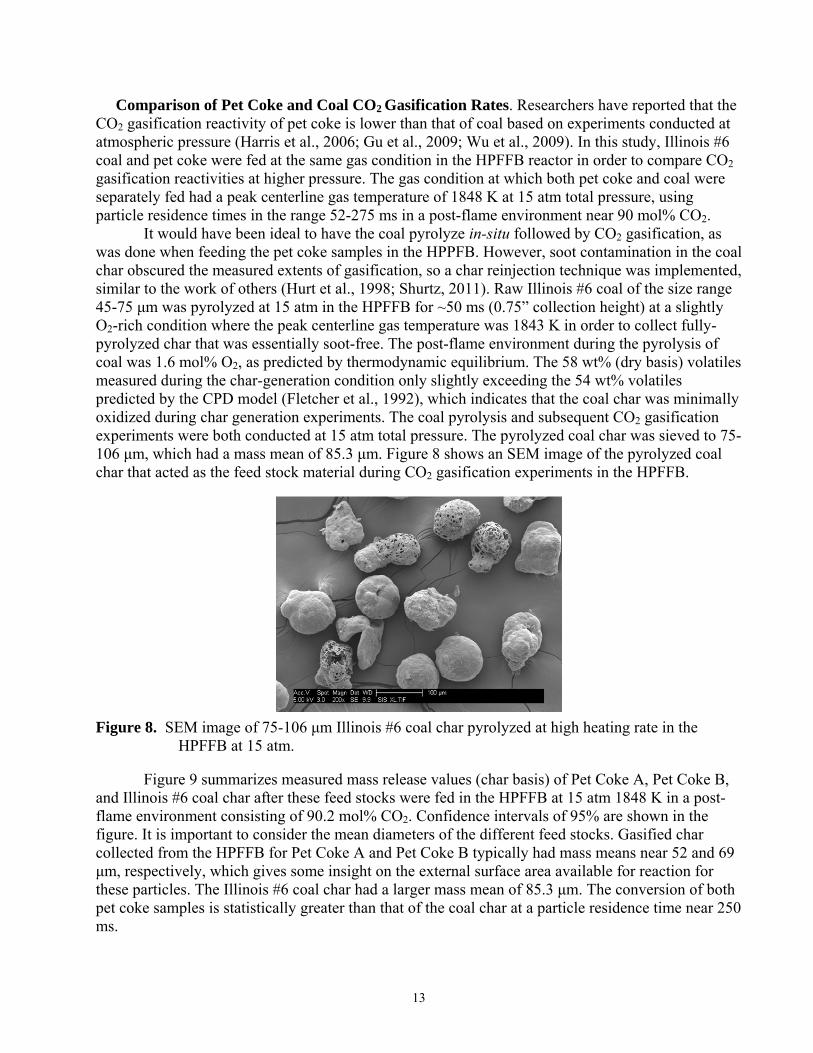
Comparison of Pet Coke and Coal CO2 Gasification Rates. Researchers have reported that the CO2 gasification reactivity of pet coke is lower than that of coal based on experiments conducted at atmospheric pressure (Harris et al., 2006; Gu et al., 2009; Wu et al., 2009). In this study, Illinois #6 coal and pet coke were fed at the same gas condition in the HPFFB reactor in order to compare CO2 gasification reactivities at higher pressure. The gas condition at which both pet coke and coal were separately fed had a peak centerline gas temperature of 1848 K at 15 atm total pressure, using particle residence times in the range 52-275 ms in a post-flame environment near 90 mol% CO2. It would have been ideal to have the coal pyrolyze in-situ followed by CO2 gasification, as was done when feeding the pet coke samples in the HPPFB. However, soot contamination in the coal char obscured the measured extents of gasification, so a char reinjection technique was implemented, similar to the work of others (Hurt et al., 1998; Shurtz, 2011). Raw Illinois #6 coal of the size range 45-75 μm was pyrolyzed at 15 atm in the HPFFB for ~50 ms (0.75” collection height) at a slightly O2-rich condition where the peak centerline gas temperature was 1843 K in order to collect fully-pyrolyzed char that was essentially soot-free. The post-flame environment during the pyrolysis of coal was 1.6 mol% O2, as predicted by thermodynamic equilibrium. The 58 wt% (dry basis) volatiles measured during the char-generation condition only slightly exceeding the 54 wt% volatiles predicted by the CPD model (Fletcher et al., 1992), which indicates that the coal char was minimally oxidized during char generation experiments. The coal pyrolysis and subsequent CO2 gasification experiments were both conducted at 15 atm total pressure. The pyrolyzed coal char was sieved to 75-106 μm, which had a mass mean of 85.3 μm. Figure 8 shows an SEM image of the pyrolyzed coal char that acted as the feed stock material during CO2 gasification experiments in the HPFFB.
Figure 8. SEM image of 75-106 μm Illinois #6 coal char pyrolyzed at high heating rate in the HPFFB at 15 atm.
Figure 9 summarizes measured mass release values (char basis) of Pet Coke A, Pet Coke B, and Illinois #6 coal char after these feed stocks were fed in the HPFFB at 15 atm 1848 K in a post-flame environment consisting of 90.2 mol% CO2. Confidence intervals of 95% are shown in the figure. It is important to consider the mean diameters of the different feed stocks. Gasified char collected from the HPFFB for Pet Coke A and Pet Coke B typically had mass means near 52 and 69 μm, respectively, which gives some insight on the external surface area available for reaction for these particles. The Illinois #6 coal char had a larger mass mean of 85.3 μm. The conversion of both pet coke samples is statistically greater than that of the coal char at a particle residence time near 250 ms.

14
The 1st-order gasification model described above was used to solve for the kinetic parameter A solely using measured mass release data of the 3 feed stocks at the 15 atm 1848 K 90 mol% CO2 condition. The activation energy, E, was set constant to 140 kJ/mol, as discussed previously. The regressed A values for Pet Coke A, Pet Coke B, and Ill #6 coal char were 144.7, 51.5, and 2.8 g C/cm2/s/atm CO2, respectively. These values indicate that the CO2 gasification rates were higher for both pet coke samples than the coal char, at least when the rate was normalized by external surface area of the particles. The feed stock Pet Coke A was also shown to have a higher CO2 gasification reactivity than a low-rank coal that gasified after in-situ pyrolysis in the HPFFB, but only at higher pressures (Lewis, 2011).
Figure 9. Comparison of mass release (char basis) of Pet Coke A, Pet Coke B, and Ill #6 coal char at 15 atm 1848 K condition in the HPFFB with a post-flame environment near 90 mol% CO2. Error bars denote 95% confidence intervals.
4. Conclusions
The gasification of two petroleum coke samples from industry was studied in this research. The ASTM volatiles value of petroleum coke appeared to be a good approximation of the mass release experienced during pyrolysis, even at conditions of high initial particle heating rate. The morphology of the two petroleum cokes was evaluated based on SEM images of chars collected from the HPFFB reactor. The structure of Pet Coke A had cracks in its surface, but otherwise appeared very similar to that of raw petroleum coke. It is believed that the cracks were the result of the volatiles quickly escaping the particle interior, which was influenced by the high particle heating rates the particles experienced. The structure of anode-grade Pet Coke B char contained a fraction of swollen, thin-shelled particles that resembled pyrolyzed bituminous coal chars from high heating rate conditions.
The CO2 gasification experiments were conducted at total pressures of 10 and 15 atm in a high-pressure flat-flame burner reactor at conditions were the bulk phase consisted of ~40 and ~90 mol% CO2. The apparent CO2 char gasification rates of these two samples were measured following in-situ pyrolysis in the reactor in the gas temperature and bulk CO2 partial pressure ranges of 1169-1909 K and 4.1-13.5 atm, respectively. A simple 1st-order model was used to model the global CO2 gasification rates for the two petroleum coke chars. The measured char CO2 gasification rates are believed to be representative of those from an entrained-flow gasifier since they were measured in similar conditions of elevated pressure and high initial particle heating rates (105 K/s) with short
70
60
50
40
30
20
10
0
% d
af M
ass
Rel
ease
, ch
ar b
asis
300250200150100500
Particle Residence Time (ms)
Pet Coke A Pet Coke B Ill #6 Coal Char
15
particle residence times (< 302 ms). The two pet coke samples reacted in a transition region between surface-reaction control and film-diffusion control, evidenced by their changing particle density and diameter.
The CO2 gasification rates for both pet coke samples were shown to be higher than a bituminous coal when comparing mass release data collected from the same gas condition in the HPFFB reactor (15 atm 1848 K; 90 mol% CO2 environment). These results differ from reports in the literature based on atmospheric-pressure experiments that petroleum coke has a lower CO2 gasification reactivity than coal. Acknowledgements
This research was funded in part by Grant 2009-10006-06020 from the US Department of Agriculture/NIFA. However, any opinions, findings, conclusions or other recommendations expressed herein are those of the authors and do not necessarily reflect the views of NIFA. The authors wish to acknowledge BYU’s Microscopy lab for their assistance in obtaining the SEM images. References Baumlin, S., F. Broust, M. Ferrer, N. Meunier, E. Marty and J. Lede, "The Continuous Self Stirred
Tank Reactor: Measurement of the Cracking Kinetics of Biomass Pyrolysis Vapours," Chemical Engineering Science, 60(1), 41-55 (2005).
Borrego, A. G. and D. Alvarez, "Comparison of Chars Obtained under Oxy-Fuel and Conventional Pulverized Coal Combustion Atmospheres," Energy & Fuels, 21(6), 3171-3179 (2007).
Borrego, A. G., L. Garavaglia and W. D. Kalkreuth, "Characteristics of High Heating Rate Biomass Chars Prepared under N2 and CO2 Atmospheres," International Journal of Coal Geology, 77(3-4), 409-415 (2009).
Brage, C., Q. H. Yu and K. Sjostrom, "Characteristics of Evolution of Tar from Wood Pyrolysis in a Fixed-Bed Reactor," Fuel, 75(2), 213-219 (1996).
Cetin, E., B. Moghtaderi, R. Gupta and T. F. Wall, "Biomass Gasification Kinetics: Influences of Pressure and Char Structure," Combustion Science and Technology, 177(4), 765-791 (2005).
Fisher, P. H., "Pet Coke Consulting," Retrieved August 15, 2012 from http://www.petcokeconsulting.com (2011).
Fletcher, T. H., "Time-Resolved Temperature-Measurements of Individual Coal Particles During Devolatilization," Combustion Science and Technology, 63(1-3), 89-105 (1989).
Fletcher, T. H., A. R. Kerstein, R. J. Pugmire, M. S. Solum and D. M. Grant, "Chemical Percolation Model for Devolatilization .3. Direct Use of C-13 NMR Data to Predict Effects of Coal Type," Energy & Fuels, 6(4), 414-431 (1992).
Gu, J., S. Wu, Y. Wu and J. Gao, "Co2-Gasification Reactivity of Different Carbonaceous Materials at Elevated Temperatures," Energy Sources Part a-Recovery Utilization and Environmental Effects, 31(3), 232-243 (2009).
Harris, D. J., D. G. Roberts and D. G. Henderson, "Gasification Behaviour of Australian Coals at High Temperature and Pressure," Fuel, 85(2), 134-142 (2006).
Higman, C. and M. v. d. Burgt, Gasification, London, Elsevier Science (2003). Hurt, R., J. K. Sun and M. Lunden, "A Kinetic Model of Carbon Burnout in Pulverized Coal
Combustion," Combustion and Flame, 113(1-2), 181-197 (1998).
16
Jamaluddin, A. S., J. S. Truelove and T. F. Wall, "Devolatilization of Bituminous Coals at Medium to High Heating Rates," Combustion and Flame, 63(3), 329-337 (1986).
Kocaefe, D., A. Charette and L. Castonguay, "Green Coke Pyrolysis - Investigation of Simultaneous Changes in Gas and Solid-Phases," Fuel, 74(6), 791-799 (1995).
Kwon, T. W., S. D. Kim and D. P. C. Fung, "Reaction-Kinetics of Char-CO2 Gasification," Fuel, 67(4), 530-535 (1988).
Lewis, A., ""Gasification of Biomass and Petroleum Coke by CO2 at High Heating Rates and Elevated Pressure,"" PhD Dissertation, Brigham Young University (in progress 2013).
Lewis, A. D., "Sawdust Pyrolysis and Petroleum Coke CO2 Gasification at High Heating Rates," Master's Thesis, Brigham Young University (2011).
Liu, G. S. and S. Niksa, "Coal Conversion Submodels for Design Applications at Elevated Pressures. Part II. Char Gasification," Progress in Energy and Combustion Science, 30(6), 679-717 (2004).
Liu, K., Z. Cui and T. H. Fletcher, "Coal Gasification.", in Hydrogen and Syngas Production and Purification Technologies, (K. Liu, C. Song, and V. Subramani, eds.), pp. 156-218, John Wiley & Sons, New Jersey (2010).
Ma, J., "Soot Formation During Coal Pyrolysis," PhD Dissertation, Brigham Young University (1996).
Ma, J., T. H. Fletcher and B. W. Webb, "Conversion of Coal Tar to Soot During Coal Pyrolysis in a Post-Flame Environment," Twenty-Sixth Symposium (International) on Combustion. The Combustion Institute. Napoli, Italy. pp. 3161-3167 (1996).
National Energy Technology Laboratory "Gasification Worldwide Database. http://www.netl.doe.gov/technologies/coalpower/gasification/worlddatabase," (2010).
Senneca, O. and P. Salatino, "Loss of Gasification Reactivity toward O2 and CO2 Upon Heat Treatment of Carbons," Proceedings of the Combustion Institute, 29, 485-493 (2002).
Shurtz, R., "Effects of Pressure on the Properties of Coal Char under Gasification Conditions at High Initial Heating Rates," PhD Dissertation, Brigham Young University (2011).
Shurtz, R. C., J. W. Hogge, K. C. Fowers, G. S. Sorensen and T. H. Fletcher, "Coal Swelling Model for Pressurized High Particle Heating Rate Pyrolysis Applications," Energy & Fuels, 26(6), 3612-3627 (2012).
Smith, K. L., L. D. Smoot, T. H. Fletcher and R. J. Pugmire, The Structure and Reaction Processes of Coal, New York, Plenum Press (1994).
Smoot, L. D. and P. J. Smith, Coal Combustion and Gasification, New York, Plenum Press (1985). Solomon, P. R., T. H. Fletcher and R. J. Pugmire, "Progress in Coal Pyrolysis," Fuel, 72(5), 587-597
(1993). Turkdogan, E. T. and J. V. Vinters, "Effect of Carbon Monoxide on the Rate of Oxidation of
Charcoal, Graphite and Coke in Carbon Dioxide," Carbon, 8, 39-53 (1970). Vassilatos, V., G. Taralas, K. Sjostrom and E. Bjornbom, "Catalytic Cracking of Tar in Biomass
Pyrolysis-Gas in the Presence of Calcined Dolomite," Canadian Journal of Chemical Engineering, 70(5), 1008-1013 (1992).
Wu, Y. Q., S. Y. Wu, J. Gu and J. S. Gao, "Differences in Physical Properties and CO2 Gasification Reactivity between Coal Char and Petroleum Coke," Process Safety and Environmental Protection, 87(5), 323-330 (2009).
Wu, Y. Q., S. Y. Wu, S. Huang and J. S. Gao, "The Physical Properties and Gasification Activities of Pressurized Rapid Pyrolysis Chars from Coal and Petroleum Coke," Energy Sources Part A-Recovery Utilization and Environmental Effects, 34(16), 1505-1515 (2012).
17
Yu, J. L., J. A. Lucas and T. F. Wall, "Formation of the Structure of Chars During Devolatilization of Pulverized Coal and Its Thermoproperties: A Review," Progress in Energy and Combustion Science, 33(2), 135-170 (2007).
Zamalloa, M. and T. A. Utigard, "Characterization of Industrial Coke Structures," ISIJ International, 35(5), 449-457 (1995).
Zhang, H., "Nitrogen Evolution and Soot Formation During Secondary Coal Pyrolysis," PhD Dissertation, Brigham Young University (2001).
Zhang, H. F. and T. H. Fletcher, "Nitrogen Transformations During Secondary Coal Pyrolysis," Energy & Fuels, 15(6), 1512-1522 (2001).