Embed Size (px)
Citation preview
Pyrite in the Pepegoona, Pepegoona West and
Pannikan uranium deposits, Lake Eyre Basin, S.A.:
implications for regional uranium exploration
Thesis submitted in accordance with the requirements of the University of Adelaide for an Honours Degree in Geology
Edwina Ingham
November 2012
1
TITLE
Pyrite in the Pepegoona, Pepegoona West and Pannikan uranium deposits, Lake Eyre
Basin, S.A.: implications for regional uranium exploration
RUNNING TITLE
Pyrite Geochemistry at Beverley North
ABSTRACT
The common sulphide mineral pyrite is abundant throughout sedimentary uranium
systems at Pepegoona, Pepegoona West and Pannikan, South Australia. No in-depth
geochemical and textural characterisation of this important mineral has previously been
conducted. Multiple micro-analytical techniques have successfully constrained textural
and chemical patterns within the pyrite. Results point to variation in fluid composition,
sulphur source and precipitation conditions during a protracted mineralisation event.
In-situ micron-scale sulphur isotope analysis of pyrite demonstrated broad-scale
isotopic heterogeneity (34
S= -43.9 to +32.4‰CDT), indicative of complex, multi-faceted
pyrite evolution and sulphur derived from two or more sources. Preserved textures
support this assertion and indicate a genetic model involving more than one phase of
pyrite formation. Authigenic, pre-ore pyrite underwent prolonged evolution and
recrystallisation, evidenced by a genetic relationship between archetypal framboidal
aggregates and pyrite euhedra. Secondary hydrothermal pyrite commonly displayed
hyperenrichment of several trace elements (Mn, Co, Ni, As, Se, Mo, Sb, W and Tl) in
ore-bearing horizons. Hydrothermal fluids of magmatic and meteoric origin supplied
metals to the system but the geochemical signature of pyrite suggests a dominant
granitic source and influence of mafic lithologies. Irregular variation in 34
S, coupled
with oscillatory trace element zonation in secondary pyrite, is interpreted in terms of
continuous variations in fluid composition and possible cycles of diagenetic
recrystallisation. A late-stage oxidising fluid, which mobilised selenium from pre-
existing pyrite, caused ongoing pyrite re-crystallisation and precipitation of native
selenium.
These results provide the first qualitative constraints on the formation mechanisms of
the uranium deposits at Beverley North. Insight into depositional conditions and sources
of both sulphide and uranium mineralisation allow for a preliminary paragenetic scheme
for the ore systems. This new understanding of pyrite geochemistry can also underpin
an effective vector for uranium exploration, not only at Beverley North, but throughout
the sedimentary systems of the Lake Eyre Basin.
KEYWORDS
Pyrite, Beverley North, uranium exploration, sulphur isotopes, trace elements, Eyre
Formation
2
TABLE OF CONTENTS Title ................................................................................................................................... 1
Running title ..................................................................................................................... 1
Abstract ............................................................................................................................. 1
Keywords .......................................................................................................................... 1
List of Tables and Figures ................................................................................................ 3
INTRODUCTION ............................................................................................................ 6
GEOLOGICAL SETTING ............................................................................................... 7
Stratigraphy and tectonic evolution ................................................................................ 10
Uranium mineralisation in context of regional geology ................................................. 13
CONTROLS ON PYRITE CHEMISTRY ..................................................................... 15
Sulphur Isotopes ............................................................................................................. 16
METHODS ..................................................................................................................... 17
OBSERVATIONS & RESULTS ................................................................................... 19
Pyrite morphology and textural observations ................................................................. 19
Minor and trace elements in pyrite ................................................................................. 28
Sulphur isotopic composition ......................................................................................... 39
DISCUSSION ................................................................................................................. 42
Sulphur Sources .............................................................................................................. 43
Deposit-scale variations in trace element concentration of pyrite .................................. 45
Horizon-scale observations............................................................................................. 46
Pyrite Morphology and Textures .................................................................................... 48
Native selenium .............................................................................................................. 50
Representivity of the dataset........................................................................................... 52
CONCLUSIONS ............................................................................................................ 53
Acknowledgments .......................................................................................................... 54
References ...................................................................................................................... 55
3
LIST OF TABLES AND FIGURES
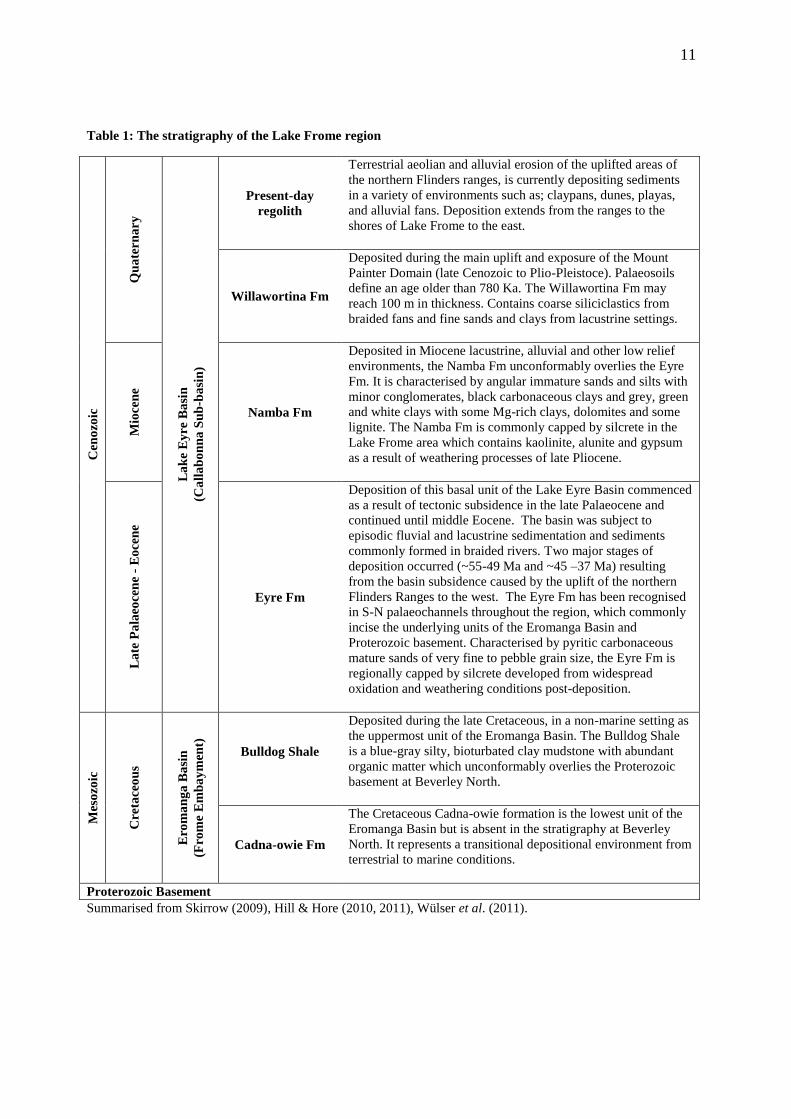
Table 1: The stratigraphy of the Lake Frome Region
Table 2: Summary table of LA-ICP-MS trace element data for pyrite (ppm)
Table 3: Minor elements show limited enrichment in pyrite from 16 samples from
EPMA analysis. Mean values are given in weight percent of the total pyrite (wt%)
Table 4: Pearsons Coefficients of the LA-ICP-MS Trace Element data for pyrite
(n=194) after logarithmic transformation
Table 5: Summary of data obtained during in-situ sulphur isotope analysis. Despite the
limited number of analyses per sample a large variation in sulphur isotopic composition
was recorded (Appendix F)
Figure 1: The location of the Beverley North uranium deposits in the context of the
regional geology. The Lake Frome Region (also commonly described as the Frome
Embayment) is broadly recognised as the area of the Callabonna sub-basin, proximal to
the Beverley and Beverley North deposits. The Lake Frome region is bound to the west
by the Mount Painter Domain and the Paralana Fault Zone. The Beverley North
uranium deposits, outlined in the dashed box are outlined in more detail by Figure 2.
Adapted from Wülser et al. (2011). .................................................................................. 8
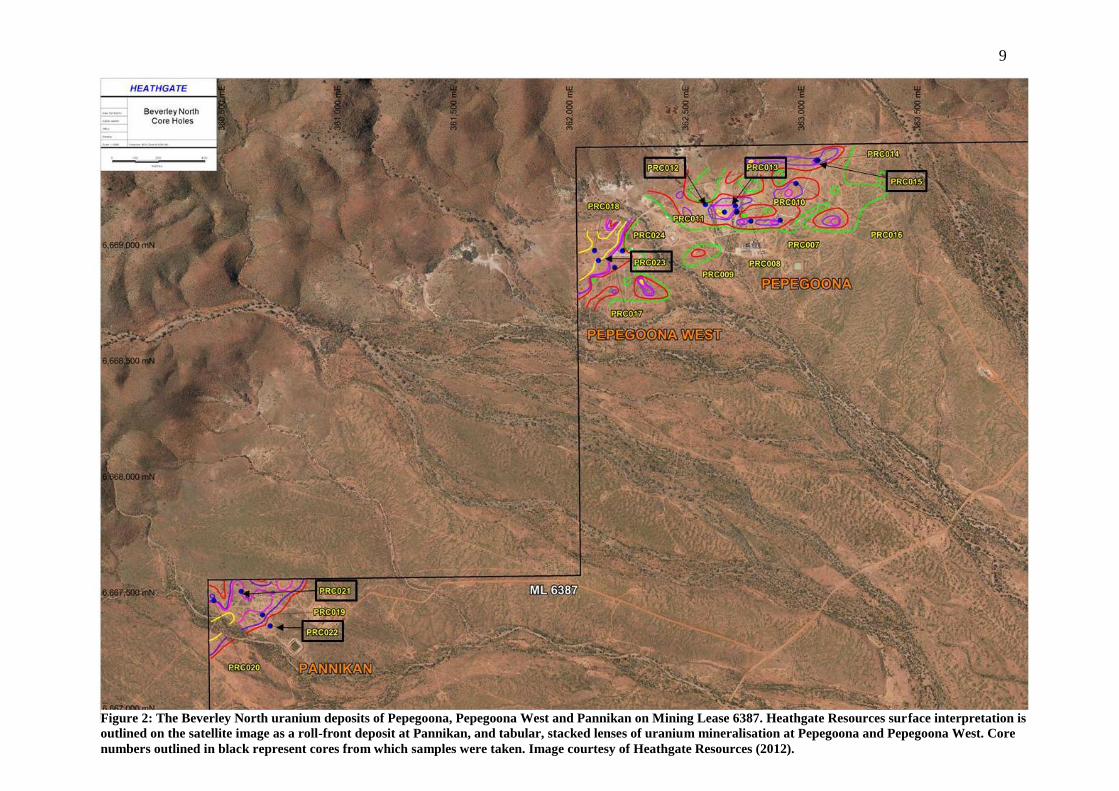
Figure 2: The Beverley North uranium deposits of Pepegoona, Pepegoona West and
Pannikan on Mining Lease 6387. Heathgate Resources surface interpretation is outlined
on the satellite image as a roll-front deposit at Pannikan, and tabular, stacked lenses of
uranium mineralisation at Pepegoona and Pepegoona West. Core numbers outlined in
black represent cores from which samples were taken. Image courtesy of Heathgate
Resources (2012). ............................................................................................................. 9
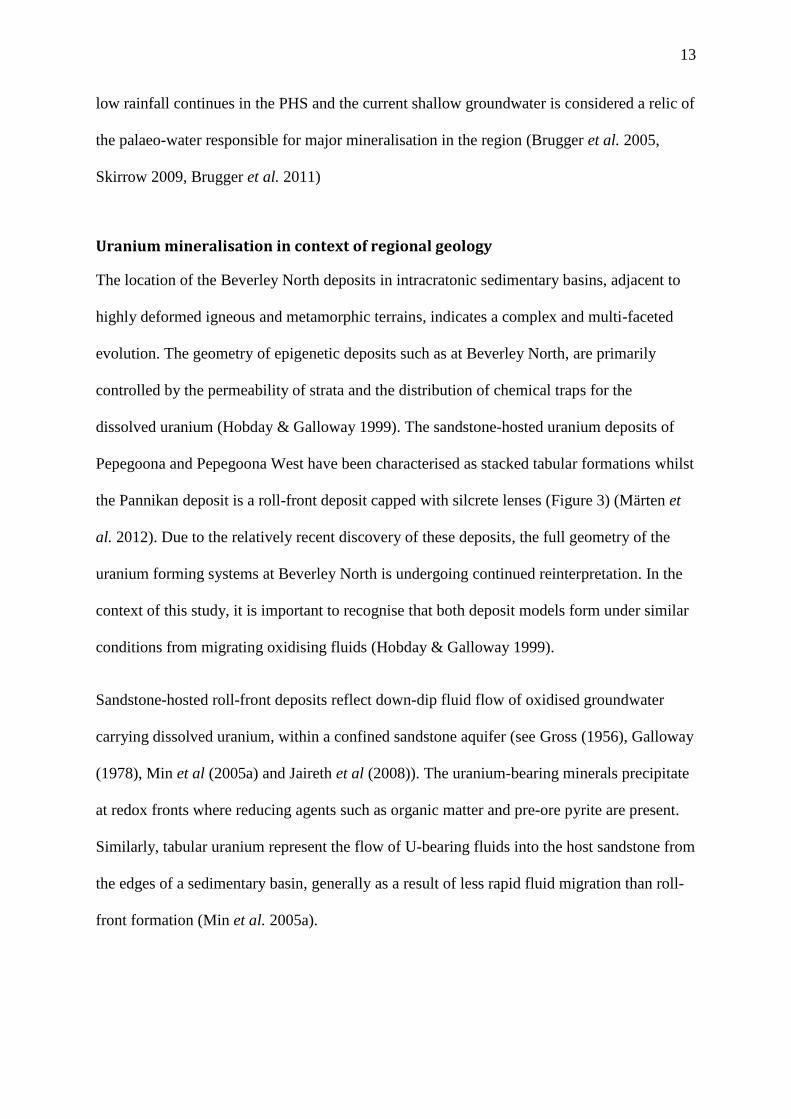
Figure 3: Schematic cross-section of the stratigraphy of the Lake Frome region hosting
the sandstone-hosted uranium deposits of Pepegoona, Pepegoona West and Pannikan.
The deposits are hosted by the Eocene Eyre Fm, and hence their genetic relationship
with the Miocene Namba Fm-hosted Beverley deposit is limited. Pepegoona and
Pepegoona West are broadly interpreted as stacked tabular lenses of uranium
mineralisation, whilst the Pannikan deposit hosts roll-front mineralisation. Both deposits
are associated with lenses of silcrete formation. Model courtesy of Heathgate Resources
(2012). ............................................................................................................................ 14
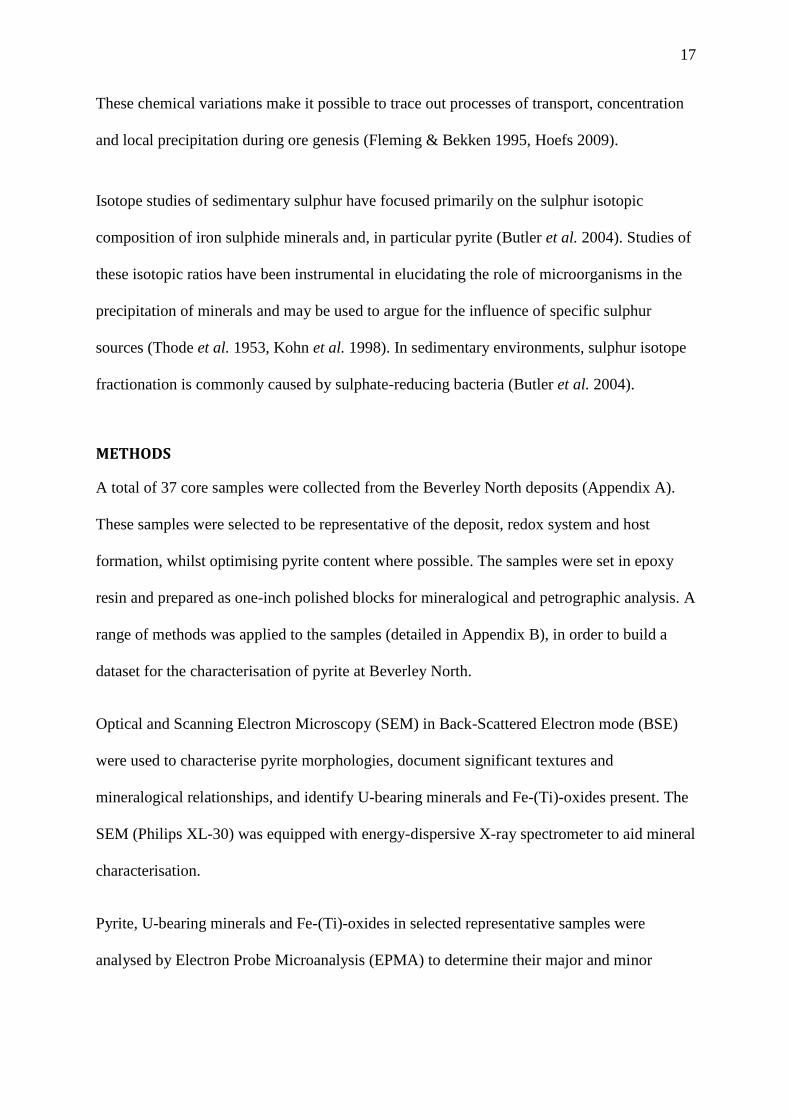
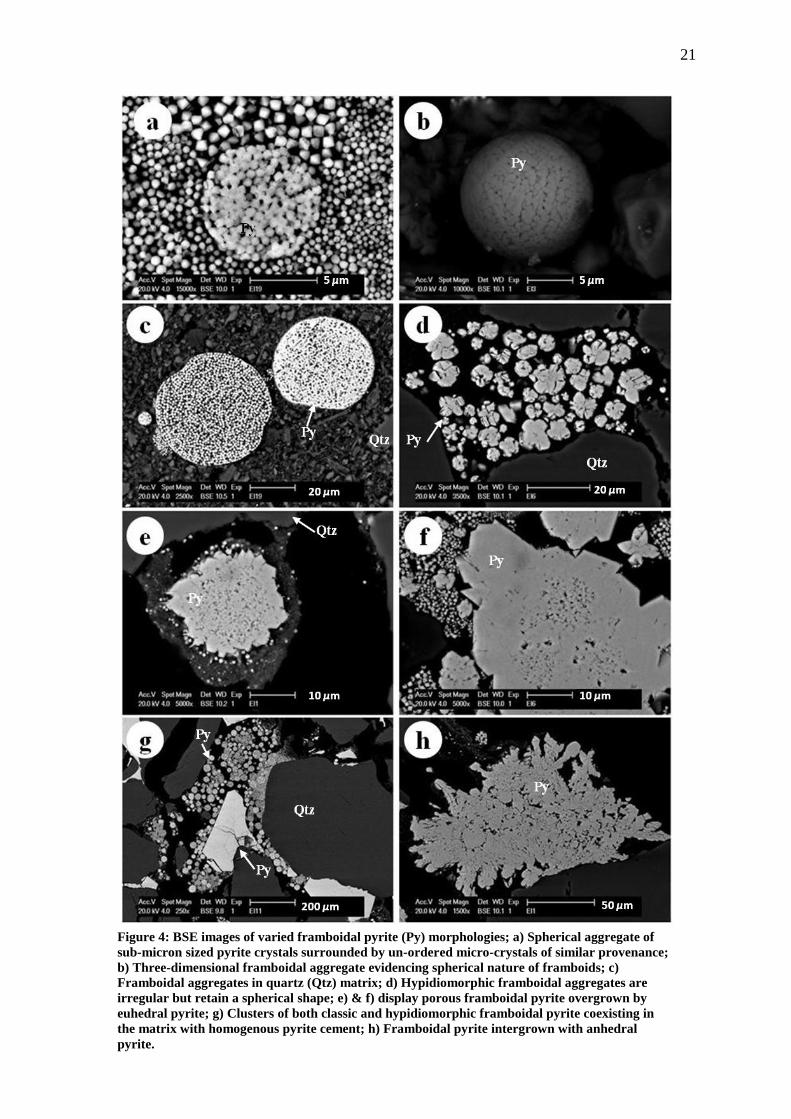
Figure 4: BSE images of varied framboidal pyrite (Py) morphologies; a) Spherical
aggregate of sub-micron sized pyrite crystals surrounded by un-ordered micro-crystals
of similar provenance; b) Three-dimensional framboidal aggregate evidencing spherical
nature of framboids; c) Framboidal aggregates in quartz (Qtz) matrix; d)
Hypidiomorphic framboidal aggregates are irregular but retain a spherical shape; e) & f)
display porous framboidal pyrite overgrown by euhedral pyrite; g) Clusters of both
classic and hypidiomorphic framboidal pyrite coexisting in the matrix with homogenous
pyrite cement; h) Framboidal pyrite intergrown with anhedral pyrite. .......................... 21
4
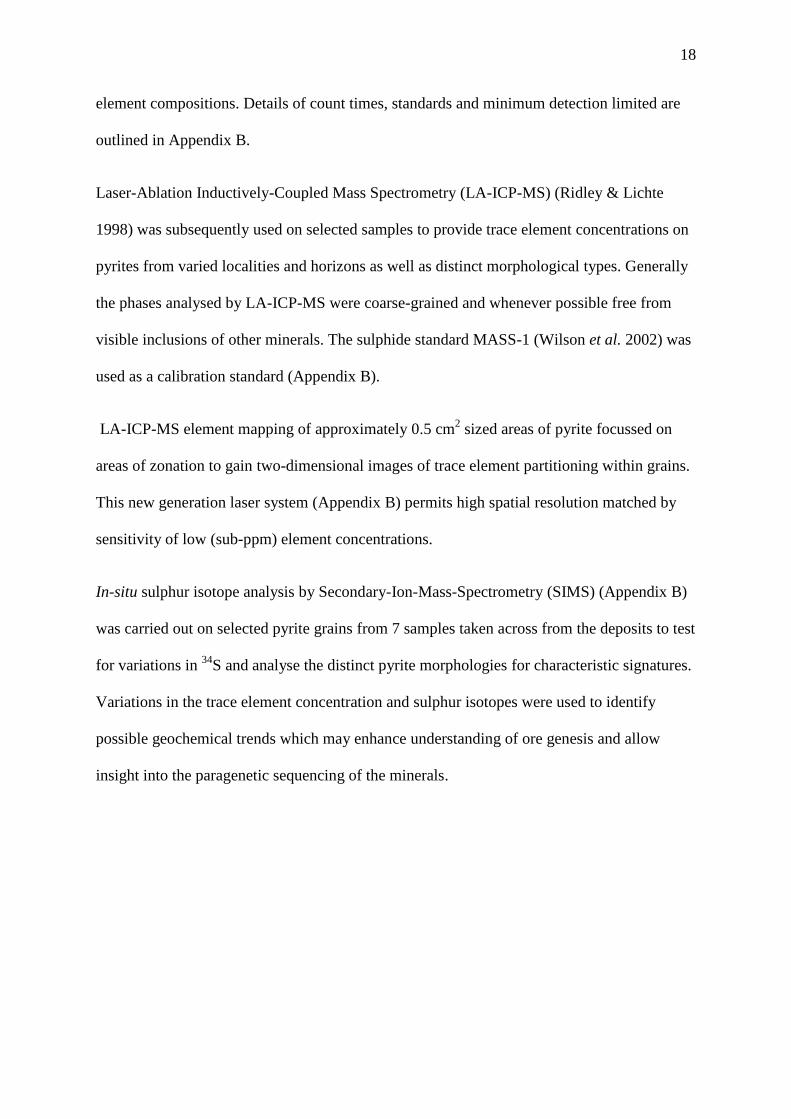
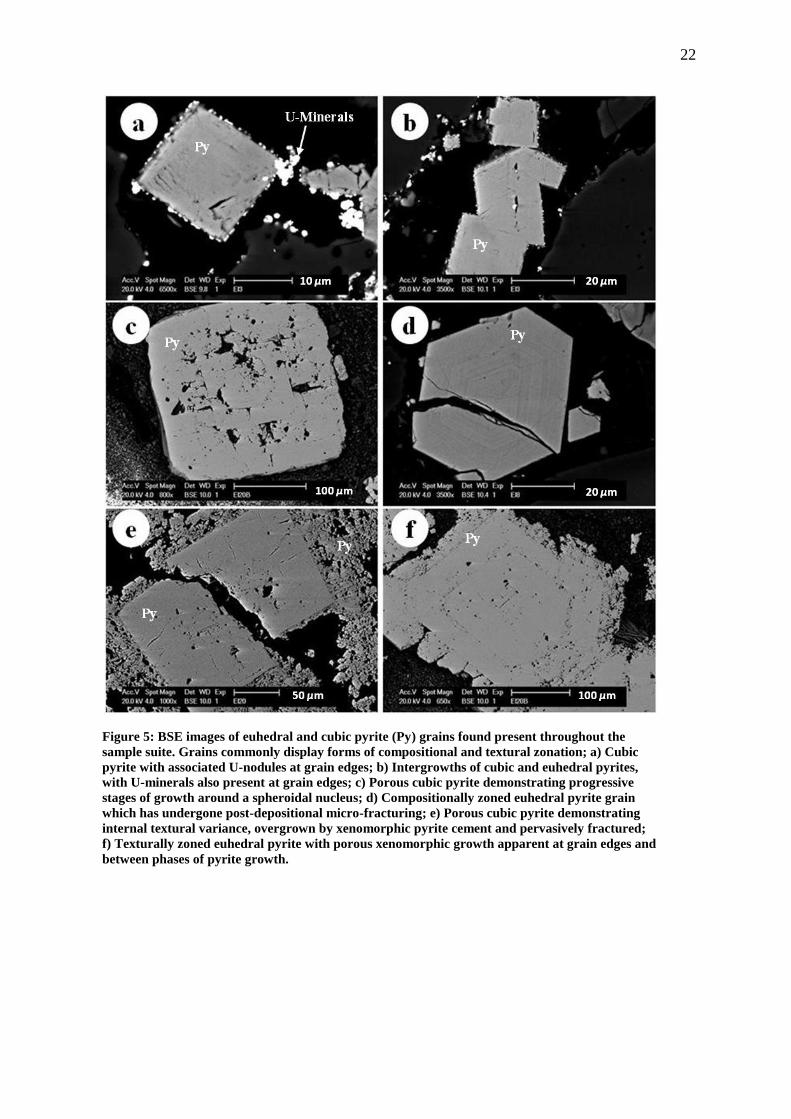
Figure 5: BSE images of euhedral and cubic pyrite (Py) grains found present
throughout the sample suite. Grains commonly display forms of compositional and
textural zonation; a) Cubic pyrite with associated U-nodules at grain edges; b)
Intergrowths of cubic and euhedral pyrites, with U-minerals also present at grain edges;
c) Porous cubic pyrite demonstrating progressive stages of growth around a spheroidal
nucleus; d) Compositionally zoned euhedral pyrite grain which has undergone post-
depositional micro-fracturing; e) Porous cubic pyrite demonstrating internal textural
variance, overgrown by xenomorphic pyrite cement and pervasively fractured; f)
Texturally zoned euhedral pyrite with porous xenomorphic growth apparent at grain
edges and between phases of pyrite growth. .................................................................. 22
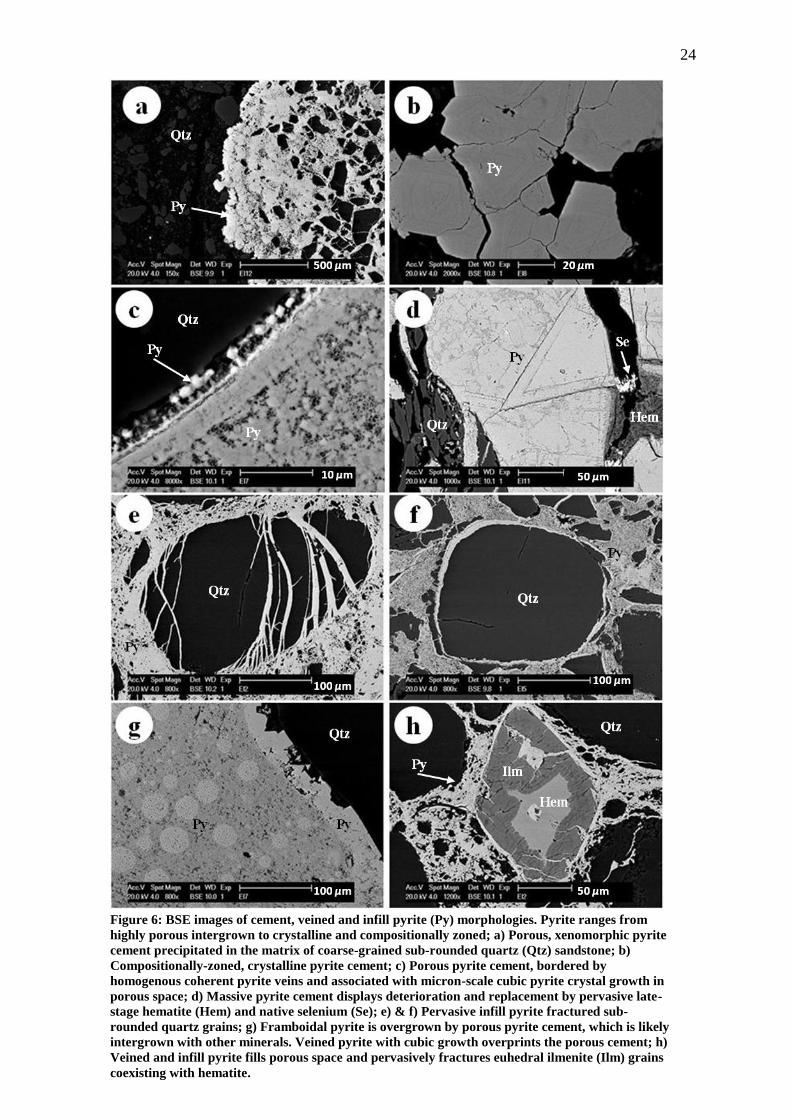
Figure 6: BSE images of cement, veined and infill pyrite (Py) morphologies. Pyrite
ranges from highly porous intergrown to crystalline and compositionally zoned; a)
Porous, xenomorphic pyrite cement precipitated in the matrix of coarse-grained sub-
rounded quartz (Qtz) sandstone; b) Compositionally-zoned, crystalline pyrite cement; c)
Porous pyrite cement, bordered by homogenous coherent pyrite veins and associated
with micron-scale cubic pyrite crystal growth in porous space; d) Massive pyrite cement
displays deterioration and replacement by pervasive late-stage hematite (Hem) and
native selenium (Se); e) & f) Pervasive infill pyrite fractured sub-rounded quartz grains;
g) Framboidal pyrite is overgrown by porous pyrite cement, which is likely intergrown
with other minerals. Veined pyrite with cubic growth overprints the porous cement; h)
Veined and infill pyrite fills porous space and pervasively fractures euhedral ilmenite
(Ilm) grains coexisting with hematite. ............................................................................ 24
Figure 7: BSE images displaying pervasive precipitation of late-stage native selenium
(Se) and hematite (Hem) throughout sample EI11, a) infilling micro-fractures in quartz
(Qtz) and pyrite (Py) associated with hematite; b) crystalline native selenium growth in
porous sandstone; c) associated with hematite septial replacement textures in
homogenous pyrite cement and d) as bladed fragments associated with quartz and pyrite
fracturing. ....................................................................................................................... 25
Figure 8: BSE images of fine-grained uranium minerals, predominantly coffinite and
uraninite existing as; a) intergrowths with porous framboidal pyrites; b) small nodules
associated with the presence of lignite and framboidal pyrite; c) porous cement
intergrown with pyrite, quartz and lignite; d) nodules with inclusions of pyrite; e)
overgrown at pyrite grain edges and f) infilling porous space in coarse anhedral ilmenite
grain, indicative of contemporaneous precipitation of both minerals. ........................... 26
Figure 9:BSE images showing accessory minerals present throughout the sample suite;
a) Rutile displaying boxwork deterioration patterns, adjacent to unaltered framboidal
pyrite; b) Ilmenite with linear alteration patterns intergrown with pyrite; c) Hematite
with relic framboidal textures present in oxidised sandstones and d) Hematite coexisting
in euhedral pyrite grains. ................................................................................................ 27
Figure 10: Inter-element plots display strong positive correlations between trace
elements Co & Ni (a), V & W (b) and As & Sb (c) within pyrites from across the
dataset. Plots a) and b) demonstrate that these correlations appear independent of pyrite
morphology. Plot c) demonstrates a trend of greater trace element enrichment in pyrites
from Pepegoona and Pepegoona West relative to Pannikan. ......................................... 31
5
Figure 11: Inter-element plot of Co and Ni demonstrates that pyrites from core PRC021
are consistently more enriched in trace elements than pyrites from core PRC022,
irrespective of morphology or horizon. Core PRC021 is shown on the deposit model to
be from within the roll-front system whilst PRC022 is taken from in front of the
oxidising system (blue arrow demonstrating the approximate direction of the roll
movement). This supports the hypothesis that trace element enrichment is primarily
associated with hydrothermal fluids which supplied uranium to the system. ................ 32
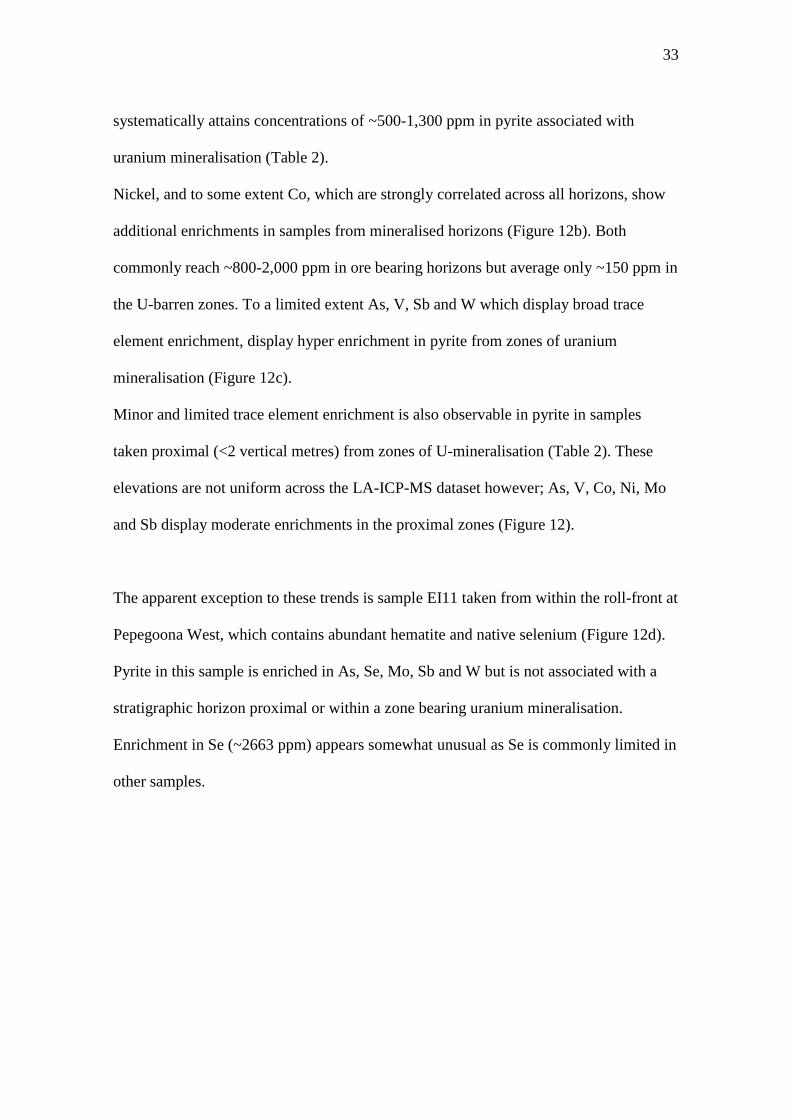
Figure 12: Inter-element plots As v Tl, Co v Ni and V and Sb (a to c, respectively)
demonstrate consistent trace element enrichment in pyrites from ore-bearing horizons
relative to their non-mineralised counterparts. Consistently, pyrites from zones proximal
to ore-bearing horizons display moderate enrichment generally just below levels seen in
mineralised horizons. Sample EI11 appears as the exception to these trends. For
samples taken proximal to mineralised horizons, moderate enrichment occurs in most
elements (e.g. 12a and 12b) however in plot c) and d) pyrite shows significant
enrichment in samples from proximal to mineralised horizons. d) The plot of Se against
Mo further supports this exception to the trend. The samples from EI11 are significantly
more enriched in both elements and this is interpreted in terms of a late-stage oxidising
fluid and consequent precipitation of native Se and hematite into the sandstone. ......... 34
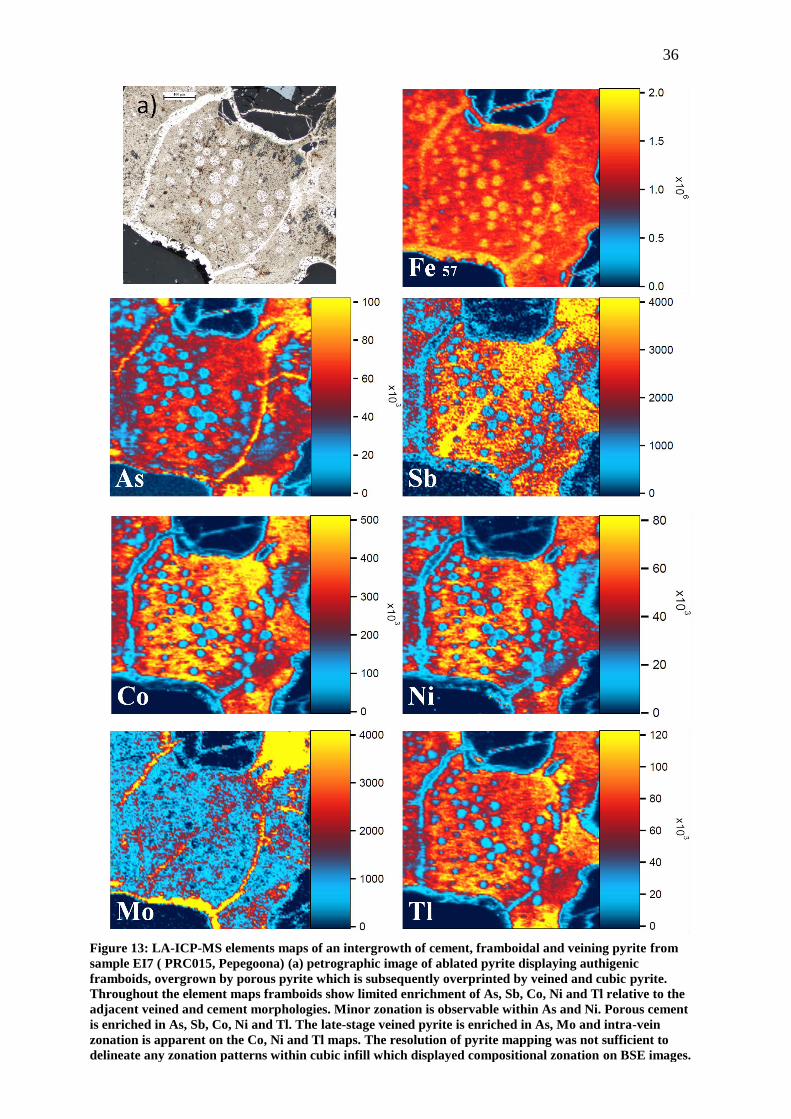
Figure 13: LA-ICP-MS elements maps of an intergrowth of cement, framboidal and
veining pyrite from sample EI7 ( PRC015, Pepegoona) (a) petrographic image of
ablated pyrite displaying authigenic framboids, overgrown by porous pyrite which is
subsequently overprinted by veined and cubic pyrite. Throughout the element maps
framboids show limited enrichment of As, Sb, Co, Ni and Tl relative to the adjacent
veined and cement morphologies. Minor zonation is observable within As and Ni.
Porous cement is enriched in As, Sb, Co, Ni and Tl. The late-stage veined pyrite is
enriched in As, Mo and intra-vein zonation is apparent on the Co, Ni and Tl maps. The
resolution of pyrite mapping was not sufficient to delineate any zonation patterns within
cubic infill which displayed compositional zonation on BSE images............................ 36
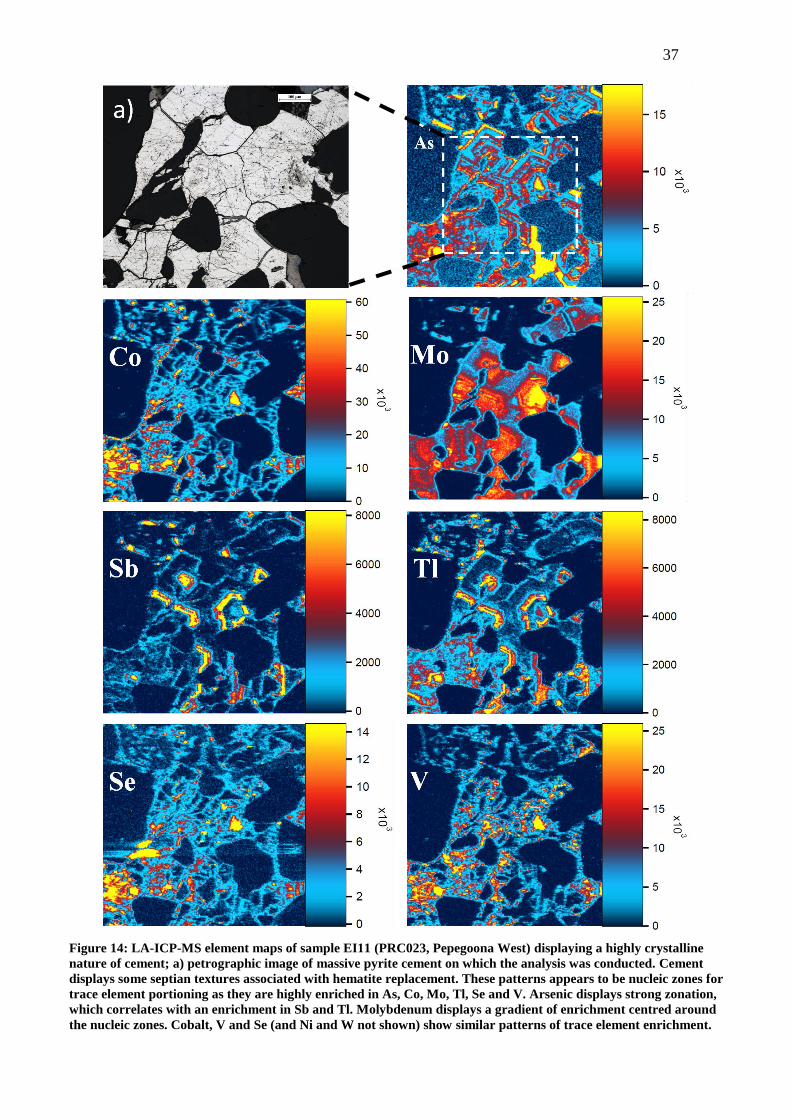
Figure 14: LA-ICP-MS element maps of sample EI11 (PRC023, Pepegoona West)
displaying a highly crystalline nature of cement; a) petrographic image of massive
pyrite cement on which the analysis was conducted. Cement displays some septian
textures associated with hematite replacement. These patterns appears to be nucleic
zones for trace element portioning as they are highly enriched in As, Co, Mo, Tl, Se and
V. Arsenic displays strong zonation, which correlates with an enrichment in Sb and Tl.
Molybdenum displays a gradient of enrichment centred around the nucleic zones.
Cobalt, V and Se (and Ni and W not shown) show similar patterns of trace element
enrichment. ..................................................................................................................... 37
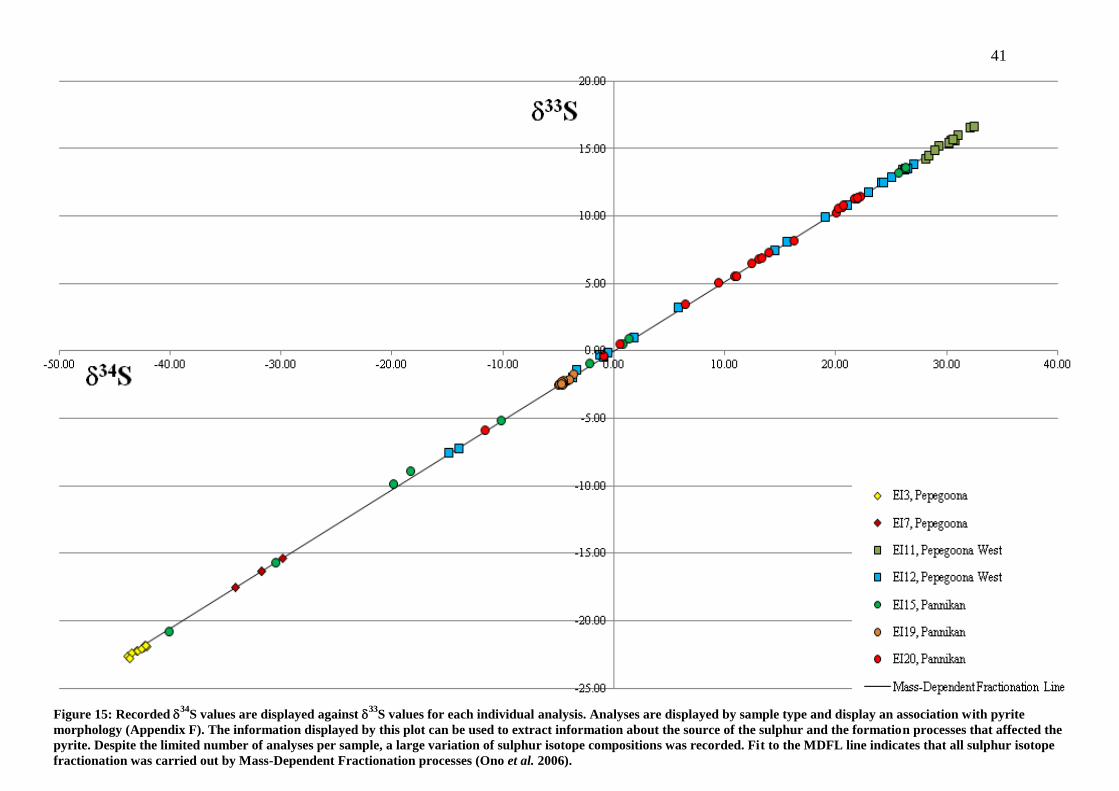
Figure 15: Recorded 34
S values are displayed against 33
S values for each individual
analysis. Analyses are displayed by sample type and display an association with pyrite
morphology (Appendix F). The information displayed by this plot can be used to extract
information about the source of the sulphur and the formation processes that affected
the pyrite. Despite the limited number of analyses per sample, a large variation of
sulphur isotope compositions was recorded. Fit to the MDFL line indicates that all
sulphur isotope fractionation was carried out by Mass-Dependent Fractionation
processes (Ono et al. 2006). ........................................................................................... 41
6
INTRODUCTION
Constraining the nature of sulphide mineralisation in the context of epigenetic uranium
mineralisation and the host sedimentary basin evolution is fundamental in
understanding the processes of uranium ore formation (Clark et al. 2004). The resistate
mineral pyrite, is the most common sulphide mineral, and provided that complete
recrystallisation does not occur, is able to record its evolution by preserving patterns of
intra-crystal morphological and chemical zonation (Cook et al. 2009).
The interpretation of geochemical variations within pyrite in terms of its depositional
and post-depositional history has significant implications, not only for the
understanding of depositional conditions, fluid composition and the source of uranium,
but also for regional basin evolution (Abraitis et al. 2004, Clark et al. 2004, Barrie et al.
2009). The ability to use the properties of pyrite as a tool for uranium exploration would
likely have significant economic impacts; however this potential vector remains
undeveloped particularly in the context of sedimentary basins.
Pyrite is a common constituent of the uranium ores in the hydrothermal systems at the
Beverley uranium deposit and throughout the sedimentary systems of the Lake Eyre
Basin (Brugger et al. 2005, Skirrow 2009, Wülser et al. 2011). To date, the textural and
chemical signatures of pyrite at Pepegoona, Pepegoona West and Pannikan, to the north
of the Beverley deposit, have not been characterised in any detail.
The aim of this study is to define the first qualitative constraints on the depositional
conditions and sources of both economic uranium mineralisation and the associated
pyrite at Beverley North. Distinct styles of pyrite mineralisation within the system will
be characterised using new textural and trace element data; the interpretation of which
7
will undoubtedly give major insight into mineral paragenesis and the controls on ore
formation within the sandstone-hosted uranium systems. Unique, high-resolution
sulphur isotope data, specific to Beverley North will be obtained, which will give
unparalleled insight into likely sulphur sources. Furthermore, the possibility of the
mixing of sulphur from distinct sources within these seemingly simple sedimentary
systems will be explored.
The overarching purpose of this study remains to use this new information to define the
controls on pyrite genesis and its subsequent effect on uranium mineralisation, to define
as to what extent pyrite may act as an effective exploration tool for uranium, not only at
Beverley North but also throughout the sedimentary systems of the Lake Eyre Basin.
GEOLOGICAL SETTING
The sandstone-hosted uranium deposits of Pepegoona, Pepegoona West and Pannikan
(Beverley North) (Figure 1 and 2) were discovered in 2009 and lie approximately 8 km
NNE of the Beverley uranium deposit operated by Heathgate Resources (Heathgate
Resources 2012, Märten et al. 2012). In order to better delineate their genesis and make
optimal use of new pyrite data, it is important to understand the position of the
mineralisation within the context of regional geology.
8
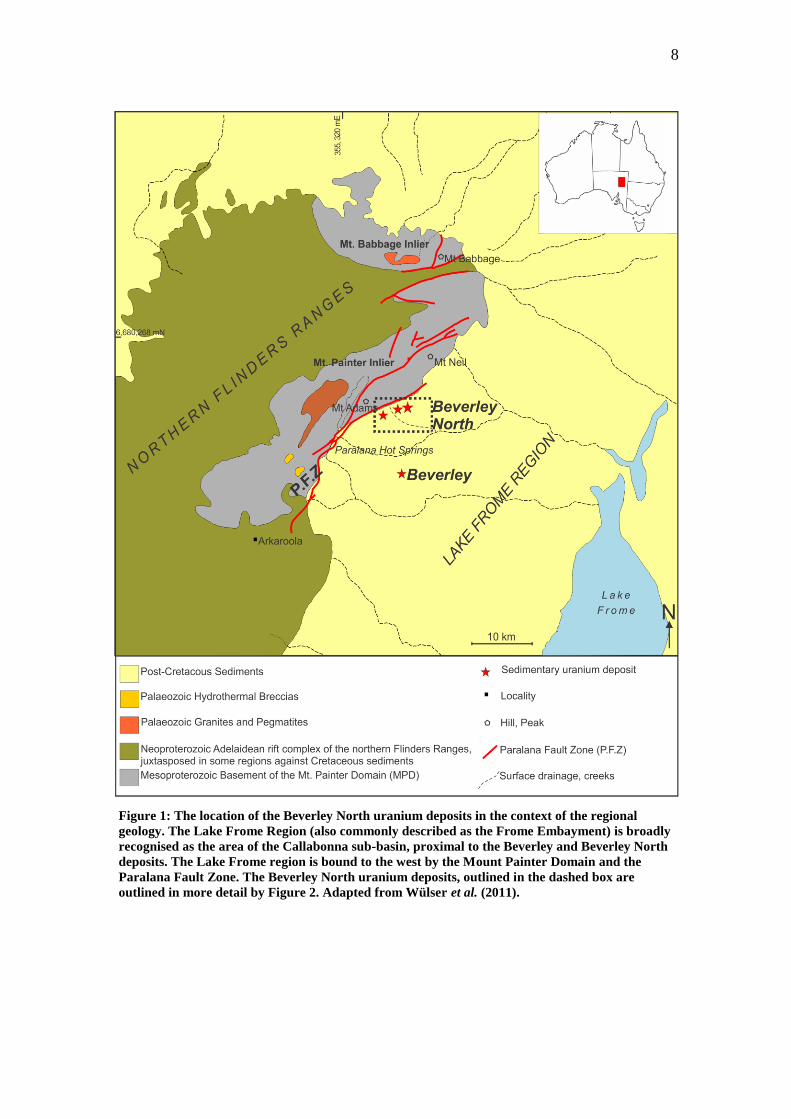
Figure 1: The location of the Beverley North uranium deposits in the context of the regional
geology. The Lake Frome Region (also commonly described as the Frome Embayment) is broadly
recognised as the area of the Callabonna sub-basin, proximal to the Beverley and Beverley North
deposits. The Lake Frome region is bound to the west by the Mount Painter Domain and the
Paralana Fault Zone. The Beverley North uranium deposits, outlined in the dashed box are
outlined in more detail by Figure 2. Adapted from Wülser et al. (2011).
9
Figure 2: The Beverley North uranium deposits of Pepegoona, Pepegoona West and Pannikan on Mining Lease 6387. Heathgate Resources surface interpretation is
outlined on the satellite image as a roll-front deposit at Pannikan, and tabular, stacked lenses of uranium mineralisation at Pepegoona and Pepegoona West. Core
numbers outlined in black represent cores from which samples were taken. Image courtesy of Heathgate Resources (2012).
10
Stratigraphy and tectonic evolution
The Beverley North uranium deposits are hosted by the organic-rich terrestrial sands of the
Eocene Eyre Formation (outlined in stratigraphic context in Table 1) and sit approximately
500 m from the eastern escarpment of the northern Flinders Ranges at a depth of ca. 200-260
m (Walker 1999, Lambert et al. 2005, Jaireth et al. 2008, Hill & Hore 2011, Märten et al.
2012).
The formation was deposited as the basal unit of the Lake Eyre Basin, unconformably
overlying the Frome Embayment; the broad area around Beverley North where the
southernmost portion of the Cretaceous Eromanga Basin unconformably on-laps the
Proterozoic basement (Table 1). A ~30-50 Ma hiatus in deposition at the end of the
Cretaceous, associated with extensive weathering resulted in widespread disconformities
between the basins (Skirrow 2009, Wülser et al. 2011). The depositional age of the host
Eocene Eyre Formation constrains the maximum age of uranium mineralisation to <55 Ma
(Skirrow 2009). Sedimentation continued in the interior non-marine Lake Eyre Basin until
the late Oligocene when widespread gentle folding caused uplift and division into sub-basins.
The Beverley North region is encompassed by the Callabonna Sub-basin, broadly known as
the Lake Frome region and bound to the west by the northern Flinders Ranges and the
Paralana Fault Zone (PFZ) (Figure 1, Skirrow 2009).
The uplift and division of basins resulted from the establishment of a regional E-W
compressional regime in the early Palaeozoic. The regime caused basement uplift and
initiation of a regional fault network, in which the broadly NE-SW trending, W-dipping
11
Table 1: The stratigraphy of the Lake Frome region
Cen
ozo
ic
Qu
ate
rn
ary
La
ke
Ey
re B
asi
n
(Ca
lla
bo
nn
a S
ub
-ba
sin
) Present-day
regolith
Terrestrial aeolian and alluvial erosion of the uplifted areas of
the northern Flinders ranges, is currently depositing sediments
in a variety of environments such as; claypans, dunes, playas,
and alluvial fans. Deposition extends from the ranges to the
shores of Lake Frome to the east.
Willawortina Fm
Deposited during the main uplift and exposure of the Mount
Painter Domain (late Cenozoic to Plio-Pleistoce). Palaeosoils
define an age older than 780 Ka. The Willawortina Fm may
reach 100 m in thickness. Contains coarse siliciclastics from
braided fans and fine sands and clays from lacustrine settings.
Mio
cen
e
Namba Fm
Deposited in Miocene lacustrine, alluvial and other low relief
environments, the Namba Fm unconformably overlies the Eyre
Fm. It is characterised by angular immature sands and silts with
minor conglomerates, black carbonaceous clays and grey, green
and white clays with some Mg-rich clays, dolomites and some
lignite. The Namba Fm is commonly capped by silcrete in the
Lake Frome area which contains kaolinite, alunite and gypsum
as a result of weathering processes of late Pliocene.
La
te P
ala
eoce
ne
- E
oce
ne
Eyre Fm
Deposition of this basal unit of the Lake Eyre Basin commenced
as a result of tectonic subsidence in the late Palaeocene and
continued until middle Eocene. The basin was subject to
episodic fluvial and lacustrine sedimentation and sediments
commonly formed in braided rivers. Two major stages of
deposition occurred (~55-49 Ma and ~45 –37 Ma) resulting
from the basin subsidence caused by the uplift of the northern
Flinders Ranges to the west. The Eyre Fm has been recognised
in S-N palaeochannels throughout the region, which commonly
incise the underlying units of the Eromanga Basin and
Proterozoic basement. Characterised by pyritic carbonaceous
mature sands of very fine to pebble grain size, the Eyre Fm is
regionally capped by silcrete developed from widespread
oxidation and weathering conditions post-deposition.
Mes
ozo
ic
Cre
tace
ou
s
Ero
ma
ng
a B
asi
n
(Fro
me
Em
ba
ym
ent)
Bulldog Shale
Deposited during the late Cretaceous, in a non-marine setting as
the uppermost unit of the Eromanga Basin. The Bulldog Shale
is a blue-gray silty, bioturbated clay mudstone with abundant
organic matter which unconformably overlies the Proterozoic
basement at Beverley North.
Cadna-owie Fm
The Cretaceous Cadna-owie formation is the lowest unit of the
Eromanga Basin but is absent in the stratigraphy at Beverley
North. It represents a transitional depositional environment from
terrestrial to marine conditions.
Proterozoic Basement
Summarised from Skirrow (2009), Hill & Hore (2010, 2011), Wülser et al. (2011).
12
structures, extend to the surface from the basement (Brugger et al. 2011, Wülser et al. 2011,
Märten et al. 2012). The fault network has been active since the late Miocene and is currently
active as a cluster of reverse faults (Wülser et al. 2011). The continuing uplift of the
Proterozoic basement associated with episodic fault reactivation in the intra-continental
compressional regime, has caused the 100-200 m of relief on the eastern escarpment of the
northern Flinders Ranges today (Hore & Hill 2010, Wülser et al. 2011).
The northern Flinders Ranges adjacent to the study area are largely comprised of the
metamorphic inliers of the Mount Painter Domain (MPD, Figure 1). The MPD, and in
particular Mount Painter Inlier contain high concentrations of heat producing granites and
uplifted Proterozoic basement rocks (~1590 Ma) of metasedimentary, granitic and
metabasaltic origin (Stoian 2010, Brugger et al. 2011, Wülser et al. 2011). The MPD was
pervasively deformed and metamorphosed up to amphibolite facies during the Delamerian
Orogeny (~514-490 Ma), evidenced by widespread pegmatitic and leucogranitic intrusions
(Foden et al. 2006, Wülser et al. 2011). A second period of felsic magmatism occurred at the
end of the Delamerian (~440 Ma) and resulted in the emplacement of granites with localised
U and Th enrichment, reaching up to ~110 ppm U in some localities (Neumann et al. 2000,
Elburg et al. 2003, Wülser et al. 2011). This uranium is believed to be the source of the
secondary uranium mineralisation in the adjacent Lake Frome Region (Hore & Hill 2010,
Brugger et al. 2011, Wülser et al. 2011).
The Paralana Fault Zone also hosts the Paralana Hot Springs (PHS); a heat flow regime
which has been active since the late Palaeozoic. The regime is controlled by the hydrothermal
circulation of meteoric water through U-enriched radiogenic basement rocks of the MPD
which are undergoing contemporaneous rapid uplift (Neumann et al. 2000, McLaren et al.
2002, Skirrow 2009, Brugger et al. 2011). Low-temperature epithermal activity, limited by
13
low rainfall continues in the PHS and the current shallow groundwater is considered a relic of
the palaeo-water responsible for major mineralisation in the region (Brugger et al. 2005,
Skirrow 2009, Brugger et al. 2011)
Uranium mineralisation in context of regional geology
The location of the Beverley North deposits in intracratonic sedimentary basins, adjacent to
highly deformed igneous and metamorphic terrains, indicates a complex and multi-faceted
evolution. The geometry of epigenetic deposits such as at Beverley North, are primarily
controlled by the permeability of strata and the distribution of chemical traps for the
dissolved uranium (Hobday & Galloway 1999). The sandstone-hosted uranium deposits of
Pepegoona and Pepegoona West have been characterised as stacked tabular formations whilst
the Pannikan deposit is a roll-front deposit capped with silcrete lenses (Figure 3) (Märten et
al. 2012). Due to the relatively recent discovery of these deposits, the full geometry of the
uranium forming systems at Beverley North is undergoing continued reinterpretation. In the
context of this study, it is important to recognise that both deposit models form under similar
conditions from migrating oxidising fluids (Hobday & Galloway 1999).
Sandstone-hosted roll-front deposits reflect down-dip fluid flow of oxidised groundwater
carrying dissolved uranium, within a confined sandstone aquifer (see Gross (1956), Galloway
(1978), Min et al (2005a) and Jaireth et al (2008)). The uranium-bearing minerals precipitate
at redox fronts where reducing agents such as organic matter and pre-ore pyrite are present.
Similarly, tabular uranium represent the flow of U-bearing fluids into the host sandstone from
the edges of a sedimentary basin, generally as a result of less rapid fluid migration than roll-
front formation (Min et al. 2005a).
14
Primary uranium dissolution and the subsequent transport and deposition from its source in
the Mt Painter Inlier, was likely by low-temperature, slightly acidic and oxidising
groundwater (Hill & Hore 2010, Brugger et al. 2011, Wülser et al. 2011). Aquifer sources
such as the PHS provided oxidised groundwater which precipitated uranium into the
stratigraphic column where sufficiently low redox conditions existed, until anomalous U-
concentrations accumulated in the environment (Pirlo & Giblin 2004). Coeval mineralisation
of ore-stage pyrite and other reduced minerals occurred as a result of repeated dissolution and
precipitation of pre-ore minerals during groundwater flow down aquifer gradients (Pirlo &
Giblin 2004, Wülser et al. 2011).
Figure 3: Schematic cross-section of the stratigraphy of the Lake Frome region hosting the
sandstone-hosted uranium deposits of Pepegoona, Pepegoona West and Pannikan. The deposits are
hosted by the Eocene Eyre Fm, and hence their genetic relationship with the Miocene Namba Fm-
hosted Beverley deposit is limited. Pepegoona and Pepegoona West are broadly interpreted as
stacked tabular lenses of uranium mineralisation, whilst the Pannikan deposit hosts roll-front
mineralisation. All deposits are associated with lenses of silcrete formation. Model courtesy of
Heathgate Resources (2012).
15
Many of the known Eyre Fm hosted deposits (e.g. Four Mile and Honeymoon) in the Lake
Frome Region are associated with palaeochannels, and are characterised by carbonaceous and
pyritic sands intercalated with clays and gravels (Skirrow 2009). The accumulation of organic
matter in the bends of low-energy meandering stream systems, act as reductants precipitating
uranium at these locations (Landais 1996, Skirrow 2009).
CONTROLS ON PYRITE CHEMISTRY
Sulphides are important components of the geochemical systems of sandstone-hosted
uranium deposits as they are common reductants (Granger & Warren 1969, Jaireth et al.
2008). Pyrite associated with U-mineralisation is generally considered to have been derived
from the reduction of sulphates in ore-bearing solutions (Granger & Warren 1969). However,
all models for the genesis of U-deposits require the presence of pyrite in the host-rock prior to
mineralisation (Granger & Warren 1969, Min et al. 2005a).
Pyrite is abundant in the reduced zones of ore-bearing systems and commonly displays
geochemical zonation (Jaireth et al. 2008). The precipitation of pyrite over its polymorph,
marcasite in sandstone hosted U-deposits is favoured by certain physiochemical conditions
such as elevated pH and an abundance of polysulphide species (Goldhaber & Kaplan 1980,
Reynolds & Goldhaber 1983, Min et al. 2005a). The amount of pyrite formed in a sediment
is limited by the supply of organic matter, dissolved sulphates and reactive detrital iron
minerals (Berner 1984).
Authigenic pyrite is broadly interpreted to have formed indirectly via iron monosulphides,
during biogenic sulphate reduction, in the absence of oxygen. Other pyrite phases may
precipitate abiotically, directly from solution (Berner 1984, Sawlowicz 1993, Min et al.
2005b). This sedimentary pyrite commonly occurs as euhedral grains or clustered framboids,
a morphology indicative of biogenic influences during formation (Wilkin et al. 1996).
16
In sedimentary settings, pyrite is generally considered to form syngenetically and during
early diagenesis (Sawlowicz 1993, Folk 2005); indicative of shallow and relatively low
temperature settings (e.g. <200 ºC) (Wilkin & Barnes 1997, Butler et al. 2000, Scott et al.
2009).
Sulphur Isotopes
The presence of sulphur in nearly all natural environments established sulphur isotopes as
effective geochemical tracers of past geological and environmental processes (Bendall et al.
2006). The two most abundant isotopes of sulphur (32
S and 34
S) make up 99.2% of all
naturally occurring sulphur and these, along with less common isotopes (33
S and 36
S) are used
to provide information on sulphur source and precipitation mechanisms (Warren 1972,
Johnston 2011). Moreover, in-situ analytical techniques, allow high-resolution analysis of the
smallest areas within complex pyrite crystals and give insight into the complex biological and
chemical interplay that occurs in sediments during sulphide precipitation (Kohn et al. 1998).
Sulphur isotope fractionation occurs when one unstable sulphur species is decomposed to
produce two or more new sulphur species. The heavier isotope generally accumulates in
species with strong chemical bonds, such as sulphates causing later sulphides from the same
system to become relatively depleted (Granger & Warren 1969).
Sulphur isotopic composition is commonly expressed in terms of 34
S (a ratio of 34
S/32
S)
(Bendall et al. 2006). Depletion or enrichment of the heavy sulphur isotopes (34
S and 36
S)
reveals information about biogeochemical processes, hydrothermal fluid sources and
sediment diagenesis (Butler et al. 2004, Ono et al. 2006, Johnston 2011). Major changes in
sulphur isotope ratios during the deposition of ore and gangue minerals indicate a systematic
change in the redox conditions of the fluid during ore deposition (Fleming & Bekken 1995).
17
These chemical variations make it possible to trace out processes of transport, concentration
and local precipitation during ore genesis (Fleming & Bekken 1995, Hoefs 2009).
Isotope studies of sedimentary sulphur have focused primarily on the sulphur isotopic
composition of iron sulphide minerals and, in particular pyrite (Butler et al. 2004). Studies of
these isotopic ratios have been instrumental in elucidating the role of microorganisms in the
precipitation of minerals and may be used to argue for the influence of specific sulphur
sources (Thode et al. 1953, Kohn et al. 1998). In sedimentary environments, sulphur isotope
fractionation is commonly caused by sulphate-reducing bacteria (Butler et al. 2004).
METHODS
A total of 37 core samples were collected from the Beverley North deposits (Appendix A).
These samples were selected to be representative of the deposit, redox system and host
formation, whilst optimising pyrite content where possible. The samples were set in epoxy
resin and prepared as one-inch polished blocks for mineralogical and petrographic analysis. A
range of methods was applied to the samples (detailed in Appendix B), in order to build a
dataset for the characterisation of pyrite at Beverley North.
Optical and Scanning Electron Microscopy (SEM) in Back-Scattered Electron mode (BSE)
were used to characterise pyrite morphologies, document significant textures and
mineralogical relationships, and identify U-bearing minerals and Fe-(Ti)-oxides present. The
SEM (Philips XL-30) was equipped with energy-dispersive X-ray spectrometer to aid mineral
characterisation.
Pyrite, U-bearing minerals and Fe-(Ti)-oxides in selected representative samples were
analysed by Electron Probe Microanalysis (EPMA) to determine their major and minor
18
element compositions. Details of count times, standards and minimum detection limited are
outlined in Appendix B.
Laser-Ablation Inductively-Coupled Mass Spectrometry (LA-ICP-MS) (Ridley & Lichte
1998) was subsequently used on selected samples to provide trace element concentrations on
pyrites from varied localities and horizons as well as distinct morphological types. Generally
the phases analysed by LA-ICP-MS were coarse-grained and whenever possible free from
visible inclusions of other minerals. The sulphide standard MASS-1 (Wilson et al. 2002) was
used as a calibration standard (Appendix B).
LA-ICP-MS element mapping of approximately 0.5 cm2 sized areas of pyrite focussed on
areas of zonation to gain two-dimensional images of trace element partitioning within grains.
This new generation laser system (Appendix B) permits high spatial resolution matched by
sensitivity of low (sub-ppm) element concentrations.
In-situ sulphur isotope analysis by Secondary-Ion-Mass-Spectrometry (SIMS) (Appendix B)
was carried out on selected pyrite grains from 7 samples taken across from the deposits to test
for variations in 34
S and analyse the distinct pyrite morphologies for characteristic signatures.
Variations in the trace element concentration and sulphur isotopes were used to identify
possible geochemical trends which may enhance understanding of ore genesis and allow
insight into the paragenetic sequencing of the minerals.
19
OBSERVATIONS & RESULTS
Pyrite morphology and textural observations
Throughout the Beverley North mineralised systems, visible coarse-grained pyrite in the
sandstone matrix is limited. Intercalation of oxidised and reduced sandstones with silcrete
and clay-rich siltstones is prevalent throughout cores. Both pyrite and uranium-bearing
minerals were found to be ubiquitous proximal to reduced and organic rich zones, a result of
the morphology of the uranium deposits. Pervasive hydrocarbon staining, evident in hand
samples was observed across these reduced zones a likely result of the proximity of the
porous host sandstone to the hydrocarbon-rich Eromanga Basin.
Samples are prediminately medium to coarse-grained, matrix supported, sub-rounded quartz
sandstones with accessory minerals prevalent throughout the matrix. A consistent mineral
assemblage is observable across all pyrite-bearing samples (EI1-20B), with their assemblage
largely made up of quartz (>50%), pyrite (>30%), + U-bearing minerals (<10%), + ilmenite
(<5%), + rutile (< 5%) + minor zircon, hematite and sphalerite. Samples containing
negligible pyrite (EI21-37) are predominantly quartz (≥ 80%), ilmenite (≤ 15%) and rutile
(≤5%) + pyrite + hematite.
Pyrites displayed varying morphologies and for the purposes of this study were categorised as
framboidal, euhedral and cubic, cement or veined, infill and overgrowth. Specific
morphologies do not appear exclusive to any particular deposit, horizon or sample type.
Framboidal pyrite is the most common and diverse pyrite morphology observed throughout
the sample suite (Figure 4). Small framboids (~ <10 µm) are dominated by densely packed,
spherical aggregates of sub-micron sized pyrite crystals, commonly found in clusters of up to
several hundred framboids. Idiomorphic microcrystals within framboids are highly uniform
20
in both size and shape (Figure 4a). Some evidence of three dimensional aggregations was
observed (Figure 4b).
Framboidal aggregates throughout the samples are comparable with those defined by Wilkin
& Barnes (1997), however we extend this definition to include a range of pyrite aggregates
whose morphologies likely share similar formation processes (Figure 4d-f). Hypidiomorphic
framboids preserve a somewhat spherical nature but lack the porosity associated with
microcrystal aggregations in classic framboidal pyrite. This secondary range of framboidal
pyrites is typically found in isolated clusters and infrequently coexists with archetypal
framboids (Figure 4d). No framboid morphologies were observed exclusive to any sample
type, horizon or deposit but are frequently observed intergrown with other pyrite
morphologies (Figure 4g).
Cubic and euhedral pyrites observed across the sample suite are commonly found clustered
together or intergrown with crystalline pyrite cement (Figure 5). In some instances the
euhedral cubic grains appear to be associated with framboidal growth; identifiable by the
appearance of porous microcrystals within the centre of the grains (Figs. 4f and 5c).
Texturally massive pyrite euhedra often display distinct multi-phase growth patterns.
Anhedral pyrite grains are common in samples where massive pyrites are observed; but also
coexist with idiomorphic cubic pyrites or as singular grains within the matrix. Similar to
other pyrite morphologies, anhedral pyrite grains were observed intergrown with cemented
pyrite. Porous xenomorphic pyrite overgrowth is commonly observed around both cubic and
anhedral pyrite grains (Figure 5f).
21
Figure 4: BSE images of varied framboidal pyrite (Py) morphologies; a) Spherical aggregate of
sub-micron sized pyrite crystals surrounded by un-ordered micro-crystals of similar provenance;
b) Three-dimensional framboidal aggregate evidencing spherical nature of framboids; c)
Framboidal aggregates in quartz (Qtz) matrix; d) Hypidiomorphic framboidal aggregates are
irregular but retain a spherical shape; e) & f) display porous framboidal pyrite overgrown by
euhedral pyrite; g) Clusters of both classic and hypidiomorphic framboidal pyrite coexisting in
the matrix with homogenous pyrite cement; h) Framboidal pyrite intergrown with anhedral
pyrite.
22
Figure 5: BSE images of euhedral and cubic pyrite (Py) grains found present throughout the
sample suite. Grains commonly display forms of compositional and textural zonation; a) Cubic
pyrite with associated U-nodules at grain edges; b) Intergrowths of cubic and euhedral pyrites,
with U-minerals also present at grain edges; c) Porous cubic pyrite demonstrating progressive
stages of growth around a spheroidal nucleus; d) Compositionally zoned euhedral pyrite grain
which has undergone post-depositional micro-fracturing; e) Porous cubic pyrite demonstrating
internal textural variance, overgrown by xenomorphic pyrite cement and pervasively fractured;
f) Texturally zoned euhedral pyrite with porous xenomorphic growth apparent at grain edges and
between phases of pyrite growth.
23
Pyrite cement is a dominant pyrite morphology throughout the sample suite and occurs
primarily as the cemented matrix common in sandstone-host rocks. The appearance and
growth of pyrite cement appears varied, with petrographic and SEM analysis showing
texturally homogenous, crystalline and xenomorphic cement growth present (Figure 6). A
limited number of samples display compositional zonation throughout pyrite cement on both
optical and BSE images (Figure 6b). Varied porosities within pyritic cements affect their
textural homogeneity. Little association exists between oscillatory zonation or porosity and
sample depth, location or horizon.
Veined and infill textures are also a common pyrite type (Figure 6). This phase of pyrite
formation is commonly seen fracturing and overprinting other pyrite types, quartz and the Fe-
(Ti)-oxide accessory minerals. Pervasive micro-fracturing of quartz grains by pyrite
commonly follows grain edge boundaries (Figure 6f); although larger-scale fractures through
grain centres is not uncommon (Figure 6e).Consistent fracturing and overprinting of pyrite
across the sample suite indicates more than one generation of pyrite formation and defines
fluid flow as a likely mechanism of sulphide precipitation.
Micro-fracturing and overprinting of quartz grains and texturally homogenous pyrite cement
by hematite and native selenium was observed in sample EI11 (PRC015, Pepegoona) (Figure
7). The zone of oxidised sandstone from which this sample was taken, displayed prevalent
visible yellow sulphur staining on the core. The secondary overprinting minerals are
pervasive throughout the sample, and appear to be genetically linked. Hematite is precipitated
within fracture zones and displays massive infill morphology, commonly juxtaposed against
porous acicular native selenium growth (Figure 7a). Native selenium was also observed as an
accumulation of porous feathery and bladed grains (Figure 7b). Both secondary minerals
24
Figure 6: BSE images of cement, veined and infill pyrite (Py) morphologies. Pyrite ranges from
highly porous intergrown to crystalline and compositionally zoned; a) Porous, xenomorphic pyrite
cement precipitated in the matrix of coarse-grained sub-rounded quartz (Qtz) sandstone; b)
Compositionally-zoned, crystalline pyrite cement; c) Porous pyrite cement, bordered by
homogenous coherent pyrite veins and associated with micron-scale cubic pyrite crystal growth in
porous space; d) Massive pyrite cement displays deterioration and replacement by pervasive late-
stage hematite (Hem) and native selenium (Se); e) & f) Pervasive infill pyrite fractured sub-
rounded quartz grains; g) Framboidal pyrite is overgrown by porous pyrite cement, which is likely
intergrown with other minerals. Veined pyrite with cubic growth overprints the porous cement; h)
Veined and infill pyrite fills porous space and pervasively fractures euhedral ilmenite (Ilm) grains
coexisting with hematite.
25
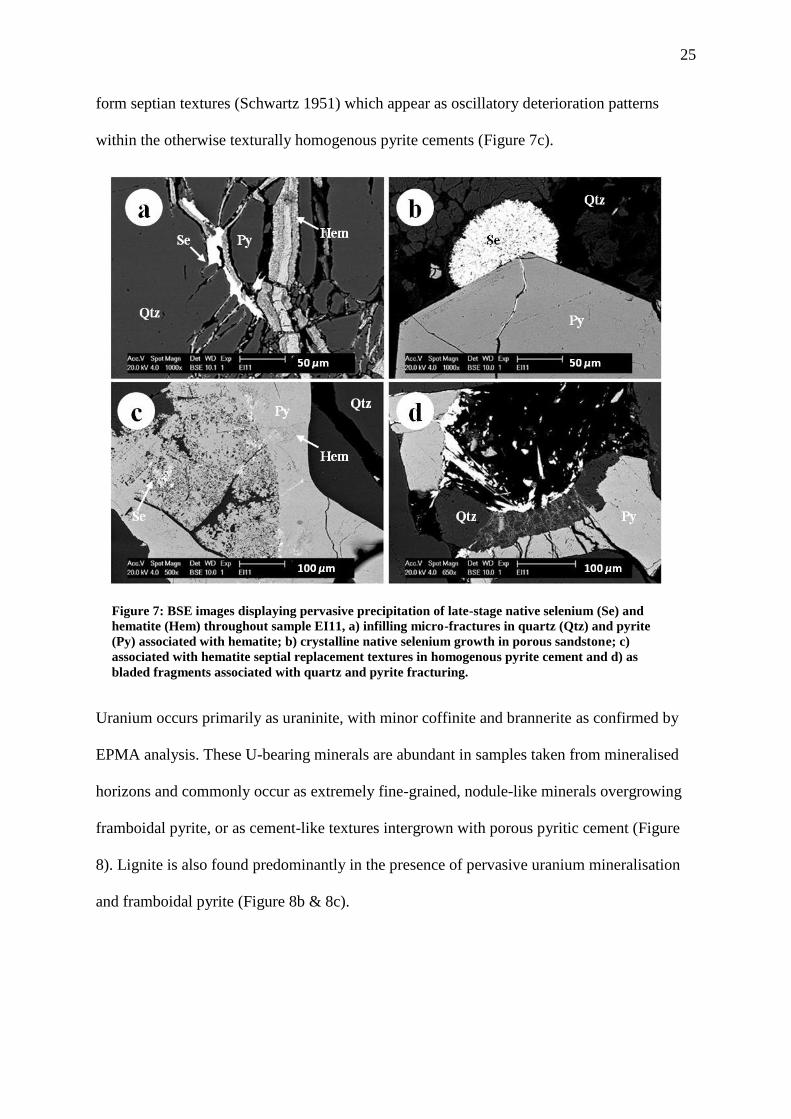
form septian textures (Schwartz 1951) which appear as oscillatory deterioration patterns
within the otherwise texturally homogenous pyrite cements (Figure 7c).
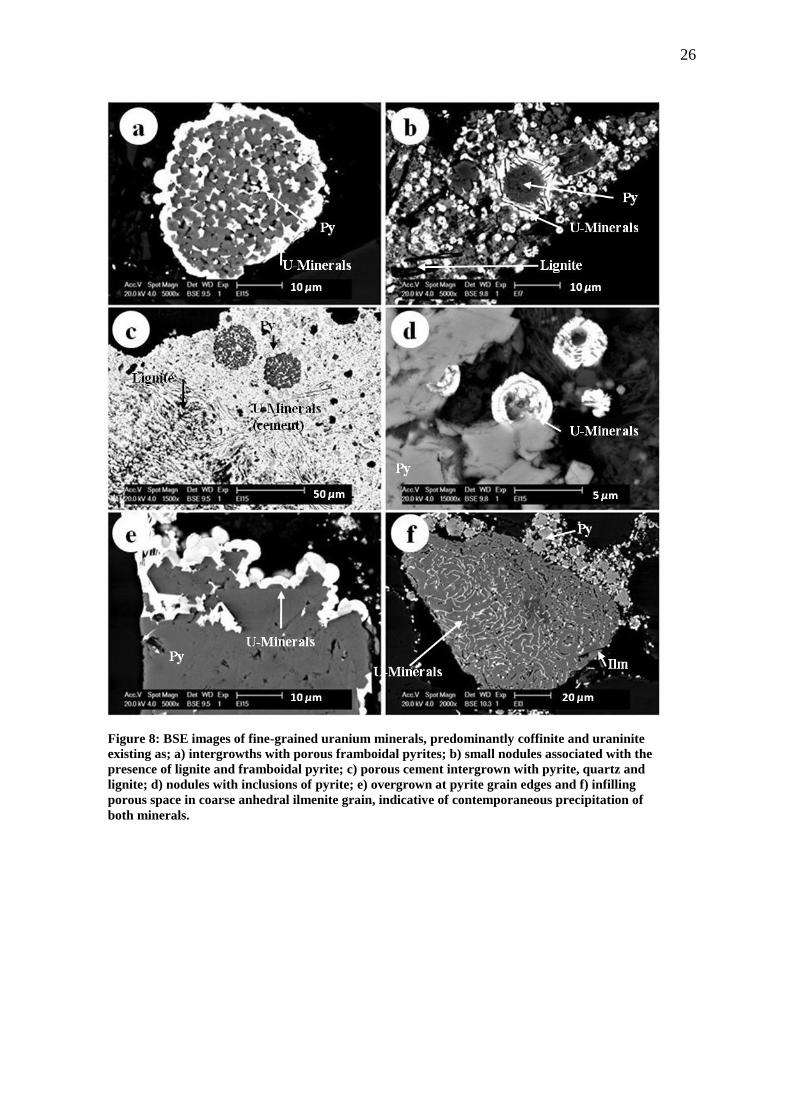
Uranium occurs primarily as uraninite, with minor coffinite and brannerite as confirmed by
EPMA analysis. These U-bearing minerals are abundant in samples taken from mineralised
horizons and commonly occur as extremely fine-grained, nodule-like minerals overgrowing
framboidal pyrite, or as cement-like textures intergrown with porous pyritic cement (Figure
8). Lignite is also found predominantly in the presence of pervasive uranium mineralisation
and framboidal pyrite (Figure 8b & 8c).
Figure 7: BSE images displaying pervasive precipitation of late-stage native selenium (Se) and
hematite (Hem) throughout sample EI11, a) infilling micro-fractures in quartz (Qtz) and pyrite
(Py) associated with hematite; b) crystalline native selenium growth in porous sandstone; c)
associated with hematite septial replacement textures in homogenous pyrite cement and d) as
bladed fragments associated with quartz and pyrite fracturing.
26
Figure 8: BSE images of fine-grained uranium minerals, predominantly coffinite and uraninite
existing as; a) intergrowths with porous framboidal pyrites; b) small nodules associated with the
presence of lignite and framboidal pyrite; c) porous cement intergrown with pyrite, quartz and
lignite; d) nodules with inclusions of pyrite; e) overgrown at pyrite grain edges and f) infilling
porous space in coarse anhedral ilmenite grain, indicative of contemporaneous precipitation of
both minerals.
27
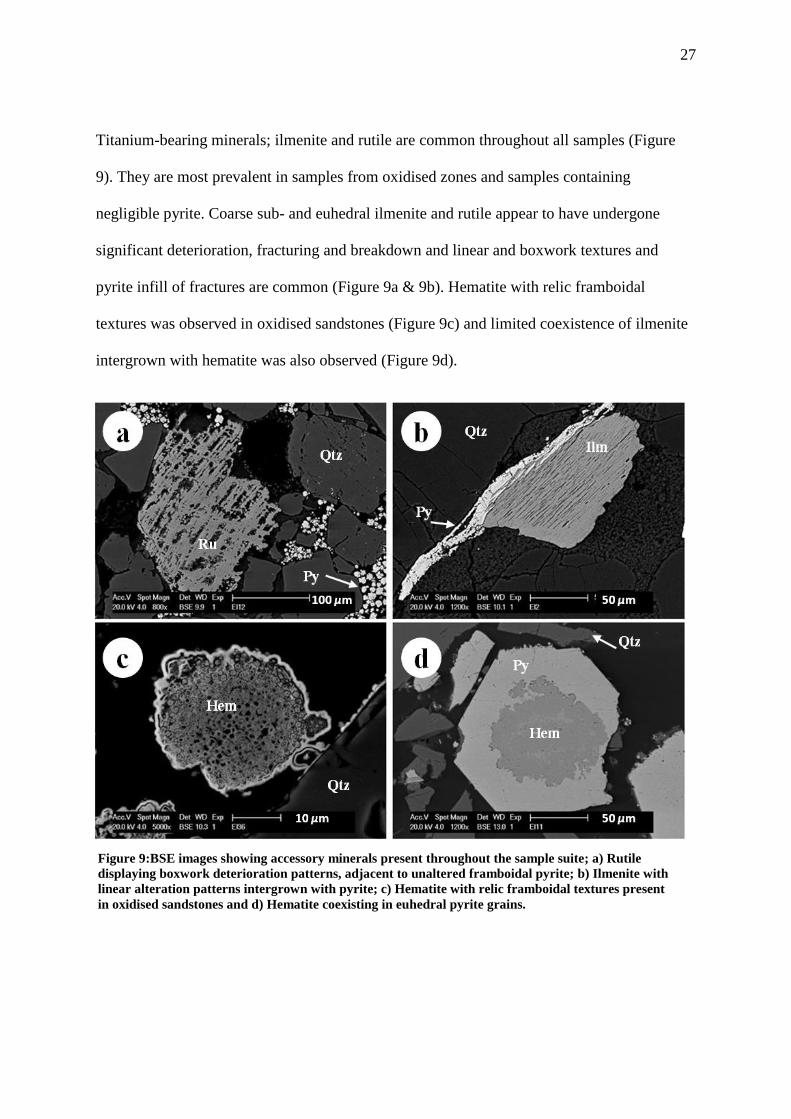
Titanium-bearing minerals; ilmenite and rutile are common throughout all samples (Figure
9). They are most prevalent in samples from oxidised zones and samples containing
negligible pyrite. Coarse sub- and euhedral ilmenite and rutile appear to have undergone
significant deterioration, fracturing and breakdown and linear and boxwork textures and
pyrite infill of fractures are common (Figure 9a & 9b). Hematite with relic framboidal
textures was observed in oxidised sandstones (Figure 9c) and limited coexistence of ilmenite
intergrown with hematite was also observed (Figure 9d).
Figure 9:BSE images showing accessory minerals present throughout the sample suite; a) Rutile
displaying boxwork deterioration patterns, adjacent to unaltered framboidal pyrite; b) Ilmenite with
linear alteration patterns intergrown with pyrite; c) Hematite with relic framboidal textures present
in oxidised sandstones and d) Hematite coexisting in euhedral pyrite grains.
28
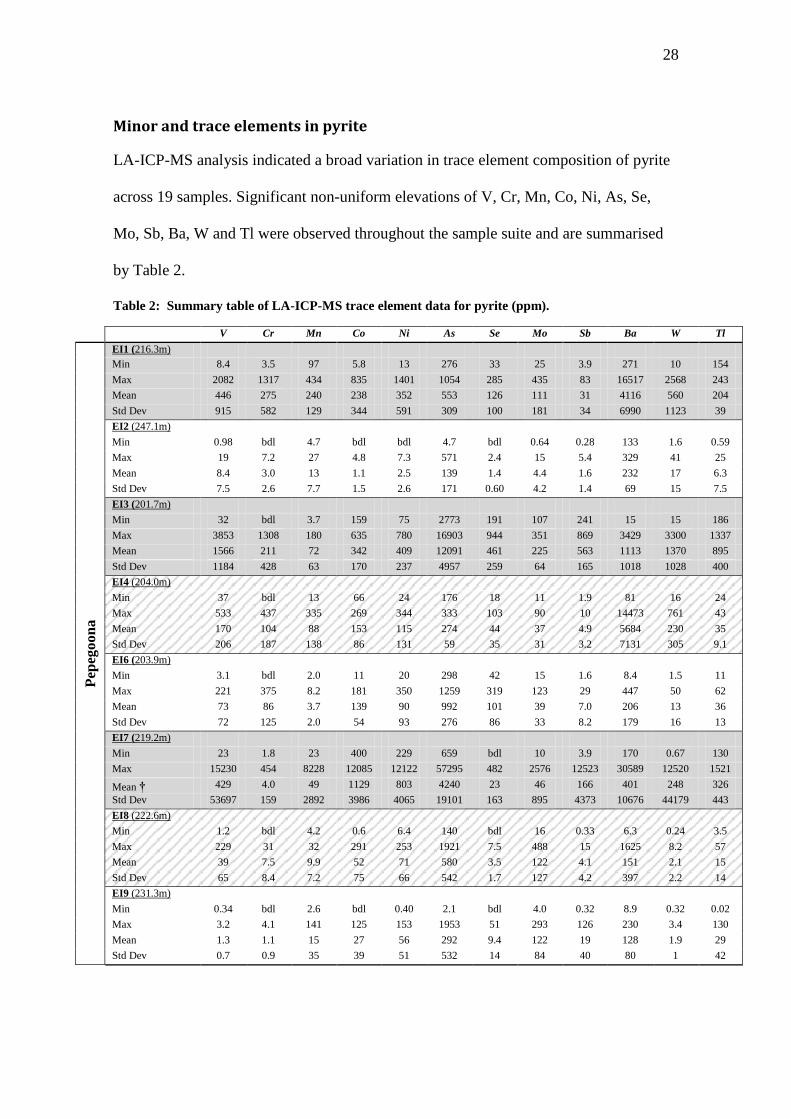
Minor and trace elements in pyrite
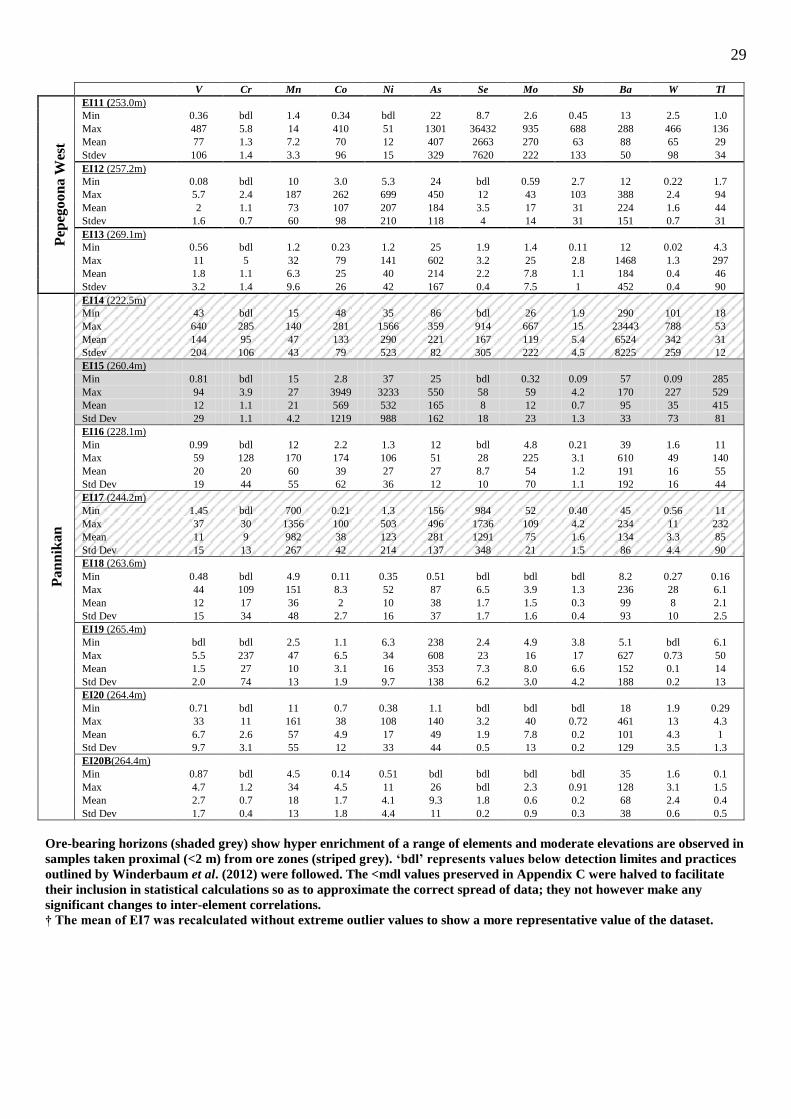
LA-ICP-MS analysis indicated a broad variation in trace element composition of pyrite
across 19 samples. Significant non-uniform elevations of V, Cr, Mn, Co, Ni, As, Se,
Mo, Sb, Ba, W and Tl were observed throughout the sample suite and are summarised
by Table 2.
Table 2: Summary table of LA-ICP-MS trace element data for pyrite (ppm).
V Cr Mn Co Ni As Se Mo Sb Ba W Tl
Pep
egoon
a
EI1 (216.3m)
Min 8.4 3.5 97 5.8 13 276 33 25 3.9 271 10 154
Max 2082 1317 434 835 1401 1054 285 435 83 16517 2568 243
Mean 446 275 240 238 352 553 126 111 31 4116 560 204
Std Dev 915 582 129 344 591 309 100 181 34 6990 1123 39
EI2 (247.1m)
Min 0.98 bdl 4.7 bdl bdl 4.7 bdl 0.64 0.28 133 1.6 0.59
Max 19 7.2 27 4.8 7.3 571 2.4 15 5.4 329 41 25
Mean 8.4 3.0 13 1.1 2.5 139 1.4 4.4 1.6 232 17 6.3
Std Dev 7.5 2.6 7.7 1.5 2.6 171 0.60 4.2 1.4 69 15 7.5
EI3 (201.7m)
Min 32 bdl 3.7 159 75 2773 191 107 241 15 15 186
Max 3853 1308 180 635 780 16903 944 351 869 3429 3300 1337
Mean 1566 211 72 342 409 12091 461 225 563 1113 1370 895
Std Dev 1184 428 63 170 237 4957 259 64 165 1018 1028 400
EI4 (204.0m)
Min 37 bdl 13 66 24 176 18 11 1.9 81 16 24
Max 533 437 335 269 344 333 103 90 10 14473 761 43
Mean 170 104 88 153 115 274 44 37 4.9 5684 230 35
Std Dev 206 187 138 86 131 59 35 31 3.2 7131 305 9.1
EI6 (203.9m)
Min 3.1 bdl 2.0 11 20 298 42 15 1.6 8.4 1.5 11
Max 221 375 8.2 181 350 1259 319 123 29 447 50 62
Mean 73 86 3.7 139 90 992 101 39 7.0 206 13 36
Std Dev 72 125 2.0 54 93 276 86 33 8.2 179 16 13
EI7 (219.2m)
Min 23 1.8 23 400 229 659 bdl 10 3.9 170 0.67 130
Max 15230
2
454 8228 12085 12122 57295 482 2576 12523 30589 12520
2
1521
Mean † 429 4.0 49 1129 803 4240 23 46 166 401 248 326
Std Dev 53697 159 2892 3986 4065 19101 163 895 4373 10676 44179 443
EI8 (222.6m)
Min 1.2 bdl 4.2 0.6 6.4 140 bdl 16 0.33 6.3 0.24 3.5
Max 229 31 32 291 253 1921 7.5 488 15 1625 8.2 57
Mean 39 7.5 9.9 52 71 580 3.5 122 4.1 151 2.1 15
Std Dev 65 8.4 7.2 75 66 542 1.7 127 4.2 397 2.2 14
EI9 (231.3m)
Min 0.34 bdl 2.6 bdl 0.40 2.1 bdl 4.0 0.32 8.9 0.32 0.02
Max 3.2 4.1 141 125 153 1953 51 293 126 230 3.4 130
Mean 1.3 1.1 15 27 56 292 9.4 122 19 128 1.9 29
Std Dev 0.7 0.9 35 39 51 532 14 84 40 80 1 42
29
V Cr Mn Co Ni As Se Mo Sb Ba W Tl
Pep
ego
on
a W
est
EI11 (253.0m)
Min 0.36 bdl 1.4 0.34 bdl 22 8.7 2.6 0.45 13 2.5 1.0
Max 487 5.8 14 410 51 1301 36432 935 688 288 466 136
Mean 77 1.3 7.2 70 12 407 2663 270 63 88 65 29
Stdev 106 1.4 3.3 96 15 329 7620 222 133 50 98 34
EI12 (257.2m)
Min 0.08 bdl 10 3.0 5.3 24 bdl 0.59 2.7 12 0.22 1.7
Max 5.7 2.4 187 262 699 450 12 43 103 388 2.4 94
Mean 2 1.1 73 107 207 184 3.5 17 31 224 1.6 44
Stdev 1.6 0.7 60 98 210 118 4 14 31 151 0.7 31
EI13 (269.1m)
Min 0.56 bdl 1.2 0.23 1.2 25 1.9 1.4 0.11 12 0.02 4.3
Max 11 5 32 79 141 602 3.2 25 2.8 1468 1.3 297
Mean 1.8 1.1 6.3 25 40 214 2.2 7.8 1.1 184 0.4 46
Stdev 3.2 1.4 9.6 26 42 167 0.4 7.5 1 452 0.4 90
Pan
nik
an
EI14 (222.5m)
Min 43 bdl 15 48 35 86 bdl 26 1.9 290 101 18
Max 640 285 140 281 1566 359 914 667 15 23443 788 53
Mean 144 95 47 133 290 221 167 119 5.4 6524 342 31
Stdev 204 106 43 79 523 82 305 222 4.5 8225 259 12
EI15 (260.4m)
Min 0.81 bdl 15 2.8 37 25 bdl 0.32 0.09 57 0.09 285
Max 94 3.9 27 3949 3233 550 58 59 4.2 170 227 529
Mean 12 1.1 21 569 532 165 8 12 0.7 95 35 415
Std Dev 29 1.1 4.2 1219 988 162 18 23 1.3 33 73 81
EI16 (228.1m)
Min 0.99 bdl 12 2.2 1.3 12 bdl 4.8 0.21 39 1.6 11
Max 59 128 170 174 106 51 28 225 3.1 610 49 140
Mean 20 20 60 39 27 27 8.7 54 1.2 191 16 55
Std Dev 19 44 55 62 36 12 10 70 1.1 192 16 44
EI17 (244.2m)
Min 1.45 bdl 700 0.21 1.3 156 984 52 0.40 45 0.56 11
Max 37 30 1356 100 503 496 1736 109 4.2 234 11 232
Mean 11 9 982 38 123 281 1291 75 1.6 134 3.3 85
Std Dev 15 13 267 42 214 137 348 21 1.5 86 4.4 90
EI18 (263.6m)
Min 0.48 bdl 4.9 0.11 0.35 0.51 bdl bdl bdl 8.2 0.27 0.16
Max 44 109 151 8.3 52 87 6.5 3.9 1.3 236 28 6.1
Mean 12 17 36 2 10 38 1.7 1.5 0.3 99 8 2.1
Std Dev 15 34 48 2.7 16 37 1.7 1.6 0.4 93 10 2.5
EI19 (265.4m)
Min bdl bdl 2.5 1.1 6.3 238 2.4 4.9 3.8 5.1 bdl 6.1
Max 5.5 237 47 6.5 34 608 23 16 17 627 0.73 50
Mean 1.5 27 10 3.1 16 353 7.3 8.0 6.6 152 0.1 14
Std Dev 2.0 74 13 1.9 9.7 138 6.2 3.0 4.2 188 0.2 13
EI20 (264.4m)
Min 0.71 bdl 11 0.7 0.38 1.1 bdl bdl bdl 18 1.9 0.29
Max 33 11 161 38 108 140 3.2 40 0.72 461 13 4.3
Mean 6.7 2.6 57 4.9 17 49 1.9 7.8 0.2 101 4.3 1
Std Dev 9.7 3.1 55 12 33 44 0.5 13 0.2 129 3.5 1.3
EI20B(264.4m)
Min 0.87 bdl 4.5 0.14 0.51 bdl bdl bdl bdl 35 1.6 0.1
Max 4.7 1.2 34 4.5 11 26 bdl 2.3 0.91 128 3.1 1.5
Mean 2.7 0.7 18 1.7 4.1 9.3 1.8 0.6 0.2 68 2.4 0.4
Std Dev 1.7 0.4 13 1.8 4.4 11 0.2 0.9 0.3 38 0.6 0.5
Ore-bearing horizons (shaded grey) show hyper enrichment of a range of elements and moderate elevations are observed in
samples taken proximal (<2 m) from ore zones (striped grey). ‘bdl’ represents values below detection limites and practices
outlined by Winderbaum et al. (2012) were followed. The <mdl values preserved in Appendix C were halved to facilitate
their inclusion in statistical calculations so as to approximate the correct spread of data; they not however make any
significant changes to inter-element correlations.
† The mean of EI7 was recalculated without extreme outlier values to show a more representative value of the dataset.
30
Table 3: Minor elements show limited enrichment in pyrite from 16 samples from EPMA analysis.
Mean values are given in weight percent of the total pyrite (wt%).
As Co Ni Se Mo
Mean (wt%) 0.18 0.02 0.03 0.29 0.65
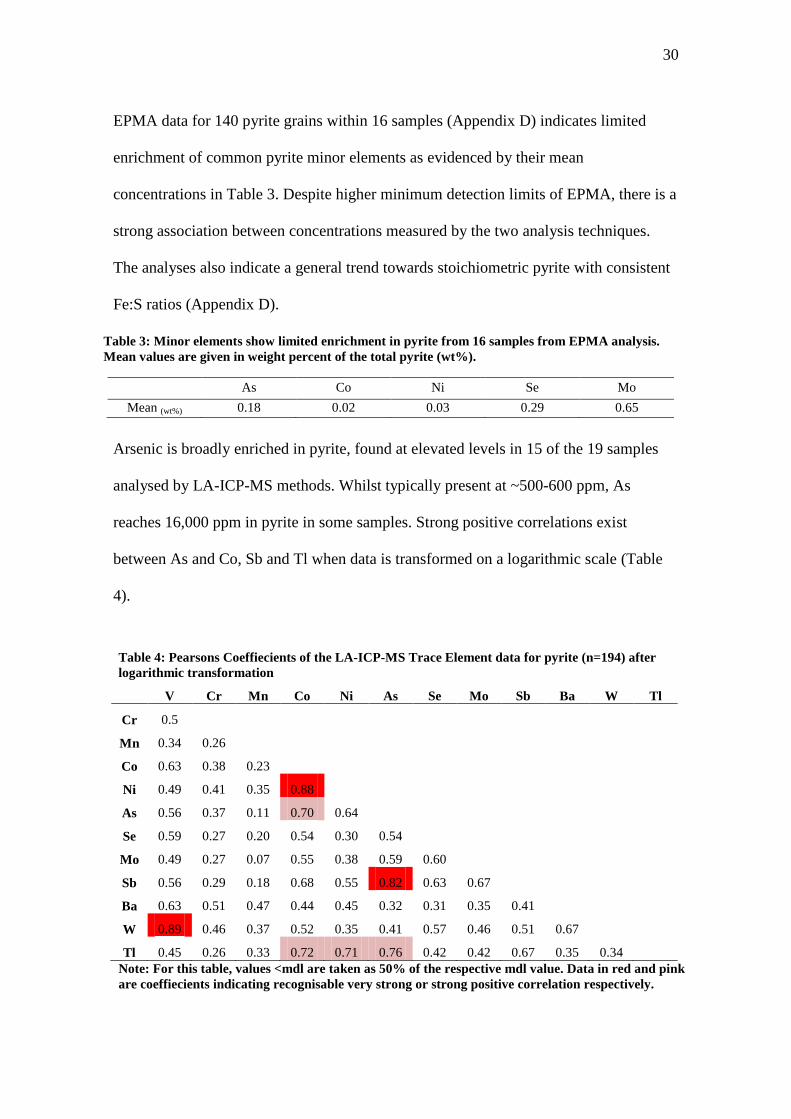
EPMA data for 140 pyrite grains within 16 samples (Appendix D) indicates limited
enrichment of common pyrite minor elements as evidenced by their mean
concentrations in Table 3. Despite higher minimum detection limits of EPMA, there is a
strong association between concentrations measured by the two analysis techniques.
The analyses also indicate a general trend towards stoichiometric pyrite with consistent
Fe:S ratios (Appendix D).
Arsenic is broadly enriched in pyrite, found at elevated levels in 15 of the 19 samples
analysed by LA-ICP-MS methods. Whilst typically present at ~500-600 ppm, As
reaches 16,000 ppm in pyrite in some samples. Strong positive correlations exist
between As and Co, Sb and Tl when data is transformed on a logarithmic scale (Table
4).
Table 4: Pearsons Coeffiecients of the LA-ICP-MS Trace Element data for pyrite (n=194) after
logarithmic transformation
V Cr Mn Co Ni As Se Mo Sb Ba W Tl
Cr 0.5
Mn 0.34 0.26
Co 0.63 0.38 0.23
Ni 0.49 0.41 0.35 0.88
As 0.56 0.37 0.11 0.70 0.64
Se 0.59 0.27 0.20 0.54 0.30 0.54
Mo 0.49 0.27 0.07 0.55 0.38 0.59 0.60
Sb 0.56 0.29 0.18 0.68 0.55 0.82 0.63 0.67
Ba 0.63 0.51 0.47 0.44 0.45 0.32 0.31 0.35 0.41
W 0.89 0.46 0.37 0.52 0.35 0.41 0.57 0.46 0.51 0.67
Tl 0.45 0.26 0.33 0.72 0.71 0.76 0.42 0.42 0.67 0.35 0.34
Note: For this table, values <mdl are taken as 50% of the respective mdl value. Data in red and pink
are coeffiecients indicating recognisable very strong or strong positive correlation respectively.
31
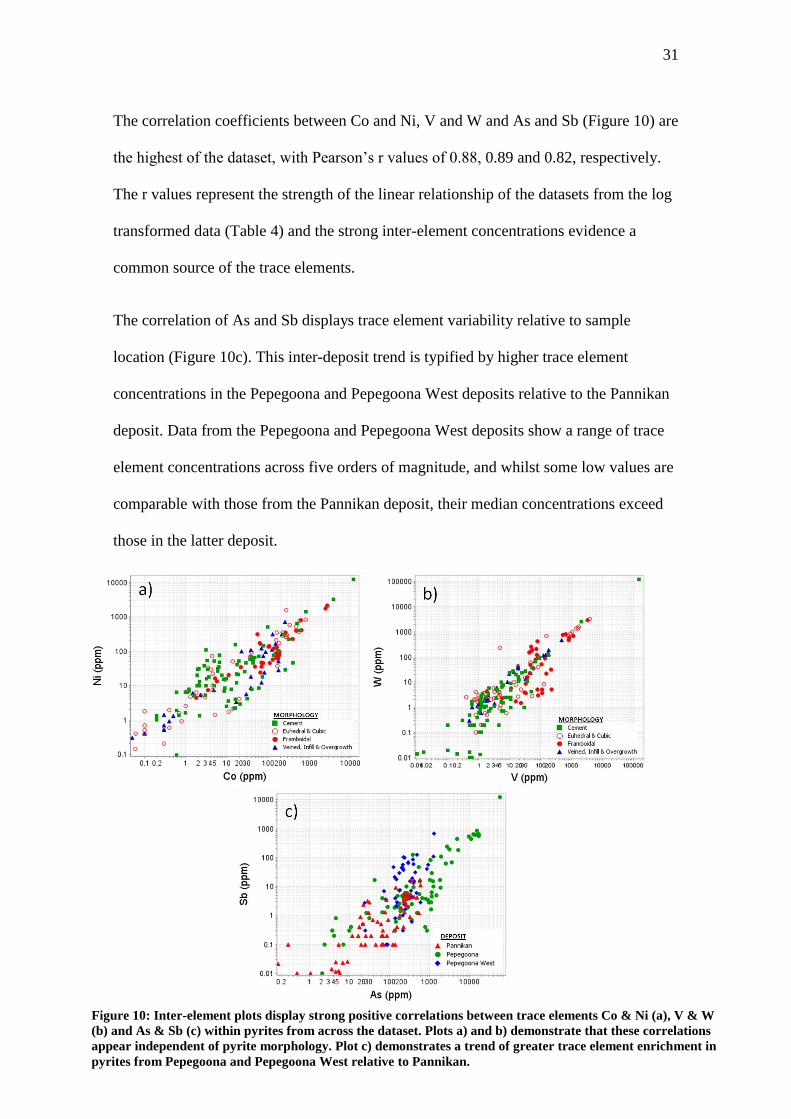
Figure 10: Inter-element plots display strong positive correlations between trace elements Co & Ni (a), V & W
(b) and As & Sb (c) within pyrites from across the dataset. Plots a) and b) demonstrate that these correlations
appear independent of pyrite morphology. Plot c) demonstrates a trend of greater trace element enrichment in
pyrites from Pepegoona and Pepegoona West relative to Pannikan.
The correlation coefficients between Co and Ni, V and W and As and Sb (Figure 10) are
the highest of the dataset, with Pearson‟s r values of 0.88, 0.89 and 0.82, respectively.
The r values represent the strength of the linear relationship of the datasets from the log
transformed data (Table 4) and the strong inter-element concentrations evidence a
common source of the trace elements.
The correlation of As and Sb displays trace element variability relative to sample
location (Figure 10c). This inter-deposit trend is typified by higher trace element
concentrations in the Pepegoona and Pepegoona West deposits relative to the Pannikan
deposit. Data from the Pepegoona and Pepegoona West deposits show a range of trace
element concentrations across five orders of magnitude, and whilst some low values are
comparable with those from the Pannikan deposit, their median concentrations exceed
those in the latter deposit.
32
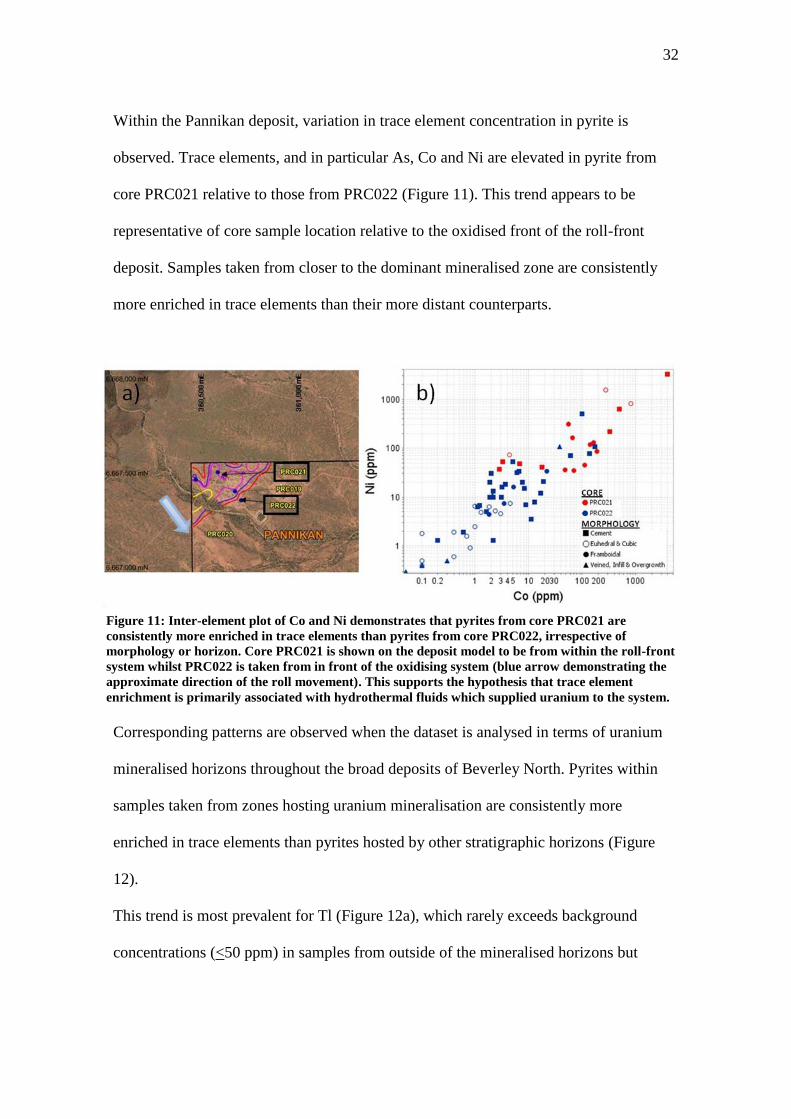
Within the Pannikan deposit, variation in trace element concentration in pyrite is
observed. Trace elements, and in particular As, Co and Ni are elevated in pyrite from
core PRC021 relative to those from PRC022 (Figure 11). This trend appears to be
representative of core sample location relative to the oxidised front of the roll-front
deposit. Samples taken from closer to the dominant mineralised zone are consistently
more enriched in trace elements than their more distant counterparts.
Corresponding patterns are observed when the dataset is analysed in terms of uranium
mineralised horizons throughout the broad deposits of Beverley North. Pyrites within
samples taken from zones hosting uranium mineralisation are consistently more
enriched in trace elements than pyrites hosted by other stratigraphic horizons (Figure
12).
This trend is most prevalent for Tl (Figure 12a), which rarely exceeds background
concentrations (<50 ppm) in samples from outside of the mineralised horizons but
Figure 11: Inter-element plot of Co and Ni demonstrates that pyrites from core PRC021 are
consistently more enriched in trace elements than pyrites from core PRC022, irrespective of
morphology or horizon. Core PRC021 is shown on the deposit model to be from within the roll-front
system whilst PRC022 is taken from in front of the oxidising system (blue arrow demonstrating the
approximate direction of the roll movement). This supports the hypothesis that trace element
enrichment is primarily associated with hydrothermal fluids which supplied uranium to the system.
33
systematically attains concentrations of ~500-1,300 ppm in pyrite associated with
uranium mineralisation (Table 2).
Nickel, and to some extent Co, which are strongly correlated across all horizons, show
additional enrichments in samples from mineralised horizons (Figure 12b). Both
commonly reach ~800-2,000 ppm in ore bearing horizons but average only ~150 ppm in
the U-barren zones. To a limited extent As, V, Sb and W which display broad trace
element enrichment, display hyper enrichment in pyrite from zones of uranium
mineralisation (Figure 12c).
Minor and limited trace element enrichment is also observable in pyrite in samples
taken proximal (<2 vertical metres) from zones of U-mineralisation (Table 2). These
elevations are not uniform across the LA-ICP-MS dataset however; As, V, Co, Ni, Mo
and Sb display moderate enrichments in the proximal zones (Figure 12).
The apparent exception to these trends is sample EI11 taken from within the roll-front at
Pepegoona West, which contains abundant hematite and native selenium (Figure 12d).
Pyrite in this sample is enriched in As, Se, Mo, Sb and W but is not associated with a
stratigraphic horizon proximal or within a zone bearing uranium mineralisation.
Enrichment in Se (~2663 ppm) appears somewhat unusual as Se is commonly limited in
other samples.
34
Figure 12: Inter-element plots As v Tl, Co v Ni and V and Sb (a to c, respectively) demonstrate consistent
trace element enrichment in pyrites from ore-bearing horizons relative to their non-mineralised
counterparts. Consistently, pyrites from zones proximal to ore-bearing horizons display moderate
enrichment generally just below levels seen in mineralised horizons. Sample EI11 appears as the exception to
these trends. For samples taken proximal to mineralised horizons, moderate enrichment occurs in most
elements (e.g. 12a and 12b) however in plot c) and d) pyrite shows significant enrichment in samples from
proximal to mineralised horizons. d) The plot of Se against Mo further supports this exception to the trend.
The samples from EI11 are significantly more enriched in both elements and this is interpreted in terms of a
late-stage oxidising fluid and consequent precipitation of native Se and hematite into the sandstone.
35
LA-ICP-MS element mapping of pyrite from 3 samples (EI7, EI8, EI11) demonstrated
irregular trace element enrichment across all pyrite morphologies consistent with
previous observations. The map of pyrite from sample EI7 demonstrates distinct
variation in trace element concentrations between pyrite morphologies (Figure 13).
Consistent with LA-ICP-MS spot analysis, framboids host limited trace element
concentrations relative to other pyrite morphologies; in this case being depleted in As,
Co, Ni, Mn, Sb, Tl and V. Limited element zonation of As, Co and Ni at framboid edges
was apparent. In contrast, porous pyrite cement was enriched in these elements and we
additionally note decreased Fe throughout this phase. The late-stage veined pyrite was
enriched in terms of Mo and As, whilst the region of cubic infill which displayed visible
zonation on BSE images (Figure 6e), was highly enriched in Mo and V.
The second map (EI8; Appendix E) contains pyrite cement which displayed visible
oscillatory zonation on BSE images (Figure 6b), however reveals only weak chemical
zonation expressed by As, Co, Ni, Mo and Sb enrichment at grain margins and Mn and
Tl enrichment at grain cores.
The pyrite cement of sample EI11 (Figure 14) shows distinct oscillatory zoning with
respect to As, Mo, Sb, and Tl. The septial deterioration zone visible in the reflected light
image (Figure 14a) is highly enriched in Co, Ni, As, Se, Mo, Tl, V and W and trace
element enrichment in the surrounding pyrite appears focused around this “nucleic”
zone. Se, which pervasively overprints the pyrite as native selenium is limited
throughout the cement of this sample, appearing only highly enriched in the
aforementioned zone. A strong crystalline nature of the pyrite cement is evident which
was not apparent from prior study of the massive pyrite cement.
36
Figure 13: LA-ICP-MS elements maps of an intergrowth of cement, framboidal and veining pyrite from
sample EI7 ( PRC015, Pepegoona) (a) petrographic image of ablated pyrite displaying authigenic
framboids, overgrown by porous pyrite which is subsequently overprinted by veined and cubic pyrite.
Throughout the element maps framboids show limited enrichment of As, Sb, Co, Ni and Tl relative to the
adjacent veined and cement morphologies. Minor zonation is observable within As and Ni. Porous cement
is enriched in As, Sb, Co, Ni and Tl. The late-stage veined pyrite is enriched in As, Mo and intra-vein
zonation is apparent on the Co, Ni and Tl maps. The resolution of pyrite mapping was not sufficient to
delineate any zonation patterns within cubic infill which displayed compositional zonation on BSE images.
37
Figure 14: LA-ICP-MS element maps of sample EI11 (PRC023, Pepegoona West) displaying a highly crystalline
nature of cement; a) petrographic image of massive pyrite cement on which the analysis was conducted. Cement
displays some septian textures associated with hematite replacement. These patterns appears to be nucleic zones for
trace element portioning as they are highly enriched in As, Co, Mo, Tl, Se and V. Arsenic displays strong zonation,
which correlates with an enrichment in Sb and Tl. Molybdenum displays a gradient of enrichment centred around
the nucleic zones. Cobalt, V and Se (and Ni and W not shown) show similar patterns of trace element enrichment.
38
(* indicates value is below minimum detection limit)
Electron probe microanalysis of U-bearing minerals aimed to identify any
compositional variation present (Appendix D). Analysis was plagued by the porous
character of the phases, and the highly inter-grown nature of pyrites and U-bearing
phases. This resulted in analytical totals that generally fell well short of 100 % for the
mineral likely to be uraninite from textural characterisation and previous studies at
Beverley (Wülser et al. 2011). Although we cannot rule out the presence of hydrated U-
species (of which schoepite, (UO2)8O2(OH)12.12H2O, is the most common) we
nevertheless attribute these probe data to uraninite. Minor elements present in the
„better‟ analyses (totals ~90-93 wt%) include, Ca, Y, La, Ce, K, Fe, Ti, Mg, Si, Al and
P, but significantly neither Th nor Pb (Appendix D). The presence of LREE, P and S is
suggestive of either limited solid solution, or of sub-micron to nano-scale inclusions of
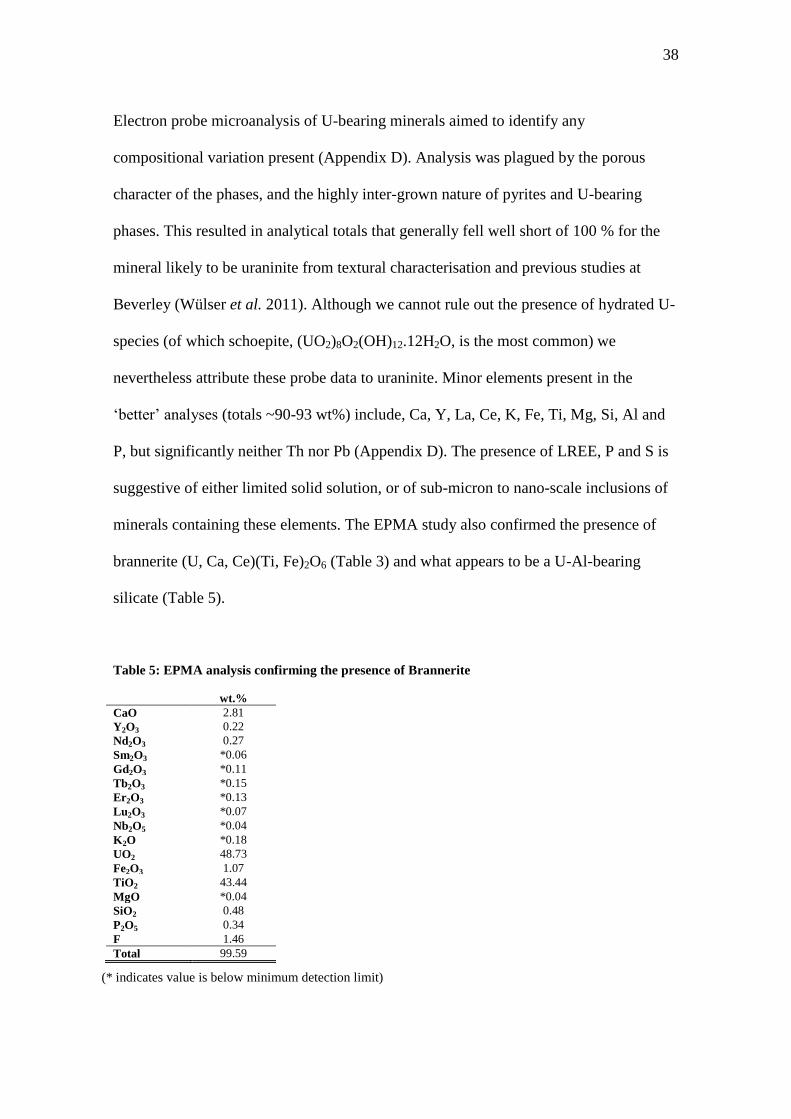
minerals containing these elements. The EPMA study also confirmed the presence of
brannerite (U, Ca, Ce)(Ti, Fe)2O6 (Table 3) and what appears to be a U-Al-bearing
silicate (Table 5).
Table 5: EPMA analysis confirming the presence of Brannerite
wt.%
CaO 2.81
Y2O3 0.22
Nd2O3 0.27
Sm2O3 *0.06
Gd2O3 *0.11
Tb2O3 *0.15
Er2O3 *0.13
Lu2O3 *0.07
Nb2O5 *0.04
K2O *0.18
UO2 48.73
Fe2O3 1.07
TiO2 43.44
MgO *0.04
SiO2 0.48
P2O5 0.34
F 1.46
Total 99.59
39
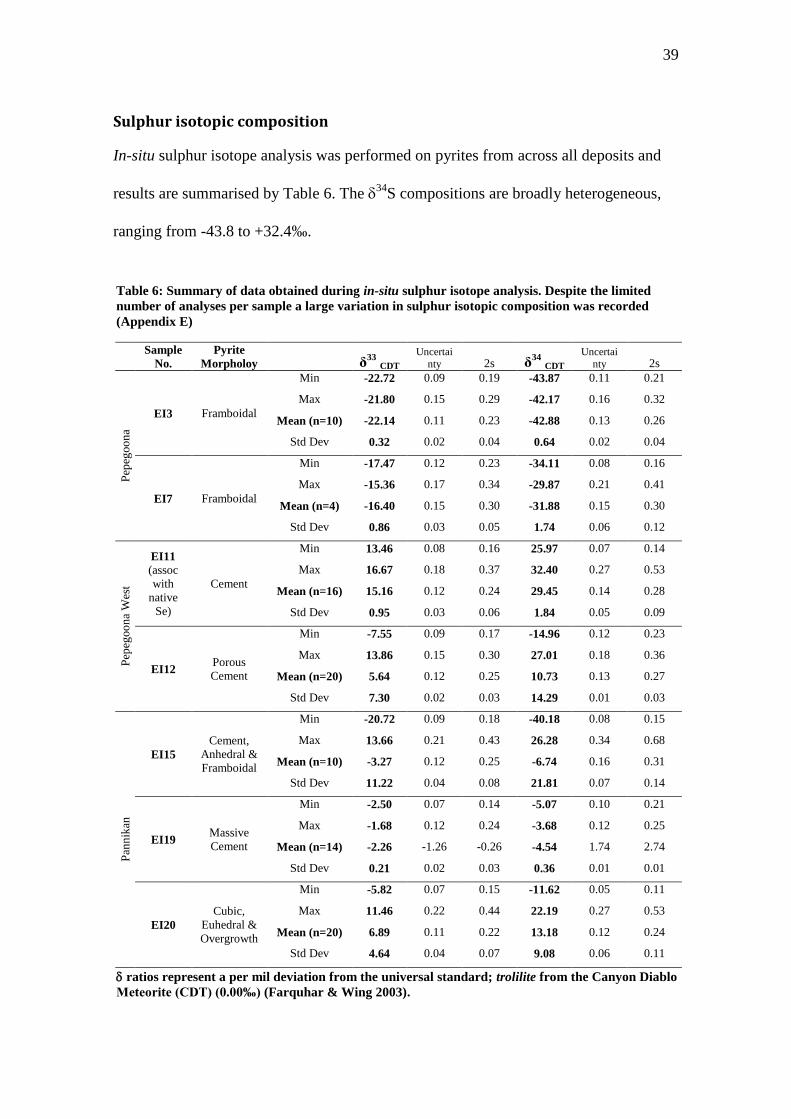
Sulphur isotopic composition
In-situ sulphur isotope analysis was performed on pyrites from across all deposits and
results are summarised by Table 6. The 34
S compositions are broadly heterogeneous,
ranging from -43.8 to +32.4‰.
Table 6: Summary of data obtained during in-situ sulphur isotope analysis. Despite the limited
number of analyses per sample a large variation in sulphur isotopic composition was recorded
(Appendix E)
Sample
No.
Pyrite
Morpholoy δ33
CDT Uncertai
nty 2s δ34
CDT Uncertai
nty 2s
Pep
egoo
na
EI3 Framboidal
Min -22.72 0.09 0.19 -43.87 0.11 0.21
Max -21.80 0.15 0.29 -42.17 0.16 0.32
Mean (n=10) -22.14 0.11 0.23 -42.88 0.13 0.26
Std Dev 0.32 0.02 0.04 0.64 0.02 0.04
EI7 Framboidal
Min -17.47 0.12 0.23 -34.11 0.08 0.16
Max -15.36 0.17 0.34 -29.87 0.21 0.41
Mean (n=4) -16.40 0.15 0.30 -31.88 0.15 0.30
Std Dev 0.86 0.03 0.05 1.74 0.06 0.12
Pep
egoo
na
Wes
t
EI11
(assoc
with
native
Se)
Cement
Min 13.46 0.08 0.16 25.97 0.07 0.14
Max 16.67 0.18 0.37 32.40 0.27 0.53
Mean (n=16) 15.16 0.12 0.24 29.45 0.14 0.28
Std Dev 0.95 0.03 0.06 1.84 0.05 0.09
EI12 Porous
Cement
Min -7.55 0.09 0.17 -14.96 0.12 0.23
Max 13.86 0.15 0.30 27.01 0.18 0.36
Mean (n=20) 5.64 0.12 0.25 10.73 0.13 0.27
Std Dev 7.30 0.02 0.03 14.29 0.01 0.03
Pan
nik
an
EI15
Cement,
Anhedral &
Framboidal
Min -20.72 0.09 0.18 -40.18 0.08 0.15
Max 13.66 0.21 0.43 26.28 0.34 0.68
Mean (n=10) -3.27 0.12 0.25 -6.74 0.16 0.31
Std Dev 11.22 0.04 0.08 21.81 0.07 0.14
EI19 Massive
Cement
Min -2.50 0.07 0.14 -5.07 0.10 0.21
Max -1.68 0.12 0.24 -3.68 0.12 0.25
Mean (n=14) -2.26 -1.26 -0.26 -4.54 1.74 2.74
Std Dev 0.21 0.02 0.03 0.36 0.01 0.01
EI20
Cubic,
Euhedral &
Overgrowth
Min -5.82 0.07 0.15 -11.62 0.05 0.11
Max 11.46 0.22 0.44 22.19 0.27 0.53
Mean (n=20) 6.89 0.11 0.22 13.18 0.12 0.24
Std Dev 4.64 0.04 0.07 9.08 0.06 0.11
ratios represent a per mil deviation from the universal standard; trolilite from the Canyon Diablo
Meteorite (CDT) (0.00‰) (Farquhar & Wing 2003).
40
Within this unusually broad range of values, distinct populations may nevertheless be
recognised (Figure 15). These correlate to some extent, although never exclusively with
pyrite morphology. Figure 15, in which 34
S is plotted against 33
S, displays a large
variation is isotopic values both within and among grains and this information may be
used to extract information about source and precipitation mechanisms of the sulphur.
The S-isotope compositions of the morphologically-distinct framboidal pyrite
population (samples EI3 & EI7) show discrete depleted populations in relatively tight
clusters. The spread of all framboid 34
S data ranges between -43.8 and -18.3‰.
Data recorded from other pyrite morphologies, commonly cement, cubic and porous
overgrowth (Table 6) display a rather broader spectrum of values. The internal datasets
for some samples are commonly highly variable (EI12, EI15 & EI20), while others are
tightly clustered (EI11 & EI19). Despite this isotopic complexity, and the large Δ34S of
65.0‰, these S-isotope compositions are enriched relative to framboidal pyrite.
The analyses from homogeneous pyritic cement of sample EI11, from which BSE
images showed secondary, overprinting of hematite and elemental Selenium, plot as a
tight cluster of highly 34
S-enriched points (Standard deviation of 0.04).
The massive pyrite of sample EI19 which lacked any significant trace element
enrichment (Table 2) demonstrated minor (~34
S -3.68‰) depletion in 34
S.
Within and among grains from both the visibly homogenous pyrite cement of sample
EI15 and the porous pyrite matrix of EI12, variations in 34
S are largely irregular. These
isotopically heterogeneous pyrite types appear to have negligible systematic isotopic
variation associated with grain habit, margins or analysis location (Appendix F).
41
Figure 15: Recorded 34
S values are displayed against 33
S values for each individual analysis. Analyses are displayed by sample type and display an association with pyrite
morphology (Appendix F). The information displayed by this plot can be used to extract information about the source of the sulphur and the formation processes that affected the
pyrite. Despite the limited number of analyses per sample, a large variation of sulphur isotope compositions was recorded. Fit to the MDFL line indicates that all sulphur isotope
fractionation was carried out by Mass-Dependent Fractionation processes (Ono et al. 2006).
42
DISCUSSION
The uranium-bearing ore systems of Pepegoona, Pepegoona West and Pannikan are the
products of prolonged and evolving hydrothermal flow of uranium enriched fluids in the
Lake Frome Region that is likely continuing to the present day (Skirrow 2009, Wülser
et al. 2011).
The mineralogy and geochemistry of the ores reflect a superposition of a succession of
hydrothermal fluids onto an already lithologically-varied sequence of sedimentary
rocks. The location of U-mineralisation is controlled by the interplay between sediment
permeability, palaeochannel architecture and the proportion of reducing components
such as carbonaceous matter and sulphides in the host rock (Skirrow 2009).
Given this complexity, many factors likely influenced the pyrite morphology, trace
element geochemistry and isotopic signatures of pyrite across the deposits. The
practicability of any vectoring approach to exploration using the trace element
chemistry of pyrite depends on understanding both the cause and expression of this
variation at a range of scales. The data generated in this study is intended to expand the
volume of published data on U-mineralisation at Beverley. The ability to draw new
comparisons between the established hydrothermal systems of Beverley and the
relatively uncharacterised deposits at Beverley North has positive implications for the
understanding of the controls on ore genesis in the regional sedimentary basins. Most
importantly, the dataset was obtained using site-specific methods, allowing information
to be correlated not only with geological position but also with textures and grain
morphology observed at microscopic scale.
43
Sulphur Sources
New sulphur isotope data for pyrites of the sedimentary uranium systems at Beverley
North was obtained with a view toward gaining insights into chemical and physical
controls on regional pyrite precipitation.
The 34
S compositions of the dataset are highly variable (-43.8 to +32.4‰, Figure 15,
Table 6). Heterogeneity within datasets is a common feature of sulphur isotope
compositions obtained from sedimentary pyrite (e.g. Kohn et al (1998)) as sulphur
isotope fractionation and the consequent partitioning of light stable isotopes in mineral
forming systems is driven by temperature, bacterial reduction, pH and reservoir effects
(Fleming & Bekken 1995, Ohmoto & Goldhaber 1997, Ulrich et al. 2011). The overall
discordance of the data at the regional scale, suggests that multiple mineralisation
episodes, with at least two sources of sulphur were involved in pyrite formation
(Fleming & Bekken 1995).
The distinct populations observable within the broad dataset correlate to some extent,
although not exclusively with pyrite morphology and mineral paragenesis. Where
different phases of sulphides occur in close petrographic context, in-situ sulphur isotope
analysis is capable of sufficient spatial resolution to address these textural variations
(Ulrich et al. 2011).
Isotopic ratios from morphologically-distinct framboidal pyrites display discrete and
largely depleted 34
S populations (-43.8 to -18.3‰). This depletion in framboidal
pyrites is characteristic of a biogenic sulphur source (Schwarcz & Burnie 1973,
Raiswell 1982, Seal 2006) with minor differences in the clustered isotopic ratios from
different samples reflecting diversity of the reduction processes (Schwarcz & Burnie
44
1973, Seal 2006). Sulphate-reducing bacteria preferentially select sulphate with light
sulphur (Chambers & Trudinger 1979), and organic material in the sedimentary system
supplies energy for sulphate reduction (Warren 1972, Beier & Feldman 1991).
Relative to framboidal pyrite, the remaining highly heterogeneous dataset, which
represents a range of pyrite morphologies, displays significant 34
S enrichment. These
values are indicative of pyrite mineralisation, developed in disequilibrium in an open
system (Seal 2006) and point primarily towards a hydrothermal sulphur source (Thode
et al. 1953, Kohn et al. 1998).
Progressive 34
S enrichment due to the preferential uptake of lighter sulphur isotopes by
pyrite and the mixing of two or more major sources of sulphur during late-stage
diagenesis appear likely mechanisms to produce the broad range of 34
S values
observed in the hydrothermal pyrites (Warren 1972, Beier & Feldman 1991). In this
case the mixing of sulphur from discrete sources was likely carried out by an interaction
between the intrusive rocks of the nearby Mt Painter Domain granites (displaying 34
S
values close to zero) and sediments containing 34
S-rich sulphur such as evaporites
throughout the Lake Eyre Basin (Ohmoto & Goldhaber 1997, Wülser et al. 2011).
Migrating hydrothermal fluids of meteoric and magmatic origin likely facilitated these
interaction processes.
In addition, these hydrothermal pyrites often appear to be texturally homogenous, with
only minor variations in alteration patterns and porosity; however intragranular isotopic
variations are common throughout the dataset (e.g. EI12 & EI15). These irregular ratios
show no systematic variation by grain habit or morphology, and without in-depth
45
mapping of the heterogeneous sulphur isotope ratios, they are considered relic of the
varied sulphur composition of hydrothermal fluids which underwent mixing processes.
Comparable sulphur isotope data for the Lake Frome Region is limited to large-scale
depletions of 34
S in sulphides observed in the Beverley uranium deposit (Wülser et al.
2011). These depletions were interpreted to indicate origin via bacterially-mediated
sulphate reduction, possibly in an early diagenetic lacustrine setting (Wülser et al.
2011). Whilst analogous data was obtained in the present study, primarily associated
with framboidal pyrites; the new expanded set of S-isotopes evidences a more complex
evolution of ore-stage sulphides than has previously been proposed. Evidence for
multiple sulphur sources with a late hydrothermal component, reinforces the importance
of understanding the controls on all stages of pyrite mineralisation in the context of the
uranium deposits at Beverley North.
Deposit-scale variations in trace element concentration of pyrite
The non-uniform enrichment of 12 trace elements in pyrite occurs across the uranium
deposits of Pepegoona, Pepegoona West and Pannikan. The large standard deviations of
individual trace element datasets, as outlined by Table 2 reflect variability in pyrite
textural homogeneity, porosity and possible inclusion development.
Arsenic is broadly enriched relative to background levels, across all pyrite
morphologies and deposits. Due to its chemical properties it is commonly included into
the pyrite lattice by substitution for sulphur (Savage et al. 2000, Lowers et al. 2007).
Other elements such as Co, Ni and Se, present in trace concentrations may also be
included into pyrite via similar substitution processes for Fe or S.
46
The enrichment of trace elements (Fig 10c) in the Pepegoona and Pepegoona West
deposits relative to the Pannikan deposit is likely an influence of fluid flow through
sandstone horizons and the geometry of both active and palaeoaquifers within the
regional sedimentary systems. Fluid properties and flow directions are controlled by the
general S-N trend of the Eocene palaeochannels and the distance of each deposit from
the U-rich source rocks of the Mt Painter Inlier (Skirrow 2009). These influences on
hydrothermal fluid properties are a likely a partial cause of the inter-deposit variations;
however such an interpretation does not consider the wide range of extraneous factors
which may have influenced enrichment of trace elements in pyrite at a broader scale.
The intra-deposit variation at Pannikan, evidenced by the correlation between As, Co
and Ni is associated with the location of the drillhole intersections in the roll-front
deposit. Interpretation of deposit models (Figure 11a) and roll-front morphology shows
that core PRC021 intersects the roll-front system whilst core PRC022 is located in front
of the oxidising system, where hydrothermal fluids have not extensively penetrated.
Hence, the relatively barren pyrite observed in samples from PRC022 is a result of the
lack of protracted hydrothermal flow at that location. More in-depth modelling of the
deposit system is required to make absolute conclusions.
Horizon-scale observations
The enrichment of a mix of trace elements (e.g. Co, Ni, W, Mo, Sb, Tl, Se, As, and V)
in pyrite from ore-bearing horizons is likely a result of input into the mineralising
hydrothermal fluids from multiple sources.
47
Cobalt and nickel are commonly associated with fluids derived from a mafic source or
have leached a source rock containing these elements (Goldschmidt 1958, Clark et al.
2004, Pohl 2011). Likewise, W and Mo are commonly enriched in fluids from a granitic
source (Blevin et al. 1996), and Sb, Tl, As and V are representative of an influence from
organic-rich black shales (Brumsack 2006). Within the geological setting of the
Beverley North deposits, all three components are present.
On the same note, broad-scale enrichment of Co, Ni and As across the dataset indicates
that these elements were likely sourced by different morphologies from different
sources. Their limited enrichment in authigenic pyrites indicates leaching from the host
lithologies, whilst their hyper enrichment in hydrothermal pyrite of ore-bearing horizons
is indicative of continued compositional variation of the hydrothermal fluids during the
progressive evolution of the deposits (Figure 13).
Given these trends, it is interesting to note an apparent negligible relationship between
34
S values and samples from mineralised horizons. Of the samples analysed from ore-
bearing horizons two showed significant 34
S depletion, which was interpreted as a
result of the presence of morphologically-distinct framboidal pyrites in the samples.
Analyses made on the third-ore bearing sample, comprised a range of pyrite
morphologies and displayed a significantly wider variance in 34
S values (-40.8 to
+26.3‰), with the analysis of a framboidal pyrite aggregate from this sample
representing the largest 34
S depletion.
Comparable, 34
S heterogeneous but enriched ratios derived from samples taken from
non-mineralised horizons would indicate an almost null relationship existing between
34
S isotopic composition and U-mineralisation. Conversely, it appears that a more
consistent relationship between pyrite morphology and sulphur source exists.
48
Further to this conclusion, we infer that the elevated levels in trace elements as observed
across the sample set are independent of the sulphur source (i.e. most metals were
derived from a range of different sources). In such a scenario, it is likely that the trace
element enrichment in the pyrites of mineralised horizons was inherited from both the
(epigenetic) fluid transporting uranium into the basin and proximal sedimentary
lithologies.
Pyrite Morphology and Textures
Textural characterisation led to the recognition of four broad morphological groups of
pyrite.
Framboidal pyrite is observed throughout the sample suite and is comparable with the
distinct aggregates described by Wilkin & Barnes (1997). The widespread preservation
of framboidal pyrite throughout the samples is dependent on two factors; isolation of
framboids from the influence of the external diagenetic environment and the
interruption of the supply of at least one essential compound in the mineralising fluid
(Fe and/or H2S) (Sawlowicz 1993).
Both LA-ICP-MS spot analysis and element mapping display limited enrichment of
trace elements in framboidal pyrite relative to other pyrite morphologies (Figure 13).
This limited enrichment and some minor zonation in As, Co and Ni at aggregate edges
indicate that trace elements were supplied to the system during authigenic growth by the
sandstone host lithology. The presence of iron oxide minerals with relic framboidal
textures in oxidised sandstones and the lack of rounded pyrite morphologies makes it
unlikely that detrital deposition of pyrite into the host sandstone occurred.
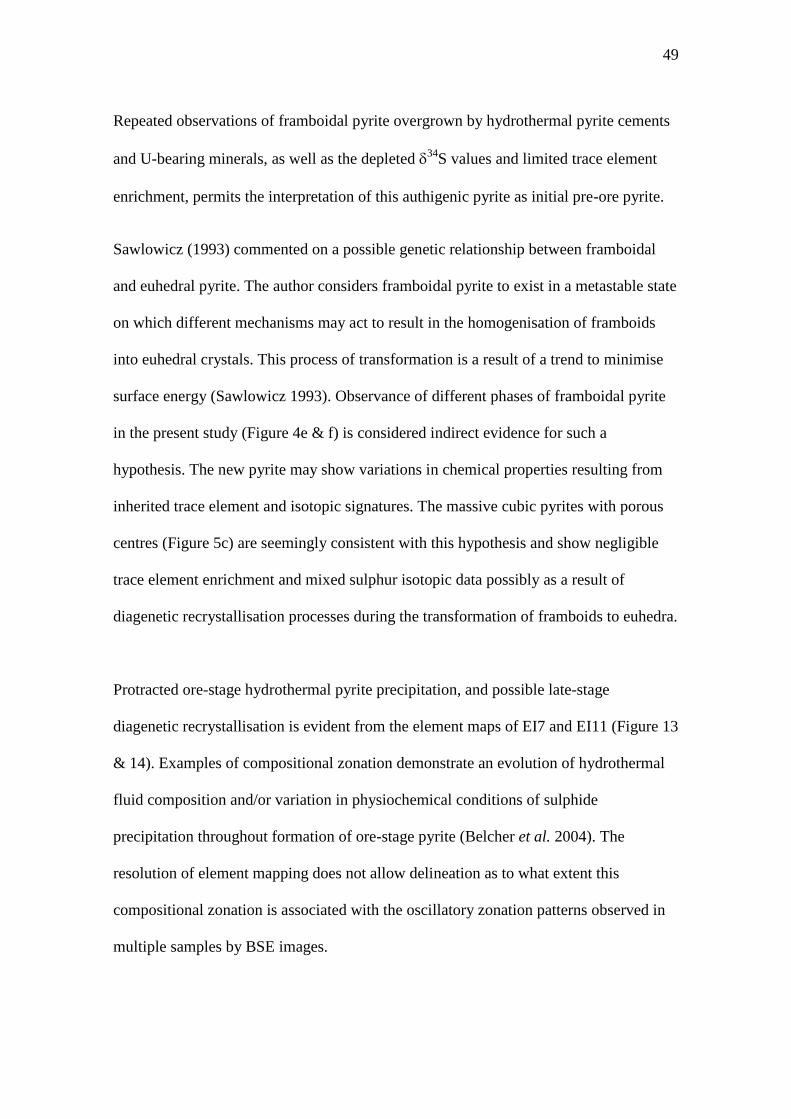
49
Repeated observations of framboidal pyrite overgrown by hydrothermal pyrite cements
and U-bearing minerals, as well as the depleted 34
S values and limited trace element
enrichment, permits the interpretation of this authigenic pyrite as initial pre-ore pyrite.
Sawlowicz (1993) commented on a possible genetic relationship between framboidal
and euhedral pyrite. The author considers framboidal pyrite to exist in a metastable state
on which different mechanisms may act to result in the homogenisation of framboids
into euhedral crystals. This process of transformation is a result of a trend to minimise
surface energy (Sawlowicz 1993). Observance of different phases of framboidal pyrite
in the present study (Figure 4e & f) is considered indirect evidence for such a
hypothesis. The new pyrite may show variations in chemical properties resulting from
inherited trace element and isotopic signatures. The massive cubic pyrites with porous
centres (Figure 5c) are seemingly consistent with this hypothesis and show negligible
trace element enrichment and mixed sulphur isotopic data possibly as a result of
diagenetic recrystallisation processes during the transformation of framboids to euhedra.
Protracted ore-stage hydrothermal pyrite precipitation, and possible late-stage
diagenetic recrystallisation is evident from the element maps of EI7 and EI11 (Figure 13
& 14). Examples of compositional zonation demonstrate an evolution of hydrothermal
fluid composition and/or variation in physiochemical conditions of sulphide
precipitation throughout formation of ore-stage pyrite (Belcher et al. 2004). The
resolution of element mapping does not allow delineation as to what extent this
compositional zonation is associated with the oscillatory zonation patterns observed in
multiple samples by BSE images.
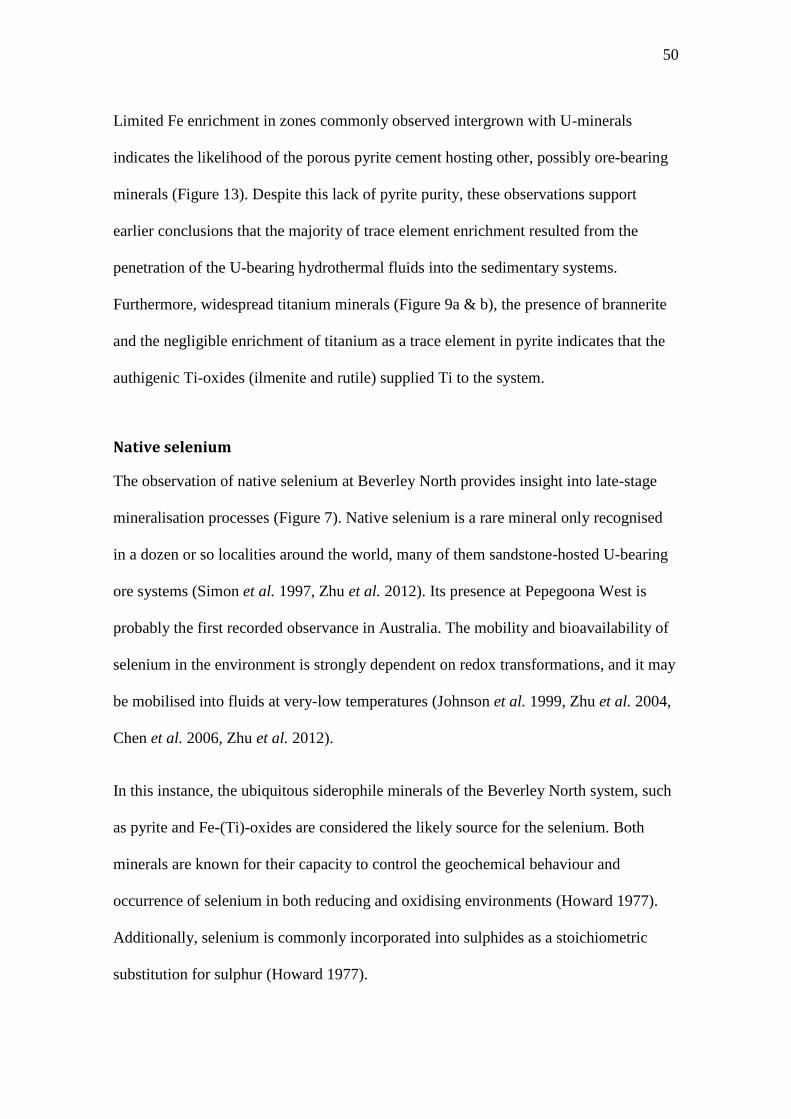
50
Limited Fe enrichment in zones commonly observed intergrown with U-minerals
indicates the likelihood of the porous pyrite cement hosting other, possibly ore-bearing
minerals (Figure 13). Despite this lack of pyrite purity, these observations support
earlier conclusions that the majority of trace element enrichment resulted from the
penetration of the U-bearing hydrothermal fluids into the sedimentary systems.
Furthermore, widespread titanium minerals (Figure 9a & b), the presence of brannerite
and the negligible enrichment of titanium as a trace element in pyrite indicates that the
authigenic Ti-oxides (ilmenite and rutile) supplied Ti to the system.
Native selenium
The observation of native selenium at Beverley North provides insight into late-stage
mineralisation processes (Figure 7). Native selenium is a rare mineral only recognised
in a dozen or so localities around the world, many of them sandstone-hosted U-bearing
ore systems (Simon et al. 1997, Zhu et al. 2012). Its presence at Pepegoona West is
probably the first recorded observance in Australia. The mobility and bioavailability of
selenium in the environment is strongly dependent on redox transformations, and it may
be mobilised into fluids at very-low temperatures (Johnson et al. 1999, Zhu et al. 2004,
Chen et al. 2006, Zhu et al. 2012).
In this instance, the ubiquitous siderophile minerals of the Beverley North system, such
as pyrite and Fe-(Ti)-oxides are considered the likely source for the selenium. Both
minerals are known for their capacity to control the geochemical behaviour and
occurrence of selenium in both reducing and oxidising environments (Howard 1977).
Additionally, selenium is commonly incorporated into sulphides as a stoichiometric
substitution for sulphur (Howard 1977).
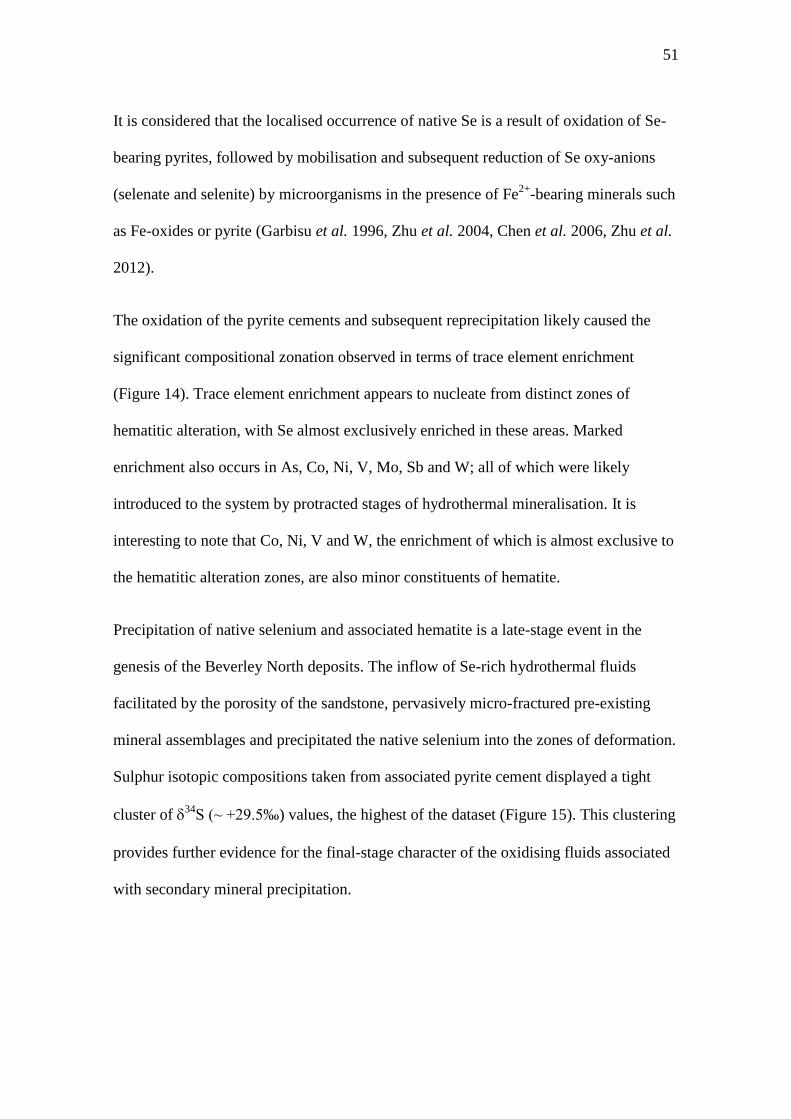
51
It is considered that the localised occurrence of native Se is a result of oxidation of Se-
bearing pyrites, followed by mobilisation and subsequent reduction of Se oxy-anions
(selenate and selenite) by microorganisms in the presence of Fe2+
-bearing minerals such
as Fe-oxides or pyrite (Garbisu et al. 1996, Zhu et al. 2004, Chen et al. 2006, Zhu et al.
2012).
The oxidation of the pyrite cements and subsequent reprecipitation likely caused the
significant compositional zonation observed in terms of trace element enrichment
(Figure 14). Trace element enrichment appears to nucleate from distinct zones of
hematitic alteration, with Se almost exclusively enriched in these areas. Marked
enrichment also occurs in As, Co, Ni, V, Mo, Sb and W; all of which were likely
introduced to the system by protracted stages of hydrothermal mineralisation. It is
interesting to note that Co, Ni, V and W, the enrichment of which is almost exclusive to
the hematitic alteration zones, are also minor constituents of hematite.
Precipitation of native selenium and associated hematite is a late-stage event in the
genesis of the Beverley North deposits. The inflow of Se-rich hydrothermal fluids
facilitated by the porosity of the sandstone, pervasively micro-fractured pre-existing
mineral assemblages and precipitated the native selenium into the zones of deformation.
Sulphur isotopic compositions taken from associated pyrite cement displayed a tight
cluster of 34
S (~ +29.5‰) values, the highest of the dataset (Figure 15). This clustering
provides further evidence for the final-stage character of the oxidising fluids associated
with secondary mineral precipitation.
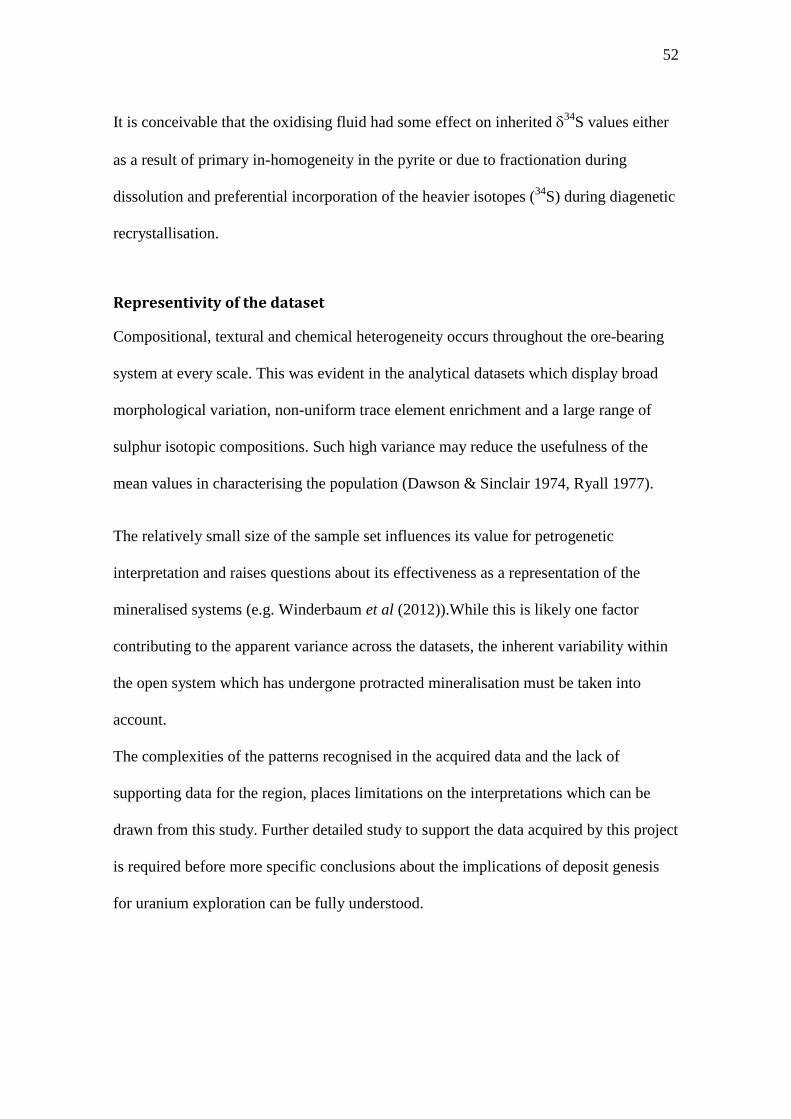
52
It is conceivable that the oxidising fluid had some effect on inherited 34
S values either
as a result of primary in-homogeneity in the pyrite or due to fractionation during
dissolution and preferential incorporation of the heavier isotopes (34
S) during diagenetic
recrystallisation.
Representivity of the dataset
Compositional, textural and chemical heterogeneity occurs throughout the ore-bearing
system at every scale. This was evident in the analytical datasets which display broad
morphological variation, non-uniform trace element enrichment and a large range of
sulphur isotopic compositions. Such high variance may reduce the usefulness of the
mean values in characterising the population (Dawson & Sinclair 1974, Ryall 1977).
The relatively small size of the sample set influences its value for petrogenetic
interpretation and raises questions about its effectiveness as a representation of the
mineralised systems (e.g. Winderbaum et al (2012)).While this is likely one factor
contributing to the apparent variance across the datasets, the inherent variability within
the open system which has undergone protracted mineralisation must be taken into
account.
The complexities of the patterns recognised in the acquired data and the lack of
supporting data for the region, places limitations on the interpretations which can be
drawn from this study. Further detailed study to support the data acquired by this project
is required before more specific conclusions about the implications of deposit genesis
for uranium exploration can be fully understood.
53
CONCLUSIONS
Outcomes of this study provide the basis for the following preliminary paragenetic
scheme of the sandstone-hosted uranium deposits of Pepegoona, Pepegoona West and
Pannikan. This new genetic model is based on data obtained by multiple analytical
techniques considered in the context of archetypal sandstone-hosted uranium deposits
and known mineralisation models for the proximal Beverley uranium deposit.
Fine-grained pre-ore pyrite is ubiquitous throughout sedimentary ore-bearing systems at
Beverley North. Widespread framboidal pyrite aggregates of authigenic provenance
display strongly-depleted 34
S signatures indicative of a discrete biogenic sulphur
source, consistent with the accepted biogenic mechanisms of syn-sedimentary pyrite
formation (Wilkin & Barnes 1997). Progressive phases of aggregate growth observed
throughout the sample suite evidence a genetic relationship between framboidal and
euhedral pyrites and surrounding host lithologies acted as a geochemical source during
authigenic growth. Diagenetic recrystallisation during continued pyrite growth is a
likely factor in the limited trace element concentrations of these pyrites.
Protracted flow of low-temperature hydrothermal fluids into the basin introduced
uranium and other trace elements. These fluids of both meteoric and magmatic origin
evolved over time from a variety of sources (mafic and granitic influences within the
Mt. Painter Domain) and became progressively 34
S-enriched due to preferential uptake
of lighter sulphur isotopes during ore-stage pyrite precipitation. Interaction of these
fluids with pre-existing pyrite occurred as they moved down-dip along palaeochannels
and aquifers led to extensive mixing, remobilisation and cycles of overprinting,
54
expressed in the sample suite as oscillatory trace element zonation and non-systematic
variation in S-isotope signature.
The final stage saw inflow of highly 34
S enriched oxidising fluids, causing replacement
and recrystallisation of pre-existing pyrite, mobilisation of selenium and precipitation of
hematite and native selenium within porous sandstone.
The results of this study strongly suggest that the trace element composition of pyrite
can represent the basis of a future vectoring approach to exploration. The definition of
multiple sources of sulphur in the ore-bearing systems at Beverley North, combined
with recognition that uranium transportation takes place solely by trace element
enriched hydrothermal fluids (with both granitic and mafic influence), represents a
major step towards an integrated genetic model for the deposits.
ACKNOWLEDGMENTS
I sincerely thank my supervisor A/Professor Nigel Cook, for his guidance and
enthusiasm throughout the year. His continued advice and ideas on the interpretation of
data, direction of the project made the outcomes of this project possible.
I would also like to thank Heathgate Resources for their sponsorship. I particularly
thank Adam Huddleston, Horst Märten and Andrea Marsland-Smith for their ongoing
interest and support in the outcomes of this project.
Analytical work was made possible by Ben Wade, Angus Netting and the staff at
Adelaide Microscopy. Their training, advice and ongoing help with analytical
interpretation are greatly appreciated.
Guidance and laboratory access for sulphur isotope analysis was kindly given my John
Cliff, Centre for Microscopy, Characterisation & Analysis, UWA.
Pontifex & associates are thanked for their careful and timely preparation of samples.
I would finally like to thank Carla Zammit for her assistance in the field, Katie Howard
for advice on all aspects of the project and members of the honours cohort for their
helpful peer reviewing.
55
REFERENCES
ABRAITIS P. K., PATTRICK R. A. D. & VAUGHAN D. J. 2004. Variations in the compositional, textural and electrical properties of natural pyrite: a review. International Journal of Mineral Processing 74, 41-59.
BARRIE C. D., BOYCE A. J., BOYLE A. P., WILLIAMS P. J., BLAKE K., OGAWARA T., AKAI J. & PRIOR D. J. 2009. Growth controls in colloform pyrite. American Mineralogist 94, 415-429.
BEIER J. A. & FELDMAN H. R. 1991. Sulfur isotopes and paragenesis of sulfide minerals in the Silurian Waldron Shale, southern Indiana. Geology 19, 389-392.
BELCHER R. W., ROZENDAAL A. & PRZYBYLOWICZ W. J. 2004. Trace element zoning in pyrite determined by PIXE elemental mapping: evidence for varying ore–fluid composition and electrochemical precipitation of gold at the Spitskop deposit, Saldania Belt, South Africa. X-Ray Spectrometry 33, 174-180.
BENDALL C., LAHAYE Y., FIEBIG J., WEYER S. & BREY G. P. 2006. In situ sulfur isotope analysis by laser ablation MC-ICPMS. Applied Geochemistry 21, 782-787.
BERNER R. A. 1984. Sedimentary pyrite formation: An update. Geochimica et Cosmochimica Acta 48, 605-615.
BLEVIN P. L., CHAPPELL B. W. & ALLEN C. M. 1996. Intrusive metallogenic provinces in eastern Australia based on granite source and composition. Earth and Environmental Science Transactions of the Royal Society of Edinburgh 87, 281-290.
BRUGGER J., LONG N., MCPHAIL D. C. & PLIMER I. 2005. An active amagmatic hydrothermal system: The Paralana hot springs, Northern Flinders Ranges, South Australia. Chemical Geology 222, 35-64.
BRUGGER J., WULSER P. A. & FODEN J. 2011. Genesis and Preservation of a Uranium-Rich Paleozoic Epithermal System with a Surface Expression (Northern Flinders Ranges, South Australia): Radiogenic Heat Driving Regional Hydrothermal Circulation over Geological Timescales. Astrobiology 11, 499-508.
BRUMSACK H.-J. 2006. The trace metal content of recent organic carbon-rich sediments: Implications for Cretaceous black shale formation. Palaeogeography, Palaeoclimatology, Palaeoecology 232, 344-361.
BUTLER I. B., BÖTTCHER M. E., RICKARD D. & OLDROYD A. 2004. Sulfur isotope partitioning during experimental formation of pyrite via the polysulfide and hydrogen sulfide pathways: implications for the interpretation of sedimentary and hydrothermal pyrite isotope records. Earth and Planetary Science Letters 228, 495-509.
BUTLER I. B., RICKARD D. & GRIMES S. 2000. Framboidal Pyrite: Self Organisation in the Fe-S System. Journal of Conference Abstracts 5, 276-277.
CHAMBERS L. A. & TRUDINGER P. A. 1979. Microbiological fractionation of stable sulfur isotopes; a review and critique. Geomicrobiology Journal 1, 249-293.
CHEN Y.-W., LI L., D’ULIVO A. & BELZILE N. 2006. Extraction and determination of elemental selenium in sediments—A comparative study. Analytica Chimica Acta 577, 126-133.
CLARK C., GRGURIC B. & MUMM A. S. 2004. Genetic implications of pyrite chemistry from the Palaeoproterozoic Olary Domain and overlying Neoproterozoic Adelaidean sequences, northeastern South Australia. Ore Geology Reviews 25, 237-257.
COOK N. J., CIOBANU C. L. & MAO J. 2009. Textural control on gold distribution in As-free pyrite from the Dongping, Huangtuliang and Hougou gold deposits, North China Craton (Hebei Province, China). Chemical Geology 264, 101-121.
56
DAWSON K. M. & SINCLAIR A. J. 1974. Factor Analysis of Minor Element Data for Pyrites, Endako Molybdenum Mine, British Columbia, Canada. Economic Geology 69, 404-411.
ELBURG M. A., BONS P. D., FODEN J. & BRUGGER J. 2003. A newly defined Late Ordovician magmatic-thermal event in the Mt Painter Province, Northern Flinders Ranges, South Australia. Australian Journal of Earth Sciences 50, 611-631.
FARQUHAR J. & WING B. A. 2003. Multiple sulfur isotopes and the evolution of the atmosphere. Earth and Planetary Science Letters 213, 1-13.
FLEMING R. H. & BEKKEN B. M. 1995. Isotope ratio and trace element imaging of pyrite grains in gold ores. International Journal of Mass Spectrometry and Ion Processes 143, 213-224.
FODEN J., ELBURG MARLINA A., JON D. P. & BURTT A. 2006. The Timing and Duration of the Delamerian Orogeny: Correlation with the Ross Orogen and Implications for Gondwana Assembly. The Journal of Geology 114, 189-210.
FOLK R. L. 2005. Nannobacteria and the formation of framboidal pyrite: Textural evidence. Journal of Earth System Science 114, 369-374.
GALLOWAY W. E. 1978. Uranium mineralization in a coastal-plain fluvial aquifer system; Catahoula Formation, Texas. Economic Geology 73, 1655-1676.
GARBISU C., ISHII T., LEIGHTON T. & BUCHANAN B. B. 1996. Bacterial reduction of selenite to elemental selenium. Chemical Geology 132, 199-204.
GOLDHABER M. B. & KAPLAN I. R. 1980. Mechanisms of sulfur incorporation and isotope fractionation during early diagenesis in sediments of the gulf of California. Marine Chemistry 9, 95-143.
GOLDSCHMIDT V. M. 1958. Geochemistry. The Clarendon Press, UK. GRANGER H. C. & WARREN C. G. 1969. Unstable sulfur compounds and the origin of roll-
type uranium deposits. Economic Geology 64, 160-171. GROSS E. B. 1956. Mineralogy and paragensis of the uranium ore, Mi Vida Mine, San Juan
County, Utah. Economic Geology 51, 632-648. HEATHGATE RESOURCES 2012. Heathgate Resources: The Beverley Mine
<http://www.heathgate.com.au/thebeverleymine.html>. (retrieved 02 September 2012).
HILL S. M. & HORE S. B. 2010. Overview of Regolith and Landscape Evolution of the Arkaroola Wilderness Sanctuary, northern Flinders Ranges, South Australia. First Australian Regolith Geoscientists Conference, Arkaroola, South Australia (unpubl.).
HILL S. M. & HORE S. B. 2011. Key insights into range-front mineral system expression and evolution from regolith and long-term landscape history, NE Flinders Ranges. MESA Journal 63, 20-31.
HOBDAY D. K. & GALLOWAY W. E. 1999. Groundwater processes and sedimentary uranium deposits. Hydrogeology Journal 7, 127-138.
HOEFS J. 2009. Stable Isotope Geochemistry (Sixth ed. edition). Springer-Verlag, Berlin, Heidelberg. .
HORE S. B. & HILL S. M. 2010. Overview of the Geological history of the Arkaroola Wilderness Sanctuary, northern Flinders Ranges, South Australia. First Australian Regolith Geoscientists Conference, Arkaroola, South Australia (unpubl.).
HOWARD J. H. 1977. Geochemistry of selenium: formation of ferroselite and selenium behavior in the vicinity of oxidizing sulfide and uranium deposits. Geochimica et Cosmochimica Acta 41, 1665-1678.
57
JAIRETH S., MCKAY A. & LAMBERT I. 2008. Association of large sandstone uranium deposits with hydrocarbons; The geology of uranium deposits in Kazakhstan points to similar deposits in Australia. AUSGEO News, 1-6.
JOHNSON T. M., HERBEL M. J., BULLEN T. D. & ZAWISLANSKI P. T. 1999. Selenium isotope ratios as indicators of selenium sources and oxyanion reduction. Geochimica et Cosmochimica Acta 63, 2775-2783.
JOHNSTON D. T. 2011. Multiple sulfur isotopes and the evolution of Earth's surface sulfur cycle. Earth-Science Reviews 106, 161-183.
KOHN M. J., RICIPUTI L. R., STAKES D. & ORANGE D. L. 1998. Sulfur isotope variability in biogenic pyrite; reflections of heterogeneous bacterial colonization? American Mineralogist 83, 1454-1468.
LAMBERT I., JAIRETH S., MCKAY A. & MIEZITIS Y. 2005. Australia’s uranium endowment: Metallogeny, exploration and potential
Mineral Deposit Research: Meeting the Global Challenge. In: Mao J. & Bierlein F. P. eds., pp 281-284, Springer Berlin Heidelberg. LANDAIS P. 1996. Organic geochemistry of sedimentary uranium ore deposits. Ore
Geology Reviews 11, 33-51. LOWERS H. A., BREIT G. N., FOSTER A. L., WHITNEY J., YOUNT J., UDDIN M. N. & MUNEEM A. A.
2007. Arsenic incorporation into authigenic pyrite, Bengal Basin sediment, Bangladesh. Geochimica et Cosmochimica Acta 71, 2699-2717.
MÄRTEN H., PHILLIPS R. & WOODS P. 2012. New Uranium ISR Satellites at Beverley North, South Australia
The New Uranium Mining Boom. In: Merkel B. & Schipek M. eds., pp 23-30, Springer Berlin Heidelberg. MCLAREN S., DUNLAP W. J., SANDIFORD M. & MCDOUGALL I. 2002. Thermochronology of high
heat-producing crust at Mount Painter, South Australia: Implications for tectonic reactivation of continental interiors. Tectonics 21.
MIN M., CHEN J., WANG J., WEI G. & FAYEK M. 2005a. Mineral paragenesis and textures associated with sandstone-hosted roll-front uranium deposits, NW China. Ore Geology Reviews 26, 51-69.
MIN M., XU H., CHEN J. & FAYEK M. 2005b. Evidence of uranium biomineralization in sandstone-hosted roll-front uranium deposits, northwestern China. Ore Geology Reviews 26, 198-206.
NEUMANN N., SANDIFORD M. & FODEN J. 2000. Regional geochemistry and continental heat flow: implications for the origin of the South Australian heat flow anomaly. Earth and Planetary Science Letters 183, 107-120.
OHMOTO H. & GOLDHABER M. B. 1997. Applications of sulfur and carbon isotopes in ore deposit research, in Barnes, H.L., ed., Geochemistry of hydrothermal ore deposits (third edition): New York, John Wiley & Sons. p. 517-611.
ONO S., WING B., JOHNSTON D., FARQUHAR J. & RUMBLE D. 2006. Mass-dependent fractionation of quadruple stable sulfur isotope system as a new tracer of sulfur biogeochemical cycles. Geochimica et Cosmochimica Acta 70, 2238-2252.
PIRLO M. C. & GIBLIN A. M. 2004. Application of groundwater–mineral equilibrium calculationsto geochemical exploration for sediment-hosted uranium:observations from the Frome Embayment,South Australia. Geochemistry: Exploration, Environment, Analysis 4, 113-127.
POHL W. L. 2011. Economic Geology: Principles and Practice. Wiley-Blackwell, West Sussex, UK.
58
RAISWELL R. 1982. Pyrite texture, isotopic composition and the availability of iron. American Journal of Science 82, 1244-1263.
REYNOLDS R. L. & GOLDHABER M. B. 1983. Iron disulfide minerals and the genesis of roll-type uranium deposits. Economic Geology 78, 105-120.
RIDLEY W. I. & LICHTE E. E. (Editors) 1998. Major, trace and ultratrace element analysis by laser ablstaion ICP-MS. (Reviews in Economic Geology, Vol. 7).
RYALL W. R. 1977. Anomalous trace elements in pyrite in the vicinity of mineralized zones at Woodlawn, N.S.W., Australia. Journal of Geochemical Exploration 8, 73-83.
SAVAGE K. S., TINGLE T. N., O'DAY P. A., WAYCHUNAS G. A. & BIRD D. K. 2000. Arsenic speciation in pyrite and secondary weathering phases, Mother Lode gold district, Tuolumne County, California. Applied Geochemistry 15, 1219-1244.
SAWLOWICZ Z. 1993. Pyrite framboids and their development: a new conceptual mechanism. Geologische Rundschau 82, 148-156.
SCHWARCZ H. P. & BURNIE S. W. 1973. Influence of sedimentary environments on sulfur isotope ratios in clastic rocks: a review. Mineralium Deposita 8, 264-277.
SCHWARTZ G. M. 1951. Classification and definitions of textures and mineral structures in ores. Economic Geology 46, 578-591.
SCOTT R. J., MEFFRE S., WOODHEAD J., GILBERT S. E., BERRY R. F. & EMSBO P. 2009. Development of Framboidal Pyrite During Diagenesis, Low-Grade Regional Metamorphism, and Hydrothermal Alteration. Economic Geology 104, 1143-1168.
SEAL R. R. 2006. Sulfur Isotope Geochemistry of Sulfide Minerals. Reviews in Mineralogy and Geochemistry 61, 633-677.
SIMON G., KESLER S. E. & ESSENE E. J. 1997. Phase relations among selenides, tellurides, and oxides; II, Applications to selenide-bearing ore deposits. Economic Geology 92, 468-484.
SKIRROW R. G. 2009. Uranium ore-forming systems of the Lake Frome region, South Australia: Regional spatial controls and exploration criteria. Australia G. 2009/040. Geoscience Australia.
STOIAN L. M. 2010. Palynology of Mesozoic and Cenozoic sediments of the Eromanga and Lake Eyre basins: results from recent drilling in the northwest Frome Embayment. MESA Journal 57, 27-35.
THODE H. G., MACNAMARA J. & FLEMING W. H. 1953. Sulphur isotope fractionation in nature and geological and biological time scales. Geochimica et Cosmochimica Acta 3, 235-243.
ULRICH T., LONG D. G. F., KAMBER B. S. & WHITEHOUSE M. J. 2011. In Situ Trace Element and Sulfur Isotope Analysis of Pyrite in a Paleoproterozoic Gold Placer Deposit, Pardo and Clement Townships, Ontario, Canada. Economic Geology 106, 667-686.
WALKER S. 1999. Beverley uranium project - in situ mining approved. MESA Journal 13, 8-10.
WARREN C. G. 1972. Sulfur Isotopes as a Clue to the Genetic Geochemistry of a Roll-Type Uranium Deposit. Economic Geology 67, 759-767.
WILKIN R. T. & BARNES H. L. 1997. Formation processes of framboidal pyrite. Geochimica et Cosmochimica Acta 61, 323-339.
WILKIN R. T., BARNES H. L. & BRANTLEY S. L. 1996. The size distribution of framboidal pyrite in modern sediments: An indicator of redox conditions. Geochimica et Cosmochimica Acta 60, 3897-3912.
59
WILSON S. A., RIDLEY W. I. & KOENIG A. E. 2002. Development of sulfide calibration standards for the laser ablation inductively-coupled plasma mass spectrometry technique. Journal of Analytical Atomic Spectrometry 17, 406-409.
WINDERBAUM L., CIOBANU C., COOK N., PAUL M., METCALFE A. & GILBERT S. 2012. Multivariate Analysis of an LA-ICP-MS Trace Element Dataset for Pyrite. Mathematical Geosciences 44, 823-842.
WÜLSER P.-A., BRUGGER J., FODEN J. & PFEIFER H.-R. 2011. The Sandstone-Hosted Beverley Uranium Deposit, Lake Frome Basin, South Australia: Mineralogy, Geochemistry, and a Time-Constrained Model for Its Genesis. Economic Geology 106, 835-867.
ZHU J.-M., JOHNSON T. M., FINKELMAN R. B., ZHENG B.-S., SÝKOROVÁ I. & PEŠEK J. 2012. The occurrence and origin of selenium minerals in Se-rich stone coals, spoils and their adjacent soils in Yutangba, China. Chemical Geology 330–331, 27-38.
ZHU J., ZUO W., LIANG X., LI S. & ZHENG B. 2004. Occurrence of native selenium in Yutangba and its environmental implications. Applied Geochemistry 19, 461-467.
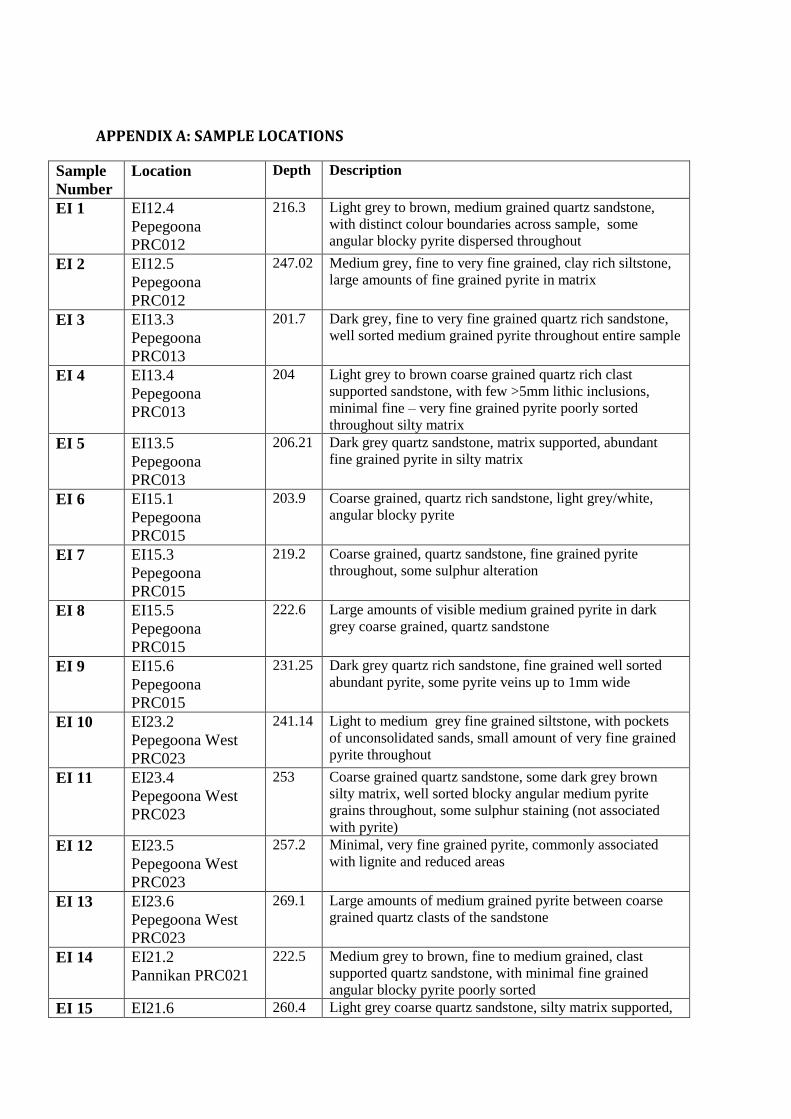
APPENDIX A: SAMPLE LOCATIONS
Sample
Number
Location Depth Description
EI 1 EI12.4
Pepegoona
PRC012
216.3 Light grey to brown, medium grained quartz sandstone,
with distinct colour boundaries across sample, some
angular blocky pyrite dispersed throughout
EI 2 EI12.5
Pepegoona
PRC012
247.02 Medium grey, fine to very fine grained, clay rich siltstone,
large amounts of fine grained pyrite in matrix
EI 3 EI13.3
Pepegoona
PRC013
201.7 Dark grey, fine to very fine grained quartz rich sandstone,
well sorted medium grained pyrite throughout entire sample
EI 4 EI13.4
Pepegoona
PRC013
204 Light grey to brown coarse grained quartz rich clast
supported sandstone, with few >5mm lithic inclusions,
minimal fine – very fine grained pyrite poorly sorted
throughout silty matrix
EI 5 EI13.5
Pepegoona
PRC013
206.21 Dark grey quartz sandstone, matrix supported, abundant
fine grained pyrite in silty matrix
EI 6 EI15.1
Pepegoona
PRC015
203.9 Coarse grained, quartz rich sandstone, light grey/white,
angular blocky pyrite
EI 7 EI15.3
Pepegoona
PRC015
219.2 Coarse grained, quartz sandstone, fine grained pyrite
throughout, some sulphur alteration
EI 8 EI15.5
Pepegoona
PRC015
222.6 Large amounts of visible medium grained pyrite in dark
grey coarse grained, quartz sandstone
EI 9 EI15.6
Pepegoona
PRC015
231.25 Dark grey quartz rich sandstone, fine grained well sorted
abundant pyrite, some pyrite veins up to 1mm wide
EI 10 EI23.2
Pepegoona West
PRC023
241.14 Light to medium grey fine grained siltstone, with pockets
of unconsolidated sands, small amount of very fine grained
pyrite throughout
EI 11 EI23.4
Pepegoona West
PRC023
253 Coarse grained quartz sandstone, some dark grey brown
silty matrix, well sorted blocky angular medium pyrite
grains throughout, some sulphur staining (not associated
with pyrite)
EI 12 EI23.5
Pepegoona West
PRC023
257.2 Minimal, very fine grained pyrite, commonly associated
with lignite and reduced areas
EI 13 EI23.6
Pepegoona West
PRC023
269.1 Large amounts of medium grained pyrite between coarse
grained quartz clasts of the sandstone
EI 14 EI21.2
Pannikan PRC021
222.5 Medium grey to brown, fine to medium grained, clast
supported quartz sandstone, with minimal fine grained
angular blocky pyrite poorly sorted
EI 15 EI21.6 260.4 Light grey coarse quartz sandstone, silty matrix supported,
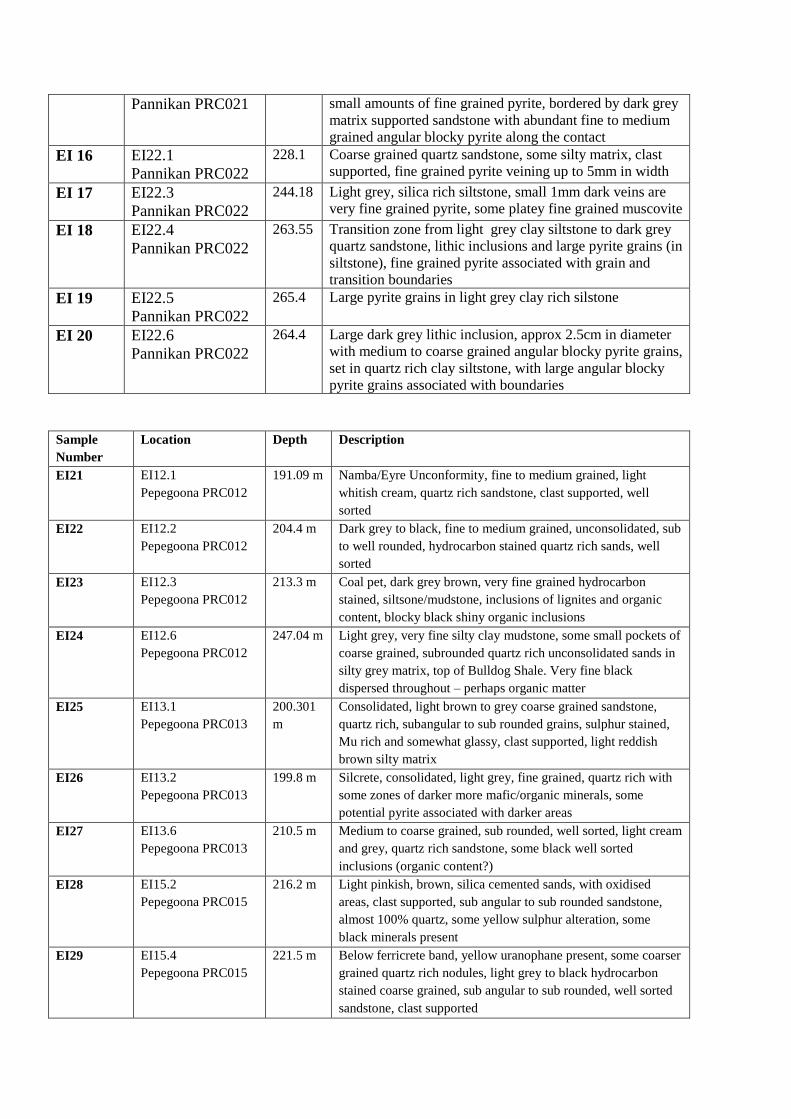
Pannikan PRC021 small amounts of fine grained pyrite, bordered by dark grey
matrix supported sandstone with abundant fine to medium
grained angular blocky pyrite along the contact
EI 16 EI22.1
Pannikan PRC022
228.1 Coarse grained quartz sandstone, some silty matrix, clast
supported, fine grained pyrite veining up to 5mm in width
EI 17 EI22.3
Pannikan PRC022
244.18 Light grey, silica rich siltstone, small 1mm dark veins are
very fine grained pyrite, some platey fine grained muscovite
EI 18 EI22.4
Pannikan PRC022
263.55 Transition zone from light grey clay siltstone to dark grey
quartz sandstone, lithic inclusions and large pyrite grains (in
siltstone), fine grained pyrite associated with grain and
transition boundaries
EI 19 EI22.5
Pannikan PRC022
265.4 Large pyrite grains in light grey clay rich silstone
EI 20 EI22.6
Pannikan PRC022
264.4 Large dark grey lithic inclusion, approx 2.5cm in diameter
with medium to coarse grained angular blocky pyrite grains,
set in quartz rich clay siltstone, with large angular blocky
pyrite grains associated with boundaries
Sample
Number
Location Depth Description
EI21 EI12.1
Pepegoona PRC012
191.09 m Namba/Eyre Unconformity, fine to medium grained, light
whitish cream, quartz rich sandstone, clast supported, well
sorted
EI22 EI12.2
Pepegoona PRC012
204.4 m Dark grey to black, fine to medium grained, unconsolidated, sub
to well rounded, hydrocarbon stained quartz rich sands, well
sorted
EI23 EI12.3
Pepegoona PRC012
213.3 m Coal pet, dark grey brown, very fine grained hydrocarbon
stained, siltsone/mudstone, inclusions of lignites and organic
content, blocky black shiny organic inclusions
EI24 EI12.6
Pepegoona PRC012
247.04 m Light grey, very fine silty clay mudstone, some small pockets of
coarse grained, subrounded quartz rich unconsolidated sands in
silty grey matrix, top of Bulldog Shale. Very fine black
dispersed throughout – perhaps organic matter
EI25 EI13.1
Pepegoona PRC013
200.301
m
Consolidated, light brown to grey coarse grained sandstone,
quartz rich, subangular to sub rounded grains, sulphur stained,
Mu rich and somewhat glassy, clast supported, light reddish
brown silty matrix
EI26 EI13.2
Pepegoona PRC013
199.8 m Silcrete, consolidated, light grey, fine grained, quartz rich with
some zones of darker more mafic/organic minerals, some
potential pyrite associated with darker areas
EI27 EI13.6
Pepegoona PRC013
210.5 m Medium to coarse grained, sub rounded, well sorted, light cream
and grey, quartz rich sandstone, some black well sorted
inclusions (organic content?)
EI28 EI15.2
Pepegoona PRC015
216.2 m Light pinkish, brown, silica cemented sands, with oxidised
areas, clast supported, sub angular to sub rounded sandstone,
almost 100% quartz, some yellow sulphur alteration, some
black minerals present
EI29 EI15.4
Pepegoona PRC015
221.5 m Below ferricrete band, yellow uranophane present, some coarser
grained quartz rich nodules, light grey to black hydrocarbon
stained coarse grained, sub angular to sub rounded, well sorted
sandstone, clast supported
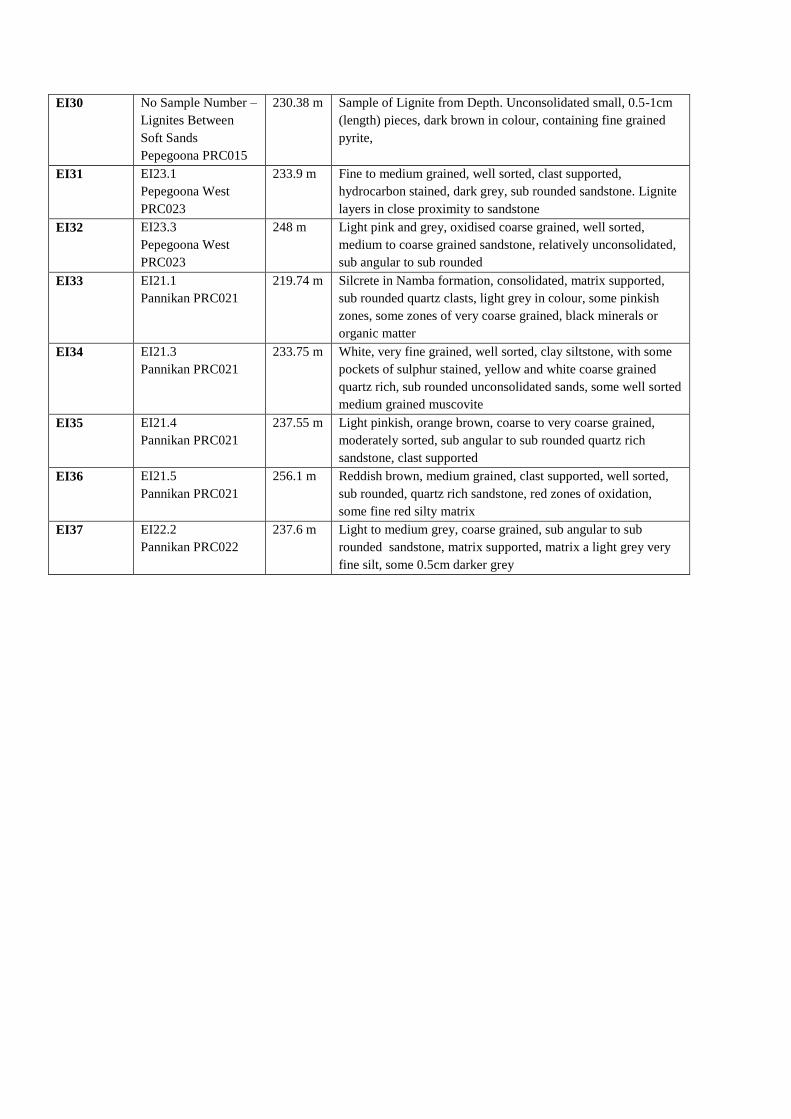
EI30 No Sample Number –
Lignites Between
Soft Sands
Pepegoona PRC015
230.38 m Sample of Lignite from Depth. Unconsolidated small, 0.5-1cm
(length) pieces, dark brown in colour, containing fine grained
pyrite,
EI31 EI23.1
Pepegoona West
PRC023
233.9 m Fine to medium grained, well sorted, clast supported,
hydrocarbon stained, dark grey, sub rounded sandstone. Lignite
layers in close proximity to sandstone
EI32 EI23.3
Pepegoona West
PRC023
248 m Light pink and grey, oxidised coarse grained, well sorted,
medium to coarse grained sandstone, relatively unconsolidated,
sub angular to sub rounded
EI33 EI21.1
Pannikan PRC021
219.74 m Silcrete in Namba formation, consolidated, matrix supported,
sub rounded quartz clasts, light grey in colour, some pinkish
zones, some zones of very coarse grained, black minerals or
organic matter
EI34 EI21.3
Pannikan PRC021
233.75 m White, very fine grained, well sorted, clay siltstone, with some
pockets of sulphur stained, yellow and white coarse grained
quartz rich, sub rounded unconsolidated sands, some well sorted
medium grained muscovite
EI35 EI21.4
Pannikan PRC021
237.55 m Light pinkish, orange brown, coarse to very coarse grained,
moderately sorted, sub angular to sub rounded quartz rich
sandstone, clast supported
EI36 EI21.5
Pannikan PRC021
256.1 m Reddish brown, medium grained, clast supported, well sorted,
sub rounded, quartz rich sandstone, red zones of oxidation,
some fine red silty matrix
EI37 EI22.2
Pannikan PRC022
237.6 m Light to medium grey, coarse grained, sub angular to sub
rounded sandstone, matrix supported, matrix a light grey very
fine silt, some 0.5cm darker grey
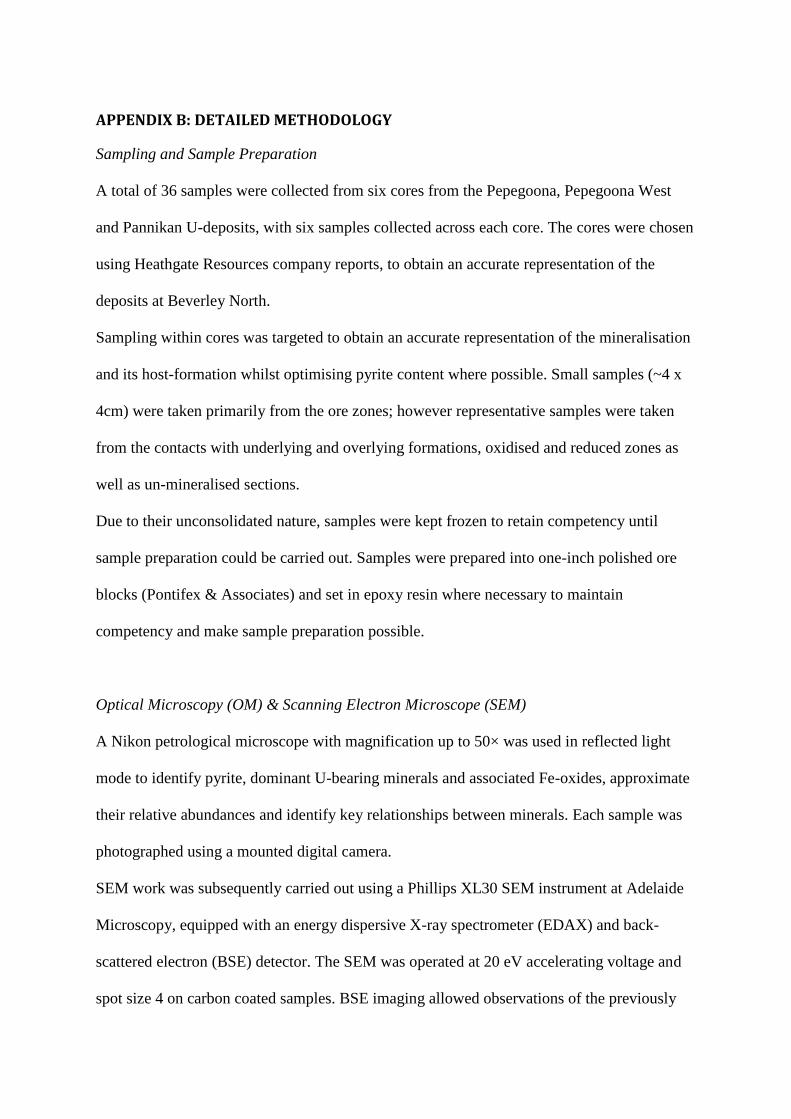
APPENDIX B: DETAILED METHODOLOGY
Sampling and Sample Preparation
A total of 36 samples were collected from six cores from the Pepegoona, Pepegoona West
and Pannikan U-deposits, with six samples collected across each core. The cores were chosen
using Heathgate Resources company reports, to obtain an accurate representation of the
deposits at Beverley North.
Sampling within cores was targeted to obtain an accurate representation of the mineralisation
and its host-formation whilst optimising pyrite content where possible. Small samples (~4 x
4cm) were taken primarily from the ore zones; however representative samples were taken
from the contacts with underlying and overlying formations, oxidised and reduced zones as
well as un-mineralised sections.
Due to their unconsolidated nature, samples were kept frozen to retain competency until
sample preparation could be carried out. Samples were prepared into one-inch polished ore
blocks (Pontifex & Associates) and set in epoxy resin where necessary to maintain
competency and make sample preparation possible.
Optical Microscopy (OM) & Scanning Electron Microscope (SEM)
A Nikon petrological microscope with magnification up to 50× was used in reflected light
mode to identify pyrite, dominant U-bearing minerals and associated Fe-oxides, approximate
their relative abundances and identify key relationships between minerals. Each sample was
photographed using a mounted digital camera.
SEM work was subsequently carried out using a Phillips XL30 SEM instrument at Adelaide
Microscopy, equipped with an energy dispersive X-ray spectrometer (EDAX) and back-
scattered electron (BSE) detector. The SEM was operated at 20 eV accelerating voltage and
spot size 4 on carbon coated samples. BSE imaging allowed observations of the previously
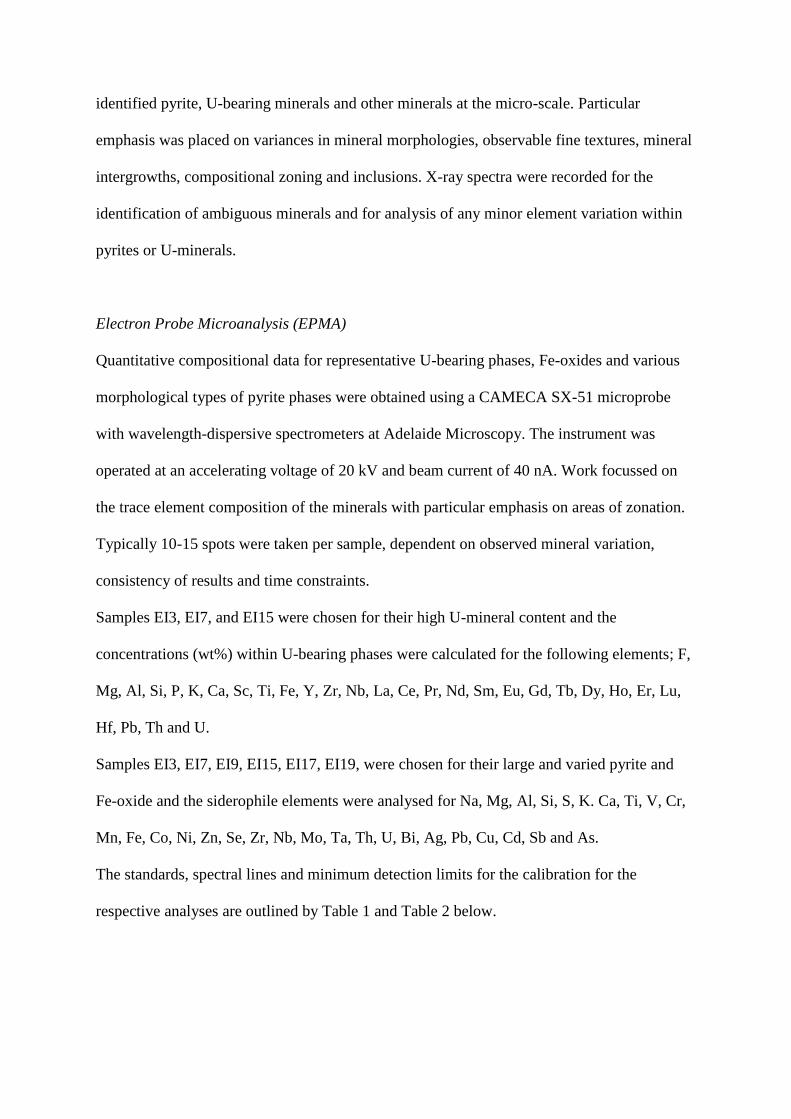
identified pyrite, U-bearing minerals and other minerals at the micro-scale. Particular
emphasis was placed on variances in mineral morphologies, observable fine textures, mineral
intergrowths, compositional zoning and inclusions. X-ray spectra were recorded for the
identification of ambiguous minerals and for analysis of any minor element variation within
pyrites or U-minerals.
Electron Probe Microanalysis (EPMA)
Quantitative compositional data for representative U-bearing phases, Fe-oxides and various
morphological types of pyrite phases were obtained using a CAMECA SX-51 microprobe
with wavelength-dispersive spectrometers at Adelaide Microscopy. The instrument was
operated at an accelerating voltage of 20 kV and beam current of 40 nA. Work focussed on
the trace element composition of the minerals with particular emphasis on areas of zonation.
Typically 10-15 spots were taken per sample, dependent on observed mineral variation,
consistency of results and time constraints.
Samples EI3, EI7, and EI15 were chosen for their high U-mineral content and the
concentrations (wt%) within U-bearing phases were calculated for the following elements; F,
Mg, Al, Si, P, K, Ca, Sc, Ti, Fe, Y, Zr, Nb, La, Ce, Pr, Nd, Sm, Eu, Gd, Tb, Dy, Ho, Er, Lu,
Hf, Pb, Th and U.
Samples EI3, EI7, EI9, EI15, EI17, EI19, were chosen for their large and varied pyrite and
Fe-oxide and the siderophile elements were analysed for Na, Mg, Al, Si, S, K. Ca, Ti, V, Cr,
Mn, Fe, Co, Ni, Zn, Se, Zr, Nb, Mo, Ta, Th, U, Bi, Ag, Pb, Cu, Cd, Sb and As.
The standards, spectral lines and minimum detection limits for the calibration for the
respective analyses are outlined by Table 1 and Table 2 below.
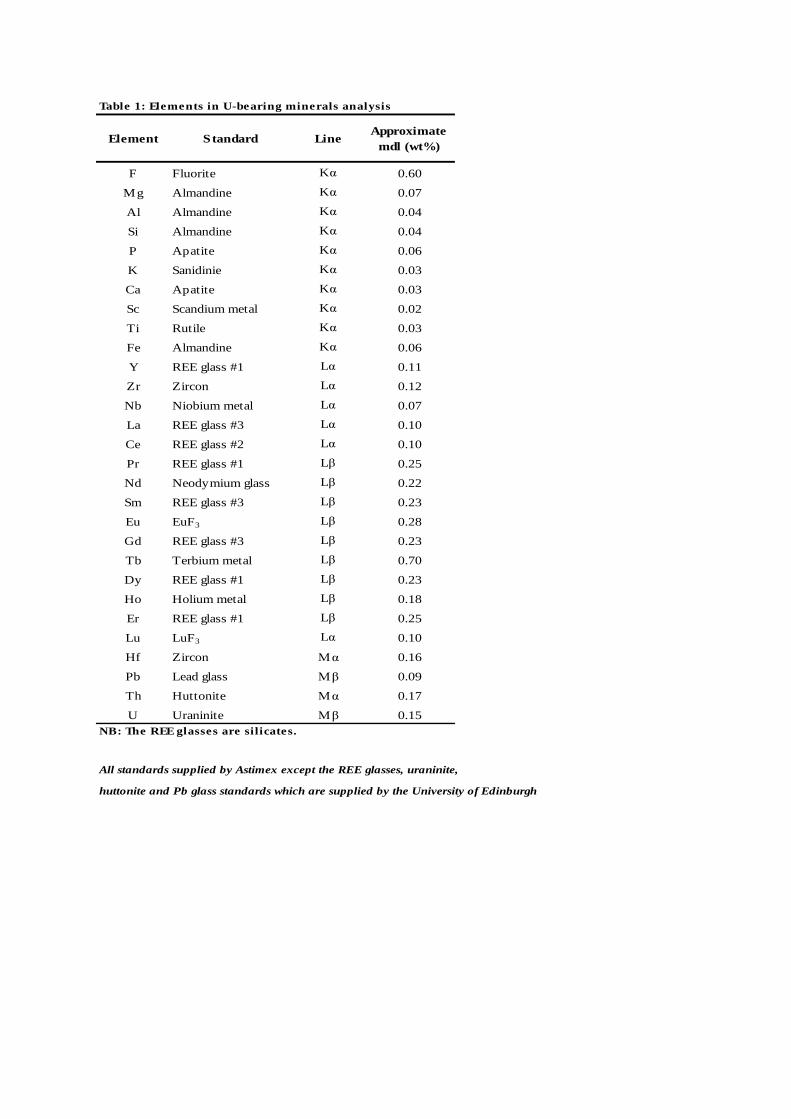
Table 1: Elements in U-bearing minerals analysis
Element Standard LineApproximate
mdl (wt%)
F Fluorite Kα 0.60
Mg Almandine Kα 0.07
Al Almandine Kα 0.04
Si Almandine Kα 0.04
P Apatite Kα 0.06
K Sanidinie Kα 0.03
Ca Apatite Kα 0.03
Sc Scandium metal Kα 0.02
Ti Rutile Kα 0.03
Fe Almandine Kα 0.06
Y REE glass #1 Lα 0.11
Zr Zircon Lα 0.12
Nb Niobium metal Lα 0.07
La REE glass #3 Lα 0.10
Ce REE glass #2 Lα 0.10
Pr REE glass #1 Lβ 0.25
Nd Neodymium glass Lβ 0.22
Sm REE glass #3 Lβ 0.23
Eu EuF3 Lβ 0.28
Gd REE glass #3 Lβ 0.23
Tb Terbium metal Lβ 0.70
Dy REE glass #1 Lβ 0.23
Ho Holium metal Lβ 0.18
Er REE glass #1 Lβ 0.25
Lu LuF3 Lα 0.10
Hf Zircon Mα 0.16
Pb Lead glass Mβ 0.09
Th Huttonite Mα 0.17
U Uraninite Mβ 0.15
All standards supplied by Astimex except the REE glasses, uraninite,
huttonite and Pb glass standards which are supplied by the University of Edinburgh
NB: The REE glasses are silicates.
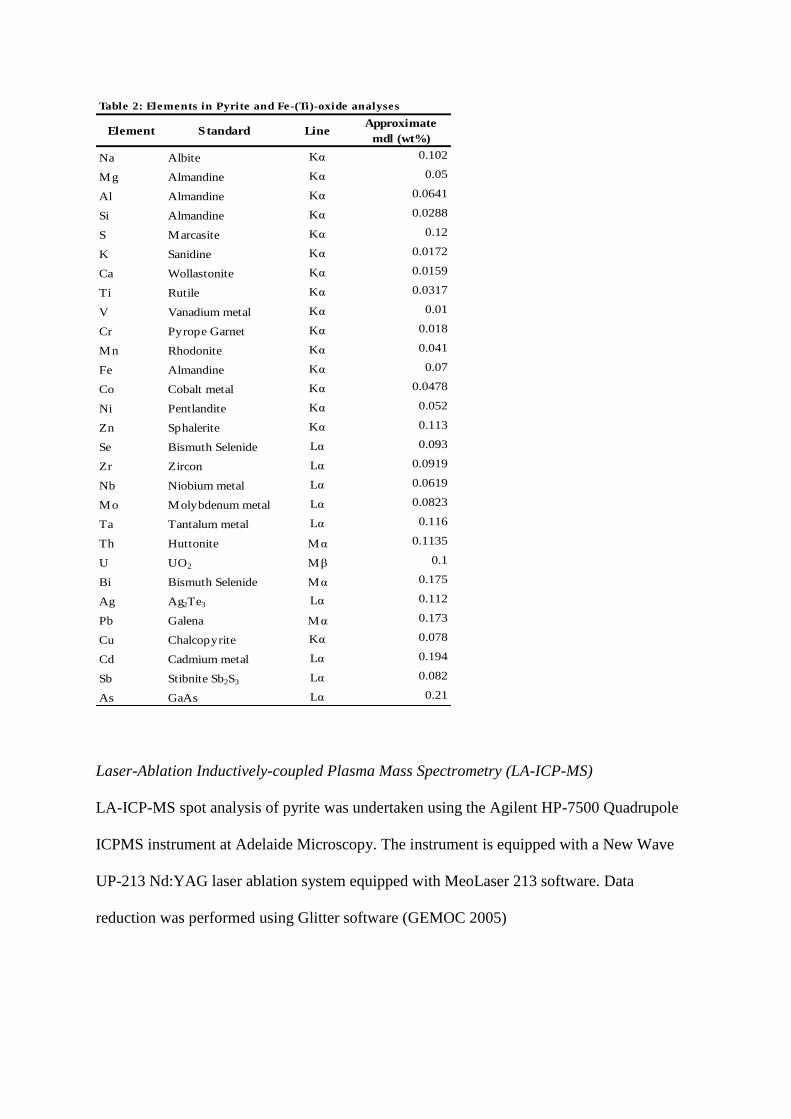
Table 2: Elements in Pyrite and Fe-(Ti)-oxide analyses
Element Standard LineApproximate
mdl (wt%)
Na Albite Kα 0.102
Mg Almandine Kα 0.05
Al Almandine Kα 0.0641
Si Almandine Kα 0.0288
S Marcasite Kα 0.12
K Sanidine Kα 0.0172
Ca Wollastonite Kα 0.0159
Ti Rutile Kα 0.0317
V Vanadium metal Kα 0.01
Cr Pyrope Garnet Kα 0.018
Mn Rhodonite Kα 0.041
Fe Almandine Kα 0.07
Co Cobalt metal Kα 0.0478
Ni Pentlandite Kα 0.052
Zn Sphalerite Kα 0.113
Se Bismuth Selenide Lα 0.093
Zr Zircon Lα 0.0919
Nb Niobium metal Lα 0.0619
Mo Molybdenum metal Lα 0.0823
Ta Tantalum metal Lα 0.116
Th Huttonite Mα 0.1135
U UO2 Mβ 0.1
Bi Bismuth Selenide Mα 0.175
Ag Ag2Te3 Lα 0.112
Pb Galena Mα 0.173
Cu Chalcopyrite Kα 0.078
Cd Cadmium metal Lα 0.194
Sb Stibnite Sb2S3 Lα 0.082
As GaAs Lα 0.21
Laser-Ablation Inductively-coupled Plasma Mass Spectrometry (LA-ICP-MS)
LA-ICP-MS spot analysis of pyrite was undertaken using the Agilent HP-7500 Quadrupole
ICPMS instrument at Adelaide Microscopy. The instrument is equipped with a New Wave
UP-213 Nd:YAG laser ablation system equipped with MeoLaser 213 software. Data
reduction was performed using Glitter software (GEMOC 2005)
Polished samples with suitable grains of pyrite were ablated. Sample eligibility was
determined by SEM and petrographical analysis, aiming to determine the presence of
inclusions and other textures such as fractures or intergrowths that might affect the quality of
the trace element data. Despite the attempt to determine the suitability of pyrite grains prior to
LA-ICP-MS, the micron-scale inclusions invisible on the SEM may still have been present
and thus data must be interpreted with this in mind, as discussed by Cook et al. (2011).
A total of 194 spots (on pyrite grains) were ablated, with the aim of collecting information
from all morphologies and phases of pyrite. Spot analyses were made with a spot size
diameter of 40 μm. The laser system was operated at pulse rates of 5 Hz, and 75% power
level; laser energy was typically 6-9 J/cm-2, giving an ablation rate of approximately 1.5
μm/sec. Suitable pyrite grains were analysed for the following isotopes: 23
Na, 29
Si, 33
S,34
S,
43Ca,
51V,
52Cr,
55Mn,
57Fe,
60Ni,
65Cu,
66Zn,
69Ga,
75As,
82Se,
95Mo,
107Ag,
111Cd,
115In,
118Sn,
121Sb,
125Te,
137Ba,
184W,
193Ir,
197Au,
202Hg,
205Tl,
208Pb,
209Bi. The method used, labelled RH-
Chall, undertook a total analysis time for each sample of 90 seconds (30 second measurement
of background with the laser off, and a 60 second analysis with the laser on).
Calibration was performed using the Mass-1 trace element standard created by the National
Institute of Standards, Gainsburg US (Wilson et al. 2002). The raw analytical data for each
spot analysis is plotted as a line graph and the integration times for background and sample
signal selected. The counts are then corrected for instrument drift (standards were run after
each 5 unknown samples). Data reduction was undertaken using Glitter software (GEMOC
2005) and used Iron as the internal standard for pyrite. Data was converted to concentration
values (ppm) using the known Fe values.
LA-ICP-MS Element Mapping
LA-ICP-MS mapping of approximately 0.5 cm2 areas of pyrite was conducted using a
Resonetics M-50-LR 193-nm Excimer laser microprobe coupled to an Agilent 7700cx
Quadrupole ICP-MS housed at Adelaide Microscopy, University of Adelaide. This new-
generation laser system permits high spatial resolution matched by sensitivity of low (sub-
ppm) element concentrations. Imaging was performed by ablating sets of parallel line rasters
across the sample using a 5µm beams size, line spacing of 5 µm and 5 µm/s scan speed at a
laser frequency of 10 Hz and 0.003 dwell time for all elements. Redeposition during mapping
was minimised by pre-ablating each line prior to data collection. Identical rasters were done
on standard MASS-1, at the start and end of each mapping run to correct for instrumental
drift.
Images were compiled and processed using the program Iolite (e.g. Woodhead et al., 2007)
developed by the Melbourne Isotope Group at Melbourne University (Paton et al. 2011).
Iolite is an open source software package for processing ICP-MS data, and is an add-in for
the data analysis program Igor developed by WaveMetrics.
Sulphur Isotope Analysis (SIMS)
The CAMECA IMS 1280 high resolution, multi-collector ion microprobe (CAMECA 2012),
located at the Centre for Microscopy, Characterisation & Analysis (CMCA) at The
University of Western Australia, was used to perform in-situ sulphur isotope analysis
(34
S/33
S) of pyrites from the polished block samples.
Representative samples were chosen from petrographical, SEM and LA-ICP-MS trace
element analysis. Samples were chosen to be representative of all deposits, different horizons
and differing morphological pyrite types.
Samples were prepared by cutting small (< 5 mm2) portions of the polished ore blocks and
mounting them in epoxy resin with Son Std. Three to four samples were used in each mount
and the pyrite grain mounts were Au-coated (~50 nm) before analysis was carried out.
The grains of Son standard which were cast in the centre of each sample mount were
measured five times initially to account for instrument drift, and then in at least two spots
before and after every ~8-10 sample analyses. The standard deviations of the Son standard
analyses are equal to + 0.13 %.
The method used had a total running time of three minutes and 15 seconds, with the
acquisition time being two minutes and 53 seconds. A spot size was 10 µm and impact
energy of 20,000 V was used, resulting in an average sample emission of ~0.73 µA.
Raw measured 34
S/32
S and 33
S/32
S ratios were converted to the delta notation of 34
S and 33
S
respectively by normalising to Vienna Cañon Diablo Troilite values;
(34
S/32
S)VCDT = 0.044163 and 33
S/32
SVCDT = 0.00015368 (Ding et al. 2001, Kita et al. 2011).
Drift correction was applied to collected data in Microsoft excel where regression was
significant.
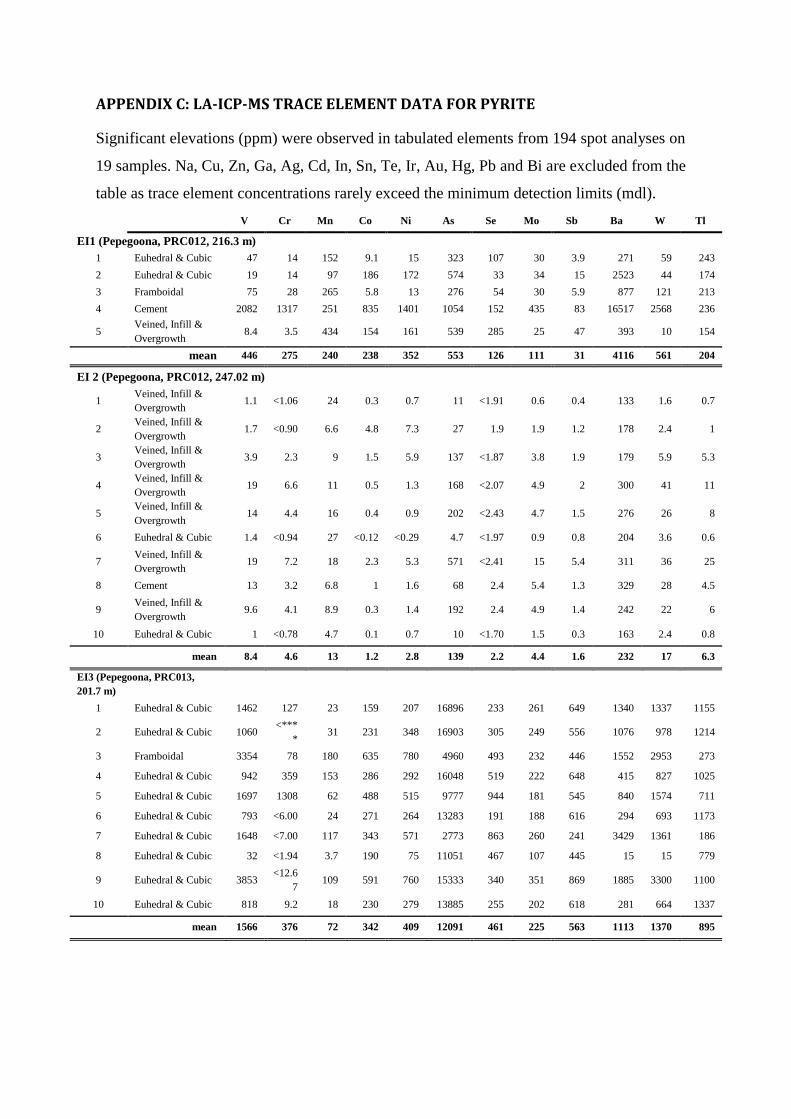
APPENDIX C: LA-ICP-MS TRACE ELEMENT DATA FOR PYRITE
Significant elevations (ppm) were observed in tabulated elements from 194 spot analyses on
19 samples. Na, Cu, Zn, Ga, Ag, Cd, In, Sn, Te, Ir, Au, Hg, Pb and Bi are excluded from the
table as trace element concentrations rarely exceed the minimum detection limits (mdl).
V Cr Mn Co Ni As Se Mo Sb Ba W Tl
EI1 (Pepegoona, PRC012, 216.3 m)
1 Euhedral & Cubic 47 14 152 9.1 15 323 107 30 3.9 271 59 243
2 Euhedral & Cubic 19 14 97 186 172 574 33 34 15 2523 44 174
3 Framboidal 75 28 265 5.8 13 276 54 30 5.9 877 121 213
4 Cement 2082 1317 251 835 1401 1054 152 435 83 16517 2568 236
5 Veined, Infill &
Overgrowth 8.4 3.5 434 154 161 539 285 25 47 393 10 154
mean 446 275 240 238 352 553 126 111 31 4116 561 204
EI 2 (Pepegoona, PRC012, 247.02 m)
1 Veined, Infill &
Overgrowth 1.1 <1.06 24 0.3 0.7 11 <1.91 0.6 0.4 133 1.6 0.7
2 Veined, Infill &
Overgrowth 1.7 <0.90 6.6 4.8 7.3 27 1.9 1.9 1.2 178 2.4 1
3 Veined, Infill &
Overgrowth 3.9 2.3 9 1.5 5.9 137 <1.87 3.8 1.9 179 5.9 5.3
4 Veined, Infill &
Overgrowth 19 6.6 11 0.5 1.3 168 <2.07 4.9 2 300 41 11
5 Veined, Infill &
Overgrowth 14 4.4 16 0.4 0.9 202 <2.43 4.7 1.5 276 26 8
6 Euhedral & Cubic 1.4 <0.94 27 <0.12 <0.29 4.7 <1.97 0.9 0.8 204 3.6 0.6
7 Veined, Infill &
Overgrowth 19 7.2 18 2.3 5.3 571 <2.41 15 5.4 311 36 25
8 Cement 13 3.2 6.8 1 1.6 68 2.4 5.4 1.3 329 28 4.5
9 Veined, Infill &
Overgrowth 9.6 4.1 8.9 0.3 1.4 192 2.4 4.9 1.4 242 22 6
10 Euhedral & Cubic 1 <0.78 4.7 0.1 0.7 10 <1.70 1.5 0.3 163 2.4 0.8
mean 8.4 4.6 13 1.2 2.8 139 2.2 4.4 1.6 232 17 6.3
EI3 (Pepegoona, PRC013,
201.7 m)
1 Euhedral & Cubic 1462 127 23 159 207 16896 233 261 649 1340 1337 1155
2 Euhedral & Cubic 1060 <***
* 31 231 348 16903 305 249 556 1076 978 1214
3 Framboidal 3354 78 180 635 780 4960 493 232 446 1552 2953 273
4 Euhedral & Cubic 942 359 153 286 292 16048 519 222 648 415 827 1025
5 Euhedral & Cubic 1697 1308 62 488 515 9777 944 181 545 840 1574 711
6 Euhedral & Cubic 793 <6.00 24 271 264 13283 191 188 616 294 693 1173
7 Euhedral & Cubic 1648 <7.00 117 343 571 2773 863 260 241 3429 1361 186
8 Euhedral & Cubic 32 <1.94 3.7 190 75 11051 467 107 445 15 15 779
9 Euhedral & Cubic 3853 <12.6
7 109 591 760 15333 340 351 869 1885 3300 1100
10 Euhedral & Cubic 818 9.2 18 230 279 13885 255 202 618 281 664 1337
mean 1566 376 72 342 409 12091 461 225 563 1113 1370 895
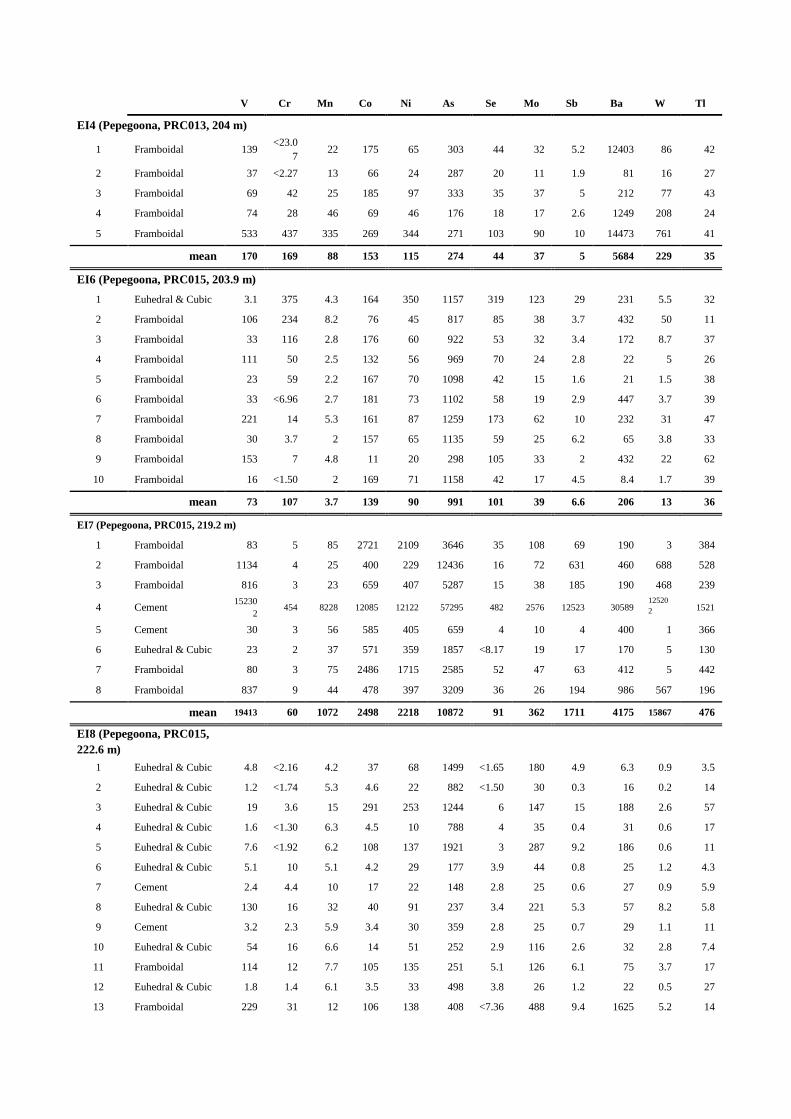
V Cr Mn Co Ni As Se Mo Sb Ba W Tl
EI4 (Pepegoona, PRC013, 204 m)
1 Framboidal 139 <23.0
7 22 175 65 303 44 32 5.2 12403 86 42
2 Framboidal 37 <2.27 13 66 24 287 20 11 1.9 81 16 27
3 Framboidal 69 42 25 185 97 333 35 37 5 212 77 43
4 Framboidal 74 28 46 69 46 176 18 17 2.6 1249 208 24
5 Framboidal 533 437 335 269 344 271 103 90 10 14473 761 41
mean 170 169 88 153 115 274 44 37 5 5684 229 35
EI6 (Pepegoona, PRC015, 203.9 m)
1 Euhedral & Cubic 3.1 375 4.3 164 350 1157 319 123 29 231 5.5 32
2 Framboidal 106 234 8.2 76 45 817 85 38 3.7 432 50 11
3 Framboidal 33 116 2.8 176 60 922 53 32 3.4 172 8.7 37
4 Framboidal 111 50 2.5 132 56 969 70 24 2.8 22 5 26
5 Framboidal 23 59 2.2 167 70 1098 42 15 1.6 21 1.5 38
6 Framboidal 33 <6.96 2.7 181 73 1102 58 19 2.9 447 3.7 39
7 Framboidal 221 14 5.3 161 87 1259 173 62 10 232 31 47
8 Framboidal 30 3.7 2 157 65 1135 59 25 6.2 65 3.8 33
9 Framboidal 153 7 4.8 11 20 298 105 33 2 432 22 62
10 Framboidal 16 <1.50 2 169 71 1158 42 17 4.5 8.4 1.7 39
mean 73 107 3.7 139 90 991 101 39 6.6 206 13 36
EI7 (Pepegoona, PRC015, 219.2 m)
1 Framboidal 83 5 85 2721 2109 3646 35 108 69 190 3 384
2 Framboidal 1134 4 25 400 229 12436 16 72 631 460 688 528
3 Framboidal 816 3 23 659 407 5287 15 38 185 190 468 239
4 Cement 15230
2 454 8228 12085 12122 57295 482 2576 12523 30589
12520
2 1521
5 Cement 30 3 56 585 405 659 4 10 4 400 1 366
6 Euhedral & Cubic 23 2 37 571 359 1857 <8.17 19 17 170 5 130
7 Framboidal 80 3 75 2486 1715 2585 52 47 63 412 5 442
8 Framboidal 837 9 44 478 397 3209 36 26 194 986 567 196
mean 19413 60 1072 2498 2218 10872 91 362 1711 4175 15867 476
EI8 (Pepegoona, PRC015,
222.6 m)
1 Euhedral & Cubic 4.8 <2.16 4.2 37 68 1499 <1.65 180 4.9 6.3 0.9 3.5
2 Euhedral & Cubic 1.2 <1.74 5.3 4.6 22 882 <1.50 30 0.3 16 0.2 14
3 Euhedral & Cubic 19 3.6 15 291 253 1244 6 147 15 188 2.6 57
4 Euhedral & Cubic 1.6 <1.30 6.3 4.5 10 788 4 35 0.4 31 0.6 17
5 Euhedral & Cubic 7.6 <1.92 6.2 108 137 1921 3 287 9.2 186 0.6 11
6 Euhedral & Cubic 5.1 10 5.1 4.2 29 177 3.9 44 0.8 25 1.2 4.3
7 Cement 2.4 4.4 10 17 22 148 2.8 25 0.6 27 0.9 5.9
8 Euhedral & Cubic 130 16 32 40 91 237 3.4 221 5.3 57 8.2 5.8
9 Cement 3.2 2.3 5.9 3.4 30 359 2.8 25 0.7 29 1.1 11
10 Euhedral & Cubic 54 16 6.6 14 51 252 2.9 116 2.6 32 2.8 7.4
11 Framboidal 114 12 7.7 105 135 251 5.1 126 6.1 75 3.7 17
12 Euhedral & Cubic 1.8 1.4 6.1 3.5 33 498 3.8 26 1.2 22 0.5 27
13 Framboidal 229 31 12 106 138 408 <7.36 488 9.4 1625 5.2 14
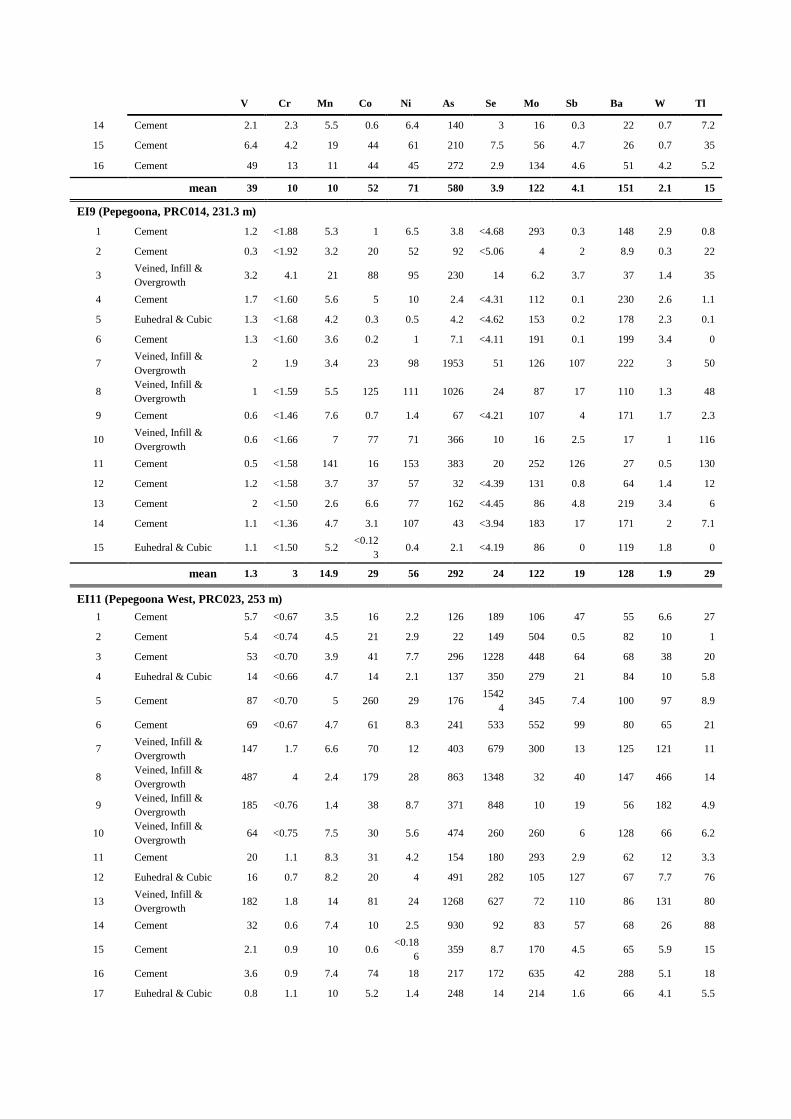
V Cr Mn Co Ni As Se Mo Sb Ba W Tl
14 Cement 2.1 2.3 5.5 0.6 6.4 140 3 16 0.3 22 0.7 7.2
15 Cement 6.4 4.2 19 44 61 210 7.5 56 4.7 26 0.7 35
16 Cement 49 13 11 44 45 272 2.9 134 4.6 51 4.2 5.2
mean 39 10 10 52 71 580 3.9 122 4.1 151 2.1 15
EI9 (Pepegoona, PRC014, 231.3 m)
1 Cement 1.2 <1.88 5.3 1 6.5 3.8 <4.68 293 0.3 148 2.9 0.8
2 Cement 0.3 <1.92 3.2 20 52 92 <5.06 4 2 8.9 0.3 22
3 Veined, Infill &
Overgrowth 3.2 4.1 21 88 95 230 14 6.2 3.7 37 1.4 35
4 Cement 1.7 <1.60 5.6 5 10 2.4 <4.31 112 0.1 230 2.6 1.1
5 Euhedral & Cubic 1.3 <1.68 4.2 0.3 0.5 4.2 <4.62 153 0.2 178 2.3 0.1
6 Cement 1.3 <1.60 3.6 0.2 1 7.1 <4.11 191 0.1 199 3.4 0
7 Veined, Infill &
Overgrowth 2 1.9 3.4 23 98 1953 51 126 107 222 3 50
8 Veined, Infill &
Overgrowth 1 <1.59 5.5 125 111 1026 24 87 17 110 1.3 48
9 Cement 0.6 <1.46 7.6 0.7 1.4 67 <4.21 107 4 171 1.7 2.3
10 Veined, Infill &
Overgrowth 0.6 <1.66 7 77 71 366 10 16 2.5 17 1 116
11 Cement 0.5 <1.58 141 16 153 383 20 252 126 27 0.5 130
12 Cement 1.2 <1.58 3.7 37 57 32 <4.39 131 0.8 64 1.4 12
13 Cement 2 <1.50 2.6 6.6 77 162 <4.45 86 4.8 219 3.4 6
14 Cement 1.1 <1.36 4.7 3.1 107 43 <3.94 183 17 171 2 7.1
15 Euhedral & Cubic 1.1 <1.50 5.2 <0.12
3 0.4 2.1 <4.19 86 0 119 1.8 0
mean 1.3 3 14.9 29 56 292 24 122 19 128 1.9 29
EI11 (Pepegoona West, PRC023, 253 m)
1 Cement 5.7 <0.67 3.5 16 2.2 126 189 106 47 55 6.6 27
2 Cement 5.4 <0.74 4.5 21 2.9 22 149 504 0.5 82 10 1
3 Cement 53 <0.70 3.9 41 7.7 296 1228 448 64 68 38 20
4 Euhedral & Cubic 14 <0.66 4.7 14 2.1 137 350 279 21 84 10 5.8
5 Cement 87 <0.70 5 260 29 176 1542
4 345 7.4 100 97 8.9
6 Cement 69 <0.67 4.7 61 8.3 241 533 552 99 80 65 21
7 Veined, Infill &
Overgrowth 147 1.7 6.6 70 12 403 679 300 13 125 121 11
8 Veined, Infill &
Overgrowth 487 4 2.4 179 28 863 1348 32 40 147 466 14
9 Veined, Infill &
Overgrowth 185 <0.76 1.4 38 8.7 371 848 10 19 56 182 4.9
10 Veined, Infill &
Overgrowth 64 <0.75 7.5 30 5.6 474 260 260 6 128 66 6.2
11 Cement 20 1.1 8.3 31 4.2 154 180 293 2.9 62 12 3.3
12 Euhedral & Cubic 16 0.7 8.2 20 4 491 282 105 127 67 7.7 76
13 Veined, Infill &
Overgrowth 182 1.8 14 81 24 1268 627 72 110 86 131 80
14 Cement 32 0.6 7.4 10 2.5 930 92 83 57 68 26 88
15 Cement 2.1 0.9 10 0.6 <0.18
6 359 8.7 170 4.5 65 5.9 15
16 Cement 3.6 0.9 7.4 74 18 217 172 635 42 288 5.1 18
17 Euhedral & Cubic 0.8 1.1 10 5.2 1.4 248 14 214 1.6 66 4.1 5.5
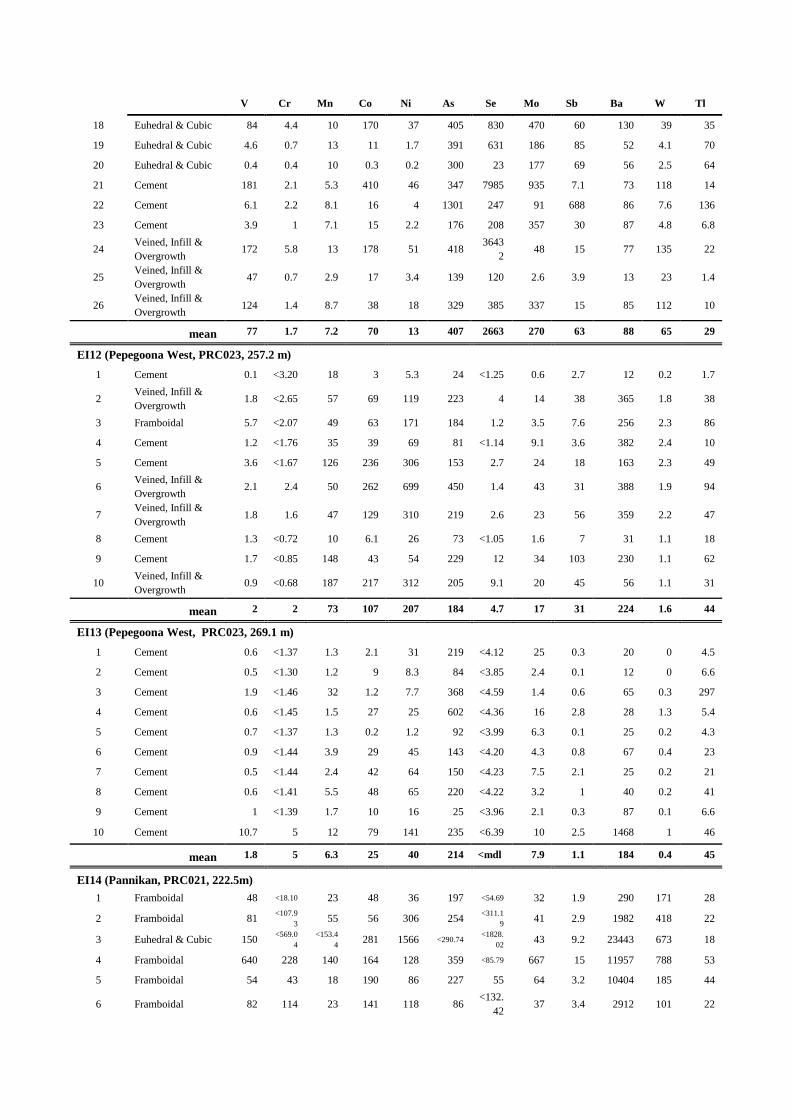
V Cr Mn Co Ni As Se Mo Sb Ba W Tl
18 Euhedral & Cubic 84 4.4 10 170 37 405 830 470 60 130 39 35
19 Euhedral & Cubic 4.6 0.7 13 11 1.7 391 631 186 85 52 4.1 70
20 Euhedral & Cubic 0.4 0.4 10 0.3 0.2 300 23 177 69 56 2.5 64
21 Cement 181 2.1 5.3 410 46 347 7985 935 7.1 73 118 14
22 Cement 6.1 2.2 8.1 16 4 1301 247 91 688 86 7.6 136
23 Cement 3.9 1 7.1 15 2.2 176 208 357 30 87 4.8 6.8
24 Veined, Infill &
Overgrowth 172 5.8 13 178 51 418
3643
2 48 15 77 135 22
25 Veined, Infill &
Overgrowth 47 0.7 2.9 17 3.4 139 120 2.6 3.9 13 23 1.4
26 Veined, Infill &
Overgrowth 124 1.4 8.7 38 18 329 385 337 15 85 112 10
mean 77 1.7 7.2 70 13 407 2663 270 63 88 65 29
EI12 (Pepegoona West, PRC023, 257.2 m)
1 Cement 0.1 <3.20 18 3 5.3 24 <1.25 0.6 2.7 12 0.2 1.7
2 Veined, Infill &
Overgrowth 1.8 <2.65 57 69 119 223 4 14 38 365 1.8 38
3 Framboidal 5.7 <2.07 49 63 171 184 1.2 3.5 7.6 256 2.3 86
4 Cement 1.2 <1.76 35 39 69 81 <1.14 9.1 3.6 382 2.4 10
5 Cement 3.6 <1.67 126 236 306 153 2.7 24 18 163 2.3 49
6 Veined, Infill &
Overgrowth 2.1 2.4 50 262 699 450 1.4 43 31 388 1.9 94
7 Veined, Infill &
Overgrowth 1.8 1.6 47 129 310 219 2.6 23 56 359 2.2 47
8 Cement 1.3 <0.72 10 6.1 26 73 <1.05 1.6 7 31 1.1 18
9 Cement 1.7 <0.85 148 43 54 229 12 34 103 230 1.1 62
10 Veined, Infill &
Overgrowth 0.9 <0.68 187 217 312 205 9.1 20 45 56 1.1 31
mean 2 2 73 107 207 184 4.7 17 31 224 1.6 44
EI13 (Pepegoona West, PRC023, 269.1 m)
1 Cement 0.6 <1.37 1.3 2.1 31 219 <4.12 25 0.3 20 0 4.5
2 Cement 0.5 <1.30 1.2 9 8.3 84 <3.85 2.4 0.1 12 0 6.6
3 Cement 1.9 <1.46 32 1.2 7.7 368 <4.59 1.4 0.6 65 0.3 297
4 Cement 0.6 <1.45 1.5 27 25 602 <4.36 16 2.8 28 1.3 5.4
5 Cement 0.7 <1.37 1.3 0.2 1.2 92 <3.99 6.3 0.1 25 0.2 4.3
6 Cement 0.9 <1.44 3.9 29 45 143 <4.20 4.3 0.8 67 0.4 23
7 Cement 0.5 <1.44 2.4 42 64 150 <4.23 7.5 2.1 25 0.2 21
8 Cement 0.6 <1.41 5.5 48 65 220 <4.22 3.2 1 40 0.2 41
9 Cement 1 <1.39 1.7 10 16 25 <3.96 2.1 0.3 87 0.1 6.6
10 Cement 10.7 5 12 79 141 235 <6.39 10 2.5 1468 1 46
mean 1.8 5 6.3 25 40 214 <mdl 7.9 1.1 184 0.4 45
EI14 (Pannikan, PRC021, 222.5m)
1 Framboidal 48 <18.10 23 48 36 197 <54.69 32 1.9 290 171 28
2 Framboidal 81 <107.9
3 55 56 306 254
<311.1
9 41 2.9 1982 418 22
3 Euhedral & Cubic 150 <569.0
4
<153.4
4 281 1566 <290.74 <1828.
02 43 9.2 23443 673 18
4 Framboidal 640 228 140 164 128 359 <85.79 667 15 11957 788 53
5 Framboidal 54 43 18 190 86 227 55 64 3.2 10404 185 44
6 Framboidal 82 114 23 141 118 86 <132.
42 37 3.4 2912 101 22
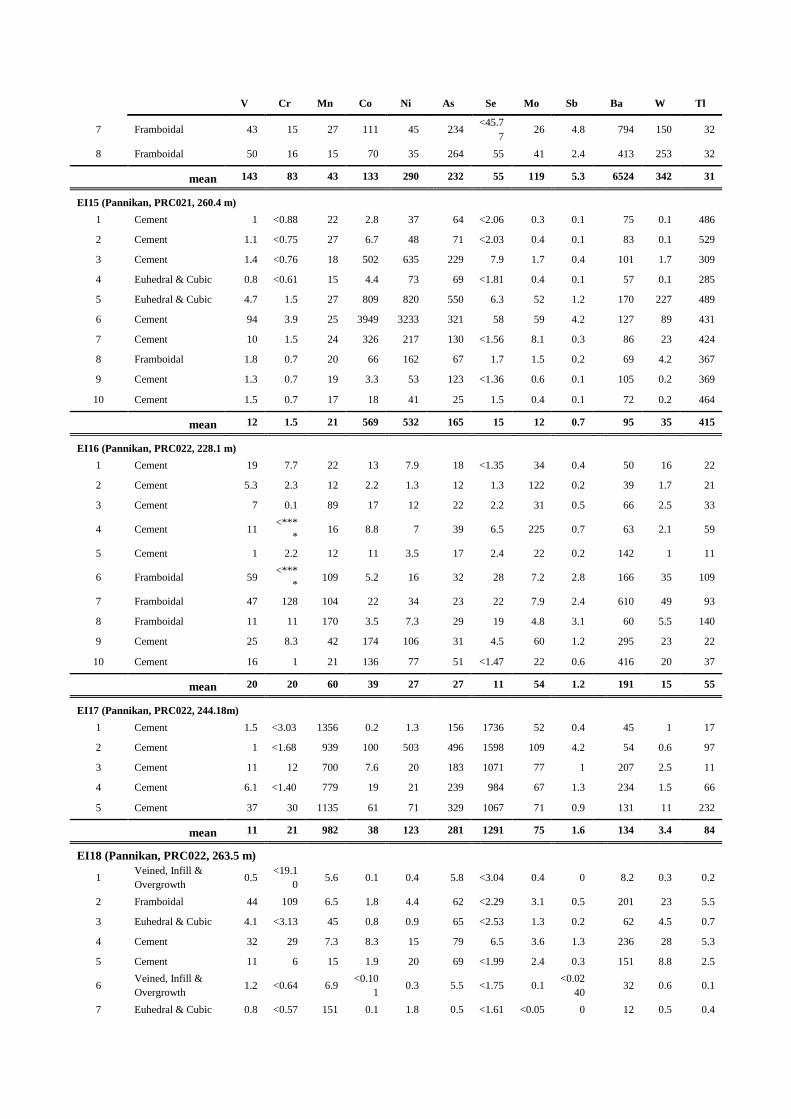
V Cr Mn Co Ni As Se Mo Sb Ba W Tl
7 Framboidal 43 15 27 111 45 234 <45.7
7 26 4.8 794 150 32
8 Framboidal 50 16 15 70 35 264 55 41 2.4 413 253 32
mean 143 83 43 133 290 232 55 119 5.3 6524 342 31
EI15 (Pannikan, PRC021, 260.4 m)
1 Cement 1 <0.88 22 2.8 37 64 <2.06 0.3 0.1 75 0.1 486
2 Cement 1.1 <0.75 27 6.7 48 71 <2.03 0.4 0.1 83 0.1 529
3 Cement 1.4 <0.76 18 502 635 229 7.9 1.7 0.4 101 1.7 309
4 Euhedral & Cubic 0.8 <0.61 15 4.4 73 69 <1.81 0.4 0.1 57 0.1 285
5 Euhedral & Cubic 4.7 1.5 27 809 820 550 6.3 52 1.2 170 227 489
6 Cement 94 3.9 25 3949 3233 321 58 59 4.2 127 89 431
7 Cement 10 1.5 24 326 217 130 <1.56 8.1 0.3 86 23 424
8 Framboidal 1.8 0.7 20 66 162 67 1.7 1.5 0.2 69 4.2 367
9 Cement 1.3 0.7 19 3.3 53 123 <1.36 0.6 0.1 105 0.2 369
10 Cement 1.5 0.7 17 18 41 25 1.5 0.4 0.1 72 0.2 464
mean 12 1.5 21 569 532 165 15 12 0.7 95 35 415
EI16 (Pannikan, PRC022, 228.1 m)
1 Cement 19 7.7 22 13 7.9 18 <1.35 34 0.4 50 16 22
2 Cement 5.3 2.3 12 2.2 1.3 12 1.3 122 0.2 39 1.7 21
3 Cement 7 0.1 89 17 12 22 2.2 31 0.5 66 2.5 33
4 Cement 11 <***
* 16 8.8 7 39 6.5 225 0.7 63 2.1 59
5 Cement 1 2.2 12 11 3.5 17 2.4 22 0.2 142 1 11
6 Framboidal 59 <***
* 109 5.2 16 32 28 7.2 2.8 166 35 109
7 Framboidal 47 128 104 22 34 23 22 7.9 2.4 610 49 93
8 Framboidal 11 11 170 3.5 7.3 29 19 4.8 3.1 60 5.5 140
9 Cement 25 8.3 42 174 106 31 4.5 60 1.2 295 23 22
10 Cement 16 1 21 136 77 51 <1.47 22 0.6 416 20 37
mean 20 20 60 39 27 27 11 54 1.2 191 15 55
EI17 (Pannikan, PRC022, 244.18m)
1 Cement 1.5 <3.03 1356 0.2 1.3 156 1736 52 0.4 45 1 17
2 Cement 1 <1.68 939 100 503 496 1598 109 4.2 54 0.6 97
3 Cement 11 12 700 7.6 20 183 1071 77 1 207 2.5 11
4 Cement 6.1 <1.40 779 19 21 239 984 67 1.3 234 1.5 66
5 Cement 37 30 1135 61 71 329 1067 71 0.9 131 11 232
mean 11 21 982 38 123 281 1291 75 1.6 134 3.4 84
EI18 (Pannikan, PRC022, 263.5 m)
1 Veined, Infill &
Overgrowth 0.5
<19.1
0 5.6 0.1 0.4 5.8 <3.04 0.4 0 8.2 0.3 0.2
2 Framboidal 44 109 6.5 1.8 4.4 62 <2.29 3.1 0.5 201 23 5.5
3 Euhedral & Cubic 4.1 <3.13 45 0.8 0.9 65 <2.53 1.3 0.2 62 4.5 0.7
4 Cement 32 29 7.3 8.3 15 79 6.5 3.6 1.3 236 28 5.3
5 Cement 11 6 15 1.9 20 69 <1.99 2.4 0.3 151 8.8 2.5
6 Veined, Infill &
Overgrowth 1.2 <0.64 6.9
<0.10
1 0.3 5.5 <1.75 0.1
<0.02
40 32 0.6 0.1
7 Euhedral & Cubic 0.8 <0.57 151 0.1 1.8 0.5 <1.61 <0.05 0 12 0.5 0.4
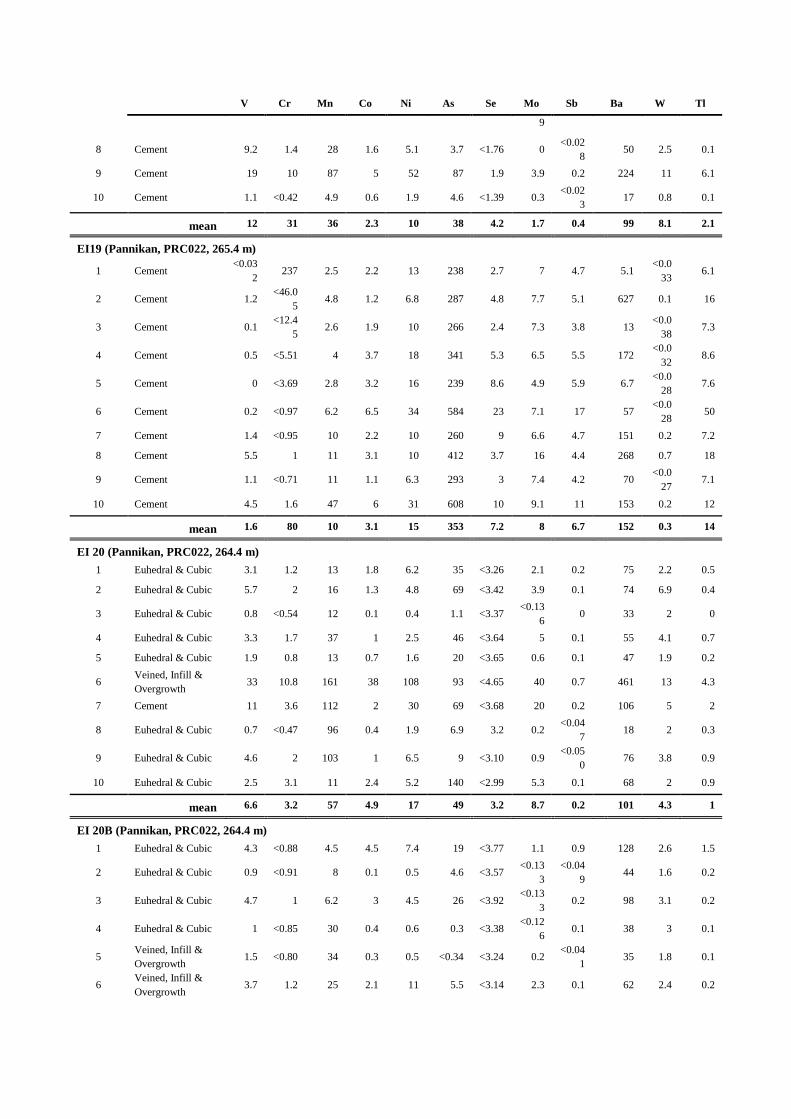
V Cr Mn Co Ni As Se Mo Sb Ba W Tl
9
8 Cement 9.2 1.4 28 1.6 5.1 3.7 <1.76 0 <0.02
8 50 2.5 0.1
9 Cement 19 10 87 5 52 87 1.9 3.9 0.2 224 11 6.1
10 Cement 1.1 <0.42 4.9 0.6 1.9 4.6 <1.39 0.3 <0.02
3 17 0.8 0.1
mean 12 31 36 2.3 10 38 4.2 1.7 0.4 99 8.1 2.1
EI19 (Pannikan, PRC022, 265.4 m)
1 Cement <0.03
2 237 2.5 2.2 13 238 2.7 7 4.7 5.1
<0.0
33 6.1
2 Cement 1.2 <46.0
5 4.8 1.2 6.8 287 4.8 7.7 5.1 627 0.1 16
3 Cement 0.1 <12.4
5 2.6 1.9 10 266 2.4 7.3 3.8 13
<0.0
38 7.3
4 Cement 0.5 <5.51 4 3.7 18 341 5.3 6.5 5.5 172 <0.0
32 8.6
5 Cement 0 <3.69 2.8 3.2 16 239 8.6 4.9 5.9 6.7 <0.0
28 7.6
6 Cement 0.2 <0.97 6.2 6.5 34 584 23 7.1 17 57 <0.0
28 50
7 Cement 1.4 <0.95 10 2.2 10 260 9 6.6 4.7 151 0.2 7.2
8 Cement 5.5 1 11 3.1 10 412 3.7 16 4.4 268 0.7 18
9 Cement 1.1 <0.71 11 1.1 6.3 293 3 7.4 4.2 70 <0.0
27 7.1
10 Cement 4.5 1.6 47 6 31 608 10 9.1 11 153 0.2 12
mean 1.6 80 10 3.1 15 353 7.2 8 6.7 152 0.3 14
EI 20 (Pannikan, PRC022, 264.4 m)
1 Euhedral & Cubic 3.1 1.2 13 1.8 6.2 35 <3.26 2.1 0.2 75 2.2 0.5
2 Euhedral & Cubic 5.7 2 16 1.3 4.8 69 <3.42 3.9 0.1 74 6.9 0.4
3 Euhedral & Cubic 0.8 <0.54 12 0.1 0.4 1.1 <3.37 <0.13
6 0 33 2 0
4 Euhedral & Cubic 3.3 1.7 37 1 2.5 46 <3.64 5 0.1 55 4.1 0.7
5 Euhedral & Cubic 1.9 0.8 13 0.7 1.6 20 <3.65 0.6 0.1 47 1.9 0.2
6 Veined, Infill &
Overgrowth 33 10.8 161 38 108 93 <4.65 40 0.7 461 13 4.3
7 Cement 11 3.6 112 2 30 69 <3.68 20 0.2 106 5 2
8 Euhedral & Cubic 0.7 <0.47 96 0.4 1.9 6.9 3.2 0.2 <0.04
7 18 2 0.3
9 Euhedral & Cubic 4.6 2 103 1 6.5 9 <3.10 0.9 <0.05
0 76 3.8 0.9
10 Euhedral & Cubic 2.5 3.1 11 2.4 5.2 140 <2.99 5.3 0.1 68 2 0.9
mean 6.6 3.2 57 4.9 17 49 3.2 8.7 0.2 101 4.3 1
EI 20B (Pannikan, PRC022, 264.4 m)
1 Euhedral & Cubic 4.3 <0.88 4.5 4.5 7.4 19 <3.77 1.1 0.9 128 2.6 1.5
2 Euhedral & Cubic 0.9 <0.91 8 0.1 0.5 4.6 <3.57 <0.13
3
<0.04
9 44 1.6 0.2
3 Euhedral & Cubic 4.7 1 6.2 3 4.5 26 <3.92 <0.13
3 0.2 98 3.1 0.2
4 Euhedral & Cubic 1 <0.85 30 0.4 0.6 0.3 <3.38 <0.12
6 0.1 38 3 0.1
5 Veined, Infill &
Overgrowth 1.5 <0.80 34 0.3 0.5 <0.34 <3.24 0.2
<0.04
1 35 1.8 0.1
6 Veined, Infill &
Overgrowth 3.7 1.2 25 2.1 11 5.5 <3.14 2.3 0.1 62 2.4 0.2

V Cr Mn Co Ni As Se Mo Sb Ba W Tl
mean 2.7 1.1 18 1.7 4 11 1.2 0.3 68 2.4 0.4
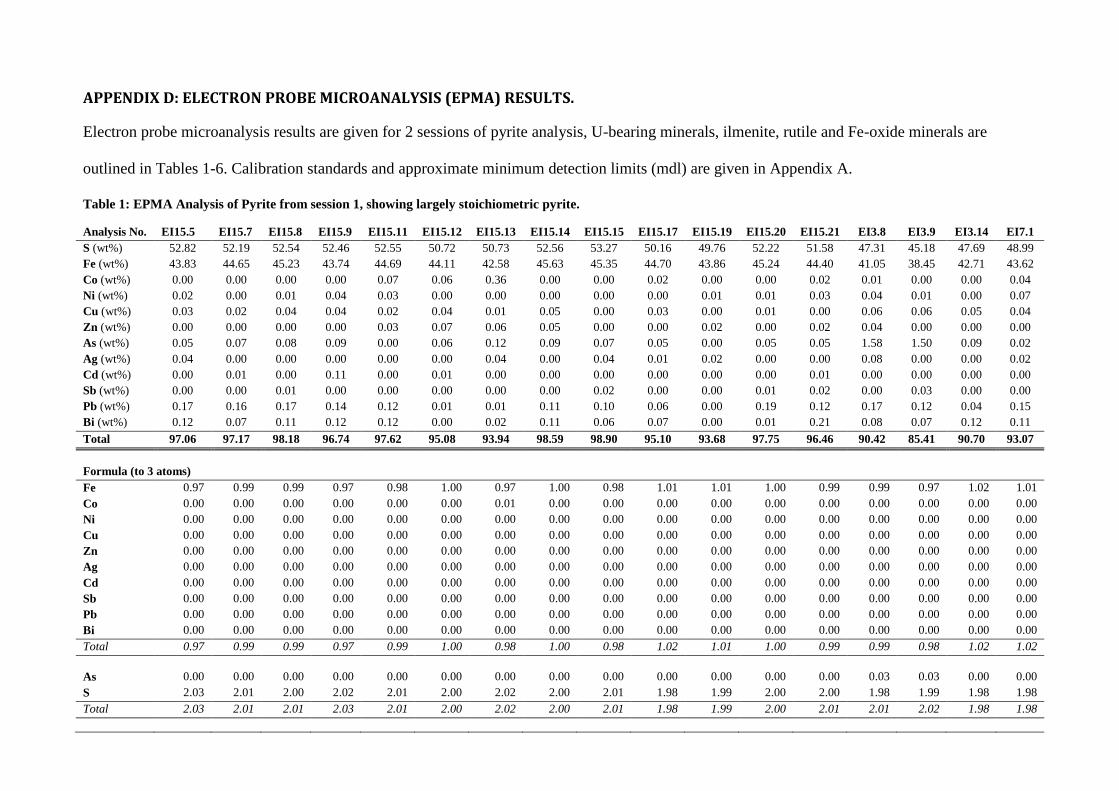
APPENDIX D: ELECTRON PROBE MICROANALYSIS (EPMA) RESULTS.
Electron probe microanalysis results are given for 2 sessions of pyrite analysis, U-bearing minerals, ilmenite, rutile and Fe-oxide minerals are
outlined in Tables 1-6. Calibration standards and approximate minimum detection limits (mdl) are given in Appendix A.
Table 1: EPMA Analysis of Pyrite from session 1, showing largely stoichiometric pyrite.
Analysis No. EI15.5 EI15.7 EI15.8 EI15.9 EI15.11 EI15.12 EI15.13 EI15.14 EI15.15 EI15.17 EI15.19 EI15.20 EI15.21 EI3.8 EI3.9 EI3.14 EI7.1
S (wt%) 52.82 52.19 52.54 52.46 52.55 50.72 50.73 52.56 53.27 50.16 49.76 52.22 51.58 47.31 45.18 47.69 48.99
Fe (wt%) 43.83 44.65 45.23 43.74 44.69 44.11 42.58 45.63 45.35 44.70 43.86 45.24 44.40 41.05 38.45 42.71 43.62
Co (wt%) 0.00 0.00 0.00 0.00 0.07 0.06 0.36 0.00 0.00 0.02 0.00 0.00 0.02 0.01 0.00 0.00 0.04
Ni (wt%) 0.02 0.00 0.01 0.04 0.03 0.00 0.00 0.00 0.00 0.00 0.01 0.01 0.03 0.04 0.01 0.00 0.07
Cu (wt%) 0.03 0.02 0.04 0.04 0.02 0.04 0.01 0.05 0.00 0.03 0.00 0.01 0.00 0.06 0.06 0.05 0.04
Zn (wt%) 0.00 0.00 0.00 0.00 0.03 0.07 0.06 0.05 0.00 0.00 0.02 0.00 0.02 0.04 0.00 0.00 0.00
As (wt%) 0.05 0.07 0.08 0.09 0.00 0.06 0.12 0.09 0.07 0.05 0.00 0.05 0.05 1.58 1.50 0.09 0.02
Ag (wt%) 0.04 0.00 0.00 0.00 0.00 0.00 0.04 0.00 0.04 0.01 0.02 0.00 0.00 0.08 0.00 0.00 0.02
Cd (wt%) 0.00 0.01 0.00 0.11 0.00 0.01 0.00 0.00 0.00 0.00 0.00 0.00 0.01 0.00 0.00 0.00 0.00
Sb (wt%) 0.00 0.00 0.01 0.00 0.00 0.00 0.00 0.00 0.02 0.00 0.00 0.01 0.02 0.00 0.03 0.00 0.00
Pb (wt%) 0.17 0.16 0.17 0.14 0.12 0.01 0.01 0.11 0.10 0.06 0.00 0.19 0.12 0.17 0.12 0.04 0.15
Bi (wt%) 0.12 0.07 0.11 0.12 0.12 0.00 0.02 0.11 0.06 0.07 0.00 0.01 0.21 0.08 0.07 0.12 0.11
Total 97.06 97.17 98.18 96.74 97.62 95.08 93.94 98.59 98.90 95.10 93.68 97.75 96.46 90.42 85.41 90.70 93.07
Formula (to 3 atoms)
Fe 0.97 0.99 0.99 0.97 0.98 1.00 0.97 1.00 0.98 1.01 1.01 1.00 0.99 0.99 0.97 1.02 1.01
Co 0.00 0.00 0.00 0.00 0.00 0.00 0.01 0.00 0.00 0.00 0.00 0.00 0.00 0.00 0.00 0.00 0.00
Ni 0.00 0.00 0.00 0.00 0.00 0.00 0.00 0.00 0.00 0.00 0.00 0.00 0.00 0.00 0.00 0.00 0.00
Cu 0.00 0.00 0.00 0.00 0.00 0.00 0.00 0.00 0.00 0.00 0.00 0.00 0.00 0.00 0.00 0.00 0.00
Zn 0.00 0.00 0.00 0.00 0.00 0.00 0.00 0.00 0.00 0.00 0.00 0.00 0.00 0.00 0.00 0.00 0.00
Ag 0.00 0.00 0.00 0.00 0.00 0.00 0.00 0.00 0.00 0.00 0.00 0.00 0.00 0.00 0.00 0.00 0.00
Cd 0.00 0.00 0.00 0.00 0.00 0.00 0.00 0.00 0.00 0.00 0.00 0.00 0.00 0.00 0.00 0.00 0.00
Sb 0.00 0.00 0.00 0.00 0.00 0.00 0.00 0.00 0.00 0.00 0.00 0.00 0.00 0.00 0.00 0.00 0.00
Pb 0.00 0.00 0.00 0.00 0.00 0.00 0.00 0.00 0.00 0.00 0.00 0.00 0.00 0.00 0.00 0.00 0.00
Bi 0.00 0.00 0.00 0.00 0.00 0.00 0.00 0.00 0.00 0.00 0.00 0.00 0.00 0.00 0.00 0.00 0.00
Total 0.97 0.99 0.99 0.97 0.99 1.00 0.98 1.00 0.98 1.02 1.01 1.00 0.99 0.99 0.98 1.02 1.02
As 0.00 0.00 0.00 0.00 0.00 0.00 0.00 0.00 0.00 0.00 0.00 0.00 0.00 0.03 0.03 0.00 0.00
S 2.03 2.01 2.00 2.02 2.01 2.00 2.02 2.00 2.01 1.98 1.99 2.00 2.00 1.98 1.99 1.98 1.98
Total 2.03 2.01 2.01 2.03 2.01 2.00 2.02 2.00 2.01 1.98 1.99 2.00 2.01 2.01 2.02 1.98 1.98
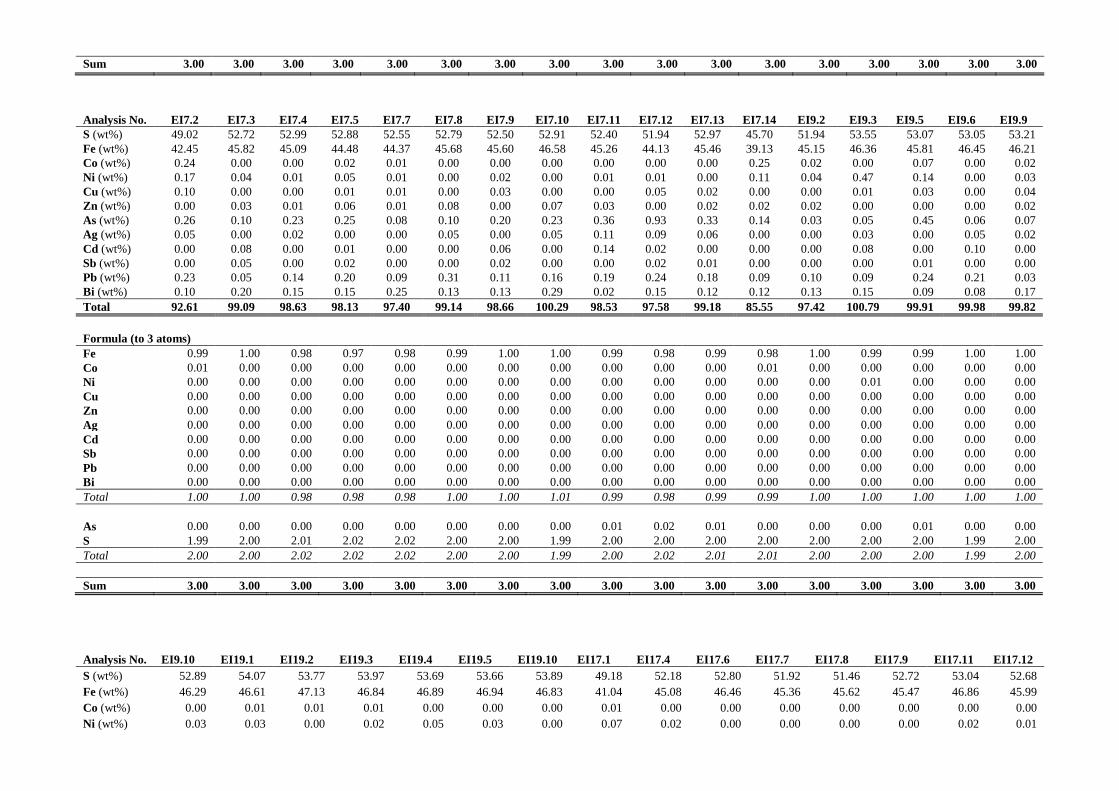
Sum 3.00 3.00 3.00 3.00 3.00 3.00 3.00 3.00 3.00 3.00 3.00 3.00 3.00 3.00 3.00 3.00 3.00
Analysis No. EI7.2 EI7.3 EI7.4 EI7.5 EI7.7 EI7.8 EI7.9 EI7.10 EI7.11 EI7.12 EI7.13 EI7.14 EI9.2 EI9.3 EI9.5 EI9.6 EI9.9
S (wt%) 49.02 52.72 52.99 52.88 52.55 52.79 52.50 52.91 52.40 51.94 52.97 45.70 51.94 53.55 53.07 53.05 53.21
Fe (wt%) 42.45 45.82 45.09 44.48 44.37 45.68 45.60 46.58 45.26 44.13 45.46 39.13 45.15 46.36 45.81 46.45 46.21
Co (wt%) 0.24 0.00 0.00 0.02 0.01 0.00 0.00 0.00 0.00 0.00 0.00 0.25 0.02 0.00 0.07 0.00 0.02
Ni (wt%) 0.17 0.04 0.01 0.05 0.01 0.00 0.02 0.00 0.01 0.01 0.00 0.11 0.04 0.47 0.14 0.00 0.03
Cu (wt%) 0.10 0.00 0.00 0.01 0.01 0.00 0.03 0.00 0.00 0.05 0.02 0.00 0.00 0.01 0.03 0.00 0.04
Zn (wt%) 0.00 0.03 0.01 0.06 0.01 0.08 0.00 0.07 0.03 0.00 0.02 0.02 0.02 0.00 0.00 0.00 0.02
As (wt%) 0.26 0.10 0.23 0.25 0.08 0.10 0.20 0.23 0.36 0.93 0.33 0.14 0.03 0.05 0.45 0.06 0.07
Ag (wt%) 0.05 0.00 0.02 0.00 0.00 0.05 0.00 0.05 0.11 0.09 0.06 0.00 0.00 0.03 0.00 0.05 0.02
Cd (wt%) 0.00 0.08 0.00 0.01 0.00 0.00 0.06 0.00 0.14 0.02 0.00 0.00 0.00 0.08 0.00 0.10 0.00
Sb (wt%) 0.00 0.05 0.00 0.02 0.00 0.00 0.02 0.00 0.00 0.02 0.01 0.00 0.00 0.00 0.01 0.00 0.00
Pb (wt%) 0.23 0.05 0.14 0.20 0.09 0.31 0.11 0.16 0.19 0.24 0.18 0.09 0.10 0.09 0.24 0.21 0.03
Bi (wt%) 0.10 0.20 0.15 0.15 0.25 0.13 0.13 0.29 0.02 0.15 0.12 0.12 0.13 0.15 0.09 0.08 0.17
Total 92.61 99.09 98.63 98.13 97.40 99.14 98.66 100.29 98.53 97.58 99.18 85.55 97.42 100.79 99.91 99.98 99.82
Formula (to 3 atoms)
Fe 0.99 1.00 0.98 0.97 0.98 0.99 1.00 1.00 0.99 0.98 0.99 0.98 1.00 0.99 0.99 1.00 1.00
Co 0.01 0.00 0.00 0.00 0.00 0.00 0.00 0.00 0.00 0.00 0.00 0.01 0.00 0.00 0.00 0.00 0.00
Ni 0.00 0.00 0.00 0.00 0.00 0.00 0.00 0.00 0.00 0.00 0.00 0.00 0.00 0.01 0.00 0.00 0.00
Cu 0.00 0.00 0.00 0.00 0.00 0.00 0.00 0.00 0.00 0.00 0.00 0.00 0.00 0.00 0.00 0.00 0.00
Zn 0.00 0.00 0.00 0.00 0.00 0.00 0.00 0.00 0.00 0.00 0.00 0.00 0.00 0.00 0.00 0.00 0.00
Ag 0.00 0.00 0.00 0.00 0.00 0.00 0.00 0.00 0.00 0.00 0.00 0.00 0.00 0.00 0.00 0.00 0.00
Cd 0.00 0.00 0.00 0.00 0.00 0.00 0.00 0.00 0.00 0.00 0.00 0.00 0.00 0.00 0.00 0.00 0.00
Sb 0.00 0.00 0.00 0.00 0.00 0.00 0.00 0.00 0.00 0.00 0.00 0.00 0.00 0.00 0.00 0.00 0.00
Pb 0.00 0.00 0.00 0.00 0.00 0.00 0.00 0.00 0.00 0.00 0.00 0.00 0.00 0.00 0.00 0.00 0.00
Bi 0.00 0.00 0.00 0.00 0.00 0.00 0.00 0.00 0.00 0.00 0.00 0.00 0.00 0.00 0.00 0.00 0.00
Total 1.00 1.00 0.98 0.98 0.98 1.00 1.00 1.01 0.99 0.98 0.99 0.99 1.00 1.00 1.00 1.00 1.00
As 0.00 0.00 0.00 0.00 0.00 0.00 0.00 0.00 0.01 0.02 0.01 0.00 0.00 0.00 0.01 0.00 0.00
S 1.99 2.00 2.01 2.02 2.02 2.00 2.00 1.99 2.00 2.00 2.00 2.00 2.00 2.00 2.00 1.99 2.00
Total 2.00 2.00 2.02 2.02 2.02 2.00 2.00 1.99 2.00 2.02 2.01 2.01 2.00 2.00 2.00 1.99 2.00
Sum 3.00 3.00 3.00 3.00 3.00 3.00 3.00 3.00 3.00 3.00 3.00 3.00 3.00 3.00 3.00 3.00 3.00
Analysis No. EI9.10 EI19.1 EI19.2 EI19.3 EI19.4 EI19.5 EI19.10 EI17.1 EI17.4 EI17.6 EI17.7 EI17.8 EI17.9 EI17.11 EI17.12
S (wt%) 52.89 54.07 53.77 53.97 53.69 53.66 53.89 49.18 52.18 52.80 51.92 51.46 52.72 53.04 52.68
Fe (wt%) 46.29 46.61 47.13 46.84 46.89 46.94 46.83 41.04 45.08 46.46 45.36 45.62 45.47 46.86 45.99
Co (wt%) 0.00 0.01 0.01 0.01 0.00 0.00 0.00 0.01 0.00 0.00 0.00 0.00 0.00 0.00 0.00
Ni (wt%) 0.03 0.03 0.00 0.02 0.05 0.03 0.00 0.07 0.02 0.00 0.00 0.00 0.00 0.02 0.01
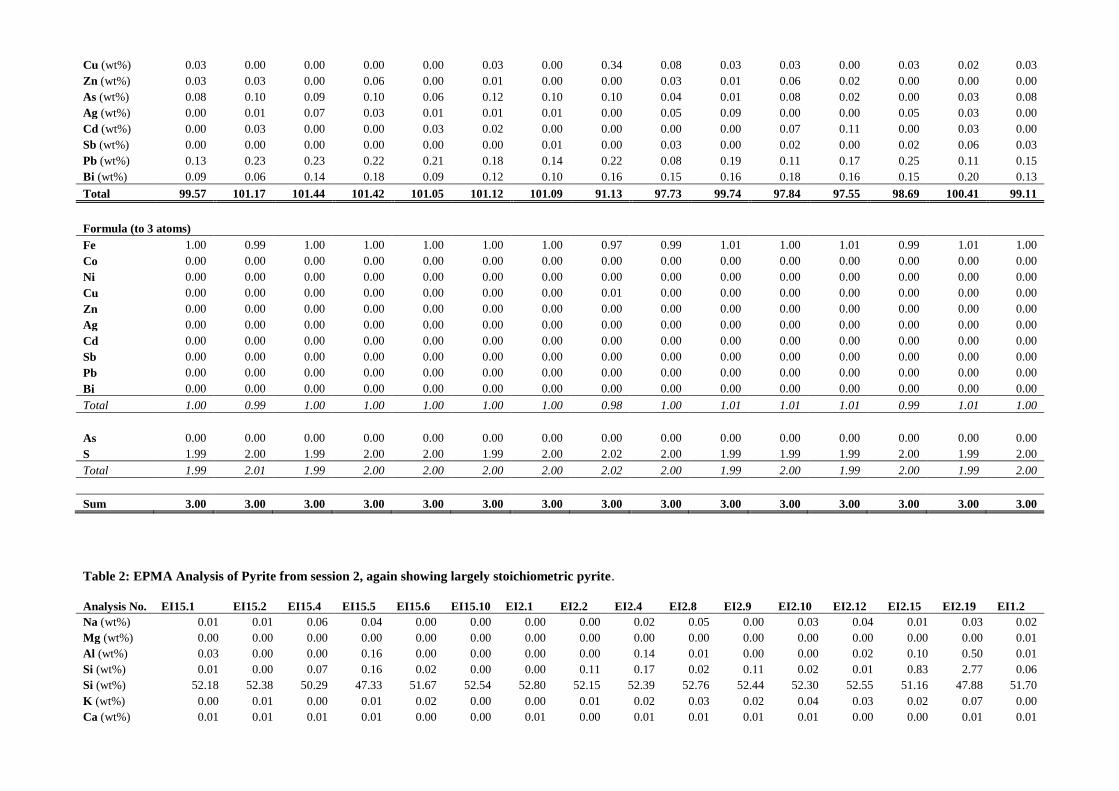
Cu (wt%) 0.03 0.00 0.00 0.00 0.00 0.03 0.00 0.34 0.08 0.03 0.03 0.00 0.03 0.02 0.03
Zn (wt%) 0.03 0.03 0.00 0.06 0.00 0.01 0.00 0.00 0.03 0.01 0.06 0.02 0.00 0.00 0.00
As (wt%) 0.08 0.10 0.09 0.10 0.06 0.12 0.10 0.10 0.04 0.01 0.08 0.02 0.00 0.03 0.08
Ag (wt%) 0.00 0.01 0.07 0.03 0.01 0.01 0.01 0.00 0.05 0.09 0.00 0.00 0.05 0.03 0.00
Cd (wt%) 0.00 0.03 0.00 0.00 0.03 0.02 0.00 0.00 0.00 0.00 0.07 0.11 0.00 0.03 0.00
Sb (wt%) 0.00 0.00 0.00 0.00 0.00 0.00 0.01 0.00 0.03 0.00 0.02 0.00 0.02 0.06 0.03
Pb (wt%) 0.13 0.23 0.23 0.22 0.21 0.18 0.14 0.22 0.08 0.19 0.11 0.17 0.25 0.11 0.15
Bi (wt%) 0.09 0.06 0.14 0.18 0.09 0.12 0.10 0.16 0.15 0.16 0.18 0.16 0.15 0.20 0.13
Total 99.57 101.17 101.44 101.42 101.05 101.12 101.09 91.13 97.73 99.74 97.84 97.55 98.69 100.41 99.11
Formula (to 3 atoms)
Fe 1.00 0.99 1.00 1.00 1.00 1.00 1.00 0.97 0.99 1.01 1.00 1.01 0.99 1.01 1.00
Co 0.00 0.00 0.00 0.00 0.00 0.00 0.00 0.00 0.00 0.00 0.00 0.00 0.00 0.00 0.00
Ni 0.00 0.00 0.00 0.00 0.00 0.00 0.00 0.00 0.00 0.00 0.00 0.00 0.00 0.00 0.00
Cu 0.00 0.00 0.00 0.00 0.00 0.00 0.00 0.01 0.00 0.00 0.00 0.00 0.00 0.00 0.00
Zn 0.00 0.00 0.00 0.00 0.00 0.00 0.00 0.00 0.00 0.00 0.00 0.00 0.00 0.00 0.00
Ag 0.00 0.00 0.00 0.00 0.00 0.00 0.00 0.00 0.00 0.00 0.00 0.00 0.00 0.00 0.00
Cd 0.00 0.00 0.00 0.00 0.00 0.00 0.00 0.00 0.00 0.00 0.00 0.00 0.00 0.00 0.00
Sb 0.00 0.00 0.00 0.00 0.00 0.00 0.00 0.00 0.00 0.00 0.00 0.00 0.00 0.00 0.00
Pb 0.00 0.00 0.00 0.00 0.00 0.00 0.00 0.00 0.00 0.00 0.00 0.00 0.00 0.00 0.00
Bi 0.00 0.00 0.00 0.00 0.00 0.00 0.00 0.00 0.00 0.00 0.00 0.00 0.00 0.00 0.00
Total 1.00 0.99 1.00 1.00 1.00 1.00 1.00 0.98 1.00 1.01 1.01 1.01 0.99 1.01 1.00
As 0.00 0.00 0.00 0.00 0.00 0.00 0.00 0.00 0.00 0.00 0.00 0.00 0.00 0.00 0.00
S 1.99 2.00 1.99 2.00 2.00 1.99 2.00 2.02 2.00 1.99 1.99 1.99 2.00 1.99 2.00
Total 1.99 2.01 1.99 2.00 2.00 2.00 2.00 2.02 2.00 1.99 2.00 1.99 2.00 1.99 2.00
Sum 3.00 3.00 3.00 3.00 3.00 3.00 3.00 3.00 3.00 3.00 3.00 3.00 3.00 3.00 3.00
Table 2: EPMA Analysis of Pyrite from session 2, again showing largely stoichiometric pyrite.
Analysis No. EI15.1 EI15.2 EI15.4 EI15.5 EI15.6 EI15.10 EI2.1 EI2.2 EI2.4 EI2.8 EI2.9 EI2.10 EI2.12 EI2.15 EI2.19 EI1.2
Na (wt%) 0.01 0.01 0.06 0.04 0.00 0.00 0.00 0.00 0.02 0.05 0.00 0.03 0.04 0.01 0.03 0.02
Mg (wt%) 0.00 0.00 0.00 0.00 0.00 0.00 0.00 0.00 0.00 0.00 0.00 0.00 0.00 0.00 0.00 0.01
Al (wt%) 0.03 0.00 0.00 0.16 0.00 0.00 0.00 0.00 0.14 0.01 0.00 0.00 0.02 0.10 0.50 0.01
Si (wt%) 0.01 0.00 0.07 0.16 0.02 0.00 0.00 0.11 0.17 0.02 0.11 0.02 0.01 0.83 2.77 0.06
Si (wt%) 52.18 52.38 50.29 47.33 51.67 52.54 52.80 52.15 52.39 52.76 52.44 52.30 52.55 51.16 47.88 51.70
K (wt%) 0.00 0.01 0.00 0.01 0.02 0.00 0.00 0.01 0.02 0.03 0.02 0.04 0.03 0.02 0.07 0.00
Ca (wt%) 0.01 0.01 0.01 0.01 0.00 0.00 0.01 0.00 0.01 0.01 0.01 0.01 0.00 0.00 0.01 0.01
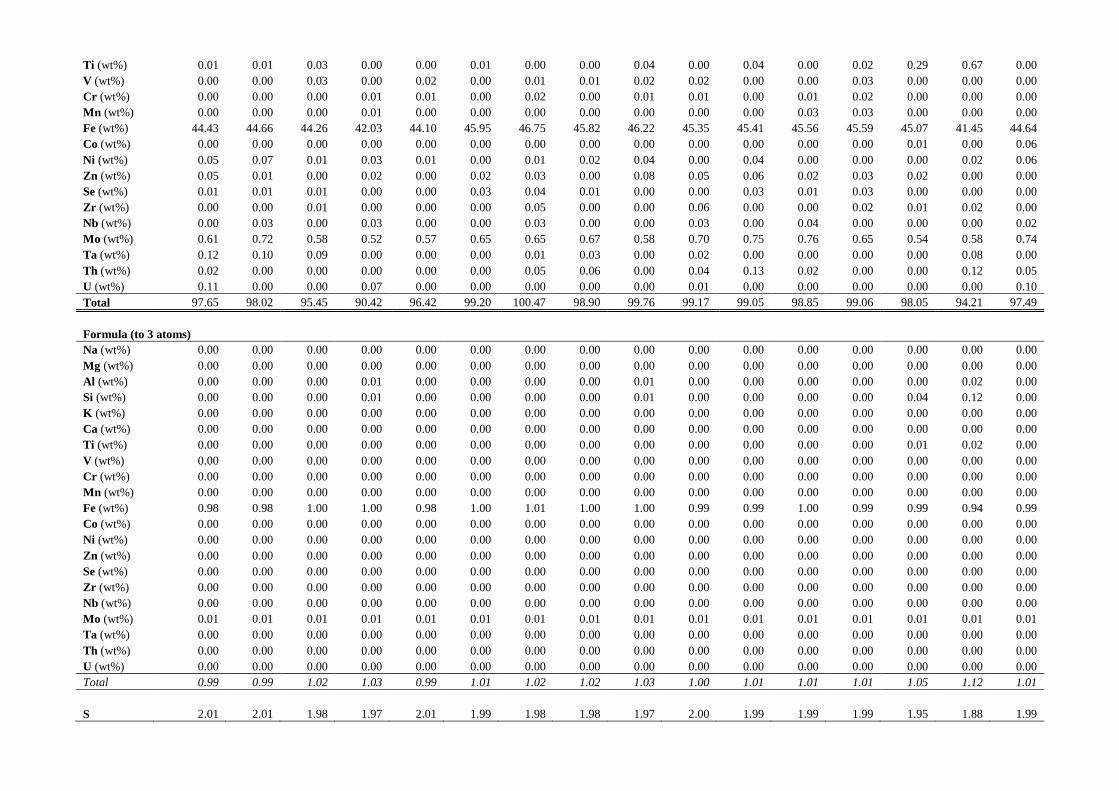
Ti (wt%) 0.01 0.01 0.03 0.00 0.00 0.01 0.00 0.00 0.04 0.00 0.04 0.00 0.02 0.29 0.67 0.00
V (wt%) 0.00 0.00 0.03 0.00 0.02 0.00 0.01 0.01 0.02 0.02 0.00 0.00 0.03 0.00 0.00 0.00
Cr (wt%) 0.00 0.00 0.00 0.01 0.01 0.00 0.02 0.00 0.01 0.01 0.00 0.01 0.02 0.00 0.00 0.00
Mn (wt%) 0.00 0.00 0.00 0.01 0.00 0.00 0.00 0.00 0.00 0.00 0.00 0.03 0.03 0.00 0.00 0.00
Fe (wt%) 44.43 44.66 44.26 42.03 44.10 45.95 46.75 45.82 46.22 45.35 45.41 45.56 45.59 45.07 41.45 44.64
Co (wt%) 0.00 0.00 0.00 0.00 0.00 0.00 0.00 0.00 0.00 0.00 0.00 0.00 0.00 0.01 0.00 0.06
Ni (wt%) 0.05 0.07 0.01 0.03 0.01 0.00 0.01 0.02 0.04 0.00 0.04 0.00 0.00 0.00 0.02 0.06
Zn (wt%) 0.05 0.01 0.00 0.02 0.00 0.02 0.03 0.00 0.08 0.05 0.06 0.02 0.03 0.02 0.00 0.00
Se (wt%) 0.01 0.01 0.01 0.00 0.00 0.03 0.04 0.01 0.00 0.00 0.03 0.01 0.03 0.00 0.00 0.00
Zr (wt%) 0.00 0.00 0.01 0.00 0.00 0.00 0.05 0.00 0.00 0.06 0.00 0.00 0.02 0.01 0.02 0.00
Nb (wt%) 0.00 0.03 0.00 0.03 0.00 0.00 0.03 0.00 0.00 0.03 0.00 0.04 0.00 0.00 0.00 0.02
Mo (wt%) 0.61 0.72 0.58 0.52 0.57 0.65 0.65 0.67 0.58 0.70 0.75 0.76 0.65 0.54 0.58 0.74
Ta (wt%) 0.12 0.10 0.09 0.00 0.00 0.00 0.01 0.03 0.00 0.02 0.00 0.00 0.00 0.00 0.08 0.00
Th (wt%) 0.02 0.00 0.00 0.00 0.00 0.00 0.05 0.06 0.00 0.04 0.13 0.02 0.00 0.00 0.12 0.05
U (wt%) 0.11 0.00 0.00 0.07 0.00 0.00 0.00 0.00 0.00 0.01 0.00 0.00 0.00 0.00 0.00 0.10
Total 97.65 98.02 95.45 90.42 96.42 99.20 100.47 98.90 99.76 99.17 99.05 98.85 99.06 98.05 94.21 97.49
Formula (to 3 atoms)
Na (wt%) 0.00 0.00 0.00 0.00 0.00 0.00 0.00 0.00 0.00 0.00 0.00 0.00 0.00 0.00 0.00 0.00
Mg (wt%) 0.00 0.00 0.00 0.00 0.00 0.00 0.00 0.00 0.00 0.00 0.00 0.00 0.00 0.00 0.00 0.00
Al (wt%) 0.00 0.00 0.00 0.01 0.00 0.00 0.00 0.00 0.01 0.00 0.00 0.00 0.00 0.00 0.02 0.00
Si (wt%) 0.00 0.00 0.00 0.01 0.00 0.00 0.00 0.00 0.01 0.00 0.00 0.00 0.00 0.04 0.12 0.00
K (wt%) 0.00 0.00 0.00 0.00 0.00 0.00 0.00 0.00 0.00 0.00 0.00 0.00 0.00 0.00 0.00 0.00
Ca (wt%) 0.00 0.00 0.00 0.00 0.00 0.00 0.00 0.00 0.00 0.00 0.00 0.00 0.00 0.00 0.00 0.00
Ti (wt%) 0.00 0.00 0.00 0.00 0.00 0.00 0.00 0.00 0.00 0.00 0.00 0.00 0.00 0.01 0.02 0.00
V (wt%) 0.00 0.00 0.00 0.00 0.00 0.00 0.00 0.00 0.00 0.00 0.00 0.00 0.00 0.00 0.00 0.00
Cr (wt%) 0.00 0.00 0.00 0.00 0.00 0.00 0.00 0.00 0.00 0.00 0.00 0.00 0.00 0.00 0.00 0.00
Mn (wt%) 0.00 0.00 0.00 0.00 0.00 0.00 0.00 0.00 0.00 0.00 0.00 0.00 0.00 0.00 0.00 0.00
Fe (wt%) 0.98 0.98 1.00 1.00 0.98 1.00 1.01 1.00 1.00 0.99 0.99 1.00 0.99 0.99 0.94 0.99
Co (wt%) 0.00 0.00 0.00 0.00 0.00 0.00 0.00 0.00 0.00 0.00 0.00 0.00 0.00 0.00 0.00 0.00
Ni (wt%) 0.00 0.00 0.00 0.00 0.00 0.00 0.00 0.00 0.00 0.00 0.00 0.00 0.00 0.00 0.00 0.00
Zn (wt%) 0.00 0.00 0.00 0.00 0.00 0.00 0.00 0.00 0.00 0.00 0.00 0.00 0.00 0.00 0.00 0.00
Se (wt%) 0.00 0.00 0.00 0.00 0.00 0.00 0.00 0.00 0.00 0.00 0.00 0.00 0.00 0.00 0.00 0.00
Zr (wt%) 0.00 0.00 0.00 0.00 0.00 0.00 0.00 0.00 0.00 0.00 0.00 0.00 0.00 0.00 0.00 0.00
Nb (wt%) 0.00 0.00 0.00 0.00 0.00 0.00 0.00 0.00 0.00 0.00 0.00 0.00 0.00 0.00 0.00 0.00
Mo (wt%) 0.01 0.01 0.01 0.01 0.01 0.01 0.01 0.01 0.01 0.01 0.01 0.01 0.01 0.01 0.01 0.01
Ta (wt%) 0.00 0.00 0.00 0.00 0.00 0.00 0.00 0.00 0.00 0.00 0.00 0.00 0.00 0.00 0.00 0.00
Th (wt%) 0.00 0.00 0.00 0.00 0.00 0.00 0.00 0.00 0.00 0.00 0.00 0.00 0.00 0.00 0.00 0.00
U (wt%) 0.00 0.00 0.00 0.00 0.00 0.00 0.00 0.00 0.00 0.00 0.00 0.00 0.00 0.00 0.00 0.00
Total 0.99 0.99 1.02 1.03 0.99 1.01 1.02 1.02 1.03 1.00 1.01 1.01 1.01 1.05 1.12 1.01
S 2.01 2.01 1.98 1.97 2.01 1.99 1.98 1.98 1.97 2.00 1.99 1.99 1.99 1.95 1.88 1.99
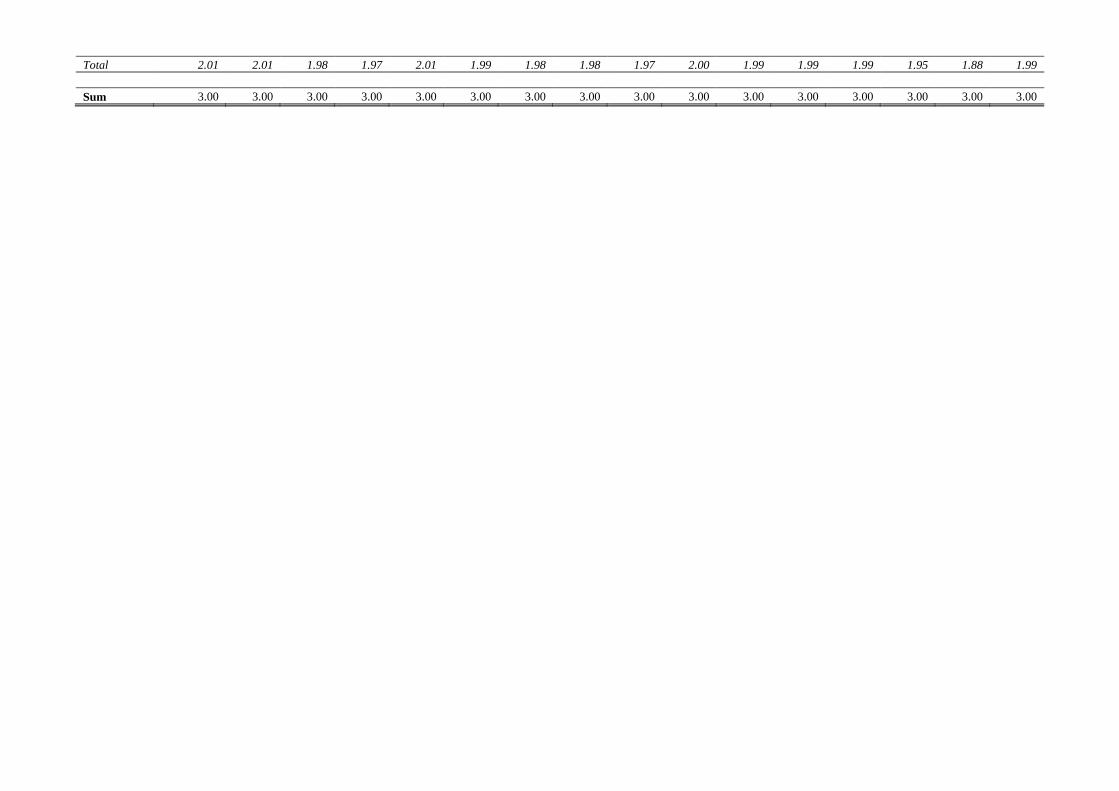
Total 2.01 2.01 1.98 1.97 2.01 1.99 1.98 1.98 1.97 2.00 1.99 1.99 1.99 1.95 1.88 1.99
Sum 3.00 3.00 3.00 3.00 3.00 3.00 3.00 3.00 3.00 3.00 3.00 3.00 3.00 3.00 3.00 3.00
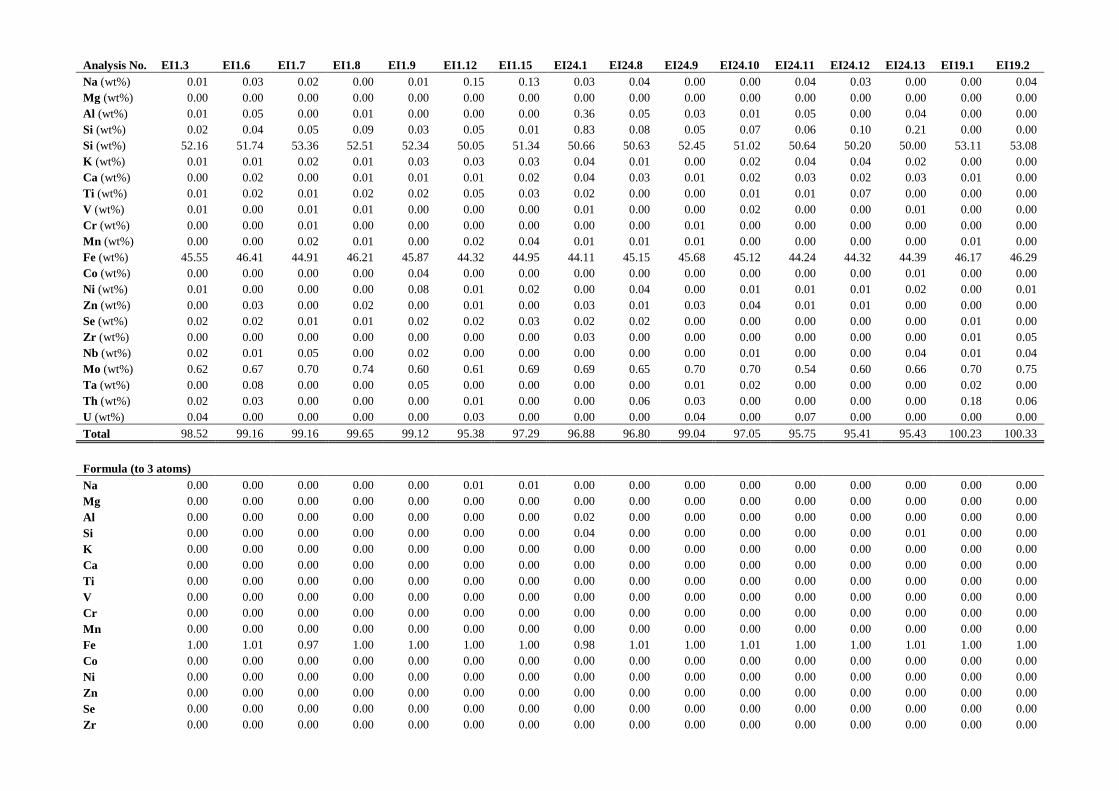
Analysis No. EI1.3 EI1.6 EI1.7 EI1.8 EI1.9 EI1.12 EI1.15 EI24.1 EI24.8 EI24.9 EI24.10 EI24.11 EI24.12 EI24.13 EI19.1 EI19.2
Na (wt%) 0.01 0.03 0.02 0.00 0.01 0.15 0.13 0.03 0.04 0.00 0.00 0.04 0.03 0.00 0.00 0.04
Mg (wt%) 0.00 0.00 0.00 0.00 0.00 0.00 0.00 0.00 0.00 0.00 0.00 0.00 0.00 0.00 0.00 0.00
Al (wt%) 0.01 0.05 0.00 0.01 0.00 0.00 0.00 0.36 0.05 0.03 0.01 0.05 0.00 0.04 0.00 0.00
Si (wt%) 0.02 0.04 0.05 0.09 0.03 0.05 0.01 0.83 0.08 0.05 0.07 0.06 0.10 0.21 0.00 0.00
Si (wt%) 52.16 51.74 53.36 52.51 52.34 50.05 51.34 50.66 50.63 52.45 51.02 50.64 50.20 50.00 53.11 53.08
K (wt%) 0.01 0.01 0.02 0.01 0.03 0.03 0.03 0.04 0.01 0.00 0.02 0.04 0.04 0.02 0.00 0.00
Ca (wt%) 0.00 0.02 0.00 0.01 0.01 0.01 0.02 0.04 0.03 0.01 0.02 0.03 0.02 0.03 0.01 0.00
Ti (wt%) 0.01 0.02 0.01 0.02 0.02 0.05 0.03 0.02 0.00 0.00 0.01 0.01 0.07 0.00 0.00 0.00
V (wt%) 0.01 0.00 0.01 0.01 0.00 0.00 0.00 0.01 0.00 0.00 0.02 0.00 0.00 0.01 0.00 0.00
Cr (wt%) 0.00 0.00 0.01 0.00 0.00 0.00 0.00 0.00 0.00 0.01 0.00 0.00 0.00 0.00 0.00 0.00
Mn (wt%) 0.00 0.00 0.02 0.01 0.00 0.02 0.04 0.01 0.01 0.01 0.00 0.00 0.00 0.00 0.01 0.00
Fe (wt%) 45.55 46.41 44.91 46.21 45.87 44.32 44.95 44.11 45.15 45.68 45.12 44.24 44.32 44.39 46.17 46.29
Co (wt%) 0.00 0.00 0.00 0.00 0.04 0.00 0.00 0.00 0.00 0.00 0.00 0.00 0.00 0.01 0.00 0.00
Ni (wt%) 0.01 0.00 0.00 0.00 0.08 0.01 0.02 0.00 0.04 0.00 0.01 0.01 0.01 0.02 0.00 0.01
Zn (wt%) 0.00 0.03 0.00 0.02 0.00 0.01 0.00 0.03 0.01 0.03 0.04 0.01 0.01 0.00 0.00 0.00
Se (wt%) 0.02 0.02 0.01 0.01 0.02 0.02 0.03 0.02 0.02 0.00 0.00 0.00 0.00 0.00 0.01 0.00
Zr (wt%) 0.00 0.00 0.00 0.00 0.00 0.00 0.00 0.03 0.00 0.00 0.00 0.00 0.00 0.00 0.01 0.05
Nb (wt%) 0.02 0.01 0.05 0.00 0.02 0.00 0.00 0.00 0.00 0.00 0.01 0.00 0.00 0.04 0.01 0.04
Mo (wt%) 0.62 0.67 0.70 0.74 0.60 0.61 0.69 0.69 0.65 0.70 0.70 0.54 0.60 0.66 0.70 0.75
Ta (wt%) 0.00 0.08 0.00 0.00 0.05 0.00 0.00 0.00 0.00 0.01 0.02 0.00 0.00 0.00 0.02 0.00
Th (wt%) 0.02 0.03 0.00 0.00 0.00 0.01 0.00 0.00 0.06 0.03 0.00 0.00 0.00 0.00 0.18 0.06
U (wt%) 0.04 0.00 0.00 0.00 0.00 0.03 0.00 0.00 0.00 0.04 0.00 0.07 0.00 0.00 0.00 0.00
Total 98.52 99.16 99.16 99.65 99.12 95.38 97.29 96.88 96.80 99.04 97.05 95.75 95.41 95.43 100.23 100.33
Formula (to 3 atoms)
Na 0.00 0.00 0.00 0.00 0.00 0.01 0.01 0.00 0.00 0.00 0.00 0.00 0.00 0.00 0.00 0.00
Mg 0.00 0.00 0.00 0.00 0.00 0.00 0.00 0.00 0.00 0.00 0.00 0.00 0.00 0.00 0.00 0.00
Al 0.00 0.00 0.00 0.00 0.00 0.00 0.00 0.02 0.00 0.00 0.00 0.00 0.00 0.00 0.00 0.00
Si 0.00 0.00 0.00 0.00 0.00 0.00 0.00 0.04 0.00 0.00 0.00 0.00 0.00 0.01 0.00 0.00
K 0.00 0.00 0.00 0.00 0.00 0.00 0.00 0.00 0.00 0.00 0.00 0.00 0.00 0.00 0.00 0.00
Ca 0.00 0.00 0.00 0.00 0.00 0.00 0.00 0.00 0.00 0.00 0.00 0.00 0.00 0.00 0.00 0.00
Ti 0.00 0.00 0.00 0.00 0.00 0.00 0.00 0.00 0.00 0.00 0.00 0.00 0.00 0.00 0.00 0.00
V 0.00 0.00 0.00 0.00 0.00 0.00 0.00 0.00 0.00 0.00 0.00 0.00 0.00 0.00 0.00 0.00
Cr 0.00 0.00 0.00 0.00 0.00 0.00 0.00 0.00 0.00 0.00 0.00 0.00 0.00 0.00 0.00 0.00
Mn 0.00 0.00 0.00 0.00 0.00 0.00 0.00 0.00 0.00 0.00 0.00 0.00 0.00 0.00 0.00 0.00
Fe 1.00 1.01 0.97 1.00 1.00 1.00 1.00 0.98 1.01 1.00 1.01 1.00 1.00 1.01 1.00 1.00
Co 0.00 0.00 0.00 0.00 0.00 0.00 0.00 0.00 0.00 0.00 0.00 0.00 0.00 0.00 0.00 0.00
Ni 0.00 0.00 0.00 0.00 0.00 0.00 0.00 0.00 0.00 0.00 0.00 0.00 0.00 0.00 0.00 0.00
Zn 0.00 0.00 0.00 0.00 0.00 0.00 0.00 0.00 0.00 0.00 0.00 0.00 0.00 0.00 0.00 0.00
Se 0.00 0.00 0.00 0.00 0.00 0.00 0.00 0.00 0.00 0.00 0.00 0.00 0.00 0.00 0.00 0.00
Zr 0.00 0.00 0.00 0.00 0.00 0.00 0.00 0.00 0.00 0.00 0.00 0.00 0.00 0.00 0.00 0.00
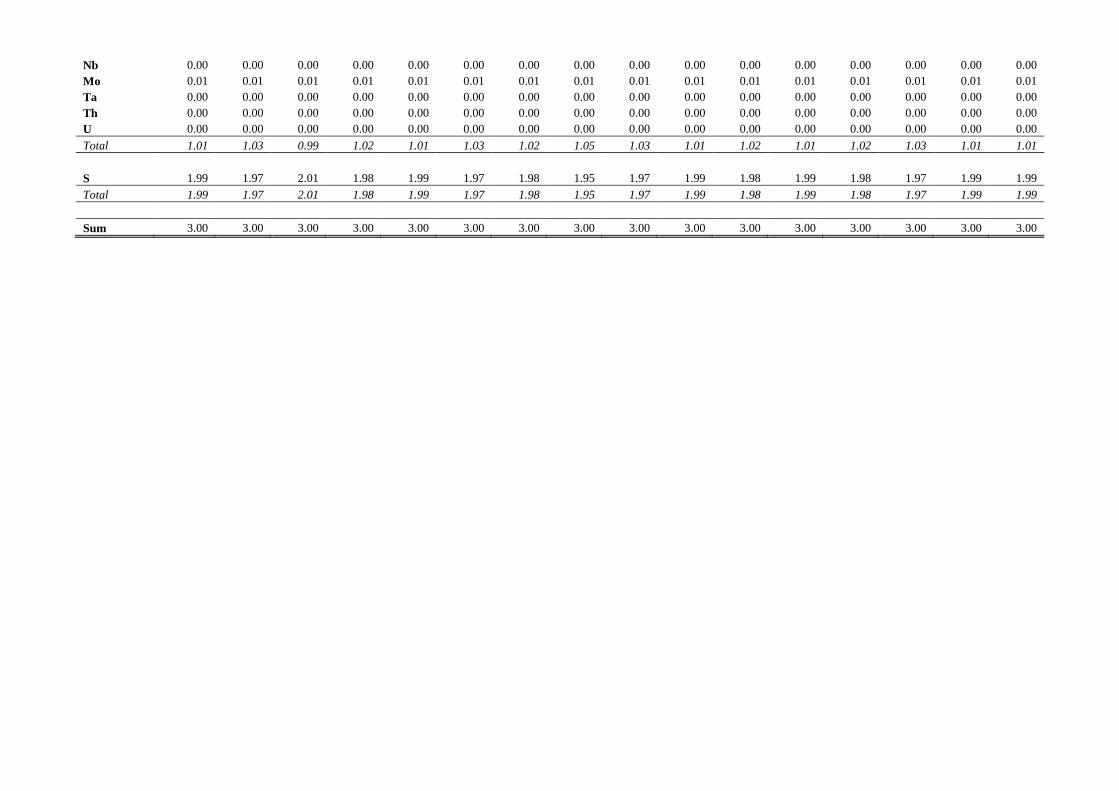
Nb 0.00 0.00 0.00 0.00 0.00 0.00 0.00 0.00 0.00 0.00 0.00 0.00 0.00 0.00 0.00 0.00
Mo 0.01 0.01 0.01 0.01 0.01 0.01 0.01 0.01 0.01 0.01 0.01 0.01 0.01 0.01 0.01 0.01
Ta 0.00 0.00 0.00 0.00 0.00 0.00 0.00 0.00 0.00 0.00 0.00 0.00 0.00 0.00 0.00 0.00
Th 0.00 0.00 0.00 0.00 0.00 0.00 0.00 0.00 0.00 0.00 0.00 0.00 0.00 0.00 0.00 0.00
U 0.00 0.00 0.00 0.00 0.00 0.00 0.00 0.00 0.00 0.00 0.00 0.00 0.00 0.00 0.00 0.00
Total 1.01 1.03 0.99 1.02 1.01 1.03 1.02 1.05 1.03 1.01 1.02 1.01 1.02 1.03 1.01 1.01
S 1.99 1.97 2.01 1.98 1.99 1.97 1.98 1.95 1.97 1.99 1.98 1.99 1.98 1.97 1.99 1.99
Total 1.99 1.97 2.01 1.98 1.99 1.97 1.98 1.95 1.97 1.99 1.98 1.99 1.98 1.97 1.99 1.99
Sum 3.00 3.00 3.00 3.00 3.00 3.00 3.00 3.00 3.00 3.00 3.00 3.00 3.00 3.00 3.00 3.00
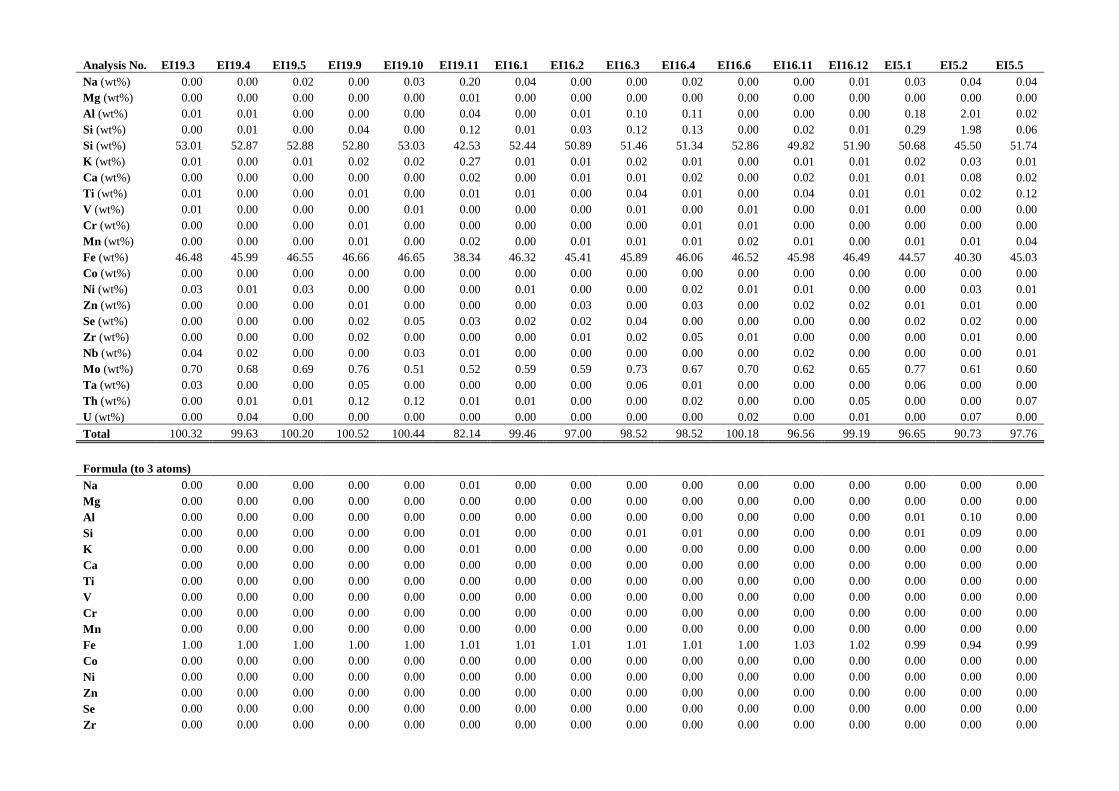
Analysis No. EI19.3 EI19.4 EI19.5 EI19.9 EI19.10 EI19.11 EI16.1 EI16.2 EI16.3 EI16.4 EI16.6 EI16.11 EI16.12 EI5.1 EI5.2 EI5.5
Na (wt%) 0.00 0.00 0.02 0.00 0.03 0.20 0.04 0.00 0.00 0.02 0.00 0.00 0.01 0.03 0.04 0.04
Mg (wt%) 0.00 0.00 0.00 0.00 0.00 0.01 0.00 0.00 0.00 0.00 0.00 0.00 0.00 0.00 0.00 0.00
Al (wt%) 0.01 0.01 0.00 0.00 0.00 0.04 0.00 0.01 0.10 0.11 0.00 0.00 0.00 0.18 2.01 0.02
Si (wt%) 0.00 0.01 0.00 0.04 0.00 0.12 0.01 0.03 0.12 0.13 0.00 0.02 0.01 0.29 1.98 0.06
Si (wt%) 53.01 52.87 52.88 52.80 53.03 42.53 52.44 50.89 51.46 51.34 52.86 49.82 51.90 50.68 45.50 51.74
K (wt%) 0.01 0.00 0.01 0.02 0.02 0.27 0.01 0.01 0.02 0.01 0.00 0.01 0.01 0.02 0.03 0.01
Ca (wt%) 0.00 0.00 0.00 0.00 0.00 0.02 0.00 0.01 0.01 0.02 0.00 0.02 0.01 0.01 0.08 0.02
Ti (wt%) 0.01 0.00 0.00 0.01 0.00 0.01 0.01 0.00 0.04 0.01 0.00 0.04 0.01 0.01 0.02 0.12
V (wt%) 0.01 0.00 0.00 0.00 0.01 0.00 0.00 0.00 0.01 0.00 0.01 0.00 0.01 0.00 0.00 0.00
Cr (wt%) 0.00 0.00 0.00 0.01 0.00 0.00 0.00 0.00 0.00 0.01 0.01 0.00 0.00 0.00 0.00 0.00
Mn (wt%) 0.00 0.00 0.00 0.01 0.00 0.02 0.00 0.01 0.01 0.01 0.02 0.01 0.00 0.01 0.01 0.04
Fe (wt%) 46.48 45.99 46.55 46.66 46.65 38.34 46.32 45.41 45.89 46.06 46.52 45.98 46.49 44.57 40.30 45.03
Co (wt%) 0.00 0.00 0.00 0.00 0.00 0.00 0.00 0.00 0.00 0.00 0.00 0.00 0.00 0.00 0.00 0.00
Ni (wt%) 0.03 0.01 0.03 0.00 0.00 0.00 0.01 0.00 0.00 0.02 0.01 0.01 0.00 0.00 0.03 0.01
Zn (wt%) 0.00 0.00 0.00 0.01 0.00 0.00 0.00 0.03 0.00 0.03 0.00 0.02 0.02 0.01 0.01 0.00
Se (wt%) 0.00 0.00 0.00 0.02 0.05 0.03 0.02 0.02 0.04 0.00 0.00 0.00 0.00 0.02 0.02 0.00
Zr (wt%) 0.00 0.00 0.00 0.02 0.00 0.00 0.00 0.01 0.02 0.05 0.01 0.00 0.00 0.00 0.01 0.00
Nb (wt%) 0.04 0.02 0.00 0.00 0.03 0.01 0.00 0.00 0.00 0.00 0.00 0.02 0.00 0.00 0.00 0.01
Mo (wt%) 0.70 0.68 0.69 0.76 0.51 0.52 0.59 0.59 0.73 0.67 0.70 0.62 0.65 0.77 0.61 0.60
Ta (wt%) 0.03 0.00 0.00 0.05 0.00 0.00 0.00 0.00 0.06 0.01 0.00 0.00 0.00 0.06 0.00 0.00
Th (wt%) 0.00 0.01 0.01 0.12 0.12 0.01 0.01 0.00 0.00 0.02 0.00 0.00 0.05 0.00 0.00 0.07
U (wt%) 0.00 0.04 0.00 0.00 0.00 0.00 0.00 0.00 0.00 0.00 0.02 0.00 0.01 0.00 0.07 0.00
Total 100.32 99.63 100.20 100.52 100.44 82.14 99.46 97.00 98.52 98.52 100.18 96.56 99.19 96.65 90.73 97.76
Formula (to 3 atoms)
Na 0.00 0.00 0.00 0.00 0.00 0.01 0.00 0.00 0.00 0.00 0.00 0.00 0.00 0.00 0.00 0.00
Mg 0.00 0.00 0.00 0.00 0.00 0.00 0.00 0.00 0.00 0.00 0.00 0.00 0.00 0.00 0.00 0.00
Al 0.00 0.00 0.00 0.00 0.00 0.00 0.00 0.00 0.00 0.00 0.00 0.00 0.00 0.01 0.10 0.00
Si 0.00 0.00 0.00 0.00 0.00 0.01 0.00 0.00 0.01 0.01 0.00 0.00 0.00 0.01 0.09 0.00
K 0.00 0.00 0.00 0.00 0.00 0.01 0.00 0.00 0.00 0.00 0.00 0.00 0.00 0.00 0.00 0.00
Ca 0.00 0.00 0.00 0.00 0.00 0.00 0.00 0.00 0.00 0.00 0.00 0.00 0.00 0.00 0.00 0.00
Ti 0.00 0.00 0.00 0.00 0.00 0.00 0.00 0.00 0.00 0.00 0.00 0.00 0.00 0.00 0.00 0.00
V 0.00 0.00 0.00 0.00 0.00 0.00 0.00 0.00 0.00 0.00 0.00 0.00 0.00 0.00 0.00 0.00
Cr 0.00 0.00 0.00 0.00 0.00 0.00 0.00 0.00 0.00 0.00 0.00 0.00 0.00 0.00 0.00 0.00
Mn 0.00 0.00 0.00 0.00 0.00 0.00 0.00 0.00 0.00 0.00 0.00 0.00 0.00 0.00 0.00 0.00
Fe 1.00 1.00 1.00 1.00 1.00 1.01 1.01 1.01 1.01 1.01 1.00 1.03 1.02 0.99 0.94 0.99
Co 0.00 0.00 0.00 0.00 0.00 0.00 0.00 0.00 0.00 0.00 0.00 0.00 0.00 0.00 0.00 0.00
Ni 0.00 0.00 0.00 0.00 0.00 0.00 0.00 0.00 0.00 0.00 0.00 0.00 0.00 0.00 0.00 0.00
Zn 0.00 0.00 0.00 0.00 0.00 0.00 0.00 0.00 0.00 0.00 0.00 0.00 0.00 0.00 0.00 0.00
Se 0.00 0.00 0.00 0.00 0.00 0.00 0.00 0.00 0.00 0.00 0.00 0.00 0.00 0.00 0.00 0.00
Zr 0.00 0.00 0.00 0.00 0.00 0.00 0.00 0.00 0.00 0.00 0.00 0.00 0.00 0.00 0.00 0.00
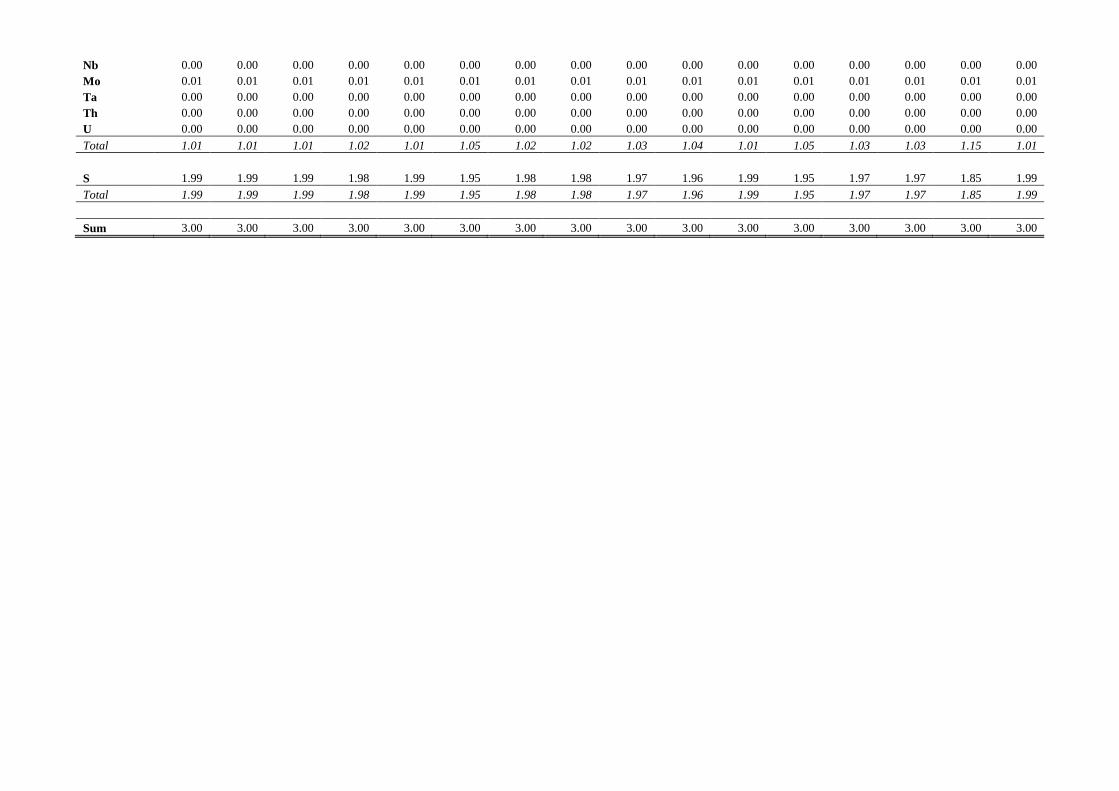
Nb 0.00 0.00 0.00 0.00 0.00 0.00 0.00 0.00 0.00 0.00 0.00 0.00 0.00 0.00 0.00 0.00
Mo 0.01 0.01 0.01 0.01 0.01 0.01 0.01 0.01 0.01 0.01 0.01 0.01 0.01 0.01 0.01 0.01
Ta 0.00 0.00 0.00 0.00 0.00 0.00 0.00 0.00 0.00 0.00 0.00 0.00 0.00 0.00 0.00 0.00
Th 0.00 0.00 0.00 0.00 0.00 0.00 0.00 0.00 0.00 0.00 0.00 0.00 0.00 0.00 0.00 0.00
U 0.00 0.00 0.00 0.00 0.00 0.00 0.00 0.00 0.00 0.00 0.00 0.00 0.00 0.00 0.00 0.00
Total 1.01 1.01 1.01 1.02 1.01 1.05 1.02 1.02 1.03 1.04 1.01 1.05 1.03 1.03 1.15 1.01
S 1.99 1.99 1.99 1.98 1.99 1.95 1.98 1.98 1.97 1.96 1.99 1.95 1.97 1.97 1.85 1.99
Total 1.99 1.99 1.99 1.98 1.99 1.95 1.98 1.98 1.97 1.96 1.99 1.95 1.97 1.97 1.85 1.99
Sum 3.00 3.00 3.00 3.00 3.00 3.00 3.00 3.00 3.00 3.00 3.00 3.00 3.00 3.00 3.00 3.00
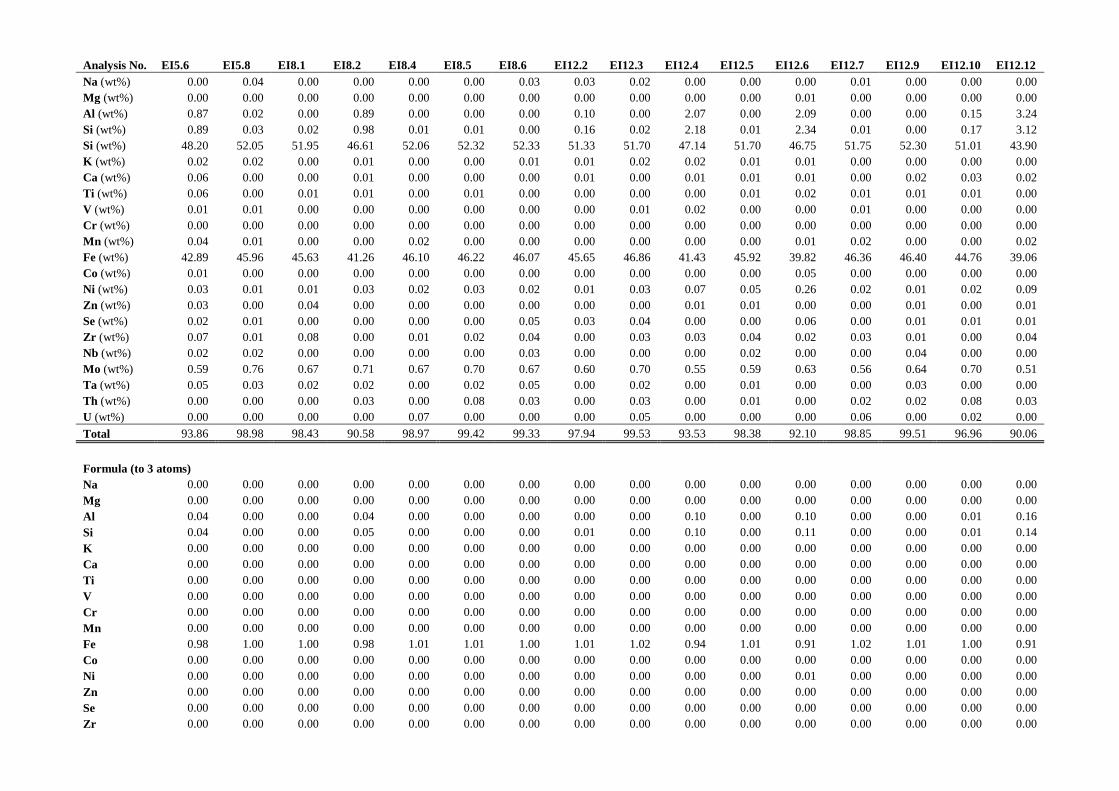
Analysis No. EI5.6 EI5.8 EI8.1 EI8.2 EI8.4 EI8.5 EI8.6 EI12.2 EI12.3 EI12.4 EI12.5 EI12.6 EI12.7 EI12.9 EI12.10 EI12.12
Na (wt%) 0.00 0.04 0.00 0.00 0.00 0.00 0.03 0.03 0.02 0.00 0.00 0.00 0.01 0.00 0.00 0.00
Mg (wt%) 0.00 0.00 0.00 0.00 0.00 0.00 0.00 0.00 0.00 0.00 0.00 0.01 0.00 0.00 0.00 0.00
Al (wt%) 0.87 0.02 0.00 0.89 0.00 0.00 0.00 0.10 0.00 2.07 0.00 2.09 0.00 0.00 0.15 3.24
Si (wt%) 0.89 0.03 0.02 0.98 0.01 0.01 0.00 0.16 0.02 2.18 0.01 2.34 0.01 0.00 0.17 3.12
Si (wt%) 48.20 52.05 51.95 46.61 52.06 52.32 52.33 51.33 51.70 47.14 51.70 46.75 51.75 52.30 51.01 43.90
K (wt%) 0.02 0.02 0.00 0.01 0.00 0.00 0.01 0.01 0.02 0.02 0.01 0.01 0.00 0.00 0.00 0.00
Ca (wt%) 0.06 0.00 0.00 0.01 0.00 0.00 0.00 0.01 0.00 0.01 0.01 0.01 0.00 0.02 0.03 0.02
Ti (wt%) 0.06 0.00 0.01 0.01 0.00 0.01 0.00 0.00 0.00 0.00 0.01 0.02 0.01 0.01 0.01 0.00
V (wt%) 0.01 0.01 0.00 0.00 0.00 0.00 0.00 0.00 0.01 0.02 0.00 0.00 0.01 0.00 0.00 0.00
Cr (wt%) 0.00 0.00 0.00 0.00 0.00 0.00 0.00 0.00 0.00 0.00 0.00 0.00 0.00 0.00 0.00 0.00
Mn (wt%) 0.04 0.01 0.00 0.00 0.02 0.00 0.00 0.00 0.00 0.00 0.00 0.01 0.02 0.00 0.00 0.02
Fe (wt%) 42.89 45.96 45.63 41.26 46.10 46.22 46.07 45.65 46.86 41.43 45.92 39.82 46.36 46.40 44.76 39.06
Co (wt%) 0.01 0.00 0.00 0.00 0.00 0.00 0.00 0.00 0.00 0.00 0.00 0.05 0.00 0.00 0.00 0.00
Ni (wt%) 0.03 0.01 0.01 0.03 0.02 0.03 0.02 0.01 0.03 0.07 0.05 0.26 0.02 0.01 0.02 0.09
Zn (wt%) 0.03 0.00 0.04 0.00 0.00 0.00 0.00 0.00 0.00 0.01 0.01 0.00 0.00 0.01 0.00 0.01
Se (wt%) 0.02 0.01 0.00 0.00 0.00 0.00 0.05 0.03 0.04 0.00 0.00 0.06 0.00 0.01 0.01 0.01
Zr (wt%) 0.07 0.01 0.08 0.00 0.01 0.02 0.04 0.00 0.03 0.03 0.04 0.02 0.03 0.01 0.00 0.04
Nb (wt%) 0.02 0.02 0.00 0.00 0.00 0.00 0.03 0.00 0.00 0.00 0.02 0.00 0.00 0.04 0.00 0.00
Mo (wt%) 0.59 0.76 0.67 0.71 0.67 0.70 0.67 0.60 0.70 0.55 0.59 0.63 0.56 0.64 0.70 0.51
Ta (wt%) 0.05 0.03 0.02 0.02 0.00 0.02 0.05 0.00 0.02 0.00 0.01 0.00 0.00 0.03 0.00 0.00
Th (wt%) 0.00 0.00 0.00 0.03 0.00 0.08 0.03 0.00 0.03 0.00 0.01 0.00 0.02 0.02 0.08 0.03
U (wt%) 0.00 0.00 0.00 0.00 0.07 0.00 0.00 0.00 0.05 0.00 0.00 0.00 0.06 0.00 0.02 0.00
Total 93.86 98.98 98.43 90.58 98.97 99.42 99.33 97.94 99.53 93.53 98.38 92.10 98.85 99.51 96.96 90.06
Formula (to 3 atoms)
Na 0.00 0.00 0.00 0.00 0.00 0.00 0.00 0.00 0.00 0.00 0.00 0.00 0.00 0.00 0.00 0.00
Mg 0.00 0.00 0.00 0.00 0.00 0.00 0.00 0.00 0.00 0.00 0.00 0.00 0.00 0.00 0.00 0.00
Al 0.04 0.00 0.00 0.04 0.00 0.00 0.00 0.00 0.00 0.10 0.00 0.10 0.00 0.00 0.01 0.16
Si 0.04 0.00 0.00 0.05 0.00 0.00 0.00 0.01 0.00 0.10 0.00 0.11 0.00 0.00 0.01 0.14
K 0.00 0.00 0.00 0.00 0.00 0.00 0.00 0.00 0.00 0.00 0.00 0.00 0.00 0.00 0.00 0.00
Ca 0.00 0.00 0.00 0.00 0.00 0.00 0.00 0.00 0.00 0.00 0.00 0.00 0.00 0.00 0.00 0.00
Ti 0.00 0.00 0.00 0.00 0.00 0.00 0.00 0.00 0.00 0.00 0.00 0.00 0.00 0.00 0.00 0.00
V 0.00 0.00 0.00 0.00 0.00 0.00 0.00 0.00 0.00 0.00 0.00 0.00 0.00 0.00 0.00 0.00
Cr 0.00 0.00 0.00 0.00 0.00 0.00 0.00 0.00 0.00 0.00 0.00 0.00 0.00 0.00 0.00 0.00
Mn 0.00 0.00 0.00 0.00 0.00 0.00 0.00 0.00 0.00 0.00 0.00 0.00 0.00 0.00 0.00 0.00
Fe 0.98 1.00 1.00 0.98 1.01 1.01 1.00 1.01 1.02 0.94 1.01 0.91 1.02 1.01 1.00 0.91
Co 0.00 0.00 0.00 0.00 0.00 0.00 0.00 0.00 0.00 0.00 0.00 0.00 0.00 0.00 0.00 0.00
Ni 0.00 0.00 0.00 0.00 0.00 0.00 0.00 0.00 0.00 0.00 0.00 0.01 0.00 0.00 0.00 0.00
Zn 0.00 0.00 0.00 0.00 0.00 0.00 0.00 0.00 0.00 0.00 0.00 0.00 0.00 0.00 0.00 0.00
Se 0.00 0.00 0.00 0.00 0.00 0.00 0.00 0.00 0.00 0.00 0.00 0.00 0.00 0.00 0.00 0.00
Zr 0.00 0.00 0.00 0.00 0.00 0.00 0.00 0.00 0.00 0.00 0.00 0.00 0.00 0.00 0.00 0.00
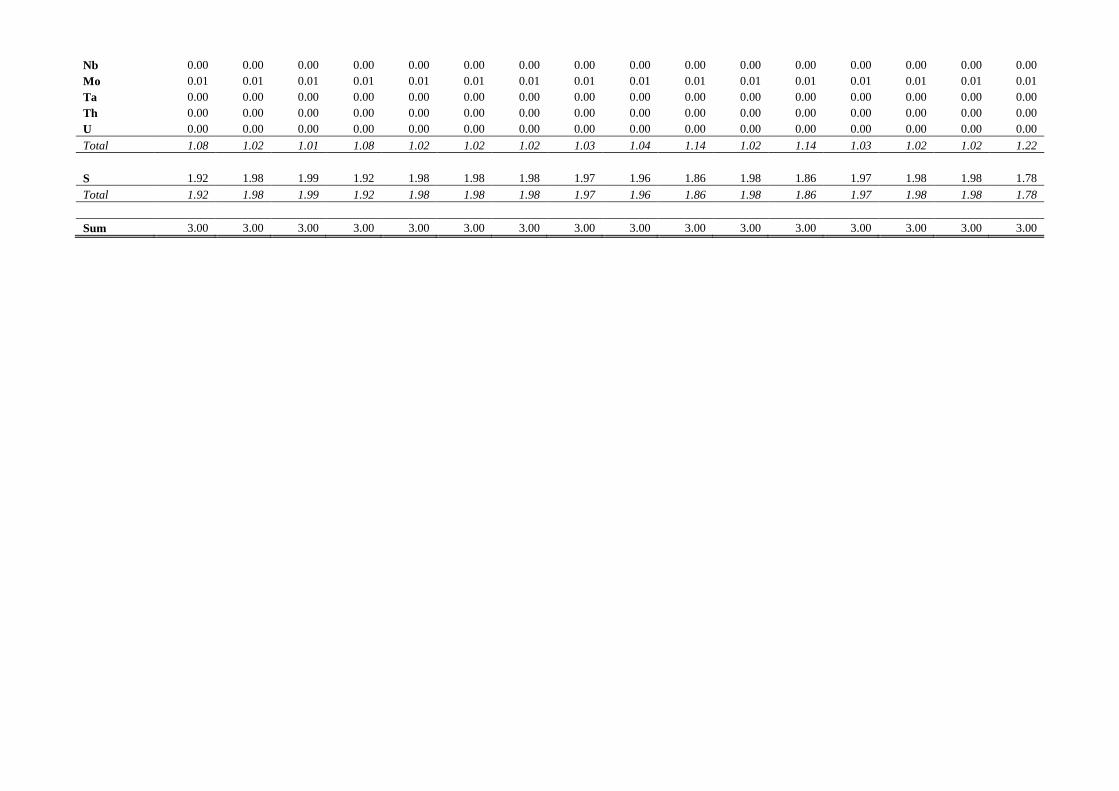
Nb 0.00 0.00 0.00 0.00 0.00 0.00 0.00 0.00 0.00 0.00 0.00 0.00 0.00 0.00 0.00 0.00
Mo 0.01 0.01 0.01 0.01 0.01 0.01 0.01 0.01 0.01 0.01 0.01 0.01 0.01 0.01 0.01 0.01
Ta 0.00 0.00 0.00 0.00 0.00 0.00 0.00 0.00 0.00 0.00 0.00 0.00 0.00 0.00 0.00 0.00
Th 0.00 0.00 0.00 0.00 0.00 0.00 0.00 0.00 0.00 0.00 0.00 0.00 0.00 0.00 0.00 0.00
U 0.00 0.00 0.00 0.00 0.00 0.00 0.00 0.00 0.00 0.00 0.00 0.00 0.00 0.00 0.00 0.00
Total 1.08 1.02 1.01 1.08 1.02 1.02 1.02 1.03 1.04 1.14 1.02 1.14 1.03 1.02 1.02 1.22
S 1.92 1.98 1.99 1.92 1.98 1.98 1.98 1.97 1.96 1.86 1.98 1.86 1.97 1.98 1.98 1.78
Total 1.92 1.98 1.99 1.92 1.98 1.98 1.98 1.97 1.96 1.86 1.98 1.86 1.97 1.98 1.98 1.78
Sum 3.00 3.00 3.00 3.00 3.00 3.00 3.00 3.00 3.00 3.00 3.00 3.00 3.00 3.00 3.00 3.00
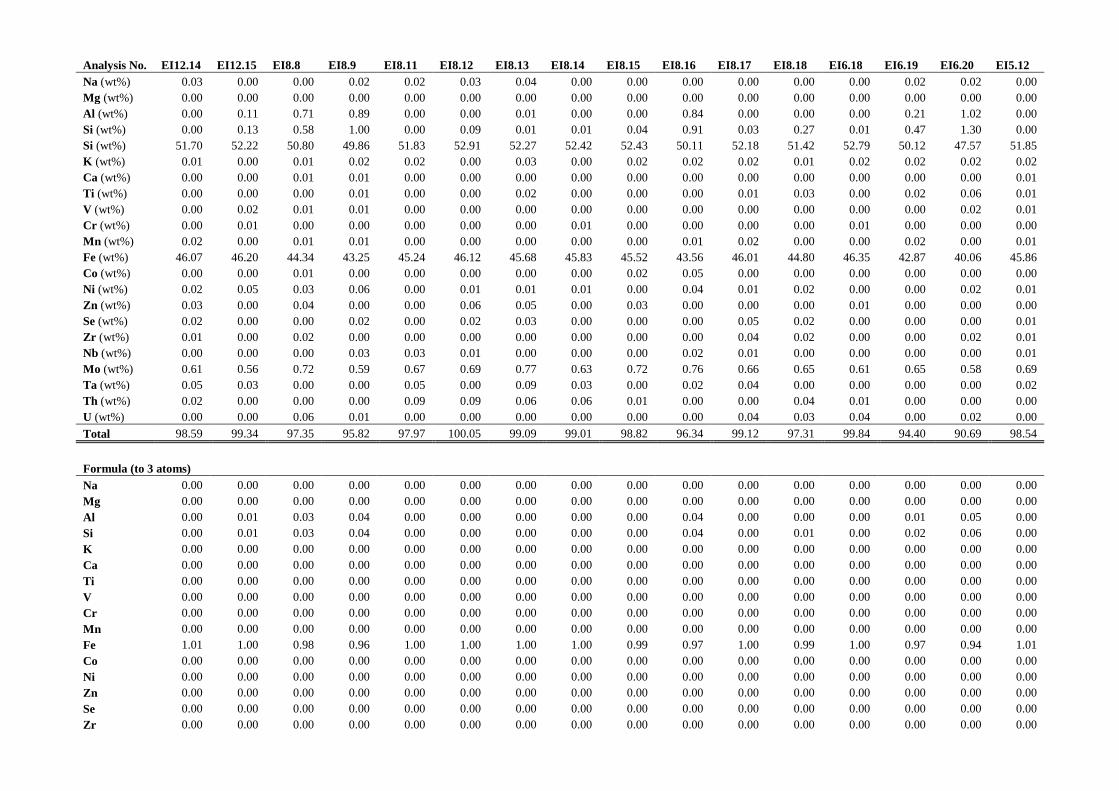
Analysis No. EI12.14 EI12.15 EI8.8 EI8.9 EI8.11 EI8.12 EI8.13 EI8.14 EI8.15 EI8.16 EI8.17 EI8.18 EI6.18 EI6.19 EI6.20 EI5.12
Na (wt%) 0.03 0.00 0.00 0.02 0.02 0.03 0.04 0.00 0.00 0.00 0.00 0.00 0.00 0.02 0.02 0.00
Mg (wt%) 0.00 0.00 0.00 0.00 0.00 0.00 0.00 0.00 0.00 0.00 0.00 0.00 0.00 0.00 0.00 0.00
Al (wt%) 0.00 0.11 0.71 0.89 0.00 0.00 0.01 0.00 0.00 0.84 0.00 0.00 0.00 0.21 1.02 0.00
Si (wt%) 0.00 0.13 0.58 1.00 0.00 0.09 0.01 0.01 0.04 0.91 0.03 0.27 0.01 0.47 1.30 0.00
Si (wt%) 51.70 52.22 50.80 49.86 51.83 52.91 52.27 52.42 52.43 50.11 52.18 51.42 52.79 50.12 47.57 51.85
K (wt%) 0.01 0.00 0.01 0.02 0.02 0.00 0.03 0.00 0.02 0.02 0.02 0.01 0.02 0.02 0.02 0.02
Ca (wt%) 0.00 0.00 0.01 0.01 0.00 0.00 0.00 0.00 0.00 0.00 0.00 0.00 0.00 0.00 0.00 0.01
Ti (wt%) 0.00 0.00 0.00 0.01 0.00 0.00 0.02 0.00 0.00 0.00 0.01 0.03 0.00 0.02 0.06 0.01
V (wt%) 0.00 0.02 0.01 0.01 0.00 0.00 0.00 0.00 0.00 0.00 0.00 0.00 0.00 0.00 0.02 0.01
Cr (wt%) 0.00 0.01 0.00 0.00 0.00 0.00 0.00 0.01 0.00 0.00 0.00 0.00 0.01 0.00 0.00 0.00
Mn (wt%) 0.02 0.00 0.01 0.01 0.00 0.00 0.00 0.00 0.00 0.01 0.02 0.00 0.00 0.02 0.00 0.01
Fe (wt%) 46.07 46.20 44.34 43.25 45.24 46.12 45.68 45.83 45.52 43.56 46.01 44.80 46.35 42.87 40.06 45.86
Co (wt%) 0.00 0.00 0.01 0.00 0.00 0.00 0.00 0.00 0.02 0.05 0.00 0.00 0.00 0.00 0.00 0.00
Ni (wt%) 0.02 0.05 0.03 0.06 0.00 0.01 0.01 0.01 0.00 0.04 0.01 0.02 0.00 0.00 0.02 0.01
Zn (wt%) 0.03 0.00 0.04 0.00 0.00 0.06 0.05 0.00 0.03 0.00 0.00 0.00 0.01 0.00 0.00 0.00
Se (wt%) 0.02 0.00 0.00 0.02 0.00 0.02 0.03 0.00 0.00 0.00 0.05 0.02 0.00 0.00 0.00 0.01
Zr (wt%) 0.01 0.00 0.02 0.00 0.00 0.00 0.00 0.00 0.00 0.00 0.04 0.02 0.00 0.00 0.02 0.01
Nb (wt%) 0.00 0.00 0.00 0.03 0.03 0.01 0.00 0.00 0.00 0.02 0.01 0.00 0.00 0.00 0.00 0.01
Mo (wt%) 0.61 0.56 0.72 0.59 0.67 0.69 0.77 0.63 0.72 0.76 0.66 0.65 0.61 0.65 0.58 0.69
Ta (wt%) 0.05 0.03 0.00 0.00 0.05 0.00 0.09 0.03 0.00 0.02 0.04 0.00 0.00 0.00 0.00 0.02
Th (wt%) 0.02 0.00 0.00 0.00 0.09 0.09 0.06 0.06 0.01 0.00 0.00 0.04 0.01 0.00 0.00 0.00
U (wt%) 0.00 0.00 0.06 0.01 0.00 0.00 0.00 0.00 0.00 0.00 0.04 0.03 0.04 0.00 0.02 0.00
Total 98.59 99.34 97.35 95.82 97.97 100.05 99.09 99.01 98.82 96.34 99.12 97.31 99.84 94.40 90.69 98.54
Formula (to 3 atoms)
Na 0.00 0.00 0.00 0.00 0.00 0.00 0.00 0.00 0.00 0.00 0.00 0.00 0.00 0.00 0.00 0.00
Mg 0.00 0.00 0.00 0.00 0.00 0.00 0.00 0.00 0.00 0.00 0.00 0.00 0.00 0.00 0.00 0.00
Al 0.00 0.01 0.03 0.04 0.00 0.00 0.00 0.00 0.00 0.04 0.00 0.00 0.00 0.01 0.05 0.00
Si 0.00 0.01 0.03 0.04 0.00 0.00 0.00 0.00 0.00 0.04 0.00 0.01 0.00 0.02 0.06 0.00
K 0.00 0.00 0.00 0.00 0.00 0.00 0.00 0.00 0.00 0.00 0.00 0.00 0.00 0.00 0.00 0.00
Ca 0.00 0.00 0.00 0.00 0.00 0.00 0.00 0.00 0.00 0.00 0.00 0.00 0.00 0.00 0.00 0.00
Ti 0.00 0.00 0.00 0.00 0.00 0.00 0.00 0.00 0.00 0.00 0.00 0.00 0.00 0.00 0.00 0.00
V 0.00 0.00 0.00 0.00 0.00 0.00 0.00 0.00 0.00 0.00 0.00 0.00 0.00 0.00 0.00 0.00
Cr 0.00 0.00 0.00 0.00 0.00 0.00 0.00 0.00 0.00 0.00 0.00 0.00 0.00 0.00 0.00 0.00
Mn 0.00 0.00 0.00 0.00 0.00 0.00 0.00 0.00 0.00 0.00 0.00 0.00 0.00 0.00 0.00 0.00
Fe 1.01 1.00 0.98 0.96 1.00 1.00 1.00 1.00 0.99 0.97 1.00 0.99 1.00 0.97 0.94 1.01
Co 0.00 0.00 0.00 0.00 0.00 0.00 0.00 0.00 0.00 0.00 0.00 0.00 0.00 0.00 0.00 0.00
Ni 0.00 0.00 0.00 0.00 0.00 0.00 0.00 0.00 0.00 0.00 0.00 0.00 0.00 0.00 0.00 0.00
Zn 0.00 0.00 0.00 0.00 0.00 0.00 0.00 0.00 0.00 0.00 0.00 0.00 0.00 0.00 0.00 0.00
Se 0.00 0.00 0.00 0.00 0.00 0.00 0.00 0.00 0.00 0.00 0.00 0.00 0.00 0.00 0.00 0.00
Zr 0.00 0.00 0.00 0.00 0.00 0.00 0.00 0.00 0.00 0.00 0.00 0.00 0.00 0.00 0.00 0.00

Nb 0.00 0.00 0.00 0.00 0.00 0.00 0.00 0.00 0.00 0.00 0.00 0.00 0.00 0.00 0.00 0.00
Mo 0.01 0.01 0.01 0.01 0.01 0.01 0.01 0.01 0.01 0.01 0.01 0.01 0.01 0.01 0.01 0.01
Ta 0.00 0.00 0.00 0.00 0.00 0.00 0.00 0.00 0.00 0.00 0.00 0.00 0.00 0.00 0.00 0.00
Th 0.00 0.00 0.00 0.00 0.00 0.00 0.00 0.00 0.00 0.00 0.00 0.00 0.00 0.00 0.00 0.00
U 0.00 0.00 0.00 0.00 0.00 0.00 0.00 0.00 0.00 0.00 0.00 0.00 0.00 0.00 0.00 0.00
Total 1.02 1.02 1.05 1.06 1.01 1.01 1.01 1.01 1.01 1.06 1.02 1.02 1.01 1.02 1.06 1.02
S 1.98 1.98 1.95 1.94 1.99 1.99 1.99 1.99 1.99 1.94 1.98 1.98 1.99 1.98 1.94 1.98
Total 1.98 1.98 1.95 1.94 1.99 1.99 1.99 1.99 1.99 1.94 1.98 1.98 1.99 1.98 1.94 1.98
Sum 3.00 3.00 3.00 3.00 3.00 3.00 3.00 3.00 3.00 3.00 3.00 3.00 3.00 3.00 3.00 3.00
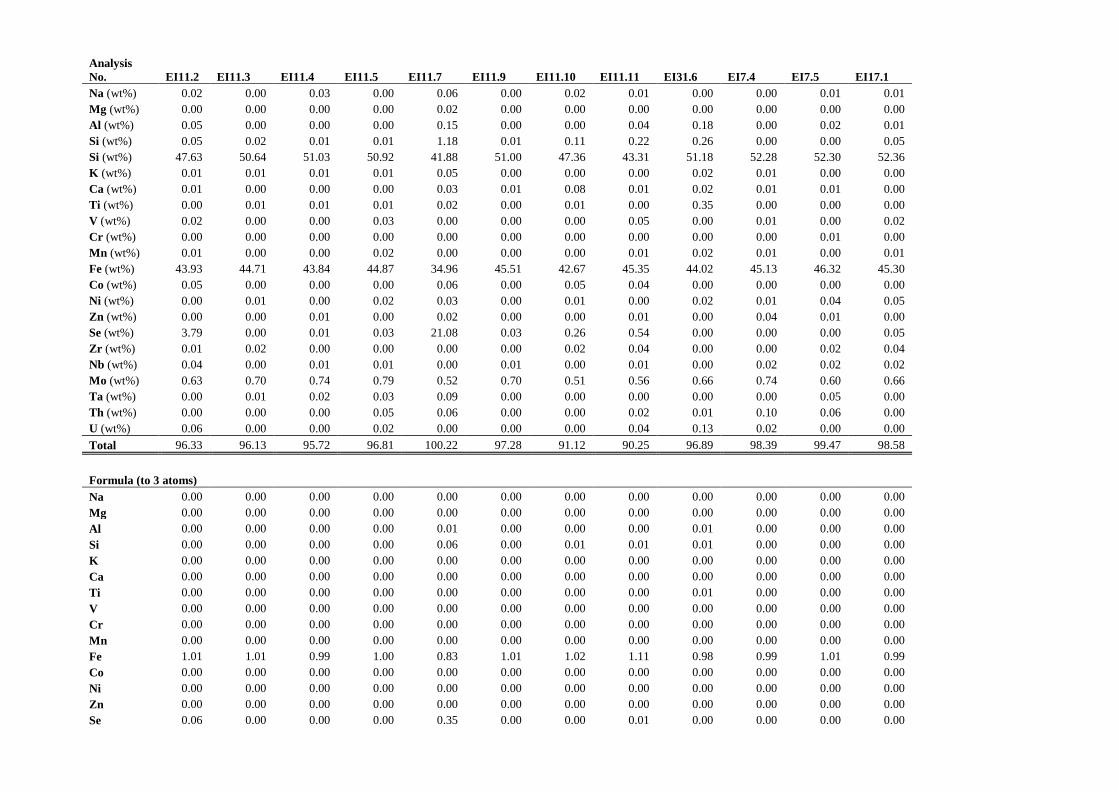
Analysis
No. EI11.2 EI11.3 EI11.4 EI11.5 EI11.7 EI11.9 EI11.10 EI11.11 EI31.6 EI7.4 EI7.5 EI17.1
Na (wt%) 0.02 0.00 0.03 0.00 0.06 0.00 0.02 0.01 0.00 0.00 0.01 0.01
Mg (wt%) 0.00 0.00 0.00 0.00 0.02 0.00 0.00 0.00 0.00 0.00 0.00 0.00
Al (wt%) 0.05 0.00 0.00 0.00 0.15 0.00 0.00 0.04 0.18 0.00 0.02 0.01
Si (wt%) 0.05 0.02 0.01 0.01 1.18 0.01 0.11 0.22 0.26 0.00 0.00 0.05
Si (wt%) 47.63 50.64 51.03 50.92 41.88 51.00 47.36 43.31 51.18 52.28 52.30 52.36
K (wt%) 0.01 0.01 0.01 0.01 0.05 0.00 0.00 0.00 0.02 0.01 0.00 0.00
Ca (wt%) 0.01 0.00 0.00 0.00 0.03 0.01 0.08 0.01 0.02 0.01 0.01 0.00
Ti (wt%) 0.00 0.01 0.01 0.01 0.02 0.00 0.01 0.00 0.35 0.00 0.00 0.00
V (wt%) 0.02 0.00 0.00 0.03 0.00 0.00 0.00 0.05 0.00 0.01 0.00 0.02
Cr (wt%) 0.00 0.00 0.00 0.00 0.00 0.00 0.00 0.00 0.00 0.00 0.01 0.00
Mn (wt%) 0.01 0.00 0.00 0.02 0.00 0.00 0.00 0.01 0.02 0.01 0.00 0.01
Fe (wt%) 43.93 44.71 43.84 44.87 34.96 45.51 42.67 45.35 44.02 45.13 46.32 45.30
Co (wt%) 0.05 0.00 0.00 0.00 0.06 0.00 0.05 0.04 0.00 0.00 0.00 0.00
Ni (wt%) 0.00 0.01 0.00 0.02 0.03 0.00 0.01 0.00 0.02 0.01 0.04 0.05
Zn (wt%) 0.00 0.00 0.01 0.00 0.02 0.00 0.00 0.01 0.00 0.04 0.01 0.00
Se (wt%) 3.79 0.00 0.01 0.03 21.08 0.03 0.26 0.54 0.00 0.00 0.00 0.05
Zr (wt%) 0.01 0.02 0.00 0.00 0.00 0.00 0.02 0.04 0.00 0.00 0.02 0.04
Nb (wt%) 0.04 0.00 0.01 0.01 0.00 0.01 0.00 0.01 0.00 0.02 0.02 0.02
Mo (wt%) 0.63 0.70 0.74 0.79 0.52 0.70 0.51 0.56 0.66 0.74 0.60 0.66
Ta (wt%) 0.00 0.01 0.02 0.03 0.09 0.00 0.00 0.00 0.00 0.00 0.05 0.00
Th (wt%) 0.00 0.00 0.00 0.05 0.06 0.00 0.00 0.02 0.01 0.10 0.06 0.00
U (wt%) 0.06 0.00 0.00 0.02 0.00 0.00 0.00 0.04 0.13 0.02 0.00 0.00
Total 96.33 96.13 95.72 96.81 100.22 97.28 91.12 90.25 96.89 98.39 99.47 98.58
Formula (to 3 atoms)
Na 0.00 0.00 0.00 0.00 0.00 0.00 0.00 0.00 0.00 0.00 0.00 0.00
Mg 0.00 0.00 0.00 0.00 0.00 0.00 0.00 0.00 0.00 0.00 0.00 0.00
Al 0.00 0.00 0.00 0.00 0.01 0.00 0.00 0.00 0.01 0.00 0.00 0.00
Si 0.00 0.00 0.00 0.00 0.06 0.00 0.01 0.01 0.01 0.00 0.00 0.00
K 0.00 0.00 0.00 0.00 0.00 0.00 0.00 0.00 0.00 0.00 0.00 0.00
Ca 0.00 0.00 0.00 0.00 0.00 0.00 0.00 0.00 0.00 0.00 0.00 0.00
Ti 0.00 0.00 0.00 0.00 0.00 0.00 0.00 0.00 0.01 0.00 0.00 0.00
V 0.00 0.00 0.00 0.00 0.00 0.00 0.00 0.00 0.00 0.00 0.00 0.00
Cr 0.00 0.00 0.00 0.00 0.00 0.00 0.00 0.00 0.00 0.00 0.00 0.00
Mn 0.00 0.00 0.00 0.00 0.00 0.00 0.00 0.00 0.00 0.00 0.00 0.00
Fe 1.01 1.01 0.99 1.00 0.83 1.01 1.02 1.11 0.98 0.99 1.01 0.99
Co 0.00 0.00 0.00 0.00 0.00 0.00 0.00 0.00 0.00 0.00 0.00 0.00
Ni 0.00 0.00 0.00 0.00 0.00 0.00 0.00 0.00 0.00 0.00 0.00 0.00
Zn 0.00 0.00 0.00 0.00 0.00 0.00 0.00 0.00 0.00 0.00 0.00 0.00
Se 0.06 0.00 0.00 0.00 0.35 0.00 0.00 0.01 0.00 0.00 0.00 0.00
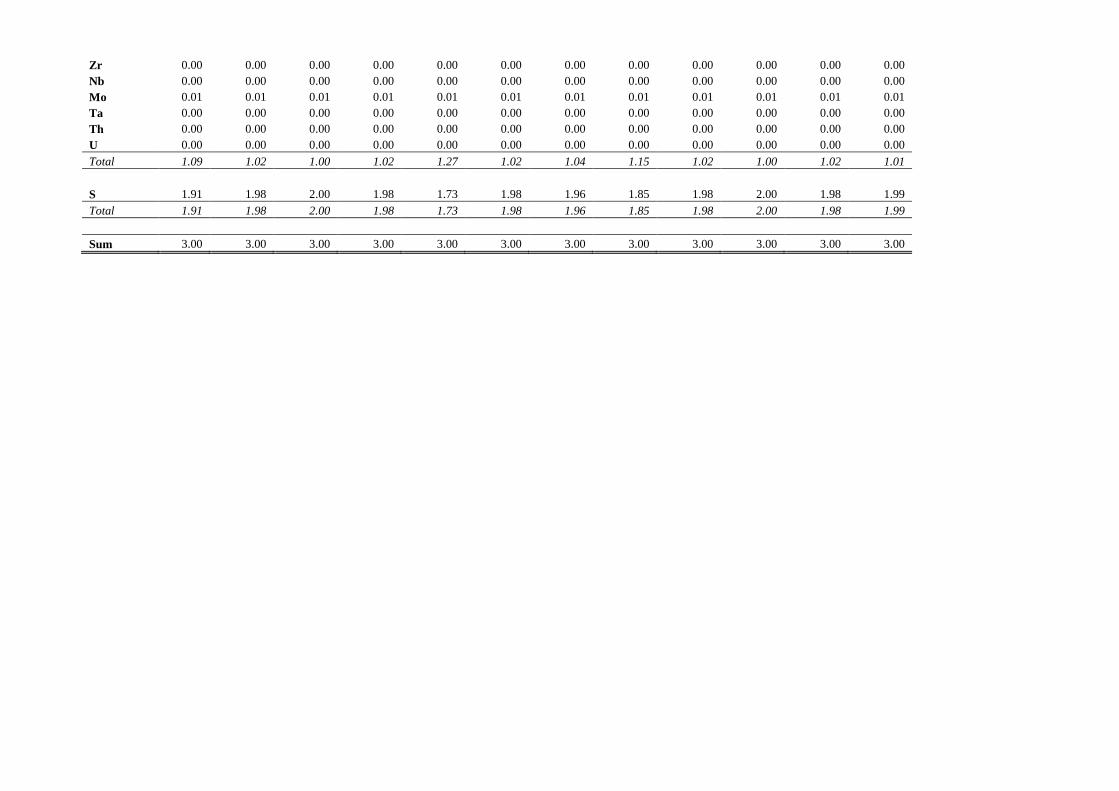
Zr 0.00 0.00 0.00 0.00 0.00 0.00 0.00 0.00 0.00 0.00 0.00 0.00
Nb 0.00 0.00 0.00 0.00 0.00 0.00 0.00 0.00 0.00 0.00 0.00 0.00
Mo 0.01 0.01 0.01 0.01 0.01 0.01 0.01 0.01 0.01 0.01 0.01 0.01
Ta 0.00 0.00 0.00 0.00 0.00 0.00 0.00 0.00 0.00 0.00 0.00 0.00
Th 0.00 0.00 0.00 0.00 0.00 0.00 0.00 0.00 0.00 0.00 0.00 0.00
U 0.00 0.00 0.00 0.00 0.00 0.00 0.00 0.00 0.00 0.00 0.00 0.00
Total 1.09 1.02 1.00 1.02 1.27 1.02 1.04 1.15 1.02 1.00 1.02 1.01
S 1.91 1.98 2.00 1.98 1.73 1.98 1.96 1.85 1.98 2.00 1.98 1.99
Total 1.91 1.98 2.00 1.98 1.73 1.98 1.96 1.85 1.98 2.00 1.98 1.99
Sum 3.00 3.00 3.00 3.00 3.00 3.00 3.00 3.00 3.00 3.00 3.00 3.00
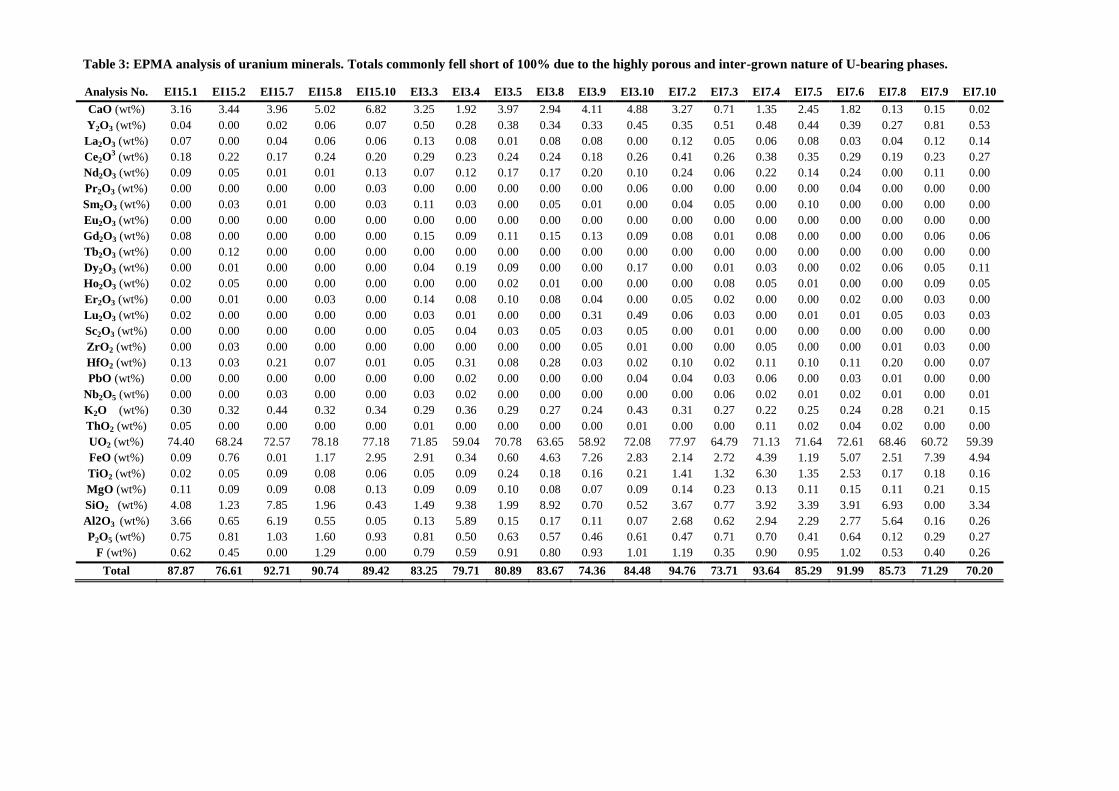
Table 3: EPMA analysis of uranium minerals. Totals commonly fell short of 100% due to the highly porous and inter-grown nature of U-bearing phases.
Analysis No. EI15.1 EI15.2 EI15.7 EI15.8 EI15.10 EI3.3 EI3.4 EI3.5 EI3.8 EI3.9 EI3.10 EI7.2 EI7.3 EI7.4 EI7.5 EI7.6 EI7.8 EI7.9 EI7.10
CaO (wt%) 3.16 3.44 3.96 5.02 6.82 3.25 1.92 3.97 2.94 4.11 4.88 3.27 0.71 1.35 2.45 1.82 0.13 0.15 0.02
Y2O3 (wt%) 0.04 0.00 0.02 0.06 0.07 0.50 0.28 0.38 0.34 0.33 0.45 0.35 0.51 0.48 0.44 0.39 0.27 0.81 0.53
La2O3 (wt%) 0.07 0.00 0.04 0.06 0.06 0.13 0.08 0.01 0.08 0.08 0.00 0.12 0.05 0.06 0.08 0.03 0.04 0.12 0.14
Ce2O3 (wt%) 0.18 0.22 0.17 0.24 0.20 0.29 0.23 0.24 0.24 0.18 0.26 0.41 0.26 0.38 0.35 0.29 0.19 0.23 0.27
Nd2O3 (wt%) 0.09 0.05 0.01 0.01 0.13 0.07 0.12 0.17 0.17 0.20 0.10 0.24 0.06 0.22 0.14 0.24 0.00 0.11 0.00
Pr2O3 (wt%) 0.00 0.00 0.00 0.00 0.03 0.00 0.00 0.00 0.00 0.00 0.06 0.00 0.00 0.00 0.00 0.04 0.00 0.00 0.00
Sm2O3 (wt%) 0.00 0.03 0.01 0.00 0.03 0.11 0.03 0.00 0.05 0.01 0.00 0.04 0.05 0.00 0.10 0.00 0.00 0.00 0.00
Eu2O3 (wt%) 0.00 0.00 0.00 0.00 0.00 0.00 0.00 0.00 0.00 0.00 0.00 0.00 0.00 0.00 0.00 0.00 0.00 0.00 0.00
Gd2O3 (wt%) 0.08 0.00 0.00 0.00 0.00 0.15 0.09 0.11 0.15 0.13 0.09 0.08 0.01 0.08 0.00 0.00 0.00 0.06 0.06
Tb2O3 (wt%) 0.00 0.12 0.00 0.00 0.00 0.00 0.00 0.00 0.00 0.00 0.00 0.00 0.00 0.00 0.00 0.00 0.00 0.00 0.00
Dy2O3 (wt%) 0.00 0.01 0.00 0.00 0.00 0.04 0.19 0.09 0.00 0.00 0.17 0.00 0.01 0.03 0.00 0.02 0.06 0.05 0.11
Ho2O3 (wt%) 0.02 0.05 0.00 0.00 0.00 0.00 0.00 0.02 0.01 0.00 0.00 0.00 0.08 0.05 0.01 0.00 0.00 0.09 0.05
Er2O3 (wt%) 0.00 0.01 0.00 0.03 0.00 0.14 0.08 0.10 0.08 0.04 0.00 0.05 0.02 0.00 0.00 0.02 0.00 0.03 0.00
Lu2O3 (wt%) 0.02 0.00 0.00 0.00 0.00 0.03 0.01 0.00 0.00 0.31 0.49 0.06 0.03 0.00 0.01 0.01 0.05 0.03 0.03
Sc2O3 (wt%) 0.00 0.00 0.00 0.00 0.00 0.05 0.04 0.03 0.05 0.03 0.05 0.00 0.01 0.00 0.00 0.00 0.00 0.00 0.00
ZrO2 (wt%) 0.00 0.03 0.00 0.00 0.00 0.00 0.00 0.00 0.00 0.05 0.01 0.00 0.00 0.05 0.00 0.00 0.01 0.03 0.00
HfO2 (wt%) 0.13 0.03 0.21 0.07 0.01 0.05 0.31 0.08 0.28 0.03 0.02 0.10 0.02 0.11 0.10 0.11 0.20 0.00 0.07
PbO (wt%) 0.00 0.00 0.00 0.00 0.00 0.00 0.02 0.00 0.00 0.00 0.04 0.04 0.03 0.06 0.00 0.03 0.01 0.00 0.00
Nb2O5 (wt%) 0.00 0.00 0.03 0.00 0.00 0.03 0.02 0.00 0.00 0.00 0.00 0.00 0.06 0.02 0.01 0.02 0.01 0.00 0.01
K2O (wt%) 0.30 0.32 0.44 0.32 0.34 0.29 0.36 0.29 0.27 0.24 0.43 0.31 0.27 0.22 0.25 0.24 0.28 0.21 0.15
ThO2 (wt%) 0.05 0.00 0.00 0.00 0.00 0.01 0.00 0.00 0.00 0.00 0.01 0.00 0.00 0.11 0.02 0.04 0.02 0.00 0.00
UO2 (wt%) 74.40 68.24 72.57 78.18 77.18 71.85 59.04 70.78 63.65 58.92 72.08 77.97 64.79 71.13 71.64 72.61 68.46 60.72 59.39
FeO (wt%) 0.09 0.76 0.01 1.17 2.95 2.91 0.34 0.60 4.63 7.26 2.83 2.14 2.72 4.39 1.19 5.07 2.51 7.39 4.94
TiO2 (wt%) 0.02 0.05 0.09 0.08 0.06 0.05 0.09 0.24 0.18 0.16 0.21 1.41 1.32 6.30 1.35 2.53 0.17 0.18 0.16
MgO (wt%) 0.11 0.09 0.09 0.08 0.13 0.09 0.09 0.10 0.08 0.07 0.09 0.14 0.23 0.13 0.11 0.15 0.11 0.21 0.15
SiO2 (wt%) 4.08 1.23 7.85 1.96 0.43 1.49 9.38 1.99 8.92 0.70 0.52 3.67 0.77 3.92 3.39 3.91 6.93 0.00 3.34
Al2O3 (wt%) 3.66 0.65 6.19 0.55 0.05 0.13 5.89 0.15 0.17 0.11 0.07 2.68 0.62 2.94 2.29 2.77 5.64 0.16 0.26
P2O5 (wt%) 0.75 0.81 1.03 1.60 0.93 0.81 0.50 0.63 0.57 0.46 0.61 0.47 0.71 0.70 0.41 0.64 0.12 0.29 0.27
F (wt%) 0.62 0.45 0.00 1.29 0.00 0.79 0.59 0.91 0.80 0.93 1.01 1.19 0.35 0.90 0.95 1.02 0.53 0.40 0.26
Total 87.87 76.61 92.71 90.74 89.42 83.25 79.71 80.89 83.67 74.36 84.48 94.76 73.71 93.64 85.29 91.99 85.73 71.29 70.20
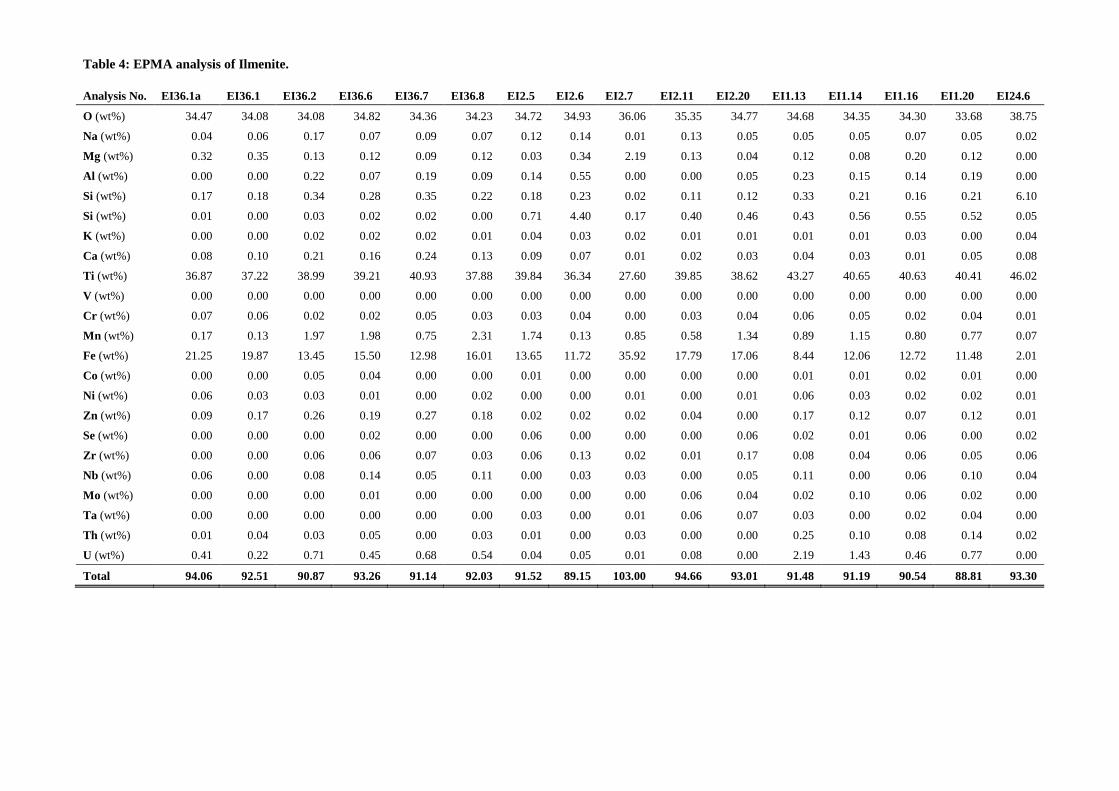
Table 4: EPMA analysis of Ilmenite.
Analysis No. EI36.1a EI36.1 EI36.2 EI36.6 EI36.7 EI36.8 EI2.5 EI2.6 EI2.7 EI2.11 EI2.20 EI1.13 EI1.14 EI1.16 EI1.20 EI24.6
O (wt%) 34.47 34.08 34.08 34.82 34.36 34.23 34.72 34.93 36.06 35.35 34.77 34.68 34.35 34.30 33.68 38.75
Na (wt%) 0.04 0.06 0.17 0.07 0.09 0.07 0.12 0.14 0.01 0.13 0.05 0.05 0.05 0.07 0.05 0.02
Mg (wt%) 0.32 0.35 0.13 0.12 0.09 0.12 0.03 0.34 2.19 0.13 0.04 0.12 0.08 0.20 0.12 0.00
Al (wt%) 0.00 0.00 0.22 0.07 0.19 0.09 0.14 0.55 0.00 0.00 0.05 0.23 0.15 0.14 0.19 0.00
Si (wt%) 0.17 0.18 0.34 0.28 0.35 0.22 0.18 0.23 0.02 0.11 0.12 0.33 0.21 0.16 0.21 6.10
Si (wt%) 0.01 0.00 0.03 0.02 0.02 0.00 0.71 4.40 0.17 0.40 0.46 0.43 0.56 0.55 0.52 0.05
K (wt%) 0.00 0.00 0.02 0.02 0.02 0.01 0.04 0.03 0.02 0.01 0.01 0.01 0.01 0.03 0.00 0.04
Ca (wt%) 0.08 0.10 0.21 0.16 0.24 0.13 0.09 0.07 0.01 0.02 0.03 0.04 0.03 0.01 0.05 0.08
Ti (wt%) 36.87 37.22 38.99 39.21 40.93 37.88 39.84 36.34 27.60 39.85 38.62 43.27 40.65 40.63 40.41 46.02
V (wt%) 0.00 0.00 0.00 0.00 0.00 0.00 0.00 0.00 0.00 0.00 0.00 0.00 0.00 0.00 0.00 0.00
Cr (wt%) 0.07 0.06 0.02 0.02 0.05 0.03 0.03 0.04 0.00 0.03 0.04 0.06 0.05 0.02 0.04 0.01
Mn (wt%) 0.17 0.13 1.97 1.98 0.75 2.31 1.74 0.13 0.85 0.58 1.34 0.89 1.15 0.80 0.77 0.07
Fe (wt%) 21.25 19.87 13.45 15.50 12.98 16.01 13.65 11.72 35.92 17.79 17.06 8.44 12.06 12.72 11.48 2.01
Co (wt%) 0.00 0.00 0.05 0.04 0.00 0.00 0.01 0.00 0.00 0.00 0.00 0.01 0.01 0.02 0.01 0.00
Ni (wt%) 0.06 0.03 0.03 0.01 0.00 0.02 0.00 0.00 0.01 0.00 0.01 0.06 0.03 0.02 0.02 0.01
Zn (wt%) 0.09 0.17 0.26 0.19 0.27 0.18 0.02 0.02 0.02 0.04 0.00 0.17 0.12 0.07 0.12 0.01
Se (wt%) 0.00 0.00 0.00 0.02 0.00 0.00 0.06 0.00 0.00 0.00 0.06 0.02 0.01 0.06 0.00 0.02
Zr (wt%) 0.00 0.00 0.06 0.06 0.07 0.03 0.06 0.13 0.02 0.01 0.17 0.08 0.04 0.06 0.05 0.06
Nb (wt%) 0.06 0.00 0.08 0.14 0.05 0.11 0.00 0.03 0.03 0.00 0.05 0.11 0.00 0.06 0.10 0.04
Mo (wt%) 0.00 0.00 0.00 0.01 0.00 0.00 0.00 0.00 0.00 0.06 0.04 0.02 0.10 0.06 0.02 0.00
Ta (wt%) 0.00 0.00 0.00 0.00 0.00 0.00 0.03 0.00 0.01 0.06 0.07 0.03 0.00 0.02 0.04 0.00
Th (wt%) 0.01 0.04 0.03 0.05 0.00 0.03 0.01 0.00 0.03 0.00 0.00 0.25 0.10 0.08 0.14 0.02
U (wt%) 0.41 0.22 0.71 0.45 0.68 0.54 0.04 0.05 0.01 0.08 0.00 2.19 1.43 0.46 0.77 0.00
Total 94.06 92.51 90.87 93.26 91.14 92.03 91.52 89.15 103.00 94.66 93.01 91.48 91.19 90.54 88.81 93.30
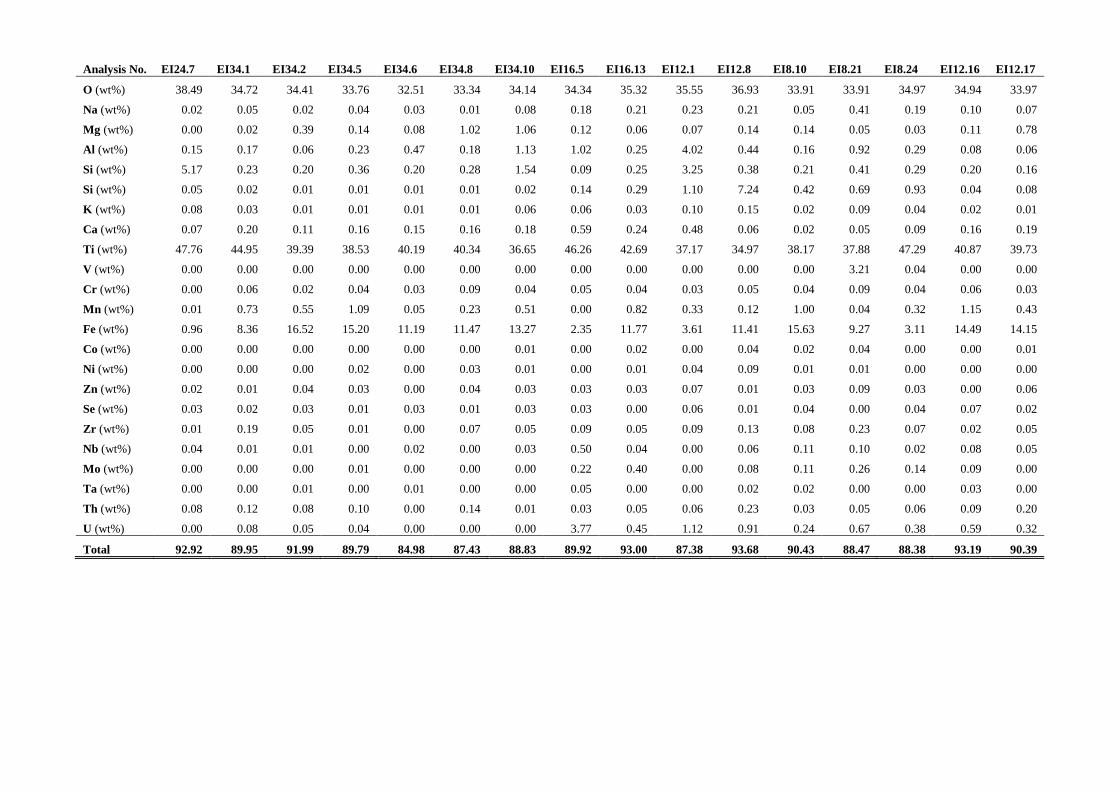
Analysis No. EI24.7 EI34.1 EI34.2 EI34.5 EI34.6 EI34.8 EI34.10 EI16.5 EI16.13 EI12.1 EI12.8 EI8.10 EI8.21 EI8.24 EI12.16 EI12.17
O (wt%) 38.49 34.72 34.41 33.76 32.51 33.34 34.14 34.34 35.32 35.55 36.93 33.91 33.91 34.97 34.94 33.97
Na (wt%) 0.02 0.05 0.02 0.04 0.03 0.01 0.08 0.18 0.21 0.23 0.21 0.05 0.41 0.19 0.10 0.07
Mg (wt%) 0.00 0.02 0.39 0.14 0.08 1.02 1.06 0.12 0.06 0.07 0.14 0.14 0.05 0.03 0.11 0.78
Al (wt%) 0.15 0.17 0.06 0.23 0.47 0.18 1.13 1.02 0.25 4.02 0.44 0.16 0.92 0.29 0.08 0.06
Si (wt%) 5.17 0.23 0.20 0.36 0.20 0.28 1.54 0.09 0.25 3.25 0.38 0.21 0.41 0.29 0.20 0.16
Si (wt%) 0.05 0.02 0.01 0.01 0.01 0.01 0.02 0.14 0.29 1.10 7.24 0.42 0.69 0.93 0.04 0.08
K (wt%) 0.08 0.03 0.01 0.01 0.01 0.01 0.06 0.06 0.03 0.10 0.15 0.02 0.09 0.04 0.02 0.01
Ca (wt%) 0.07 0.20 0.11 0.16 0.15 0.16 0.18 0.59 0.24 0.48 0.06 0.02 0.05 0.09 0.16 0.19
Ti (wt%) 47.76 44.95 39.39 38.53 40.19 40.34 36.65 46.26 42.69 37.17 34.97 38.17 37.88 47.29 40.87 39.73
V (wt%) 0.00 0.00 0.00 0.00 0.00 0.00 0.00 0.00 0.00 0.00 0.00 0.00 3.21 0.04 0.00 0.00
Cr (wt%) 0.00 0.06 0.02 0.04 0.03 0.09 0.04 0.05 0.04 0.03 0.05 0.04 0.09 0.04 0.06 0.03
Mn (wt%) 0.01 0.73 0.55 1.09 0.05 0.23 0.51 0.00 0.82 0.33 0.12 1.00 0.04 0.32 1.15 0.43
Fe (wt%) 0.96 8.36 16.52 15.20 11.19 11.47 13.27 2.35 11.77 3.61 11.41 15.63 9.27 3.11 14.49 14.15
Co (wt%) 0.00 0.00 0.00 0.00 0.00 0.00 0.01 0.00 0.02 0.00 0.04 0.02 0.04 0.00 0.00 0.01
Ni (wt%) 0.00 0.00 0.00 0.02 0.00 0.03 0.01 0.00 0.01 0.04 0.09 0.01 0.01 0.00 0.00 0.00
Zn (wt%) 0.02 0.01 0.04 0.03 0.00 0.04 0.03 0.03 0.03 0.07 0.01 0.03 0.09 0.03 0.00 0.06
Se (wt%) 0.03 0.02 0.03 0.01 0.03 0.01 0.03 0.03 0.00 0.06 0.01 0.04 0.00 0.04 0.07 0.02
Zr (wt%) 0.01 0.19 0.05 0.01 0.00 0.07 0.05 0.09 0.05 0.09 0.13 0.08 0.23 0.07 0.02 0.05
Nb (wt%) 0.04 0.01 0.01 0.00 0.02 0.00 0.03 0.50 0.04 0.00 0.06 0.11 0.10 0.02 0.08 0.05
Mo (wt%) 0.00 0.00 0.00 0.01 0.00 0.00 0.00 0.22 0.40 0.00 0.08 0.11 0.26 0.14 0.09 0.00
Ta (wt%) 0.00 0.00 0.01 0.00 0.01 0.00 0.00 0.05 0.00 0.00 0.02 0.02 0.00 0.00 0.03 0.00
Th (wt%) 0.08 0.12 0.08 0.10 0.00 0.14 0.01 0.03 0.05 0.06 0.23 0.03 0.05 0.06 0.09 0.20
U (wt%) 0.00 0.08 0.05 0.04 0.00 0.00 0.00 3.77 0.45 1.12 0.91 0.24 0.67 0.38 0.59 0.32
Total 92.92 89.95 91.99 89.79 84.98 87.43 88.83 89.92 93.00 87.38 93.68 90.43 88.47 88.38 93.19 90.39
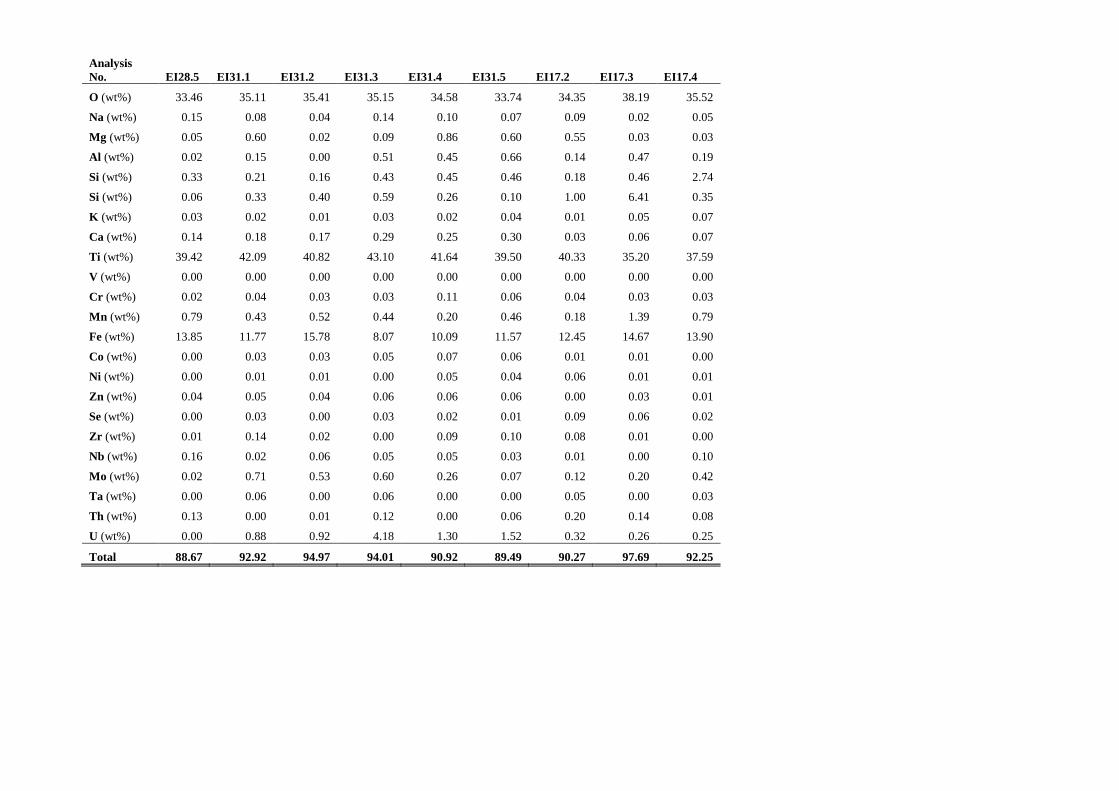
Analysis
No. EI28.5 EI31.1 EI31.2 EI31.3 EI31.4 EI31.5 EI17.2 EI17.3 EI17.4
O (wt%) 33.46 35.11 35.41 35.15 34.58 33.74 34.35 38.19 35.52
Na (wt%) 0.15 0.08 0.04 0.14 0.10 0.07 0.09 0.02 0.05
Mg (wt%) 0.05 0.60 0.02 0.09 0.86 0.60 0.55 0.03 0.03
Al (wt%) 0.02 0.15 0.00 0.51 0.45 0.66 0.14 0.47 0.19
Si (wt%) 0.33 0.21 0.16 0.43 0.45 0.46 0.18 0.46 2.74
Si (wt%) 0.06 0.33 0.40 0.59 0.26 0.10 1.00 6.41 0.35
K (wt%) 0.03 0.02 0.01 0.03 0.02 0.04 0.01 0.05 0.07
Ca (wt%) 0.14 0.18 0.17 0.29 0.25 0.30 0.03 0.06 0.07
Ti (wt%) 39.42 42.09 40.82 43.10 41.64 39.50 40.33 35.20 37.59
V (wt%) 0.00 0.00 0.00 0.00 0.00 0.00 0.00 0.00 0.00
Cr (wt%) 0.02 0.04 0.03 0.03 0.11 0.06 0.04 0.03 0.03
Mn (wt%) 0.79 0.43 0.52 0.44 0.20 0.46 0.18 1.39 0.79
Fe (wt%) 13.85 11.77 15.78 8.07 10.09 11.57 12.45 14.67 13.90
Co (wt%) 0.00 0.03 0.03 0.05 0.07 0.06 0.01 0.01 0.00
Ni (wt%) 0.00 0.01 0.01 0.00 0.05 0.04 0.06 0.01 0.01
Zn (wt%) 0.04 0.05 0.04 0.06 0.06 0.06 0.00 0.03 0.01
Se (wt%) 0.00 0.03 0.00 0.03 0.02 0.01 0.09 0.06 0.02
Zr (wt%) 0.01 0.14 0.02 0.00 0.09 0.10 0.08 0.01 0.00
Nb (wt%) 0.16 0.02 0.06 0.05 0.05 0.03 0.01 0.00 0.10
Mo (wt%) 0.02 0.71 0.53 0.60 0.26 0.07 0.12 0.20 0.42
Ta (wt%) 0.00 0.06 0.00 0.06 0.00 0.00 0.05 0.00 0.03
Th (wt%) 0.13 0.00 0.01 0.12 0.00 0.06 0.20 0.14 0.08
U (wt%) 0.00 0.88 0.92 4.18 1.30 1.52 0.32 0.26 0.25
Total 88.67 92.92 94.97 94.01 90.92 89.49 90.27 97.69 92.25
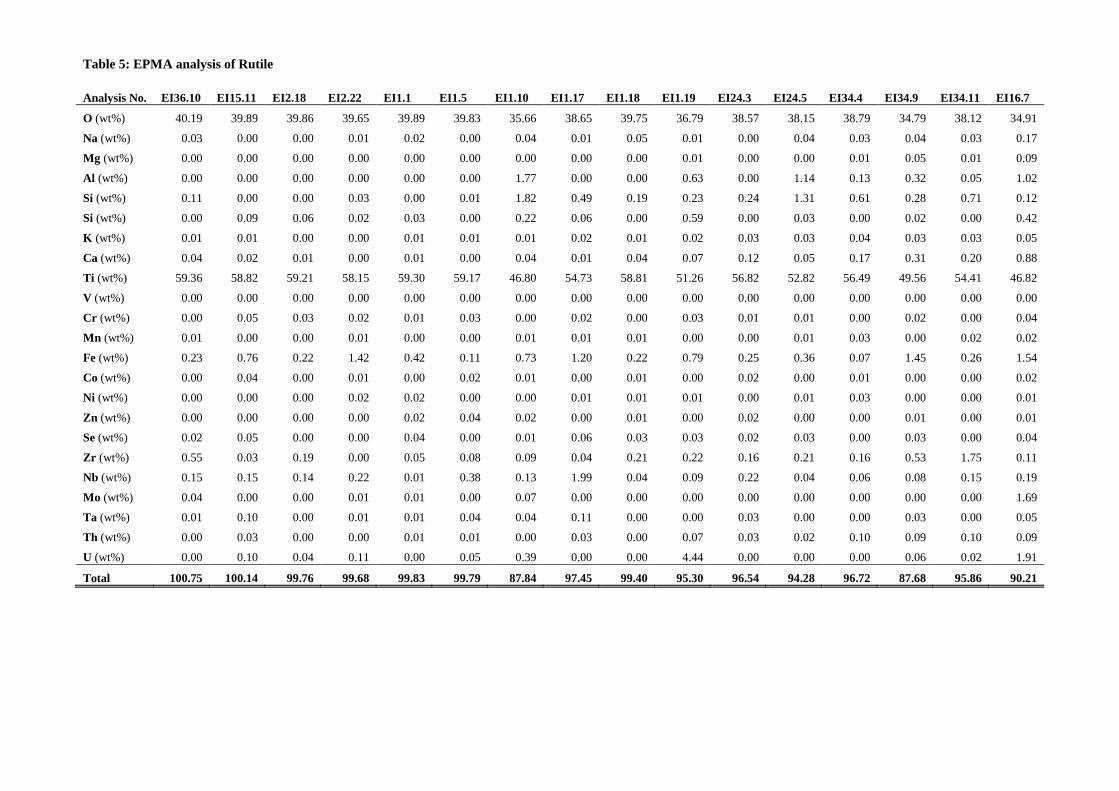
Table 5: EPMA analysis of Rutile
Analysis No. EI36.10 EI15.11 EI2.18 EI2.22 EI1.1 EI1.5 EI1.10 EI1.17 EI1.18 EI1.19 EI24.3 EI24.5 EI34.4 EI34.9 EI34.11 EI16.7
O (wt%) 40.19 39.89 39.86 39.65 39.89 39.83 35.66 38.65 39.75 36.79 38.57 38.15 38.79 34.79 38.12 34.91
Na (wt%) 0.03 0.00 0.00 0.01 0.02 0.00 0.04 0.01 0.05 0.01 0.00 0.04 0.03 0.04 0.03 0.17
Mg (wt%) 0.00 0.00 0.00 0.00 0.00 0.00 0.00 0.00 0.00 0.01 0.00 0.00 0.01 0.05 0.01 0.09
Al (wt%) 0.00 0.00 0.00 0.00 0.00 0.00 1.77 0.00 0.00 0.63 0.00 1.14 0.13 0.32 0.05 1.02
Si (wt%) 0.11 0.00 0.00 0.03 0.00 0.01 1.82 0.49 0.19 0.23 0.24 1.31 0.61 0.28 0.71 0.12
Si (wt%) 0.00 0.09 0.06 0.02 0.03 0.00 0.22 0.06 0.00 0.59 0.00 0.03 0.00 0.02 0.00 0.42
K (wt%) 0.01 0.01 0.00 0.00 0.01 0.01 0.01 0.02 0.01 0.02 0.03 0.03 0.04 0.03 0.03 0.05
Ca (wt%) 0.04 0.02 0.01 0.00 0.01 0.00 0.04 0.01 0.04 0.07 0.12 0.05 0.17 0.31 0.20 0.88
Ti (wt%) 59.36 58.82 59.21 58.15 59.30 59.17 46.80 54.73 58.81 51.26 56.82 52.82 56.49 49.56 54.41 46.82
V (wt%) 0.00 0.00 0.00 0.00 0.00 0.00 0.00 0.00 0.00 0.00 0.00 0.00 0.00 0.00 0.00 0.00
Cr (wt%) 0.00 0.05 0.03 0.02 0.01 0.03 0.00 0.02 0.00 0.03 0.01 0.01 0.00 0.02 0.00 0.04
Mn (wt%) 0.01 0.00 0.00 0.01 0.00 0.00 0.01 0.01 0.01 0.00 0.00 0.01 0.03 0.00 0.02 0.02
Fe (wt%) 0.23 0.76 0.22 1.42 0.42 0.11 0.73 1.20 0.22 0.79 0.25 0.36 0.07 1.45 0.26 1.54
Co (wt%) 0.00 0.04 0.00 0.01 0.00 0.02 0.01 0.00 0.01 0.00 0.02 0.00 0.01 0.00 0.00 0.02
Ni (wt%) 0.00 0.00 0.00 0.02 0.02 0.00 0.00 0.01 0.01 0.01 0.00 0.01 0.03 0.00 0.00 0.01
Zn (wt%) 0.00 0.00 0.00 0.00 0.02 0.04 0.02 0.00 0.01 0.00 0.02 0.00 0.00 0.01 0.00 0.01
Se (wt%) 0.02 0.05 0.00 0.00 0.04 0.00 0.01 0.06 0.03 0.03 0.02 0.03 0.00 0.03 0.00 0.04
Zr (wt%) 0.55 0.03 0.19 0.00 0.05 0.08 0.09 0.04 0.21 0.22 0.16 0.21 0.16 0.53 1.75 0.11
Nb (wt%) 0.15 0.15 0.14 0.22 0.01 0.38 0.13 1.99 0.04 0.09 0.22 0.04 0.06 0.08 0.15 0.19
Mo (wt%) 0.04 0.00 0.00 0.01 0.01 0.00 0.07 0.00 0.00 0.00 0.00 0.00 0.00 0.00 0.00 1.69
Ta (wt%) 0.01 0.10 0.00 0.01 0.01 0.04 0.04 0.11 0.00 0.00 0.03 0.00 0.00 0.03 0.00 0.05
Th (wt%) 0.00 0.03 0.00 0.00 0.01 0.01 0.00 0.03 0.00 0.07 0.03 0.02 0.10 0.09 0.10 0.09
U (wt%) 0.00 0.10 0.04 0.11 0.00 0.05 0.39 0.00 0.00 4.44 0.00 0.00 0.00 0.06 0.02 1.91
Total 100.75 100.14 99.76 99.68 99.83 99.79 87.84 97.45 99.40 95.30 96.54 94.28 96.72 87.68 95.86 90.21
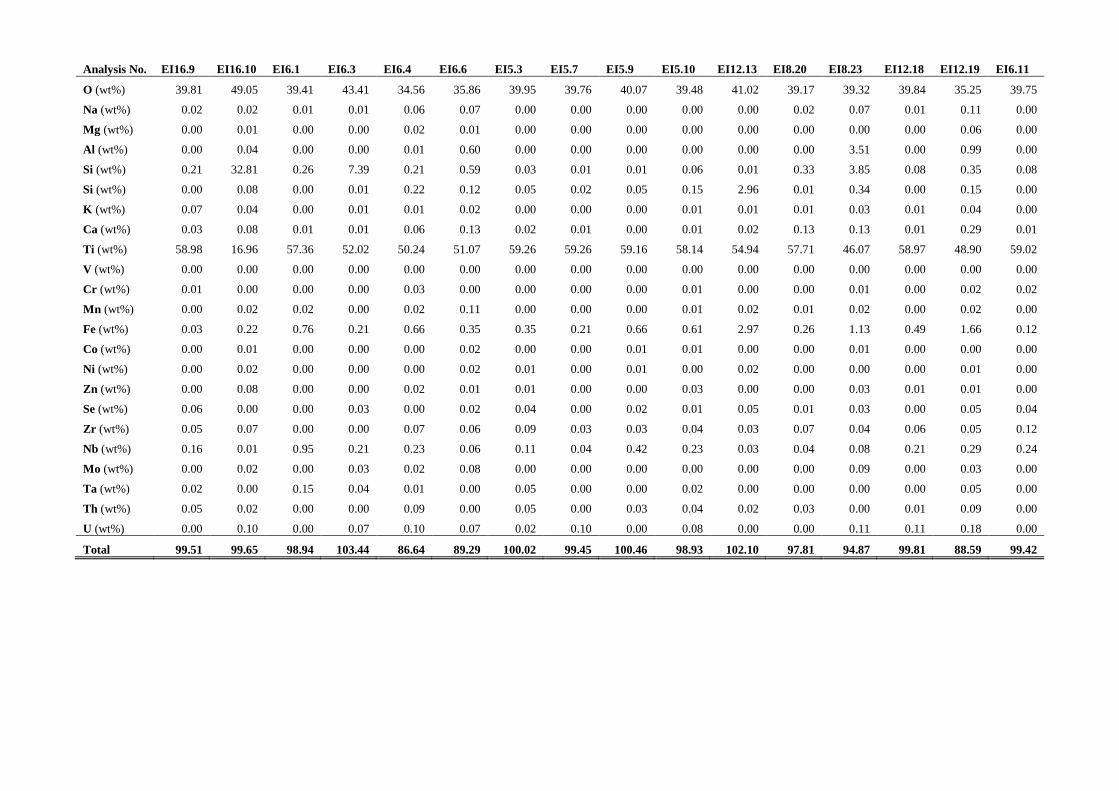
Analysis No. EI16.9 EI16.10 EI6.1 EI6.3 EI6.4 EI6.6 EI5.3 EI5.7 EI5.9 EI5.10 EI12.13 EI8.20 EI8.23 EI12.18 EI12.19 EI6.11
O (wt%) 39.81 49.05 39.41 43.41 34.56 35.86 39.95 39.76 40.07 39.48 41.02 39.17 39.32 39.84 35.25 39.75
Na (wt%) 0.02 0.02 0.01 0.01 0.06 0.07 0.00 0.00 0.00 0.00 0.00 0.02 0.07 0.01 0.11 0.00
Mg (wt%) 0.00 0.01 0.00 0.00 0.02 0.01 0.00 0.00 0.00 0.00 0.00 0.00 0.00 0.00 0.06 0.00
Al (wt%) 0.00 0.04 0.00 0.00 0.01 0.60 0.00 0.00 0.00 0.00 0.00 0.00 3.51 0.00 0.99 0.00
Si (wt%) 0.21 32.81 0.26 7.39 0.21 0.59 0.03 0.01 0.01 0.06 0.01 0.33 3.85 0.08 0.35 0.08
Si (wt%) 0.00 0.08 0.00 0.01 0.22 0.12 0.05 0.02 0.05 0.15 2.96 0.01 0.34 0.00 0.15 0.00
K (wt%) 0.07 0.04 0.00 0.01 0.01 0.02 0.00 0.00 0.00 0.01 0.01 0.01 0.03 0.01 0.04 0.00
Ca (wt%) 0.03 0.08 0.01 0.01 0.06 0.13 0.02 0.01 0.00 0.01 0.02 0.13 0.13 0.01 0.29 0.01
Ti (wt%) 58.98 16.96 57.36 52.02 50.24 51.07 59.26 59.26 59.16 58.14 54.94 57.71 46.07 58.97 48.90 59.02
V (wt%) 0.00 0.00 0.00 0.00 0.00 0.00 0.00 0.00 0.00 0.00 0.00 0.00 0.00 0.00 0.00 0.00
Cr (wt%) 0.01 0.00 0.00 0.00 0.03 0.00 0.00 0.00 0.00 0.01 0.00 0.00 0.01 0.00 0.02 0.02
Mn (wt%) 0.00 0.02 0.02 0.00 0.02 0.11 0.00 0.00 0.00 0.01 0.02 0.01 0.02 0.00 0.02 0.00
Fe (wt%) 0.03 0.22 0.76 0.21 0.66 0.35 0.35 0.21 0.66 0.61 2.97 0.26 1.13 0.49 1.66 0.12
Co (wt%) 0.00 0.01 0.00 0.00 0.00 0.02 0.00 0.00 0.01 0.01 0.00 0.00 0.01 0.00 0.00 0.00
Ni (wt%) 0.00 0.02 0.00 0.00 0.00 0.02 0.01 0.00 0.01 0.00 0.02 0.00 0.00 0.00 0.01 0.00
Zn (wt%) 0.00 0.08 0.00 0.00 0.02 0.01 0.01 0.00 0.00 0.03 0.00 0.00 0.03 0.01 0.01 0.00
Se (wt%) 0.06 0.00 0.00 0.03 0.00 0.02 0.04 0.00 0.02 0.01 0.05 0.01 0.03 0.00 0.05 0.04
Zr (wt%) 0.05 0.07 0.00 0.00 0.07 0.06 0.09 0.03 0.03 0.04 0.03 0.07 0.04 0.06 0.05 0.12
Nb (wt%) 0.16 0.01 0.95 0.21 0.23 0.06 0.11 0.04 0.42 0.23 0.03 0.04 0.08 0.21 0.29 0.24
Mo (wt%) 0.00 0.02 0.00 0.03 0.02 0.08 0.00 0.00 0.00 0.00 0.00 0.00 0.09 0.00 0.03 0.00
Ta (wt%) 0.02 0.00 0.15 0.04 0.01 0.00 0.05 0.00 0.00 0.02 0.00 0.00 0.00 0.00 0.05 0.00
Th (wt%) 0.05 0.02 0.00 0.00 0.09 0.00 0.05 0.00 0.03 0.04 0.02 0.03 0.00 0.01 0.09 0.00
U (wt%) 0.00 0.10 0.00 0.07 0.10 0.07 0.02 0.10 0.00 0.08 0.00 0.00 0.11 0.11 0.18 0.00
Total 99.51 99.65 98.94 103.44 86.64 89.29 100.02 99.45 100.46 98.93 102.10 97.81 94.87 99.81 88.59 99.42
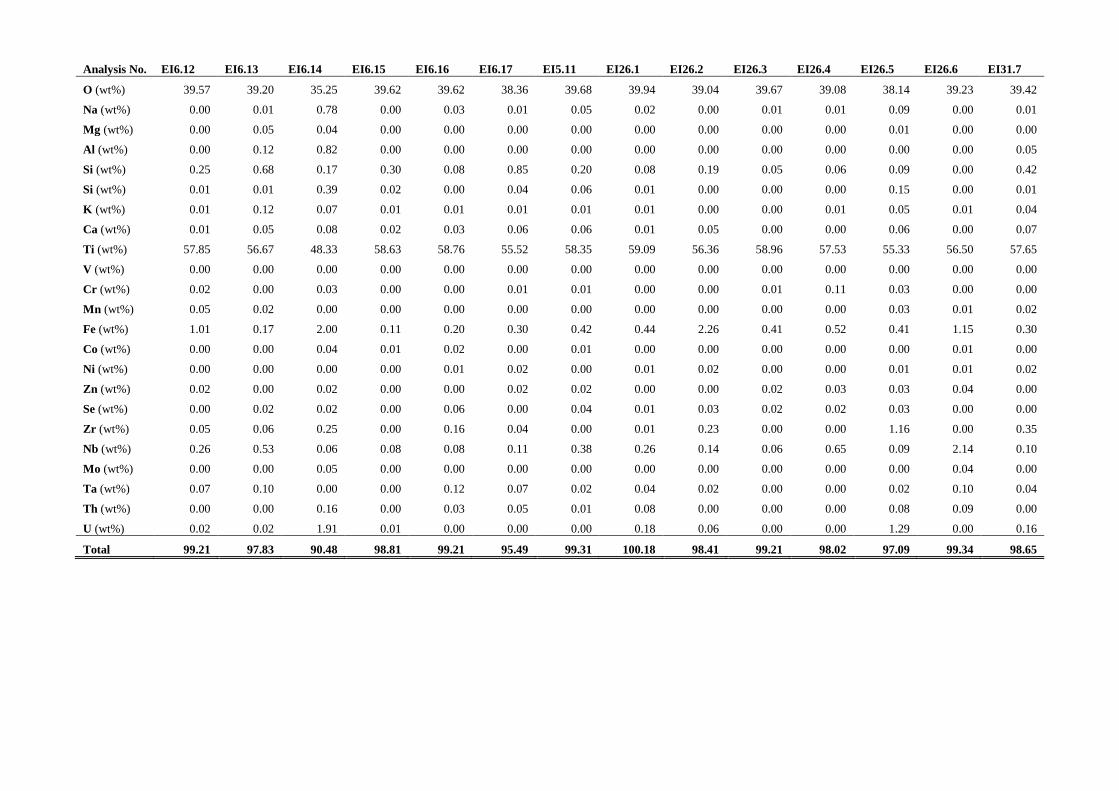
Analysis No. EI6.12 EI6.13 EI6.14 EI6.15 EI6.16 EI6.17 EI5.11 EI26.1 EI26.2 EI26.3 EI26.4 EI26.5 EI26.6 EI31.7
O (wt%) 39.57 39.20 35.25 39.62 39.62 38.36 39.68 39.94 39.04 39.67 39.08 38.14 39.23 39.42
Na (wt%) 0.00 0.01 0.78 0.00 0.03 0.01 0.05 0.02 0.00 0.01 0.01 0.09 0.00 0.01
Mg (wt%) 0.00 0.05 0.04 0.00 0.00 0.00 0.00 0.00 0.00 0.00 0.00 0.01 0.00 0.00
Al (wt%) 0.00 0.12 0.82 0.00 0.00 0.00 0.00 0.00 0.00 0.00 0.00 0.00 0.00 0.05
Si (wt%) 0.25 0.68 0.17 0.30 0.08 0.85 0.20 0.08 0.19 0.05 0.06 0.09 0.00 0.42
Si (wt%) 0.01 0.01 0.39 0.02 0.00 0.04 0.06 0.01 0.00 0.00 0.00 0.15 0.00 0.01
K (wt%) 0.01 0.12 0.07 0.01 0.01 0.01 0.01 0.01 0.00 0.00 0.01 0.05 0.01 0.04
Ca (wt%) 0.01 0.05 0.08 0.02 0.03 0.06 0.06 0.01 0.05 0.00 0.00 0.06 0.00 0.07
Ti (wt%) 57.85 56.67 48.33 58.63 58.76 55.52 58.35 59.09 56.36 58.96 57.53 55.33 56.50 57.65
V (wt%) 0.00 0.00 0.00 0.00 0.00 0.00 0.00 0.00 0.00 0.00 0.00 0.00 0.00 0.00
Cr (wt%) 0.02 0.00 0.03 0.00 0.00 0.01 0.01 0.00 0.00 0.01 0.11 0.03 0.00 0.00
Mn (wt%) 0.05 0.02 0.00 0.00 0.00 0.00 0.00 0.00 0.00 0.00 0.00 0.03 0.01 0.02
Fe (wt%) 1.01 0.17 2.00 0.11 0.20 0.30 0.42 0.44 2.26 0.41 0.52 0.41 1.15 0.30
Co (wt%) 0.00 0.00 0.04 0.01 0.02 0.00 0.01 0.00 0.00 0.00 0.00 0.00 0.01 0.00
Ni (wt%) 0.00 0.00 0.00 0.00 0.01 0.02 0.00 0.01 0.02 0.00 0.00 0.01 0.01 0.02
Zn (wt%) 0.02 0.00 0.02 0.00 0.00 0.02 0.02 0.00 0.00 0.02 0.03 0.03 0.04 0.00
Se (wt%) 0.00 0.02 0.02 0.00 0.06 0.00 0.04 0.01 0.03 0.02 0.02 0.03 0.00 0.00
Zr (wt%) 0.05 0.06 0.25 0.00 0.16 0.04 0.00 0.01 0.23 0.00 0.00 1.16 0.00 0.35
Nb (wt%) 0.26 0.53 0.06 0.08 0.08 0.11 0.38 0.26 0.14 0.06 0.65 0.09 2.14 0.10
Mo (wt%) 0.00 0.00 0.05 0.00 0.00 0.00 0.00 0.00 0.00 0.00 0.00 0.00 0.04 0.00
Ta (wt%) 0.07 0.10 0.00 0.00 0.12 0.07 0.02 0.04 0.02 0.00 0.00 0.02 0.10 0.04
Th (wt%) 0.00 0.00 0.16 0.00 0.03 0.05 0.01 0.08 0.00 0.00 0.00 0.08 0.09 0.00
U (wt%) 0.02 0.02 1.91 0.01 0.00 0.00 0.00 0.18 0.06 0.00 0.00 1.29 0.00 0.16
Total 99.21 97.83 90.48 98.81 99.21 95.49 99.31 100.18 98.41 99.21 98.02 97.09 99.34 98.65
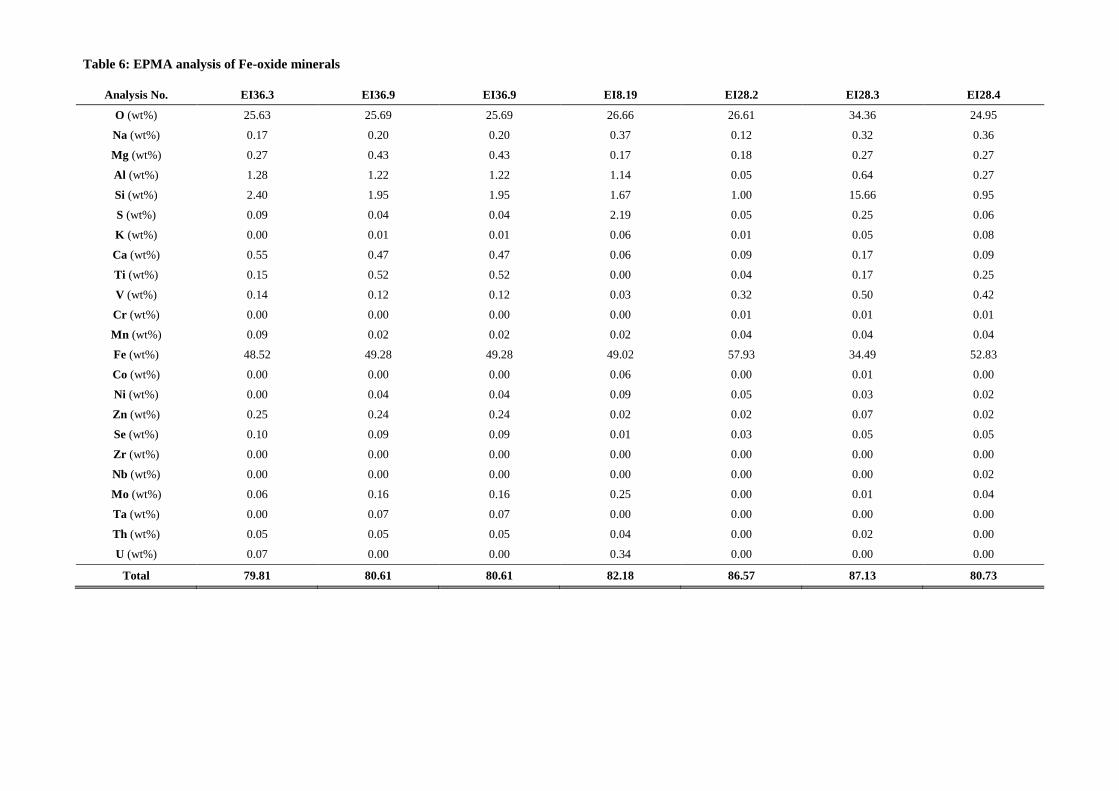
Table 6: EPMA analysis of Fe-oxide minerals
Analysis No. EI36.3 EI36.9 EI36.9 EI8.19 EI28.2 EI28.3 EI28.4
O (wt%) 25.63 25.69 25.69 26.66 26.61 34.36 24.95
Na (wt%) 0.17 0.20 0.20 0.37 0.12 0.32 0.36
Mg (wt%) 0.27 0.43 0.43 0.17 0.18 0.27 0.27
Al (wt%) 1.28 1.22 1.22 1.14 0.05 0.64 0.27
Si (wt%) 2.40 1.95 1.95 1.67 1.00 15.66 0.95
S (wt%) 0.09 0.04 0.04 2.19 0.05 0.25 0.06
K (wt%) 0.00 0.01 0.01 0.06 0.01 0.05 0.08
Ca (wt%) 0.55 0.47 0.47 0.06 0.09 0.17 0.09
Ti (wt%) 0.15 0.52 0.52 0.00 0.04 0.17 0.25
V (wt%) 0.14 0.12 0.12 0.03 0.32 0.50 0.42
Cr (wt%) 0.00 0.00 0.00 0.00 0.01 0.01 0.01
Mn (wt%) 0.09 0.02 0.02 0.02 0.04 0.04 0.04
Fe (wt%) 48.52 49.28 49.28 49.02 57.93 34.49 52.83
Co (wt%) 0.00 0.00 0.00 0.06 0.00 0.01 0.00
Ni (wt%) 0.00 0.04 0.04 0.09 0.05 0.03 0.02
Zn (wt%) 0.25 0.24 0.24 0.02 0.02 0.07 0.02
Se (wt%) 0.10 0.09 0.09 0.01 0.03 0.05 0.05
Zr (wt%) 0.00 0.00 0.00 0.00 0.00 0.00 0.00
Nb (wt%) 0.00 0.00 0.00 0.00 0.00 0.00 0.02
Mo (wt%) 0.06 0.16 0.16 0.25 0.00 0.01 0.04
Ta (wt%) 0.00 0.07 0.07 0.00 0.00 0.00 0.00
Th (wt%) 0.05 0.05 0.05 0.04 0.00 0.02 0.00
U (wt%) 0.07 0.00 0.00 0.34 0.00 0.00 0.00
Total 79.81 80.61 80.61 82.18 86.57 87.13 80.73
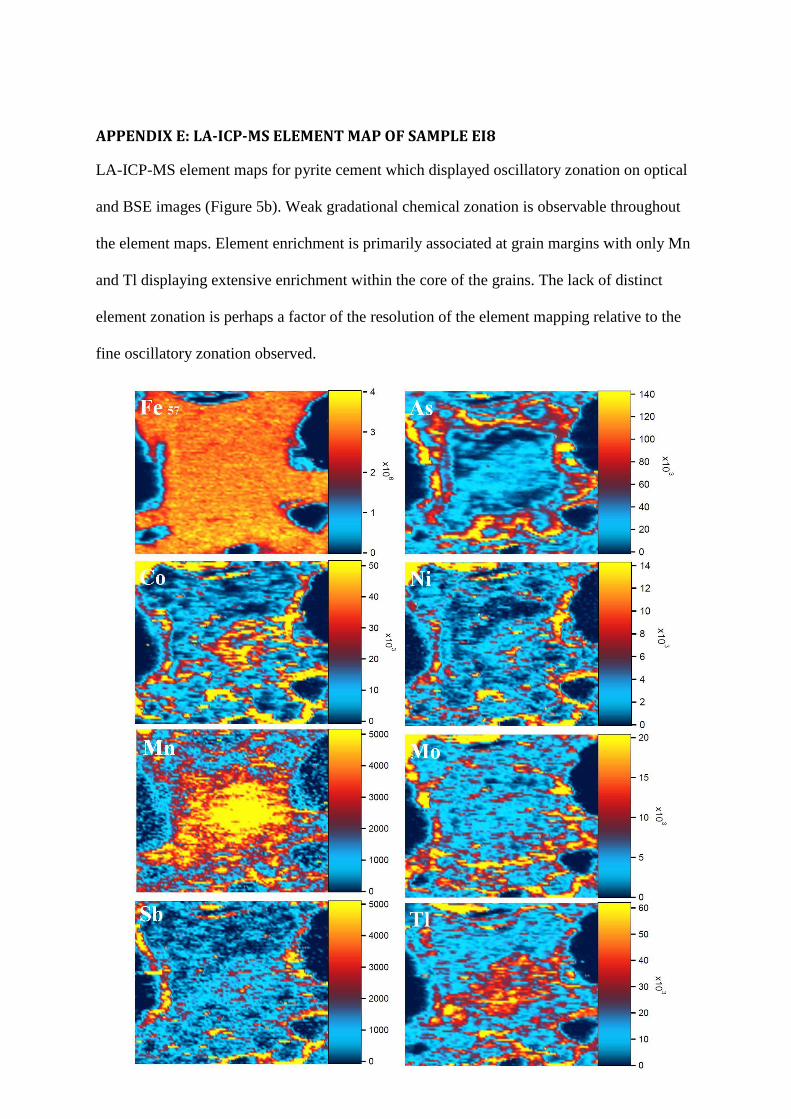
APPENDIX E: LA-ICP-MS ELEMENT MAP OF SAMPLE EI8
LA-ICP-MS element maps for pyrite cement which displayed oscillatory zonation on optical
and BSE images (Figure 5b). Weak gradational chemical zonation is observable throughout
the element maps. Element enrichment is primarily associated at grain margins with only Mn
and Tl displaying extensive enrichment within the core of the grains. The lack of distinct
element zonation is perhaps a factor of the resolution of the element mapping relative to the
fine oscillatory zonation observed.
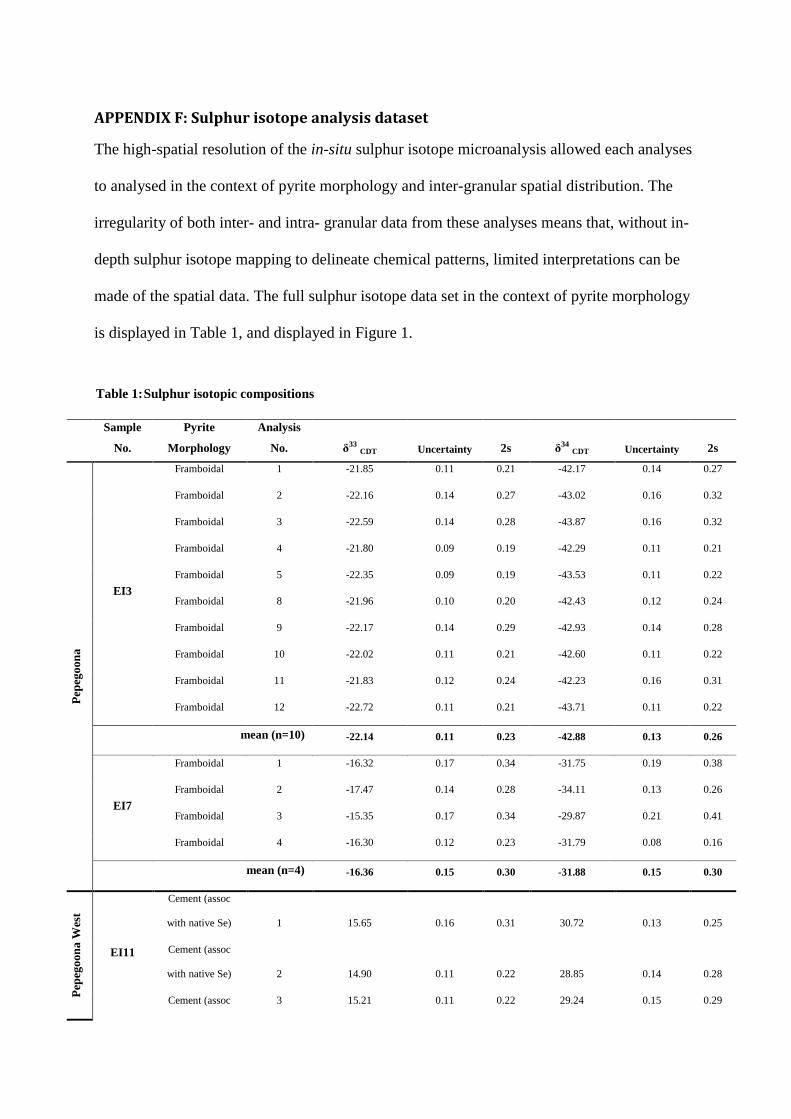
Table 1: Sulphur isotopic compositions
Sample
No.
Pyrite
Morphology
Analysis
No. δ33 CDT Uncertainty 2s δ34 CDT Uncertainty 2s
Pep
ego
on
a
EI3
Framboidal 1 -21.85 0.11 0.21 -42.17 0.14 0.27
Framboidal 2 -22.16 0.14 0.27 -43.02 0.16 0.32
Framboidal 3 -22.59 0.14 0.28 -43.87 0.16 0.32
Framboidal 4 -21.80 0.09 0.19 -42.29 0.11 0.21
Framboidal 5 -22.35 0.09 0.19 -43.53 0.11 0.22
Framboidal 8 -21.96 0.10 0.20 -42.43 0.12 0.24
Framboidal 9 -22.17 0.14 0.29 -42.93 0.14 0.28
Framboidal 10 -22.02 0.11 0.21 -42.60 0.11 0.22
Framboidal 11 -21.83 0.12 0.24 -42.23 0.16 0.31
Framboidal 12 -22.72 0.11 0.21 -43.71 0.11 0.22
mean (n=10) -22.14 0.11 0.23 -42.88 0.13 0.26
EI7
Framboidal 1 -16.32 0.17 0.34 -31.75 0.19 0.38
Framboidal 2 -17.47 0.14 0.28 -34.11 0.13 0.26
Framboidal 3 -15.35 0.17 0.34 -29.87 0.21 0.41
Framboidal 4 -16.30 0.12 0.23 -31.79 0.08 0.16
mean (n=4) -16.36 0.15 0.30 -31.88 0.15 0.30
Pep
ego
on
a W
est
EI11
Cement (assoc
with native Se) 1 15.65 0.16 0.31 30.72 0.13 0.25
Cement (assoc
with native Se) 2 14.90 0.11 0.22 28.85 0.14 0.28
Cement (assoc 3 15.21 0.11 0.22 29.24 0.15 0.29
APPENDIX F: Sulphur isotope analysis dataset
The high-spatial resolution of the in-situ sulphur isotope microanalysis allowed each analyses
to analysed in the context of pyrite morphology and inter-granular spatial distribution. The
irregularity of both inter- and intra- granular data from these analyses means that, without in-
depth sulphur isotope mapping to delineate chemical patterns, limited interpretations can be
made of the spatial data. The full sulphur isotope data set in the context of pyrite morphology
is displayed in Table 1, and displayed in Figure 1.
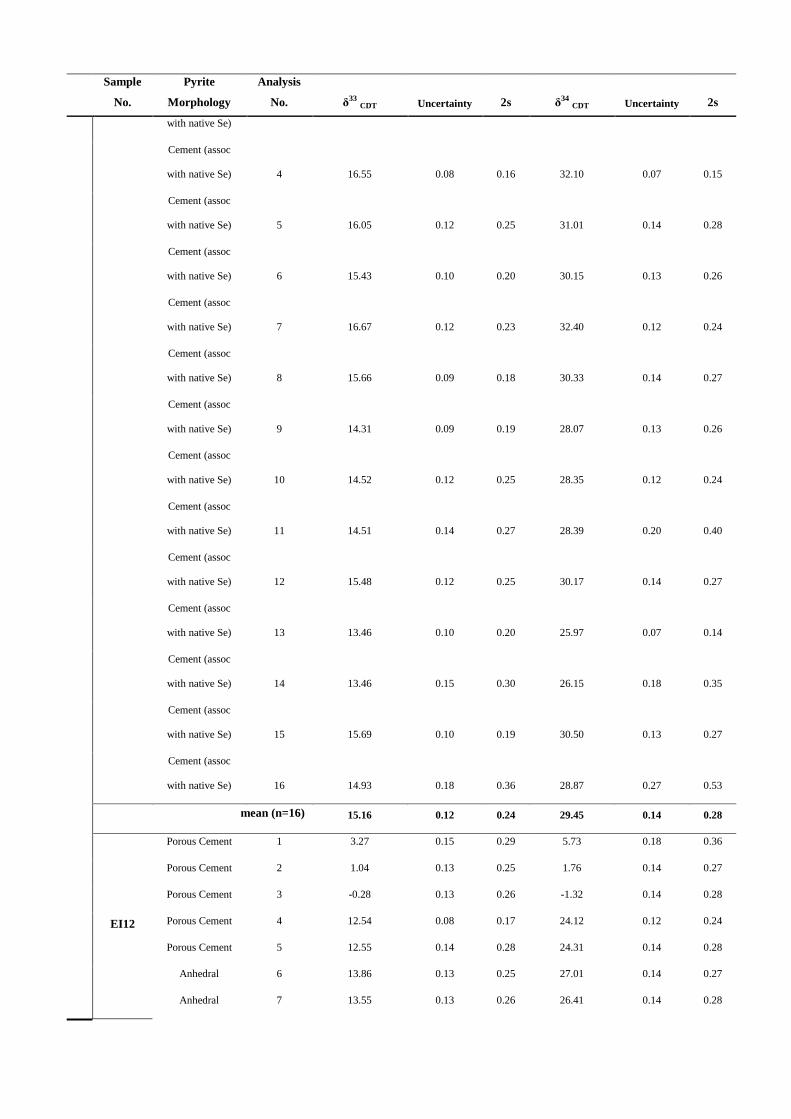
Sample
No.
Pyrite
Morphology
Analysis
No. δ33 CDT Uncertainty 2s δ34 CDT Uncertainty 2s
with native Se)
Cement (assoc
with native Se) 4 16.55 0.08 0.16 32.10 0.07 0.15
Cement (assoc
with native Se) 5 16.05 0.12 0.25 31.01 0.14 0.28
Cement (assoc
with native Se) 6 15.43 0.10 0.20 30.15 0.13 0.26
Cement (assoc
with native Se) 7 16.67 0.12 0.23 32.40 0.12 0.24
Cement (assoc
with native Se) 8 15.66 0.09 0.18 30.33 0.14 0.27
Cement (assoc
with native Se) 9 14.31 0.09 0.19 28.07 0.13 0.26
Cement (assoc
with native Se) 10 14.52 0.12 0.25 28.35 0.12 0.24
Cement (assoc
with native Se) 11 14.51 0.14 0.27 28.39 0.20 0.40
Cement (assoc
with native Se) 12 15.48 0.12 0.25 30.17 0.14 0.27
Cement (assoc
with native Se) 13 13.46 0.10 0.20 25.97 0.07 0.14
Cement (assoc
with native Se) 14 13.46 0.15 0.30 26.15 0.18 0.35
Cement (assoc
with native Se) 15 15.69 0.10 0.19 30.50 0.13 0.27
Cement (assoc
with native Se) 16 14.93 0.18 0.36 28.87 0.27 0.53
mean (n=16) 15.16 0.12 0.24 29.45 0.14 0.28
EI12
Porous Cement 1 3.27 0.15 0.29 5.73 0.18 0.36
Porous Cement 2 1.04 0.13 0.25 1.76 0.14 0.27
Porous Cement 3 -0.28 0.13 0.26 -1.32 0.14 0.28
Porous Cement 4 12.54 0.08 0.17 24.12 0.12 0.24
Porous Cement 5 12.55 0.14 0.28 24.31 0.14 0.28
Anhedral 6 13.86 0.13 0.25 27.01 0.14 0.27
Anhedral 7 13.55 0.13 0.26 26.41 0.14 0.28
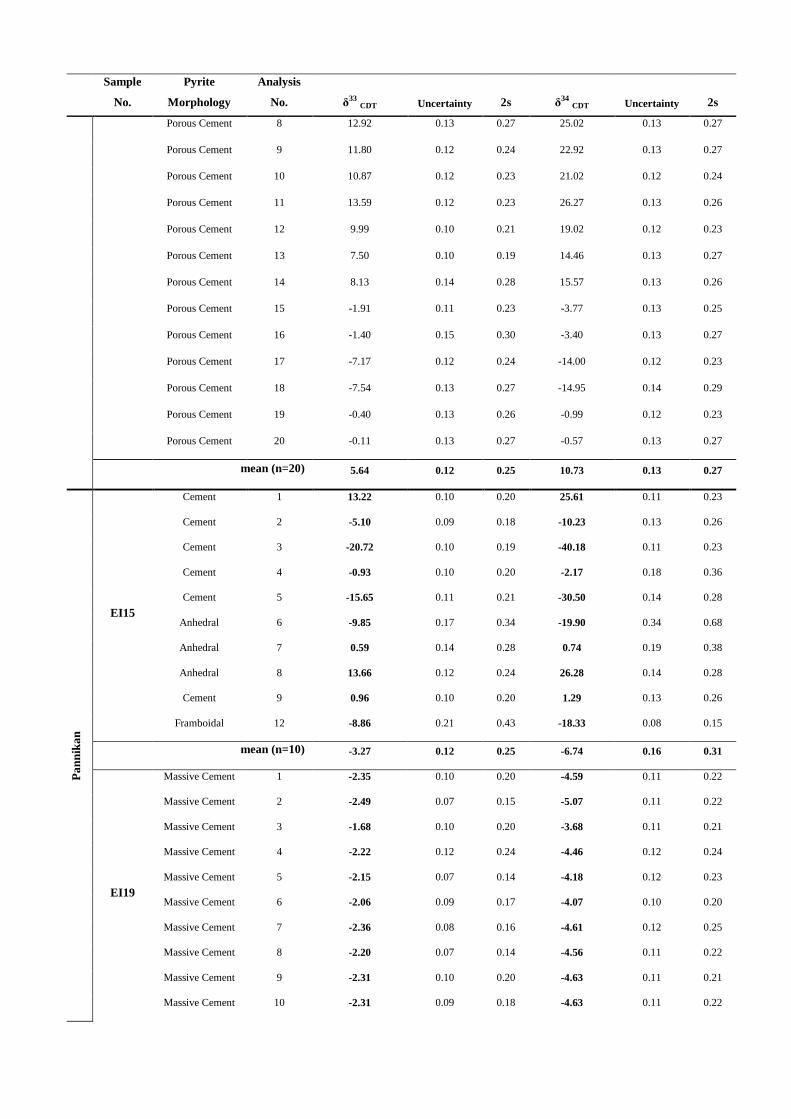
Sample
No.
Pyrite
Morphology
Analysis
No. δ33 CDT Uncertainty 2s δ34 CDT Uncertainty 2s
Porous Cement 8 12.92 0.13 0.27 25.02 0.13 0.27
Porous Cement 9 11.80 0.12 0.24 22.92 0.13 0.27
Porous Cement 10 10.87 0.12 0.23 21.02 0.12 0.24
Porous Cement 11 13.59 0.12 0.23 26.27 0.13 0.26
Porous Cement 12 9.99 0.10 0.21 19.02 0.12 0.23
Porous Cement 13 7.50 0.10 0.19 14.46 0.13 0.27
Porous Cement 14 8.13 0.14 0.28 15.57 0.13 0.26
Porous Cement 15 -1.91 0.11 0.23 -3.77 0.13 0.25
Porous Cement 16 -1.40 0.15 0.30 -3.40 0.13 0.27
Porous Cement 17 -7.17 0.12 0.24 -14.00 0.12 0.23
Porous Cement 18 -7.54 0.13 0.27 -14.95 0.14 0.29
Porous Cement 19 -0.40 0.13 0.26 -0.99 0.12 0.23
Porous Cement 20 -0.11 0.13 0.27 -0.57 0.13 0.27
mean (n=20) 5.64 0.12 0.25 10.73 0.13 0.27
Pa
nn
ika
n
EI15
Cement 1 13.22 0.10 0.20 25.61 0.11 0.23
Cement 2 -5.10 0.09 0.18 -10.23 0.13 0.26
Cement 3 -20.72 0.10 0.19 -40.18 0.11 0.23
Cement 4 -0.93 0.10 0.20 -2.17 0.18 0.36
Cement 5 -15.65 0.11 0.21 -30.50 0.14 0.28
Anhedral 6 -9.85 0.17 0.34 -19.90 0.34 0.68
Anhedral 7 0.59 0.14 0.28 0.74 0.19 0.38
Anhedral 8 13.66 0.12 0.24 26.28 0.14 0.28
Cement 9 0.96 0.10 0.20 1.29 0.13 0.26
Framboidal 12 -8.86 0.21 0.43 -18.33 0.08 0.15
mean (n=10) -3.27 0.12 0.25 -6.74 0.16 0.31
EI19
Massive Cement 1 -2.35 0.10 0.20 -4.59 0.11 0.22
Massive Cement 2 -2.49 0.07 0.15 -5.07 0.11 0.22
Massive Cement 3 -1.68 0.10 0.20 -3.68 0.11 0.21
Massive Cement 4 -2.22 0.12 0.24 -4.46 0.12 0.24
Massive Cement 5 -2.15 0.07 0.14 -4.18 0.12 0.23
Massive Cement 6 -2.06 0.09 0.17 -4.07 0.10 0.20
Massive Cement 7 -2.36 0.08 0.16 -4.61 0.12 0.25
Massive Cement 8 -2.20 0.07 0.14 -4.56 0.11 0.22
Massive Cement 9 -2.31 0.10 0.20 -4.63 0.11 0.21
Massive Cement 10 -2.31 0.09 0.18 -4.63 0.11 0.22
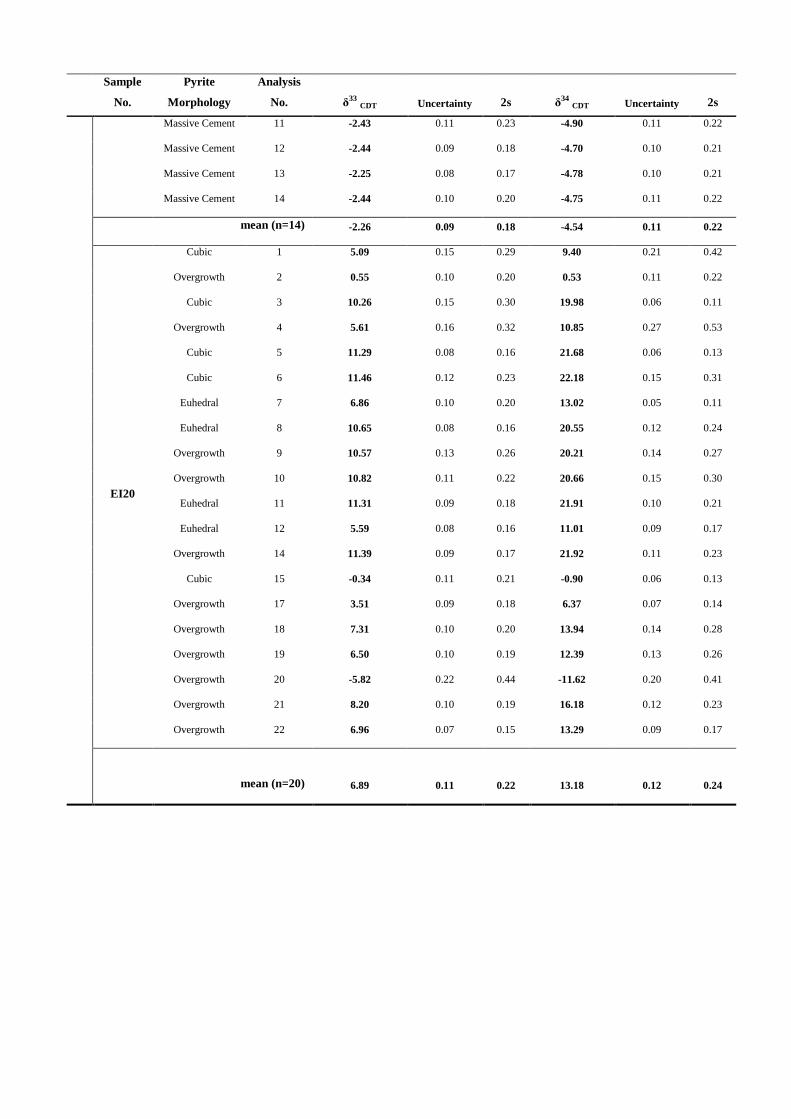
Sample
No.
Pyrite
Morphology
Analysis
No. δ33 CDT Uncertainty 2s δ34 CDT Uncertainty 2s
Massive Cement 11 -2.43 0.11 0.23 -4.90 0.11 0.22
Massive Cement 12 -2.44 0.09 0.18 -4.70 0.10 0.21
Massive Cement 13 -2.25 0.08 0.17 -4.78 0.10 0.21
Massive Cement 14 -2.44 0.10 0.20 -4.75 0.11 0.22
mean (n=14) -2.26 0.09 0.18 -4.54 0.11 0.22
EI20
Cubic 1 5.09 0.15 0.29 9.40 0.21 0.42
Overgrowth 2 0.55 0.10 0.20 0.53 0.11 0.22
Cubic 3 10.26 0.15 0.30 19.98 0.06 0.11
Overgrowth 4 5.61 0.16 0.32 10.85 0.27 0.53
Cubic 5 11.29 0.08 0.16 21.68 0.06 0.13
Cubic 6 11.46 0.12 0.23 22.18 0.15 0.31
Euhedral 7 6.86 0.10 0.20 13.02 0.05 0.11
Euhedral 8 10.65 0.08 0.16 20.55 0.12 0.24
Overgrowth 9 10.57 0.13 0.26 20.21 0.14 0.27
Overgrowth 10 10.82 0.11 0.22 20.66 0.15 0.30
Euhedral 11 11.31 0.09 0.18 21.91 0.10 0.21
Euhedral 12 5.59 0.08 0.16 11.01 0.09 0.17
Overgrowth 14 11.39 0.09 0.17 21.92 0.11 0.23
Cubic 15 -0.34 0.11 0.21 -0.90 0.06 0.13
Overgrowth 17 3.51 0.09 0.18 6.37 0.07 0.14
Overgrowth 18 7.31 0.10 0.20 13.94 0.14 0.28
Overgrowth 19 6.50 0.10 0.19 12.39 0.13 0.26
Overgrowth 20 -5.82 0.22 0.44 -11.62 0.20 0.41
Overgrowth 21 8.20 0.10 0.19 16.18 0.12 0.23
Overgrowth 22 6.96 0.07 0.15 13.29 0.09 0.17
mean (n=20) 6.89 0.11 0.22 13.18 0.12 0.24
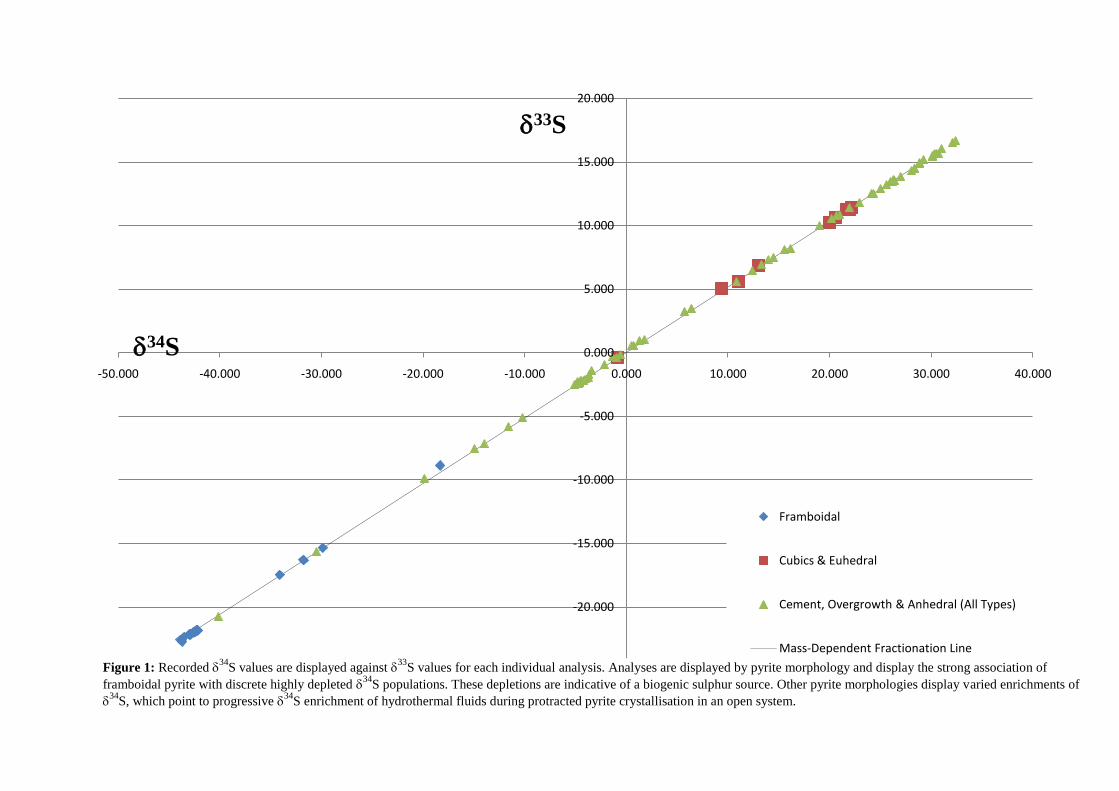
-25.000
-20.000
-15.000
-10.000
-5.000
0.000
5.000
10.000
15.000
20.000
-50.000 -40.000 -30.000 -20.000 -10.000 0.000 10.000 20.000 30.000 40.000
34S
33S
Framboidal
Cubics & Euhedral
Cement, Overgrowth & Anhedral (All Types)
Mass-Dependent Fractionation Line
Figure 1: Recorded 34
S values are displayed against 33
S values for each individual analysis. Analyses are displayed by pyrite morphology and display the strong association of
framboidal pyrite with discrete highly depleted 34
S populations. These depletions are indicative of a biogenic sulphur source. Other pyrite morphologies display varied enrichments of
34
S, which point to progressive 34
S enrichment of hydrothermal fluids during protracted pyrite crystallisation in an open system.


![Magmatic Signature in Submarine Hydrothermal Fluids Vented ...downloads.hindawi.com/journals/geofluids/2019/8759609.pdf · mounts[13–15],intheAeolianArchipelago[16–19],infront](https://img.pdfslide.us/doc/110x75/60184828fc0dc473fd01ea3a/magmatic-signature-in-submarine-hydrothermal-fluids-vented-mounts13a15intheaeolianarchipelago16a19infront.jpg)