Embed Size (px)
Citation preview

Van Daele, J., Hulsbosch, N., Dewaele, S., Boiron, M.-C., Piessens, K., Boyce, A.
and Muchez, P. (2018) Mixing of magmatic-hydrothermal and metamorphic fluids
and the origin of peribatholitic Sn vein-type deposits in Rwanda. Ore Geology
Reviews, 101, pp. 481-501. (doi:10.1016/j.oregeorev.2018.07.020)
There may be differences between this version and the published version. You are
advised to consult the publisher’s version if you wish to cite from it.
http://eprints.gla.ac.uk/166142/
Deposited on: 6 August 2018
Enlighten – Research publications by members of the University of Glasgow
http://eprints.gla.ac.uk
brought to you by COREView metadata, citation and similar papers at core.ac.uk
provided by Enlighten

Accepted Manuscript
Mixing of magmatic-hydrothermal and metamorphic fluids and the origin ofperibatholitic Sn vein-type deposits in Rwanda
J. Van Daele, N. Hulsbosch, S. Dewaele, M.-C. Boiron, K. Piessens, A. Boyce,Ph. Muchez
PII: S0169-1368(18)30323-8DOI: https://doi.org/10.1016/j.oregeorev.2018.07.020Reference: OREGEO 2637
To appear in: Ore Geology Reviews
Received Date: 18 April 2018Revised Date: 5 July 2018Accepted Date: 23 July 2018
Please cite this article as: J. Van Daele, N. Hulsbosch, S. Dewaele, M.-C. Boiron, K. Piessens, A. Boyce, Ph. Muchez,Mixing of magmatic-hydrothermal and metamorphic fluids and the origin of peribatholitic Sn vein-type deposits inRwanda, Ore Geology Reviews (2018), doi: https://doi.org/10.1016/j.oregeorev.2018.07.020
This is a PDF file of an unedited manuscript that has been accepted for publication. As a service to our customerswe are providing this early version of the manuscript. The manuscript will undergo copyediting, typesetting, andreview of the resulting proof before it is published in its final form. Please note that during the production processerrors may be discovered which could affect the content, and all legal disclaimers that apply to the journal pertain.

1
Mixing of magmatic-hydrothermal and metamorphic fluids and the origin of peribatholitic Sn vein-type deposits in Rwanda. Van Daele, J.a*, Hulsbosch, N.a, Dewaele, S.b,c, Boiron, M.-C.d, Piessens, K.e, Boyce, A.f and Muchez,
Ph.a
a KU Leuven, Geodynamics and Geofluids Research Group, Department of Earth and Environmental
Sciences, Celestijnenlaan 200E, 3001 Leuven, Belgium
b Ghent University, Department of Geology, Krijgslaan 281, S8, 9000 Ghent, Belgium
c Royal Museum for Central Africa (RMCA), Department of Geology and Mineralogy,
Leuvensesteenweg 13, 3080 Tervuren, Belgium
d Université de Lorraine, CNRS, GeoRessources, Boulevard des Aiguillettes B.P. 239, F-54000, Nancy,
France
e Royal Belgian Institute of Natural Sciences, Geological Survey of Belgium, Jennerstraat 13, 1000
Brussels, Belgium
f Scottish Universities Environmental Research Centre, Rankine Avenue, East Kilbridge, Glasgow, G75
0QF, Scotland, U.K.
* corresponding author: [email protected]
Keywords: leucogranite mineralization, pegmatites, cassiterite, quartz veins, fluid mixing,
geochemical modelling
Abstract
The fluid sources of granite-related Sn-quartz vein deposits are commonly obscured by fluid mixing
or fluid-rock interactions. As a result, fluid inclusions, minerals and isotopes in these veins indicate an
intermediate composition between magmatic and metamorphic, but the degree of mixing between

2
these endmembers is currently unquantified. This study presents a novel quantitative approach to
assess the degree of mixing between magmatic-hydrothermal and external metamorphic fluids in the
formation of peribatholitic Sn-quartz veins. In particular, fluid mixing in the Sn-mineralized
Rwamagana-Musha-Ntunga pegmatite-quartz vein field in East Rwanda has been evaluated by the
following four methods: quartz stable isotopes, muscovite geochemistry, fluid inclusion
microthermometry and LA-ICP-MS, and geochemical modelling.
The quartz stable isotope data (δ18O: +13.1 to +15.8 ‰ V-SMOW; δD: −27.6 to –59.7 ‰ V-SMOW)
cannot uniquely differentiate between a metamorphic fluid origin or an initial magmatic
hydrothermal fluid origin with subsequent metamorphic fluid mixing or host-rock interaction.
However, granitophile element concentrations in magmatic muscovite from pegmatites and
hydrothermal muscovite from associated Sn-quartz veins are equally high, indicating a close genetic
link (Rb: 530 – 8740 ppm, Li: 110 – 1990 ppm, Sn: 87 – 810 ppm, Cs: 62 – 420 ppm). Primary H2O-CO2-
N2-NaCl medium saline magmatic fluid inclusions in quartz of pegmatites (~12.7 wt% NaCleq) and
H2O-CO2-(N2)-NaCl low saline fluid inclusions in barren metamorphic quartz veins (~4.9 wt% NaCleq)
were analyzed by LA-ICP-MS. These results show an enrichment in Li, Rb, Sn and Cs for the magmatic
fluid, while the metamorphic fluid is characterized by low granitophile element concentrations and
high Sr and Ba contents. The expected Rb-Cs and Rb-Sn signature of the Sn-quartz vein muscovite
was modelled using the measured fluid endmember compositions, confirming mixing between
magmatic and metamorphic fluids in the formation of the veins. The quantification suggests that the
hydrothermal Sn-quartz vein fluid contains 5 – 80 % of an external metamorphic fluid component.
1 Introduction
Tin and tungsten mineralization typically occurs in close proximity to differentiated leucogranites
(figure 1). These deposits show a diversity of mineralization modes ranging from plutonic-hosted
breccia and vein-stockwork systems to (peri-)batholitic greisens, skarns, pegmatites and
hydrothermal veins (Baker et al., 2005). A direct genetic link between the mineralization and the

3
silicic magmatism is often debated, especially in the case of peribatholitic deposits (cf. Harlaux et al.,
2017; Hulsbosch et al., 2016; Kozlik et al., 2016). Although a magmatic origin of the Sn or W
mineralization is experimentally predicted (e.g. Heinrich, 1990; Pichavant and Manning, 1984; Wood
and Samson, 2000), this signature is often obscured in nature by external fluid overprinting and
quantifying the contribution of magmatic fluids as the principal metal-carrying phase is complex
(Beuchat et al., 2004). Metamorphic or meteoric fluids can mix with and dilute fluids of magmatic
origin or even potentially get enriched in metals by extraction from rocks within the circulation cell
(Marignac and Cathelineau, 2010; Polya et al., 2000; Wilkinson, 1990). Audétat et al. (2000a),
Williamson et al. (2010) and Hulsbosch et al. (2016) demonstrated, however, that granite-associated
Sn and W mineralization were formed by magmatically-derived fluids, without any contribution from
stripping of the country rocks by circulating hydrothermal fluids. Nevertheless, the signatures of fluid
inclusions, minerals, bulk rock and isotopes in the mineralized quartz veins contradict the latter
presumed magmatic origin (Hulsbosch et al., 2016). These findings were interpreted as the
consequence of late-stage fluid-rock reactions or mixing with a metamorphic fluid (e.g. Chicharro et
al., 2016; Dewaele et al., 2016a; Polya et al., 2000; Wilkinson, 1990). However, no effort has been
made yet to quantitatively explain these masked signatures in detail.
Fig. 1 Schematic diagram illustrating primary granite-related W-Sn deposit styles in combination with
their type-localities (1: North American Cordillera, 2: Bolivian province, 3: Iberian – Panasqueira
province, 4: French Massif Central, 5: Cornwall, 6: Erzgebirge/Krušné Hory, 7: Kibara Metallogenic
province, 8: southeast China province, 9: Myanmar-Thailand-Maleysia and 10: east Australian
province). Styles partly after Baker et al. (2005). W-Sn province locations after Taylor (1979) and Beus
(1986), Nb-Ta-Sn provinces after Melcher et al. (2016). Figure from Hulsbosch (2016).
The early-Neoproterozoic Nb-Ta-Sn-W metallogenetic province in the Karagwe-Ankole belt (KAB) of
Central Africa provides a regional case study to evaluate the origin of peribatholitic Sn vein-type
deposits and the degree of mixing of magmatic-hydrothermal and metamorphic fluids. The KAB

4
contains numerous granite-related ore deposits, in which the metals are present in lithium-cesium-
tantalum (LCT) family pegmatites and associated greisens, as well as in Sn or W hydrothermal quartz
veins. Tin-mineralized quartz veins are abundantly present in the Rwandese part of the KAB where
they show a close temporal and spatial relationship to early-Neoproterozoic leucogranite and
pegmatite intrusions (Brinckmann et al., 1994; Dewaele et al., 2016b; Tack et al., 2010). In particular,
the abundant presence of cogenetic pegmatites and Sn-mineralized quartz veins around the Lake
Muhazi leucogranite makes the Rwamagana-Musha-Ntunga area (RMN, East Rwanda) an ideal study
area to constrain the genetic relation between the granite-pegmatite system and the Sn-mineralized
quartz veins.
In this study we determined the primary magmatic fluid signature from fluid inclusions in pegmatitic
quartz and the metamorphic fluid signature from metamorphic quartz. The term ‘metamorphic fluid’
is used in this article for fluids which have equilibrated with the metamorphic host rock and/or are
the consequence of metamorphic dewatering processes. These fluid endmember data were used in
combination with geochemistry of pegmatitic and quartz vein muscovite to constrain the
contribution (i.e. degree of mixing) of metamorphic and magmatic fluids to the global fluid systems
present around leucogranites during granite-pegmatite differentiation and the genesis of
hydrothermal Sn quartz veins at the Rwamagana-Musha-Ntunga area (RMN).
2 Geology of the metallogenetic province in the KAB
2.1 Geological setting of the KAB
The Karagwe-Ankole belt (KAB) is a NE-SW trending belt located in Central Africa, covering parts of
D.R. Congo, Rwanda, Burundi, Uganda and Tanzania. The KAB consists of Palaeo- and
Mesoproterozoic supracrustal units, mostly metasedimentary rocks with minor metavolcanics
(Fernandez-Alonso et al., 2012; Tack et al., 2010). In Rwanda (and the western part of Burundi and
southwest Uganda), the Mesoproterozoic rocks of the KAB are assigned to the Akanyaru Supergroup,
subdivided in four groups, from bottom to top the Gikoro, Pindura, Cyohoha and Rugezi Groups
5
(Baudet et al., 1988; Fernandez-Alonso et al., 2012). The Rwamagana-Musha-Ntunga area (figure 2) is
part of the Western Domain of the KAB (Tack et al., 2010). The metasediments hosting the
mineralized pegmatites and quartz veins belong to the Gikoro and Pindura Group (Hanon and
Rusanganwa, 1991), deposited between 1420 Ma and 1375 Ma (Fernandez-Alonso et al., 2012).
A first generation of S-type granites, the G1-G3 granites in Rwanda, intruded the metasediments of
the KAB at c.1375 Ma (Tack et al., 2010). In the early Neoproterozoic, a second generation of S-type
granites, regionally termed the G4-granites, was emplaced (976 ± 10 Ma; Rb-Sr errorchron; Cahen
and Ledent, 1979; 986 ± 10 Ma; SHRIMP U-Pb dating on zircons; Tack et al., 2010). Multiple granite-
related Nb-Ta-Sn-W ore deposit types are temporally and spatially associated with the G4-granites in
Rwanda. Tantalum-niobium-oxide and cassiterite mineralization can be present in granitic LCT-family
pegmatites, aged between 975 and 963 Ma (Rb-Sr muscovite; Brinckmann and Lehmann, 1983;
Monteyne-Poulaert et al., 1962; Rb-Sr whole rock; Lehmann et al., 1994; U-Pb columbite;
Brinckmann et al., 2001; Dewaele et al., 2011; Melcher et al., 2015; Romer and Lehmann, 1995).
Greisenization is reported in isolated zones (‘pockets’) in pegmatites, as an intense development of
sericite crystals which recrystallized to larger muscovite sheets under influence of continuing K-
alteration. Cassiterite mineralization in pegmatites is most often closely associated with these
greisen pockets, which were dated at 904 ± 0.7 Ma (Dewaele et al., 2011; Varlamoff, 1972).
Hydrothermal quartz veins can contain cassiterite (SnO2) or W-bearing minerals (figure 2; Pohl, 1994;
Tack et al., 2010). Ages of 992.4 ± 1.5 Ma and 984 ± 2.4 Ma have been obtained for the W-
mineralized quartz veins (Ar-Ar muscovite; De Clercq, 2012; Dewaele et al., 2016a), while Sn-
mineralized quartz veins have been dated at 965 ± 29 Ma (Rb-Sr muscovite; Monteyne-Poulaert et
al., 1962) and 957 ± 21 Ma (U-Pb cassiterite; Zhang et al., 2016) . These two quartz vein types (W-
and Sn-mineralized) do not show a close spatial relationship to each other (cfr. figure 2), because of
the strong lithological host rock control. Sn-bearing quartz veins occur in muscovite-feldspar rich
sandstone and quartzite, while organic-rich metapelites form the host rock of the W-mineralized
quartz veins (De Clercq, 2012; Hulsbosch et al., 2016).

6
Fig. 2 Distribution of lithological groups, granite intrusions and Nb-Ta-Sn-W mineralization in
Rwanda. 1 = Rwamagana city, 2 = Musha-Ntunga, 3 = Kigali city, 4 = Nyakabingo, 5 = Rutongo, 6 =
Gatumba, 7 = Kibuye city. The Rwamagana-Musha-Ntunga study area is indicated with the blue
rectangle. Modified after Fernandez-Alonso et al. (2007).
Around 1000 Ma, at the beginning of the Neoproterozoic, compressional events are reported in the
KAB causing the morpho-structural shaping (Tack et al., 2010). The exact timing of metamorphism
currently is not well-constrained and topic of research in progress. The lack of foliation and absence
of metamorphic mineral growth in the G4-granites and pegmatites strongly suggest peak
metamorphism in the KAB took place prior to their emplacement (i.e. 986 ± 10 Ma; Tack et al., 2010).
However, ages of 962 ± 7 Ma (SHRIMP U-Pb garnet; de Kock et al., 2014) and 966 ± 11 Ma (SHRIMP
U-Pb zircon overgrowths; Tack et al., 2010) have been interpreted to represent the peak of
metamorphism, which is not in accordance with the clear petrographical evidence. These ages could
be related to the G4-granite emplacement, such as contact metamorphic effects. . Regional
metamorphism of the Mesoproterozoic sedimentary rocks of the KAB was generally low-grade
greenschist facies (Baudet et al., 1988; Gérards and Ledent, 1970), but local excursions towards
amphibolite facies have been reported in the vicinity of granite batholiths (Fernandez-Alonso et al.,
2012; Tack et al., 1994).
Barren, metamorphic quartz veins in the KAB, as e.g. observed in the Kibuye and Gitarama areas
(figure 2), typically occur as quartz pods in the hinges of folds or as folded bedding-parallel or
bedding-perpendicular veins. Some of these quartz veins have a biotite-garnet rim (e.g. figure 4e).
Folded bedding-parallel veins (e.g. at Nyakabingo, Central Rwanda) are according to De Clercq (2012)
almost completely composed of quartz crystals. Inside many of these metamorphic veins, aligned
fragments of the metapelitic host rock occur. These host rock inclusions are parallel to the vein wall
and follow the curvature of the veins. Next to host rock inclusions, also fluid inclusion planes occur
which crosscut the quartz crystals. The presence of the aligned host rock inclusions and the parallel
7
fluid inclusion planes points to a crack-seal mechanism for the formation of the veins (cf. Passchier
and Trouw, 2005). The folded veins have been (sometimes intensely) fractured and coated by iron
oxides. A small alteration zone can be observed at the contact zone between the folded veins and
the host rock (De Clercq, 2012). Bedding-perpendicular metamorphic veins deflect the axial planar
foliation present in the host rock, indicating their pre-foliation age (e.g. figure 4c-d).
2.2 The granite-pegmatite-quartz vein system in Rwanda and the Rwamagana-Musha-Ntunga area
In the Rwamagana-Musha-Ntunga area, the Lake Muhazi granite intrusion occurs in the center of the
Karehe anticline (figure 3; Hanon and Rusanganwa, 1991). This anticline consists of metasediments of
the Nyabugogo, Musha, Nduba and Bulimbi formations (a detailed lithological description can be
consulted in Hulsbosch et al., 2017). The Bulimbi Formation belongs to the Pindura Group, while the
other three formations to the older Gikoro Group (Hanon and Rusanganwa, 1991). Because of
intense lateritization, only few fresh exposures of the granite are present (Varlamoff, 1969).
Therefore, the outlines of the granite batholith have mainly been proposed based on the topographic
morphology, i.e. a large depression without strong secondary relief (Hanon and Rusanganwa, 1991).
Mineralization is present as Nb-Ta-Sn pegmatites and Sn-rich hydrothermal quartz veins (Hanon and
Rusanganwa, 1991).
Fig. 3 Geological map of the Rwamagana-Musha-Ntunga area with indication of pegmatite and
quartz vein occurrence (after Hanon and Rusanganwa, 1991; Hulsbosch et al., 2017).
The first detailed regional mapping of the pegmatite and Sn-quartz vein outcrops in the RMN area
has been performed by Varlamoff (1969). This study identified six different mineralogical dyke and
vein types around the Lake Muhazi leucogranite intrusion (Table 1). Due to intense albitization,
greisenization and kaolinization of the Musha-Ntunga pegmatite system, no internal mineralogical
zonation sequence can be observed within individual dykes. Based on reports by Varlamoff (1969) on
historic mining activities, internally zoned Nb-Ta-Sn pegmatite dykes with quartz core development
and amblygonite can be locally observed which transition towards strongly albitized Nb-Ta-Sn

8
pegmatite dykes with quartz, lepidolite and elbaite cores. Moreover, a transition from these LCT
pegmatites to quartz-muscovite-cassiterite veins and partly albitized quartz-microcline-cassiterite-
muscovite veins is observed at depth in the Ntunga mine in Rwanda (Hulsbosch et al., 2017;
Varlamoff, 1969). The pegmatites of the mine sites of Musha and Ntunga belong dominantly to the
type E of Varlamoff (1969) (Table 1). Pegmatites mainly occur as exogranitic in the RMN study area,
although both endo- as exogranitic pegmatites are observed in Rwanda.
Table 1 Pegmatite and quartz vein mineralogy in the Rwamagana-Musha-Ntunga area (Varlamoff,
1969).
The pegmatites studied are intensely kaolinitized with some relicts of feldspar, and also contain
various amounts of quartz and muscovite (figure 4a). Quartz occurs as randomly distributed,
equigranular crystals or as grey to transparent quartz cores in the center of the pegmatites. These
quartz megacrysts easily reach 6 cm * 6 cm * 6 cm in size. Muscovite (transparent white to green)
can be present randomly dispersed throughout the pegmatite or concentrated around quartz or at
the contact of the pegmatite with the host rock. The muscovite crystals can attain a size up to 5 cm *
5 cm * 1 cm. Columbite and tantalite (Coltan Group Minerals, CGM) and cassiterite mineralization is
present as a disseminated phase in most of the pegmatites (Van Daele, 2016).
In the barren and Sn-bearing quartz veins, two main morphologies of quartz crystals are observed:
pure transparent-white, blocky quartz and fine-crystalline, pale white saccharoidal quartz. Muscovite
is often observed, in various positions in the quartz vein. It can be present in the center and at the
edge of the vein (figure 4b), but also as pervasive muscovitization/sericitization of the host rock next
to the quartz vein. Black tourmaline regularly occurs, mostly at the border of the quartz veins or
disseminated in the host rock adjacent to the veins (Van Daele, 2016). The quartz veins are often
mineralized in cassiterite (cf. type F of Varlamoff (1969); Table 1). Both pegmatites crosscut by quartz
veins and quartz veins crosscut by small pegmatites were observed (figure 4b, Reinders, 2016). The

9
quartz veins in the Rwamagana-Musha-Ntunga area either follow the bedding (N20W-strike) or are
EW oriented (Hulsbosch et al., 2017).
Due to the weathered character of the granite outcrops and the lack of a well-established regional
and internal zoning in the RMN pegmatites, clear textural in-situ evidence for a genetic link between
granites and pegmatites, as e.g. observed for the Tregonning Granite and pegmatite-aplite Megiliggar
Sheet Complex in Cornwall (Breiter et al., 2018), cannot be determined in the Rwamagana-Musha-
Ntunga granite-pegmatite system. Previous studies on the petro- and metallogenesis of the
Rwandase LCT pegmatite systems and W-bearing quartz veins (Hulsbosch et al. 2014, 2016) applied
mineral assemblages and mineral chemistry to allow the identification of Rayleigh fractional
crystallization as the main process in the granite-pegmatite system (Gitarama-Gatumba area, West
Rwanda; Hulsbosch et al., 2014). This differentiation process is reflected in a regional zoning from
parental G4 leucogranites, biotite over 2-mica to muscovite and eventually Sn-Ta-Nb mineralized
pegmatites. The most fractionated mineralized pegmatites associated with G4 parental granites were
classified as the lithium-cesium-tantalum (LCT-) family, rare element class of Černý and Ercit (2005)
(Dewaele et al., 2011). Furthermore, the link between W-mineralized quartz veins on the one hand
and the granite-pegmatite system on the other hand was recently established. Fluid exsolution at the
transition from granitic to pegmatitic melt was identified as the main process resulting in
peribatholitic W-mineralized quartz veins in the Nyakabingo area, Central Rwanda (Hulsbosch et al.,
2016). When the magmatic fluid exsolves from granitic or pegmatitic melt, elements with high
fluid/melt partition coefficients preferentially partition in this exsolving fluid. It was observed that in
granite-pegmatite systems, W shows a high affinity for an exsolving magmatic fluid phase, which can
culminate in W-mineralized quartz veins (Hulsbosch et al., 2016).
Quartz veins in the KAB, either barren or mineralized, in spatial association with magmatic intrusions
show a compositionally mixed metamorphic-magmatic fluid inclusion signature (e.g. Dewaele et al.,
2016a; Hulsbosch et al., 2016). This is the case for fluid inclusions (FI) in quartz veins associated with

10
the W quartz vein-type deposits in Nyakabingo, Central Rwanda (12 quartz vein samples, 306 FI
studied with microthermometry, 45 FI with LA-ICP-MS; De Clercq, 2012; De Clercq et al., 2008;
Dewaele et al., 2016a). Fluid inclusions in quartz veins from the Sn-mineralized district of Rutongo,
Central Rwanda, show similar characteristics (4 quartz vein samples, 164 FI; De Clercq, 2012;
Dewaele et al., 2010). These mixed signatures have been attributed to overprinting of the pristine
magmatic signature by metamorphic interaction at the deposit site, which can be related to the
thermal activity of the regional granite intrusions in the area (cf. Prochaska et al., 1992).
Consequently, fluid inclusions from barren, metamorphic quartz veins near granitic intrusions or
pegmatite fields cannot be assumed to be representative as such for the pristine, metamorphic
“background” fluid composition.
Fig. 4 Petrography of the pegmatites and quartz veins: a) pegmatite (mu = muscovite, qz = quartz,
kaol kaolinite, fsp = feldspar), b) pegmatite crosscutting quartz vein with muscovite rim, c) folded
metamorphic quartz vein perpendicular to the bedding, d) inset of c), quartz vein deflects host rock
axial planar cleavage, e) bedding-parallel, metamorphic quartz vein with biotite-garnet rim, indicated
in red.
3 Methodology
3.1 Samples and locations
Nine quartz separates of tin-bearing quartz vein samples from the RMN area are analyzed for their
oxygen and hydrogen isotope composition. From different sample collections at the RMCA and the
KU Leuven, Sn-mineralized and barren quartz vein samples are taken for a petrographic study of the
fluid inclusions in double-polished wafers. This selection includes quartz from the Rwamagana-
Musha-Ntunga, Kibuye and Gatumba areas (figure 2). Representative samples from the magmatic-
hydrothermal and metamorphic fluids are selected for a detailed microthermometric and
geochemical (LA-ICP-MS) fluid inclusion study.

11
Thirty-three samples of muscovite are selected from different mineralized and barren pegmatites
and quartz veins for ICP-OES and ICP-MS analyses. Care was taken to only sample primary muscovite
showing no signs of secondary alteration or weathering (based on color, luster and crystal
morphology). In the case of pegmatitic muscovite, only coarse-grained, intergranular muscovite
flakes which formed randomly in the dykes have been sampled. This texture indicates a primary
magmatic origin for the muscovite. Secondary micas have been reported in similar Rwandese
pegmatite systems (Gatumba area; Western Rwanda), but occur dominantly as massive, fine-grained
and non-oriented violet-gray to lavender-coloured aggregates of lepidolite replacing primary K-
feldspars in the core units of the pegmatites (Hulsbosch et al., 2013). Also metasomatic greisen
muscovite can occur in these pegmatites but typically occurs as pockets in the dyke together with
quartz (Varlamoff, 1969; Dewaele et al., 2011). Both types of secondary, replacive micas have not
been sampled in this study. In case of the quartz veins, most muscovite was sampled close to the
boundary with the host rock. The dataset comprises quartz veins and pegmatite from different host
rock lithologies.
3.2 Quartz isotope analysis
Separates from the selected Sn-bearing quartz veins in the RMN area are prepared according to the
procedure described by Dewaele et al. (2016a). The hand-picked quartz separates are analyzed for
oxygen and hydrogen isotopes at the Scottish Universities Environmental Research Center (SUERC,
Glasgow) using a laser fluorination procedure, involving total sample reaction with excess CIF3 and a
CO2 laser at temperatures in excess of 1500 °C (Sharp, 1990). All fluorinations resulted in 100%
release of O2 from the silicate lattice. This O2 is converted to CO2 by reaction with hot graphite and
analyzed by a VG SIRA II spectrometer. Results are reported in standard notation (δ18O) as per mil
(‰) deviations from Vienna Standard Mean Ocean Water (V-SMOW). Error of reproducibility is
typically around ±0.3 ‰ during analyses. Hydrogen analysis is done by in vacuo bulk heating. 1 g of
the quartz separate was analyzed using the method of Donnelly et al. (2001) and a VG-Micromass

12
Optima mass spectrometer. Samples are heated to a maximum of 700°C to release the fluids from
fluid inclusions (but not molecular hydroxides; Gleeson et al., 2008). Results are reported in standard
notation (δD) as per mil (‰) deviations from Vienna Standard Mean Ocean Water (V-SMOW). Error
of reproducibility is typically around ±5 ‰ during analyses.
3.3 Muscovite geochemistry
Pure mineral separates are prepared according to the procedure presented in Hulsbosch et al.
(2014). During this preparation, oxidized, impure (inclusion-bearing) or altered muscovite grains
were consequently discarded. The major and minor element compositions (Al, Fe, K, Mg, Mn, Na, Si,
Ti, Zn, Ba, Rb, Sn, Sr) are analyzed with a Varian 720 ES Inductively-Coupled Plasma Optical Emission
Spectrometer (ICP-OES, KU Leuven, Belgium) after dissolution following the lithium-metaborate flux
procedure of Suhr and Ingamells (1966). Standards Reference Materials NBS-70a, BCS-269, MA-N,
NIST-610 and GA are used for calibration. The mica samples are digested by four acids (HNO3, HClO4,
HF and HCl) to analyze the trace element contents (Cs, Li, Nb, Ta, W) with an Agilent 7700x
Inductively-Coupled Plasma Mass Spectrometer (ICP-MS, KU Leuven, Belgium).
Analytical precision is calculated based on three independently prepared solutions of one mica
sample (replicates). Precision is better than 2.3 % Relative Standard Deviation (RSD) for the ICP-OES
analyses and better than 7.6 % RSD for the ICP-MS analyses. Reference standards NBS-70a and G-2
indicate that the accuracy of the ICP-OES results is better than 6 % for most elements. Exceptions are
Ba (minimum recovery of 73.9 %), Fe (minimum recovery of 88.1 %) and Mn (recovery of 110.5 %).
The accuracy of the ICP-MS results is assessed based on standards G-2 and GA. For most elements, it
is better than 12.5 %. Exceptions are Li (recovery of 68 – 94 %) and Cs (recovery of 95 – 116 %).
3.4 Fluid inclusions: petrography, microthermometry and Raman spectrometry
Microthermometry of the fluid inclusions present in the magmatic and metamorphic quartz samples
is conducted on a Linkam MDS600 heating and freezing stage, mounted on an Olympus BX51

13
microscope (cf. Muchez et al., 1994). Accuracy of the measurements is within ±0.2 °C for
temperatures between -56.6 °C and 31.1 °C, and within ±1.0 °C for temperatures above 31.1 °C.
Calibration is done using synthetic fluid inclusions (Syn Flinc, USA) of the H2O-CO2, H2O-NaCl, H2O-KCl
and H2O systems. Additionally, the melting point of an indium standard is used as a calibration point
(Tm = 156 °C). To avoid stretching, leakage and decrepitation of the fluid inclusions in the quartz due
to enhanced internal pressures, the samples are first cooled. Final melting temperatures of ice and
clathrate are obtained by sequential freezing (Haynes, 1985) or cycling (Goldstein and Reynolds,
1994). Two-dimensional volume percentage of the aqueous liquid solution in the fluid inclusions,
directly after clathrate melting, has been measured with the Linksys Software of Linkam during
microthermometry (precision of ±1 %).
Fluid salinities of the aqueous-gaseous fluid inclusions have been calculated with the computer
package Clathrates of Bakker (1997). The salinity of fluid inclusions in which Tm,clath occurs in the
presence of an aqueous solution and two carbonic phases (both liquid and vapour) can be modelled
using the Q2 program of the computer package Clathrates (Bakker, 1997; Bakker and Brown, 2003).
In this case, the equation of state of Duan et al. (1996) is used.
Raman analyses were made at the Royal Belgian Institute for Natural Sciences (RBINS) in Brussels
(Belgium) using a Senterra-Bruker laser Raman microspectrometer, which was mounted on an
Olympus BX50 microscope. A 532-nm green Diode-Pumped Solid State laser (DPSS; type R200-532)
was used as excitation source, operating at 20 mW. A detailed description of the measurement
procedure has been given by Piessens and Muchez (2009).
3.5 Laser-Ablation Inductively-Coupled Plasma Mass Spectrometry
Individual fluid inclusions were ablated with a GeoLas excimer laser (ArF, 193 nm, Microlas,
Göttingen, Germany) at 5 Hz laser frequency and the aerosols were analysed with an Agilent 7500c
quadrupole ICP-MS, equipped with a collision–reaction cell at the GeoRessources Laboratory (Nancy,
France). In order to reduce elemental fractionation, the ablated material was carried in helium gas

14
(0.5 l/min), which was mixed with argon via a cyclone mixer (volume of 9.5 cm3) prior to entering the
ICP torch. Due to the relatively small inclusion diameter (20-50 µm located 10-50 µm below sample
surface), it took typically <10 s to extract the whole content of the fluid inclusions. Each analytical
series was limited to a maximum of 10 isotopes (7Li, 23Na, 24Mg, 29Si, 39K, 85Rb, 88Sr, 118Sn, 133Cs and
182W) in order to optimise the limits of detection (LODs) and precision. Dwell times of 100 ms for Si,
of 200 ms for Li, Na, Mg, K and Sr and of 500 ms for Rb, Sn, Cs and W were chosen. A detailed
description of the specific instrumental setup and performance is given in Leisen et al. (2012).
Obtained intensity ratios to Na (the internal standard) were converted to concentration ratios by
external calibration against NIST 610 and 612 standard reference glasses. All spectra have been
processed using the SILLS software package of Guillong et al. (2008), with the charge-balanced NaCleq
concentration of the fluid, obtained by microthermometry. As the fluid inclusion salinities are
homogeneous throughout each wafer, an average NaCleq salinity has been calculated for both
samples based on the overall population. Limits of detection for a given element have been
calculated according to Longerich et al. (1996) and Pettke et al. (2012).
4 Results
4.1 Stable isotopes
The oxygen and hydrogen isotope composition of tin-bearing quartz veins in the RMN area is
displayed in table 2. The δ18O values of the quartz veins are relatively homogeneous (+13.1 to +15.8
‰ V-SMOW), but the δD values vary significantly (−27.6 to –59.7 ‰ V-SMOW; table 2). Maximum
burial temperatures in the Central-Rwandese KAB region have been interpreted to amount 400 °C
(Frisch, 1971). In addition, Vertriest (2014) estimated the temperature of quartz vein formation
around 320 °C. Therefore, 350 °C was used as an approximate temperature of quartz precipitation to
calculate the δ18O value of the ambient fluid (Matsuhisa et al., 1979).
– .

15
At a temperature of 350 °C, the δ18O-ratio of the fluid varies between 7.8 and 10.5 ‰ V-SMOW. In a
δ18O – δD diagram (Figure 5), the values for quartz plot in the field for metamorphic water, with one
sample in the field of primary magmatic water.
Table 2 Stable isotope data of Sn-bearing quartz vein samples from the Rwamagana-Musha-Ntunga
area. All values are in ‰ V-SMOW.
Fig. 5 δ18O – δD plot of the calculated and analyzed isotopic composition of the fluids present in the
Sn-bearing quartz veins in the Rwamagana-Musha-Ntunga area. The global meteoric water line and
the ranges of metamorphic water, magmatic water and water that interacted with organic matter
are indicated for comparison (cf. Hoefs, 2015; Sheppard, 1986).
4.2 Major element composition of muscovite
The major element composition of muscovite from pegmatites and muscovite from quartz veins in
the RMN area is largely similar (table A.1 in appendix). Nevertheless, compared to quartz vein
muscovite, pegmatitic muscovite generally contains higher amounts of Al (33.5 – 38 versus mostly 34
– 36.5 wt% Al2O3), K (8.8 – 10.5 vs 8.6 – 10.1 wt% K2O) and Mn (0.02 – 0.15 versus 0.01 – 0.08 wt%
MnO), but less Si (43.3 – 45.2 versus 44.5 – 46.4 wt% SiO2), Mg (<0.01 – 0.37 versus 0.01 – 0.49 wt%
MgO), Na (0.4 – 0.9 versus 0.5 – 1.2 wt% Na2O), Fe (mostly 0.4 – 2.5 versus 0.4 – 3.1 wt% Fe2O3) and
Ti (0.01 – 0.22 versus 0.02 – 0.6 wt% TiO2). Some of these observations can be explained by
tetrahedral Si4+ ↔ Al3+ substitution coupled with octahedral Fe2+/Mg2+ ↔ Al3+ substitution, also
known as the Tschermak substitution [Al2 ↔ Si + (Fe,Mg)] (Viana et al., 2007).
Tischendorf et al. (1997) proposed a classification scheme for micas based on the cations present in
the octahedral site, more specifically on the parameters Mg – Li (mgli) and Fe + Ti + Mn – Al(VI) (feal).
These parameters were calculated for each sample using the structural formula spreadsheet of
Tindle (2001). The classification scheme of Tischendorf et al. (1997) confirms all white mica samples
belong to the muscovite group.

16
4.3 Trace element concentrations in muscovite
Pegmatitic muscovite and quartz vein muscovite contains similar amounts of Li (110 – 1990 ppm
versus 120 – 1670 ppm), Sn (120 – 810 versus 87 – 750 ppm), Cs (67 – 420, except for an outlier of
1180 ppm, versus 62 – 410 ppm) and W (1 – 17 versus 2 – 10 ppm). The elements Nb, Rb, Ta and Zn
are enriched in pegmatitic muscovite relative to quartz vein muscovite (respectively 49 – 250 versus
19 – 110 ppm Nb, 1460 – 8740 versus 530 – 3780 ppm Rb, 10 – 104 versus 2 – 60 ppm Ta and 62 –
890 versus 38 – 380 ppm Zn). Quartz vein muscovite shows the highest values for Sr (6 – 76 versus 8
– 45 ppm) and Ba (22 – 2430 versus 12 – 310 ppm) (table 3). The geochemical signature of muscovite
is not correlated to its textural setting (i.e. internally dispersed or concentrated at the margins) nor
to the nature of the host rock.
Table 3 Trace element concentrations of Rwamagana-Musha-Ntunga muscovite samples. All values
are in ppm.
It has been proposed that trace element variation in muscovite reflects modifications of the melt
composition (Alfonso et al., 2003; Hulsbosch et al., 2014). Accordingly, the evolution in magmatic
differentiation can be derived from compositional muscovite data. By analogy with other studies
(Hulsbosch et al., 2013, 2014; Roda-Robles et al., 1999; Viana et al., 2007), K/Rb was chosen as the
reference parameter to characterize geochemical trends of pegmatites and quartz veins expressed
by alkali, alkali earth and rare metal contents in muscovite (figure 6).
In a log-log plot, K/Rb is positively correlated to Ba and to a lesser extent to W mainly for pegmatitic
muscovite (figures 6a and 6i). Cs and Ta are negatively correlated to K/Rb for both quartz vein and
pegmatitic muscovite (figures 6b and 6h). The highest Cs- and Ta-concentrations are found in
muscovite that was sampled from Nb-Ta-Sn mineralized pegmatites and quartz veins. The Rb versus
K/Rb plot (figure 6e) shows that quartz vein muscovite in most cases has a lower Rb-content than
pegmatitic muscovite. Furthermore, the samples plot in two largely distinct groups regarding the Sr-
concentration (figure 6g). The Sr-content of pegmatitic muscovite shows a positive correlation with

17
Rb-content. Li, Nb and Sn are not correlated to K/Rb (figures 6c, 6d and 6f). However, the elements
Sn, Cs and Ta correlate positively to each other, especially for the pegmatitic muscovite. In contrast,
W shows a negative correlation with these elements. The elements Nb and Li are not correlated to
the Sn-content.
Fig. 6 Trace element concentrations of muscovite samples of the Rwamagana-Musha-Ntunga area. A
distinction between non-mineralized and mineralized pegmatites and quartz veins is given.
4.4 Fluid inclusions
The last decade multiple combined petrographic and fluid inclusion studies were performed on
quartz veins and associated magmatic systems in the KAB (see review in Hulsbosch, 2018). In order to
define the magmatic and metamorphic fluid-endmembers and to subsequently calculate the degree
of mixing between these fluid end-members in the formation of the Sn-mineralised veins of Musha-
Ntunga, a top-down approach has been applied to select the most suitable samples. Multiple
samples were selected for petrographical description. Subsequently, the most suitable samples were
studied by fluid inclusion thermometry. Based on these results, samples were selected to determine
the trace element composition of the fluid by LA-ICP-MS.
The characterization of the magmatic fluid end-member present in the Lake Muhazi granite-
pegmatite system was done by investigating primary quartz from Nb-Ta mineralized pegmatite. The
hydrothermal fluid composition in the Sn-quartz veins can be determined from quartz vein samples
in the Musha-Ntunga area (figure 3). Three Nb-Ta mineralized pegmatites and 8 Sn-mineralized
quartz veins were studied in detail by petrography. Based on these results, representative fluid
inclusions from pegmatitic quartz were selected for microthermometry (n = 63) and LA-ICP-MS
analyses (n = 43) to characterize the magmatic fluid endmember. Petrography demonstrated that the
fluid inclusions in the Sn-mineralized quartz vein samples had undergone decrepitation and therefore
could not be used to obtain representative results and could not be included in this study.

18
The original metamorphic fluid signature generally is not preserved in metamorphic quartz veins near
magmatic intrusions in the KAB (cfr. De Clercq, 2012; De Clercq et al., 2008; Dewaele et al., 2016a,
2010; Hulsbosch et al., 2016). Therefore, the regionally present metamorphic fluid is characterized by
means of metamorphic quartz veins sampled outside of the Rwamagana-Musha-Ntunga area. Fluid
inclusions of five metamorphic quartz veins from the Kibuye and Gitarama areas (figure 2) were
petrographically investigated. This preliminary study allowed to make a representative selection of
the most pristine, metamorphic fluid inclusions for microthermometry (n = 52) and LA-ICP-MS
analyses (n = 41).
4.4.1 Fluid inclusion petrography
Pegmatitic quartz shows clustered fluid inclusions with dimensions between 30 and 100 µm (figure
7a). All fluid inclusions show a negative crystal shape and contain three phases: an aqueous fluid
phase, a gaseous liquid phase and a vapour bubble (figure 7b). Fluid inclusions can co-occur in
assemblage with melt inclusions, which indicates their primary character and representativeness for
the fluid present during magmatic stages of crystallization (figure 7c). In the case of barren,
metamorphic quartz (from the Kibuye and Gitarama areas), subhedral primary fluid inclusions with
diameters between 18 and 45 µm occur in clusters (figure 7d). Multiple generations of secondary
inclusion trails are also present, but were discarded. The inclusions studied consist of three phases:
an aqueous fluid phase, a gaseous liquid phase and a vapour bubble (figure 7d).
Fig. 7 (A) and (B) fluid inclusions in magmatic quartz, (C) coarsely crystallized melt inclusion in
magmatic quartz, (D) fluid inclusions in metamorphic quartz.
4.4.2 Microthermometry
Representative microthermometric data of inclusions in magmatic and metamorphic quartz are given
in table 4 and 5 respectively (n = 52 and 63 respectively).

19
The variation between different fluid inclusions in magmatic quartz is limited (table 4). The fluid
inclusions show a 2D-calculated Vgas of 58 – 71 %. The melting temperature of CO2 varies from -59.5
°C to -57.7 °C. First melting occurred at a temperature between -26.1 °C and -20.2 °C and all ice was
molten when a temperature of -8.7 °C to -6.4 °C was reached. Dissociation of clathrate was observed
at temperatures between 7.9 °C to 8.6 °C. The CO2-homogenization (to liquid) temperature varies
between 29.6 °C and 31.2 °C and the fluid inclusions were totally homogenized at 299 – 312 °C.
Based on Raman analysis an average gas composition of 80 mol% CO2, 18 mol% N2 and 2 mol% CH4
could be determined for these fluid inclusions. The magmatic fluid inclusions are characterized as
H2O-CO2-N2-NaCl type fluid inclusions with an average amount of NaCl around 12.7 wt%.
Table 4 Microthermometric data of the H2O-CO2-N2-NaCl fluid inclusions in magmatic quartz.
The primary fluid inclusions present in metamorphic quartz show minor variability (table 5). The Vgas
is between 51 % and 60 %. The melting temperature of CO2 varies from -57.5 °C to -56.5 °C. The
temperature of first melting of ice could only be determined for a few fluid inclusions, at around -
30 °C, but all ice was molten when a temperature of -4.1 °C to -2.4 °C was reached. Melting of the
clathrate occurred at a temperature of 8.2 °C to 9.5 °C. CO2-homogenization temperature (to liquid)
was between 27.1°C and 30.7 °C. The total homogenization temperature could not be determined
because of decrepitation. Raman analysis of these fluid inclusions indicates that the dominant gas (>
95 mol%) is CO2 with traces of N2 up to 5 mol% classifying these inclusions as of the H2O-CO2-(N2)-
NaCl-type. Salinity varies slightly between 3.9 and 5.9 wt% NaCleq, with an average of 4.3 wt% NaCleq,
significantly lower than the NaCl-content of the fluid inclusions in magmatic quartz.
Table 5 Microthermometric data of the H2O-CO2-(N2)-NaCl fluid inclusions in metamorphic quartz.
4.4.3 Fluid composition
In total, 84 inclusions were analyzed by LA-ICP-MS (tables 6 and 7, figure 8). Two ablation spectra are
shown in figure 9. Forty-three inclusions were measured in magmatic quartz from the RMN area

20
(table 6). These show particular high contents of K (1.05 – 9.40 wt%) , Li (71 – 89300 ppm), Rb (9 –
5100 ppm), Sn (52 – 26400 ppm) and Cs (11 – 13900 ppm). W- and Sr-contents are relatively low
(respectively <1 – 128 ppm and 5 – 520 ppm). In metamorphic quartz from the Kibuye area, 41
inclusions were successfully analyzed (table 7). These fluid inclusions are characterized by lower
contents of Li (< 1420 ppm), Rb (< 120 ppm), Sn (<2 – 6220 ppm) and Cs (< 87 ppm). K and Na are the
dominant cations but are present in lower amounts compared to the fluid present in magmatic
quartz (0.03 – 5.36 wt% K and average 1.69 wt% Na). Sr- and W-concentrations are equally low
compared to the magmatic fluid inclusions (2 – 2980 ppm and < 89 ppm respectively).
Table 6 Fluid inclusion LA-ICP-MS data of magmatic quartz from the RMN area. Values below limit of
detection are displayed as <"DL".
Table 7 Fluid inclusion LA-ICP-MS data of metamorphic quartz from the Kibuye area. Values below
limit of detection are displayed as <"DL".
Fig. 8 Fluid inclusion LA-ICP-MS data of magmatic and metamorphic quartz, from the RMN and
Kibuye area, respectively. Samples with one of the parameters below the detection limit were given
an arbitrary value of 1 ppm for that element to display them in the log-log diagrams.
Fig. 9 LA-ICP-MS spectra of two fluid inclusions in magmatic and metamorphic quartz, from the RMN
and Kibuye area, respectively.
5 Interpretation and discussion
5.1 Quartz vein stable isotopes
Variable, low δD values combined with a narrow range of δ18O values have been observed in several
quartz vein-hosted Sn or W ore deposits (Dewaele et al., 2016a; Kelly and Rye, 1979; Patterson et al.,
1981; Polya et al., 2000). Heinrich (1990) states that stable isotope data from nearly all Sn-W
deposits indicate that the mineralizing fluids were equilibrated isotopically with a hot (> 400 °C)
granitic source rock, prior to their transport into a cooler (< 400 °C) ore deposition site.

21
The differentiation between magmatic and metamorphic fluids in terms of δ18O and δD is limited,
making interpretations concerning the mixing of these two fluid phases difficult. Isotope analysis of
quartz samples from the RMN Sn-mineralized veins indicates that the vein-forming fluids were
indeed largely influenced by metamorphic processes or a metamorphic host rock – equilibrated fluid
and, therefore, do not indicate a direct magmatic origin. The quartz stable isotope data furthermore
justifies the assumption that meteoric fluids did not play a major role in the genesis of the RMN Sn-
bearing quartz veins (see also Dewaele et al., 2016a, 2010). This is in agreement with the granite
intrusion depth, which have been determined to be 10 – 16 km (Lehmann et al., 2014).
5.2 Fractional crystallization in the pegmatites
K/Rb versus Cs in muscovite has been reported to be a reliable indicator of pegmatite evolution (e.g.
Černý et al., 1985; Jolliff et al., 1992; Oyarzábal et al., 2009; Roda-Robles et al., 2012; Vieira et al.,
2011). During fractional crystallization, bulk incompatible elements get enriched in the residual melt,
while bulk compatible elements get depleted. Trace element concentrations in the evolving melt
(and precipitating crystals) obey the Rayleigh law of fractionation (Neumann et al., 1954). The
concentration of a particular element in a mineral is dependent on its crystal-melt partition
coefficient (Kd) and the melt concentration at the moment of precipitation. An evolutionary sequence
throughout the crystallizing melt, as function of the crystallized fraction F, can be established
quantitatively if the initial composition of the granitic melt, the mineral proportions during evolution
and the required Kd values are known (cf. Hulsbosch et al., 2014; Jolliff et al., 1992; Roda-Robles et
al., 1999). Rb and Cs are both bulk incompatible elements (D > 1) in granite-pegmatite systems
(Martins et al., 2012; Saleh et al., 2008; Viana et al., 2007). Therefore, it is expected that the
concentrations of these trace elements increase during fractional crystallization in the residual melt,
which is consequently reflected in the muscovite geochemistry. Indeed, a negative trend in the Cs –
K/Rb graph is observed (figure 6b), which is compatible with a progressive magmatic evolution by
fractional crystallization. Furthermore, it was observed that Ba in pegmatitic muscovite shows a

22
positive correlation with the K/Rb-ratio (figures 6a). Crystallization of feldspars and micas has been
reported to result in progressive depletion of Ba and Sr (Jolliff et al., 1992; Oyarzábal et al., 2009;
Roda-Robles et al., 2012; Vieira et al., 2011).The Ba- data are thus likewise in accordance with an
evolution that can be attributed to fractional crystallization. This is not the case for Sr, as a positive
Rb-Sr correlation can be observed in figure 6g. Sr-content in muscovite increases from 10 to 30 ppm
with increasing Rb (1000 – 10.000 ppm). The radioactive decay of 87Rb to 87Sr could be the cause of
the positive correlation. This process has been reported to be significant for old, Rb-rich minerals
(Černý et al., 2012), as is the case for the pegmatitic muscovite of the RMN area. Furthermore,
significant Sr-loss due to post-crystallization mobility in pegmatite systems has been documented
(Clark and Černý, 1987). Therefore, even though Sr generally behaves as a bulk incompatible element
in a granite-pegmatite system due to the crystallization of feldspar, a negative Rb-Sr correlation is
not always present and Sr-concentrations should not be used for geochemical interpretations (Černý
et al., 2012; Clark and Černý, 1987). Sn-content was observed to be highest in muscovite from
mineralized pegmatites. As stated by Smeds (1992), Sn-content of muscovite is a good indicator for
the presence of cassiterite mineralization. Although the latter established the distinction between
non-mineralized and mineralized pegmatites at 600 ppm Sn in muscovite, in the Rwamagana-Musha-
Ntunga area this boundary is at about 400 ppm Sn (figure 6f).
It was not possible to obtain compositional data on the Lake Muhazi granite as no fresh outcrops of
granite were observed in the Rwamagana-Musha-Ntunga area. This implies that the exact degree of
fractional crystallization cannot be assessed directly. Therefore, muscovite data of this study is
compared to the data and model for the Gitarama-Gatumba pegmatite field in West Rwanda
(figure 2; Hulsbosch et al., 2014), which has a similar age, geological setting and petrological history.
Based on muscovite and feldspar geochemistry, the regional mineralogical zonation of the
pegmatites around the G4 Gitarama pluton could be quantified in terms of a petrogenetic sequence
of Rayleigh fractional crystallization. This model shows an evolution of barren biotite-dominant (F =
0 – 0.69), over barren two-mica-dominant (F = 0.69 – 0.92) and barren muscovite-dominant (F = 0.92

23
– 0.98) common pegmatites to eventually Nb-Ta-Sn mineralized (F > 0.98) rare-element pegmatites
(Hulsbosch et al., 2014). In terms of K/Rb-ratio and trace elements, the composition of pegmatitic
muscovite from the RMN study area is in general very similar to that of muscovite from the
muscovite- and mineralized-type pegmatites of the Gitarama-Gatumba (West-Rwanda; Hulsbosch et
al., 2014, 2013), except for a relative enrichment in Sr for the RMN muscovites (10 – 30 ppm versus 1
– 6 ppm). A detailed comparison in terms of K, Rb and Cs content is given in figure 10. The Rb-
content of the RMN pegmatite samples corresponds to that of Gitarama-Gatumba muscovite from
pegmatites representing a fractionation degree of the parental granitic melt exceeding 0.92, i.e. from
the muscovite and mineralized pegmatites (Hulsbosch et al., 2014). The RMN pegmatitic muscovite is
relatively enriched in Cs compared to Gitarama-Gatumba muscovite: the samples correspond to a
degree of fractionation higher than 0.98 regarding Cs-content.
Fig. 10 Comparison of Rwamagana-Musha-Ntunga muscovite samples of this study with the
pegmatitic muscovite zonation model of Gitarama-Gatumba of Hulsbosch et al. (2014) and the
Nyakabingo quartz vein muscovite samples of Hulsbosch et al. (2016). F represents the fraction of the
melt that crystallized.
5.3 Furthermore, pegmatitic muscovite from the RMN area shows a slightly more fractionated
signature compared to the LCT-family Sebago ‘simple’ pegmatites (southern Maine, USA; Wise
and Brown, 2010) and the lower boundary zone pegmatites of the Pinilla de Fermoselle
pegmatite system (Spain; Roda-Robles et al., 2012). This is expressed by a relative enrichment of
Cs, Rb, Sr and Sn in the RMN pegmatitic muscovite. Other trace elements, such as Ba, Li, Nb and
Ta are largely present in similar concentrations for the RMN and Sebago pegmatites, while the
Pinilla de Fermoselle pegmatitic muscovite has lower Ba and Ta, and higher W and Li contents
compared to the RMN muscovite (Roda-Robles et al., 2012). In contrast, the LCT Tanco pegmatite
(Manitoba, Canada) is more fractionated than the RMN pegmatites. Compared to the muscovites
analyzed in this study, the Tanco muscovite crystals show a lower K/Rb-ratio and higher Cs, Li, Rb

24
and Ta content (Van Lichtervelde et al., 2008). Nb-concentrations are lower, which possibly can
be attributed to earlier crystallization of columbite ([Fe, Mn]Nb2O6). Fluid mixing in the quartz
veins
5.3.1 Quartz vein muscovite
To determine if a magmatic (granitic or pegmatitic) component contributed to the fluid from which
the Sn-mineralized quartz veins precipitated, the geochemical signature of quartz vein muscovite is
compared to thatof pegmatitic muscovite. Quartz vein muscovite contains high amounts of Cs,
similar to pegmatitic muscovite (figure 6b). A high Cs-content is not characteristic of a metamorphic
fluid (cf. Marsala et al., 2013; Rauchenstein-Martinek et al., 2016), but rather indicates that the
quartz veins precipitated from a fluid phase with a magmatic origin or component. Kfm-values (fluid-
melt partition coefficient) of 0.4 to 8.6 (2.9 ± 2.6; n = 12) have been measured for Cs (Zajacz et al.,
2008). A Kfm higher than unity indicates that Cs will preferentially partition in a fluid phase when
present. Given the high affinity of Cs for an exsolving fluid, two possible hypotheses can explain the
similar range of Cs-content observed in the quartz vein and pegmatitic muscovite samples. The first
hypothesis postulates that the fluid exsolution took place from granitic or early pegmatitic melt
which contains low amounts of Cs compared to the analyzed pegmatite muscovite samples. The
second hypothesis is that the fluid exsolved from the pegmatites only in a late-stage, when these
were already highly differentiated. Subsequently this fluid was diluted by a metamorphic fluid,
especially concerning the granitophile, soluble elements, such as Cs.
In contrast to Cs, the Rb-content of quartz vein muscovite is considerably lower than that of
pegmatitic muscovite (figure 6e). The Kfm values for Rb vary between 0.16 and 1.08 (0.5 ± 0.2; n = 12;
Zajacz et al., 2008), indicating that Rb will be less partitioned from a melt into an exsolving fluid
phase. A higher fluid compatibility for Cs compared to Rb has been reported by London (2005) and
Dewaele et al. (2016b). This geochemical decoupling between Cs and Rb upon fluid exsolution is
reflected in the muscovite data, which is an additional indication for a magmatic component in the

25
quartz vein fluid. Furthermore, trace elements Ba and Sr can display highly soluble Kfm values (Zajacz
et al., 2008) and the data of this study show that quartz vein muscovite is enriched in Ba and Sr
compared to pegmatitic muscovite. Accordingly the signatures of these alkali earth elements in
muscovite are also in accordance with the hypothesis that the quartz veins at least partly originated
from a magmatic fluid that exsolved from granitic or pegmatitic melt.
The large difference in Sr-content between pegmatitic and quartz vein muscovite can have multiple
causes. One possibility is the crystallization of feldspar, in which Sr can substitute for Ca. Feldspars
form a dominant constituent of the pegmatites (now kaolinitized), which could explain the relative
depletion in Sr observed for this muscovite type. Alternatively the high Kfm of Sr and mixing with a
metamorphic, Sr-rich fluid can be responsible for the relatively Sr-enriched character of quartz vein
muscovite.
Muscovite from Sn-mineralized quartz veins in the RMN area contains 500 – 750 ppm Sn, which is
high in comparison to other hydrothermal quartz vein systems mineralized in Sn, such as the W-Sn
Panasqueira deposit, Portugal (226 ppm Sn; Neiva, 1987) and the hydrothermal W-Sn veins in
Maoping, China (377 ± 4.5 ppm Sn; Legros et al., 2016). Despite this high Sn-content, no cassiterite
inclusions were observed microscopically in muscovite. The positive correlation between Sn and Cs
observed in hydrothermal muscovite from the Panasqueira, Montezinho, Argozelo and Borralha
deposits in Portugal (Neiva, 1987) is also present in this dataset.
5.3.2 Fluid geochemistry
Based on the fluid inclusion geochemical signature, we propose that the medium saline fluid present
in pegmatite-associated quartz from the Rwamagana-Musha-Ntunga area represents a magmatic
fluid, exsolved upon water saturation of the pegmatitic melt. This fluid is particularly enriched in the
bulk incompatible elements Rb, Cs and Sn. By fractional crystallization, bulk incompatible elements
such as Rb, Cs and Sn progressively get enriched in the residual melt compared to the initial granitic
melt. The melt from which fluid exsolves at a late stage is thus relatively enriched in these elements

26
compared to the melt from which an early-stage fluid would exsolve. This pre-concentration
automatically is reflected in the composition of the exsolved fluid.. Additionally, Cs has a high fluid-
melt partition coefficient (Zajacz et al., 2008). The presence of small cassiterite crystals can explain
the highest Sn-contents occurring in some of the inclusions. These are observed as small black spots
in the fluid inclusions (figure 7a). The magmatic fluid inclusions also show a slight relative depletion
in Sr (compared to the metamorphic fluid), which is attributed to feldspar crystallization in the
pegmatites, as the exsolution origin of this fluid would be expected to result in Sr-rich fluids (cf. the
high Kfm for Sr; Zajacz et al., 2008). The low values of tungsten are in accordance with the model
proposed by Hulsbosch et al. (2016) in which fluid exsolution at the granite-pegmatite transition
scavenges the highly fluid-compatible W from the magmatic system and can give rise to early W-
mineralized quartz veins (e.g. in Nyakabingo; Hulsbosch et al., 2016). The high Li-content can be due
to small mineral inclusions such as zabuyelite (Li2CO3) or Li-mica inclusions.
The low-salinity fluid inclusions from metamorphic quartz (Kibuye area) represent the regionally
present metamorphic fluid. This metamorphic fluid typically contains low amounts of Rb and Cs,
often below the detection limit, but is slightly enriched in Sr compared to the primary magmatic
fluid. The Rb-, Sn- and Cs-content of the fluid inclusions in this metamorphic quartz vein corresponds
with the ranges observed in other metamorphic fluids (e.g. Fyfe et al., 1978 (7 ppm Sn); Marsala et
al., 2013 (< 13 ppm Rb, < 74 ppm Cs); Rauchenstein-Martinek et al., 2016 (< 136 ppm Rb, < 35 ppm
Cs)).
5.3.3 Geochemical mixing model
The exsolution of a fluid phase at the transition from G4-granite to pegmatite, i.e. prior to or early
during pegmatite emplacement, has been inferred to give rise to W-mineralized hydrothermal quartz
veins in the Nyakabingo area (Central Rwanda; figure 2), based on muscovite and fluid inclusion
geochemistry, dating and modelling (Hulsbosch et al., 2016). When the samples of this study are
compared to those of Hulsbosch et al. (2016) (figure 10), it can be observed that the Rwamagana-

27
Musha-Ntunga area quartz vein muscovite samples, both from barren and Sn-mineralized veins, have
a K/Rb-ratio which is equal or lower than that of Nyakabingo quartz vein muscovite (cf. Hulsbosch et
al., 2016), i.e. a higher Rb-content. The Cs-concentrations in muscovite samples of this study are very
high compared to those of Nyakabingo quartz vein muscovite.
Based on the elevated Rb- and Cs-contents, an early exsolution event at the granite-pegmatite
transition can be excluded, as illustrated in figure 11. This figure conceptually shows the change in
geochemical signatures during exsolution, mixing and muscovite crystallization. No quantitative
values were assigned, as this differs for each system. For the RMN Sn-quartz veins, the exsolution
most likely occurred at a later stage, from a highly differentiated melt. Additionally, this corresponds
to the field observations of cross-cutting relationships, which indicate that pegmatites and quartz
veins were largely syngenetic (Hulsbosch et al., 2017). In this scenario, mixing with a metamorphic
fluid is postulated to explain the observed Rb-Cs signature of quartz vein muscovite compared to
pegmatitic muscovite (figure 11). This proposition is also consistent with the stable isotope data.
Fig. 11 Conceptual representation of (a) the expected muscovite signature, (b) the expected fluid
signature and (c) the geological situation in case of early (1), intermediate (2) and late (3) exsolution
and subsequent mixing.
Mixing of an exsolved magmatic fluid with a metamorphic fluid has already been inferred in other
granite systems, e.g. the Cornubian batholith (England), based on bulk solute and volatile analyses of
fluid inclusions (Wilkinson, 1990). Hydrothermal convection systems induced by granite intrusions
have been indicated by thermodynamic modelling (e.g. Fehn, 1985), mineralogy, fluid inclusion and
isotopic analyses (e.g. Boyce et al., 2003) and numerical modelling (e.g. Eldursi et al., 2009), i.e.
metamorphic (host-rock equilibrated) fluids can be part of a hydrothermal convective system
induced by a granite intrusion (Wilkinson, 1990).
The hypothesis of quartz vein genesis, i.e. a late exsolution event and mixing with a host rock fluid,
can be quantitatively verified using the Rb-, Sn- and Cs-content of the magmatic and metamorphic

28
quartz vein fluids analyzed by LA-ICP-MS. The mixing trend between the initial magmatic fluid and
the metamorphic fluid is calculated in order to simulate the composition of a mixed hydrothermal
fluid. With the crystal/fluid partition coefficients for muscovite, the expected geochemical signature
of muscovite precipitating from this calculated fluid can be determined. The comparison between
the calculated and analyzed muscovite Rb-, Sn- and Cs-concentrations will test the pertinence of this
petrogenetic hypothesis. Simultaneously, an estimation of the degree of mixing can be made.
The geochemical composition of the magmatic and metamorphic fluid endmembers that are used in
the modelling, is summarized in table 8. The Rb-, Sn- and Cs-contents of the analyzed fluid inclusions
for each endmember show a highly skewed distribution. Additionally, many values below the
detection limit were measured for the fluid inclusions in the metamorphic quartz and some of the
magmatic fluid inclusions contain very high amounts of Sn, which are attributed to the presence of
small cassiterite inclusions. Therefore median values were used in further calculations. Values below
the detection limit were substituted by the detection limit divided by , as proposed by Verbovsek
(2011) to calculate the median.
Table 8 Geochemistry of the magmatic and metamorphic fluid endmembers. Values are in ppm.
The concentrations of Rb, Sn and Cs in muscovite precipitating from the mixed hydrothermal fluid
are, besides dependent on the Rb-, Sn- and Cs-content of the mixed fluid, also determined by the
Kcf,ij-values, i.e. the crystal-fluid partition coefficients. Numerical values of these parameters
applicable to the magmatic pegmatite-fluid system are not available in literature. Therefore they
were calculated for each element with aid of the published values of the fluid-melt partition
coefficient, Kfm,i, and the crystal-melt partition coefficient, Kd,ij, for muscovite which has been used in
the past (e.g. Hulsbosch et al., 2014) and proven to be representative for the system. Kcf,ij-values
were calculated according to the formula: (table 9). Because there is no
consensus on the extent of fluid compatibility of Cs in natural as well as experimental set-ups (cf.

29
Zajacz et al., 2008), the lowest and highest value (assuming Cs is fluid-compatible; i.e. Kfm > 1) were
used in the modelling.
Table 9 Calculations of the fluid-crystal coefficients for Rb, Sn and Cs in muscovite (using the datasets
of Adam and Green, 2006; Hu et al., 2008; Icenhower and London, 1995; Zajacz et al., 2008).
The expected Cs-, Sn- and Rb-concentrations in muscovite are calculated for different mixing ratios
(figure 12). The value “0” was taken to indicate the pure magmatic signature while “1” represents the
metamorphic signature.
Fig. 12 Analyzed quartz vein muscovite (•) versus calculated quartz vein muscovite (x) composition
for multiple mixing ratios (∆). 0 = pegmatitic fluid, 1 = metamorphic fluid.
These calculations show that mixing with a metamorphic fluid explains the Rb- and Sn-concentrations
of the quartz vein muscovite. Most quartz vein muscovite samples are enriched in Cs compared to
the expected values, even in the case of Kfm,Cs = 1.4. However, the trend observed in the analytical
results is in both cases parallel to the calculated trend. A plausible reason of the relative depletion of
Cs in the calculations is that in reality, the Kd,Cs-muscovite (i.e. the compatibility of Cs in muscovite) is
higher in Cs-rich systems. Except for this discrepancy in Cs, the process of mixing between a lately
exsolved magmatic and a metamorphic fluid is coherent with the observed Rb-Sn-Cs signature in
quartz vein muscovite from the Rwamagana-Musha-Ntunga area. The calculations furthermore show
that the degree of mixing is highly variable over different quartz veins. The analytical data
demonstrates the mixed fluid consists of 20 – 95% of a magmatic fluid and 5 – 80 % of an external
(metamorphic) fluid.
Furthermore, fluid mixing can be a major control on the precipitation of Sn-mineralization in
hydrothermal quartz veins. In hydrothermal fluids, tin is dominantly transported in the bivalent state
as chloride-complex (Migdisov and Williams-Jones, 2005). To precipitate as cassiterite, Sn(II) has to
be oxidized to an oxidation state of +IV. A possible reaction mechanism could be (Heinrich, 1990):

30
.
This reaction indicates that cassiterite precipitation is favored by any reaction that induces acid
neutralization or salinity decrease (Heinrich, 1990). Mixing of a magmatic fluid with preheated
meteoric water has been proposed as trigger for Sn- and W-precipitation in quartz veins associated
with the Mole Granite, Australia (Audétat et al., 2000b). The low salinity of the metamorphic fluids
present in the Rwamagana-Musha-Ntunga area and the deduced high degree of mixing indicates that
a salinity decrease of the magmatic fluid certainly can be achieved.
6 Conclusion
The geochemical evolution in the granite-pegmatite-quartz vein system in the Rwamagana-Musha-
Ntunga area (East Rwanda) was successfully investigated by muscovite and fluid geochemistry. Trace
element content variation in pegmatitic muscovite demonstrates that the pegmatite geochemical
evolution can be explained by fractional crystallization. Comparison with the granite-pegmatite
system of the Gitarama-Gatumba area (West-Rwanda) indicates that the pegmatites of the
Rwamagana-Musha-Ntunga area crystallized from a highly fractionated residual granitic melt.
In previous research, the primary signature of peribatholitic, Sn-bearing quartz veins was often
observed to be masked by post-magmatic alteration processes, which complicates the identification
of a genetic relationship between granites, pegmatites and quartz veins. Quartz stable isotope data
of the Sn-mineralized quartz veins show this is the case for the Rwamagana-Musha-Ntunga area.
Therefore, an alternative approach was applied. By analyzing fluid inclusions in quartz from
pegmatite bodies, the geochemistry of the primary magmatic fluid could be determined. In
combination with the metamorphic fluid endmember signature and muscovite geochemistry, the
interaction between these two fluids in the genesis of the peribatholitic, Sn-mineralized quartz veins
could be assessed.

31
Muscovite geochemistry (Rb, Cs and Sn) indicates that exsolution of a magmatic fluid took place
relatively late during the fractional crystallization of the pegmatitic melt. The mutual cross-cutting
relationships of pegmatites and quartz veins evidence that their emplacement was at least partially
contemporaneous. Quantitative simulation of the Rb-Sn-Cs muscovite signature and comparison with
the analytical muscovite data confirms that the quartz veins have a mixed magmatic-metamorphic
origin. The expected muscovite signature was simulated using fluid-crystal partition coefficients and
the mixed fluid geochemistry. The hydrothermal mixed fluid composition was determined by
calculating the mixing trend between the magmatic and metamorphic fluids present in the
Rwamagana-Musha-Ntunga area and the KAB, as determined by LA-ICP-MS. The simulated trends are
parallel with the observed trend, with a slight discrepancy in Cs-content. This deviation is probably
caused by using a too low Kd,Cs-muscovite. The quantification indicates that the hydrothermal fluid from
which the Sn-bearing quartz veins in the Rwamagana-Musha-Ntunga area precipitated consists for 20
– 95 % of a magmatic fluid component and for5 % – 80 % of an external metamorphic fluid
component.
Acknowledgments
Johanna Van Daele is a research assistant of the Research Foundation – Flanders (FWO). Research of
Niels Hulsbosch is funded by a postdoctoral fellowship of the KU Leuven (2017) and a postdoctoral
fellowship of the FWO (2017 – 2020). Field work was supported by a grant from the Dirk Vogel Fund.
Additional financial support from the research grant C14/17/056 of the KU Leuven Special Research
Fund is acknowledged. Research activity on Sn-W ores of Marie-Christine Boiron is supported by the
French National Research Agency through the national program ‘Investissements d’avenir’
(reference ANR-10-LABX-21–LABEX RESSOURCES21). Dr. Francis Gatare, dr. Emmanuel Munyengabe,
dr. Michael Biryabarema and Alain Ntenge of the Rwanda Mines, Petroleum and Gas Board are
thanked for the authorization to conduct field work in Rwanda and to export the samples. We wish
to thank Mark Thompson, CEO of Piran Resources, Ben Smit, Managing Director, and Rassie Erasmus,

32
Project Director, for giving us access to the Musha-Ntunga mining area and Didier Kinyaga, Senior
Geologist, for the introduction on the geology of the area. We also would like to express our
gratitude to dr. Elvira Vassilieva (KU Leuven) for her help with the ICP-OES and ICP-MS analyses and
to Herman Nijs (KU Leuven) for preparing the high-quality wafers. We thank editor-in-chief prof. dr.
Franco Pirajno and associate editor prof. dr. Kim Hein for the editorial handling of the manuscript.
We gratefully acknowledge prof. dr. Olivier Vanderhaeghe and an anonymous reviewer for their
careful review and insightful comments that improved the manuscript.
Conflict of interest The authors can confirm that there is no disclosure of potential conflicts of
interest, no research involving neither human participants nor animals.
References
Adam, J., Green, T., 2006. Trace element partitioning between mica- and amphibole-bearing garnet
lherzolite and hydrous basanitic melt: 1. Experimental results and the investigation of controls
on partitioning behaviour. Contrib. to Mineral. Petrol. 152, 1–17.
https://doi.org/10.1007/s00410-006-0085-4
Alfonso, P., Melgarejo, J., Yusta, I., Velasco, F., 2003. Geochemistry of feldspars and muscovite in
granitic pegmatite from the Cap de Creus pegmatite field, Catalonia, Spain. Can. Mineral. 41,
103–116.
Audétat, A., Günther, D., Heinrich, C.A., 2000a. Magmatic-hydrothermal evolution in a fractionating
granite: A microchemical study of the Sn-W-F-mineralized Mole Granite (Australia). Geochim.
Cosmochim. Acta 64, 3373–3393. https://doi.org/10.1016/S0016-7037(00)00428-2
Audétat, A., Güther, D., Heinrich, C.A., 2000b. Causes for Large-Scale Metal Zonation around
Mineralized Plutons: Fluid Inclusion LA-ICP-MS Evidence from the Mole Granite, Australia. Econ.

33
Geol. 95, 1563–1581. https://doi.org/10.2113/gsecongeo.95.8.1563
Baker, T., Pollard, P.J., Mustard, R., Markl, G., Graham, J.L., 2005. A comparison of granite-related tin,
tungsten, and gold-bismuth deposits: implications for exploration. SEG Newsl. 61, 5–17.
Bakker, R.J., 1997. Clathrates: computer programs to calculate fluid inclusion V-X properties using
clathrate melting temperatures. Comput. Geosci. 23, 1–18.
Bakker, R.J., Brown, P.E., 2003. Computer modelling in fluid inclusion research, in: Samson, I.M.,
Anderson, A., Marshall, D. (Eds.), Fluid Inclusions: Analysis and Interpretation. Mineralogical
Association of Canada Short Course Series 32, pp. 175–212.
Baudet, D., Hanon, M., Lemonne, E., Theunissen, K., 1988. Lithostratigraphie du domaine
sédimentaire de la chaîne kibarienne au Rwanda. Ann. la société géologique Belgique 112, 225–
246.
Beus, A.A., 1986. Geology of Tungsten. UNESCO Publishing.
Boyce, A.J., Fulignati, P., Sbrana, A., 2003. Deep hydrothermal circulation in a granite intrusion
beneath Larderello geothermal area (Italy): Constraints from mineralogy, fluid inclusions and
stable isotopes. J. Volcanol. Geotherm. Res. 126, 243–262. https://doi.org/10.1016/S0377-
0273(03)00150-1
Breiter, K., Ďurišová, J., Hrstka, T., Korbelová, Z., Vašinová Galiová, M., Müller, A., Simons, B., Shail,
R.K., Williamson, B.J., Davies, J.A., 2018. The transition from granite to banded aplite-pegmatite
sheet complexes: An example from Megiliggar Rocks, Tregonning topaz granite, Cornwall. Lithos
302–303, 370–388. https://doi.org/10.1016/j.lithos.2018.01.010
Brinckmann, J., Lehmann, B., 1983. Exploration de la bastnaésite-moncite dans la région de Gakara,
Burundi. Unpubl. report, 157 pp.
Brinckmann, J., Lehmann, B., Hein, U., Höhndorf, A., Mussallam, K., Weiser, T., Timm, F., 2001. La

34
géologie et la minéralisation primaire de l’or de la Chaîne Kibarienne, nord-ouest du Burundi,
Afrique orientale, Bundesanstalt für Geowissenschaften und Rohstoffe.
Brinckmann, J., Lehmann, B., Timm, F., 1994. Proterozoic gold mineralization in NW burundi. Ore
Geol. Rev. 9, 85–103. https://doi.org/10.1016/0169-1368(94)90023-X
Cahen, L., Ledent, D., 1979. Précisions sur l’age, la pétrogénèse et la position stratigraphique des
granites à étain de l’est de l’Afrique Centrale. Bull. Société Belge Géologique 88, 33–49.
Černý, P., Ercit, T.S., 2005. The Classification of Granitic Pegmatites Revisited. Can. Mineral. 43, 2005–
2026. https://doi.org/10.2113/gscanmin.43.6.2005
Černý, P., Meintzer, R.E., Anderson, A.J., 1985. Extreme Fractionation in Rare-Element Granitic
Pegmatites: Examples of Data and Mechanisms. Can. Mineral. 23, 381–421.
Černý, P., Teertstra, D.K., Chapman, R., Selway, J.B., Hawthorne, F.C., Ferreira, K., Chackowsky, L.E.,
Wang, X.-J., Meintzer, R.E., 2012. Extreme Fractionation and Deformation of the Leucogranite –
Pegmatite Suite At Red Cross Lake, Manitoba, Canada, IV. Mineralogy. Can. Mineral. 50, 1839–
1875.
Chicharro, E., Boiron, M.-C., López-García, J.Á., Barfod, D.N., Villaseca, C., 2016. Origin, ore forming
fluid evolution and timing of the Logrosán Sn-(W) ore deposits (Central Iberian Zone, Spain).
Ore Geol. Rev. 72, 896–913. https://doi.org/10.1016/j.oregeorev.2015.09.020
Clark, G.S., Černý, P., 1987. Radiogenic 87Sr, its mobility, and the interpretation of RbSr fractionation
trends in rare-element granitic pegmatites. Geochim. Cosmochim. Acta 51, 1011–1018.
https://doi.org/10.1016/0016-7037(87)90112-8
De Clercq, F., 2012. Metallogenesis of Sn and W vein-type deposits in the Karagwe-Ankole Belt
(Rwanda). KU Leuven.
De Clercq, F., Muchez, P., Dewaele, S., Boyce, A., 2008. The tungsten mineralisation at Nyakabingo

35
and Gifurwe (Rwanda): preliminary results. Geol. Belgica 11, 251–258.
de Kock, G.S., Dhansay, T., Armstrong, R., 2014. Akanyaru-Ankole Supergroup of Rwanda: strata,
structures and ages, in: CAG 25. Dar Es Salaam.
Dewaele, S., De Clercq, F., Hulsbosch, N., Piessens, K., Boyce, A., Burgess, R., Muchez, P., 2016a.
Genesis of the vein-type tungsten mineralization at Nyakabingo (Rwanda) in the Karagwe–
Ankole belt, Central Africa. Miner. Depos. 51, 283–307. https://doi.org/10.1007/s00126-015-
0608-x
Dewaele, S., De Clercq, F., Muchez, P., Schneider, J., Burgess, R., Boyce, A., Fernandez Alonso, M.,
2010. Geology of the cassiterite mineralisation in the Rutongo area, Rwanda (Central Africa):
Current state of knowledge. Geol. Belgica 13, 91–112.
Dewaele, S., Henjes-Kunst, F., Melcher, F., Sitnikova, M., Burgess, R., Gerdes, A., Fernandez-Alonso,
M., De Clercq, F., Muchez, P., Lehmann, B., 2011. Late Neoproterozoic overprinting of the
cassiterite and columbite-tantalite bearing pegmatites of the Gatumba area, Rwanda (Central
Africa). J. African Earth Sci. 61, 10–26. https://doi.org/10.1016/j.jafrearsci.2011.04.004
Dewaele, S., Hulsbosch, N., Cryns, Y., Boyce, A., Burgess, R., Muchez, P., 2016b. Geological setting
and timing of the world-class Sn, Nb-Ta and Li mineralization of Manono-Kitotolo (Katanga,
Democratic Republic of Congo). Ore Geol. Rev. 72, 373–390.
https://doi.org/10.1016/j.oregeorev.2015.07.004
Donnelly, T., Waldron, S., Tait, A., Dougans, J., Bearhop, S., 2001. Hydrogen isotope analysis of
natural abundance and deuterium-enriched waters by reduction over chromium on-line to a
dynamic dual inlet isotope-ratio mass spectrometer. Rapid Commun. Mass Spectrom. 15, 1297–
1303. https://doi.org/10.1002/rcm.361
Duan, Z., Møller, N., Weare, J.H., 1996. A general equation of state for supercritical fluid mixtures and

36
molecular dynamics simulation of mixture PVTX properties. Geochim. Cosmochim. Acta 60,
1209–1216.
Eldursi, K., Branquet, Y., Guillou-Frottier, L., Marcoux, E., 2009. Numerical investigation of transient
hydrothermal processes around intrusions: Heat-transfer and fluid-circulation controlled
mineralization patterns. Earth Planet. Sci. Lett. 288, 70–83.
https://doi.org/10.1016/j.epsl.2009.09.009
Fehn, U., 1985. Post-magmatic convection related to high heat production in granites of SW England:
a theoretical study. Inst. Min. Metall. High Heat, 99–112.
Fernandez-Alonso, M., Cutten, H., De Waele, B., Tack, L., Tahon, A., Baudet, D., Barritt, S.D., 2012.
The Mesoproterozoic Karagwe-Ankole Belt (formerly the NE Kibara Belt): The result of
prolonged extensional intracratonic basin development punctuated by two short-lived far-field
compressional events. Precambrian Res. 216–219, 63–86.
https://doi.org/10.1016/j.precamres.2012.06.007
Fernandez-Alonso, M., Tack, L., Tahon, A., 2007. Geological Map of the Mesoproterozoic
Northeastern Kibara Belt, 1:500.000.
Frisch, W., 1971. Die Zinn-Wolfram-Provinz in Rwanda (Zentral-Afrika). Erzmetall 24, 593–600.
Fyfe, W.S., Price, N.J., Thompson, A.B., 1978. Fluids in the earth’s crust. Elsevier Scientific Publishing
Company, Amsterdam.
Gérards, J., Ledent, D., 1970. Grands traits de la géologie du Rwanda, différents types de roches
granitiques et premières données sur les âges de ces roches. Ann. la société géologique
Belgique 93, 477–489.
Gleeson, S.A., Roberts, S., Fallick, A.E., Boyce, A.J., 2008. Micro-Fourier Transform Infrared (FT-IR) and
δD value investigation of hydrothermal vein quartz: Interpretation of fluid inclusion δD values in

37
hydrothermal systems. Geochim. Cosmochim. Acta 72, 4595–4606.
https://doi.org/10.1016/j.gca.2008.06.014
Goldstein, R.H., Reynolds, T.J., 1994. Systematics of fluid inclusions in diagenetic minerals. SEPM.
Guillong, M., Meier, D., Allan, M.M., Heinrich, C.A., Yardley, B.W.D., 2008. Appendix A6: SILLS: a
MATLAB-based program for the reduction of laser ablation ICP-MS data of homogeneous
materials and inclusions, in: Sylvester, P. (Ed.), Laser Ablation ICP-MS in the Earth Sciences:
Current Practices and Outstanding Issues. Mineralogical Association of Canada Short Course,
Vancouver, B.C.
Hanon, M., Rusanganwa, J., 1991. Carte Géologique du Rwanda, Feuille Kigali, 1:100,000 et note
explicative. Département de Géologie et de Minéralogie du Musée royal de l’Afrique Centrale et
le Ministère de l’Industrie et de l’Artisanat du Rwanda.
Harlaux, M., Mercadier, J., Bonzi, W.M., Kremer, V., Marignac, C., Cuney, M., 2017. Geochemical
Signature of Magmatic-Hydrothermal Fluids exsolved from the Beauvoir Rare-Metal Granite (
Massif Central , France ): Insights from LA-ICPMS Analysis of Primary Fluid Inclusions. Geofluids
1–26. https://doi.org/10.1155/2017/1925817
Haynes, F.M., 1985. Determination of fluid inclusion compositions by sequential freezing. Econ. Geol.
80, 1436–1439.
Heinrich, C.A., 1990. The chemistry of hydrothermal tin(-tungsten) ore deposition. Econ. Geol. 85,
457–481. https://doi.org/10.2113/gsecongeo.85.3.457
Hoefs, J., 2015. Stable isotope geochemistry, Seventh. ed. Springer. https://doi.org/10.1007/978-3-
319-19716-6
Hu, X., Bi, X., Hu, R., Shang, L., Fan, W., 2008. Experimental study on tin partition between granitic
silicate melt and coexisting aqueous fluid. Geochem. J. 42, 141–150.

38
https://doi.org/10.2343/geochemj.42.141
Hulsbosch, N., 2018. Nb-Ta-Sn-W distribution in granite-related ore systems: fractionation
mechanisms and examples from the Karagwe-Ankole Belt of Central Africa, in: Decrée, S., Robb,
L. (Eds.), Ore Deposits Origin Exploration and Exploitation. Wiley.
Hulsbosch, N., 2016. Chemical fractionation in granite-related ore systems - Evidence from Nb-Ta-Sn
pegmatite-type and Sn-W quartz vein-type mineralisation in the Karagwe-Ankole Belt (Rwanda).
Unpublished PhD-thesis, KU Leuven.
Hulsbosch, N., Boiron, M.-C., Dewaele, S., Muchez, P., 2016. Fluid fractionation of tungsten during
granite–pegmatite differentiation and the metal source of peribatholitic W quartz veins:
Evidence from the Karagwe-Ankole Belt (Rwanda). Geochim. Cosmochim. Acta 175, 299–318.
https://doi.org/10.1016/j.gca.2015.11.020
Hulsbosch, N., Hertogen, J., Dewaele, S., Andre, L., Muchez, P., 2013. Petrographic and mineralogical
characterisation of fractionated pegmatites culminating in the Nb-Ta-Sn pegmatites of the
Gatumba area (western Rwanda). Geol. Belgica 16, 105–117.
Hulsbosch, N., Hertogen, J., Dewaele, S., André, L., Muchez, P., 2014. Alkali metal and rare earth
element evolution of rock-forming minerals from the Gatumba area pegmatites (Rwanda):
Quantitative assessment of crystal-melt fractionation in the regional zonation of pegmatite
groups. Geochim. Cosmochim. Acta 132, 349–374. https://doi.org/10.1016/j.gca.2014.02.006
Hulsbosch, N., Van Daele, J., Reinders, N., Dewaele, S., Jacques, D., Muchez, P., 2017. Structural
control on the emplacement of contemporaneous Nb-Ta-Sn pegmatite intrusions and Sn quartz
veins: insights from the Musha and Ntunga deposits of the Karagwe-Ankole Belt, Rwanda. J.
African Earth Sci. 137, 24–32.
Icenhower, J., London, D., 1995. An experimental study of element partitioning among biotite,

39
muscovite, and coexisting peraluminous silicic melt at 200 MPa (H2O). Am. Mineral. 80, 1229–
1251.
Jolliff, B.L., Papike, J.J., Shearer, C.K., 1992. Petrogenetic relationships between pegmatite and
granite based on geochemistry of muscovite in pegmatite wall zones, Black Hills, South Dakota,
USA. Geochim. Cosmochim. Acta 56, 1915–1939.
https://doi.org/http://dx.doi.org/10.1016/0016-7037(92)90320-I
Kelly, W.C., Rye, R.O., 1979. Geologic, fluid inclusion, and stable isotope studies of the tin-tungsten
deposits of Panasqueira, Portugal. Econ. Geol. 74, 1721–1822.
https://doi.org/10.2113/gsecongeo.74.8.1721
Kozlik, M., Raith, J.G., Gerdes, A., 2016. U-Pb, Lu-Hf and trace element characteristics of zircon from
the Felbertal scheelite deposit (Austria): New constraints on timing and source of W
mineralization. Chem. Geol. 421, 112–126. https://doi.org/10.1016/j.chemgeo.2015.11.018
Legros, H., Marignac, C., Mercadier, J., Cuney, M., Richard, A., Wang, R.C., Charles, N., Lespinasse,
M.Y., 2016. Detailed paragenesis and Li-mica compositions as recorders of the magmatic-
hydrothermal evolution of the Maoping W-Sn deposit (Jiangxi, China). Lithos 264, 108–124.
https://doi.org/10.1016/j.lithos.2016.08.022
Lehmann, B., Halder, S., Ruzindana Munana, J., de la Paix Ngizimana, J., Biryabarema, M., 2014. The
geochemical signature of rare-metal pegmatites in Central Africa: Magmatic rocks in the
Gatumba tin–tantalum mining district, Rwanda. J. Geochemical Explor. 144, 528–538.
https://doi.org/10.1016/j.gexplo.2013.11.012
Lehmann, B., Nakai, S., Höhndorf, A., Brinckmann, J., Dulski, P., Hein, U.F., Masuda, A., 1994. REE
mineralization at Gakara, Burundi: Evidence for anomalous upper mantle in the western Rift
Valley. Geochim. Cosmochim. Acta 58, 985–992. https://doi.org/10.1016/0016-7037(94)90520-
7
40
Leisen, M., Dubessy, J., Boiron, M.-C., Lach, P., 2012. Improvement of the determination of element
concentrations in quartz-hosted fluid inclusions by LA-ICP-MS and Pitzer thermodynamic
modeling of ice melting temperature. Geochim. Cosmochim. Acta 90, 110–125.
London, D., 2005. Geochemistry of alkali and alkaline earth elements in ore-forming granites,
pegmatites, and rhyolites, in: Linnen, R., Sampson, I. (Eds.), Rare-Element Geochemistry of Ore
Deposits, GAC Short Course Notes 17. pp. 17–43.
Longerich, H.P., Jackson, S.E., Günther, D., 1996. Laser ablation inductivel coupled plasma mass
spectrometric transient signal data aqcuisition and analyte concentration calculation. J. Anal.
At. Spectrom. 11, 899–904.
Marignac, C., Cathelineau, M., 2010. The Nature of Ore-forming Fluids in Peri-Batholitic Sn-W
Deposits and a Classification. James Cook Univ, Townsville.
Marsala, A., Wagner, T., Wälle, M., 2013. Late-metamorphic veins record deep ingression of meteoric
water: A LA-ICPMS fluid inclusion study from the fold-and-thrust belt of the Rhenish Massif,
Germany. Chem. Geol. 351, 134–153. https://doi.org/10.1016/j.chemgeo.2013.05.008
Martins, T., Roda-Robles, E., Lima, A., De Parseval, P., 2012. Geochemistry and evolution of micas in
the Barroso-Alvão pegmatite field, Northern Portugal. Can. Mineral. 50, 1117–1129.
https://doi.org/10.3749/canmin.50.4.1117
Matsuhisa, Y., Goldsmith, J.R., Clayton, R.N., 1979. Oxygen isotopic fractionation in the system
quartz-albite-anorthite-water. Geochim. Cosmochim. Acta 43, 1131–1140.
https://doi.org/10.1016/0016-7037(79)90099-1
Melcher, F., Graupner, T., Gäbler, H.-E., Sitnikova, M., Henjes-Kunst, F., Oberthür, T., Gerdes, A.,
Dewaele, S., 2015. Tantalum–(niobium–tin) mineralisation in African pegmatites and rare metal
granites: Constraints from Ta–Nb oxide mineralogy, geochemistry and U–Pb geochronology.

41
Ore Geol. Rev. 64, 667–719. https://doi.org/10.1016/j.oregeorev.2013.09.003
Melcher, F., Graupner, T., Gäbler, H.E., Sitnikova, M., Oberthür, T., Gerdes, A., Badanina, E., Chudy,
T., 2016. Mineralogical and chemical evolution of tantalum-(niobium-tin) mineralisation in
pegmatites and granites. Part 2: Worldwide examples (excluding Africa) and an overview of
global metallogenetic patterns. Ore Geol. Rev. in press.
https://doi.org/10.1016/j.oregeorev.2016.03.014
Migdisov, A.A., Williams-Jones, A.E., 2005. An experimental study of cassiterite solubility in HCl-
bearing water vapour at temperatures up to 350 °C. Implications for tin ore formation. Chem.
Geol. 217, 29–40. https://doi.org/10.1016/j.chemgeo.2004.11.018
Monteyne-Poulaert, G., Delwiche, R., Safianikoff, A., Cahen, L., 1962. Age de minéralisations
pegmatitiques et filoniennes du Rwanda et du Burundi. Ann. la société géologique Belgique 71,
272–295.
Muchez, P., Marshall, J.D., Touret, J.L.., Viaene, W., 1994. Origin and migration of paleofluids in the
Upper Visean of the Campine Basin, northern Belgium. Sedimentology 41, 133–145.
Neiva, A.M.R., 1987. Geochemistry of white micas from Portuguese tin and tungsten deposits. Chem.
Geol. 63, 299–317. https://doi.org/10.1016/0009-2541(87)90168-9
Neumann, H., Mead, J., Vitaliano, C.J., 1954. Trace element variation during fractional crystallization
as calculated from the distribution law. Geochim. Cosmochim. Acta 6, 90–99.
Oyarzábal, J., Galliski, M.Á., Perino, E., 2009. Geochemistry of K-feldspar and muscovite in rare-
element pegmatites and granites from the Totoral pegmatite field, San Luis, Argentina. Resour.
Geol. 59, 315–329. https://doi.org/10.1111/j.1751-3928.2009.00100.x
Passchier, C.W., Trouw, R.A.J., 2005. Micro-tectonics. Springer Verlag, Berlin-Heidelberg.
Patterson, D.J., Ohmoto, H., Solomon, M., 1981. Geologic setting and genesis of cassiterite-sulfide

42
mineralization at renison bell, western Tasmania-a discussion. Econ. Geol. 76, 393–438.
https://doi.org/10.2113/gsecongeo.77.1.199
Pettke, T., Oberli, F., Audétat, A., Guillong, M., Simon, A.C., Hanley, J.J., Klemm, L.M., 2012. Recent
developments in element concentration and isotope ratio analysis of individual fluid inclusions
by laser ablation single and multiple collector ICP-MS. Ore Geol. Rev. 44, 10–38.
https://doi.org/10.1016/j.oregeorev.2011.11.001
Pichavant, M., Manning, D., 1984. Petrogenesis of tourmaline granites and topaz granites; the
contribution of experimental data. Phys. Earth Planet. Inter. 35, 31–50.
https://doi.org/10.1016/0031-9201(84)90032-3
Piessens, K., Muchez, P., 2009. Calibrating the confocal micro-Raman spectrometer at the GSB-RBINS
for quantifying the composition of Raman active components in fluid inclusions, in: Third
International Conference Geologica Belgica. Challenges for the Planet: Earth Sciences’
Perspective. Gent (Belgium), pp. 83–84.
Pohl, W., 1994. Metallogeny of the northeastern Kibara belt, Central Africa—Recent perspectives.
Ore Geol. Rev. 9, 105–130. https://doi.org/10.1016/0169-1368(94)90024-8
Polya, D.A., Foxford, K.A., Stuart, F., Boyce, A., Fallick, A.E., 2000. Evolution and paragenetic context
of low δD hydrothermal fluids from the Panasqueira W-Sn deposit, Portugal: New evidence
from microthermometric, stable isotope, noble gas and halogen analyses of primary fluid
inclusions. Geochim. Cosmochim. Acta 64, 3357–3371. https://doi.org/10.1016/S0016-
7037(00)00459-2
Prochaska, W., Mogessie, A., Raith, J.G., 1992. Formation of the talc deposit of Kibanda ( Rwanda )
and its relation to the regional metamorphic evolution Volcanic rocks Granites and gneisses
Granitized zone Location of the talc. J. African Earth Sci. 14, 499–509.

43
Rauchenstein-Martinek, K., Wagner, T., Wälle, M., Heinrich, C.A., Arlt, T., 2016. Chemical evolution of
metamorphic fluids in the Central Alps, Switzerland: insight from LA-ICPMS analysis of fluid
inclusions. Geofluids 16, 877–908. https://doi.org/10.1111/gfl.12194
Reinders, N., 2016. Metallogenic study of the Musha-Ntunga Nb-Ta-Sn pegmatite and Sn vein-type
deposits, Central Rwanda. Unpublished masterthesis, KU Leuven.
Roda-Robles, E., Pesquera, A., Gil-Crespo, P., Torres-Ruiz, J., 2012. From granite to highly evolved
pegmatite: A case study of the Pinilla de Fermoselle granite–pegmatite system (Zamora, Spain).
Lithos 153, 192–207. https://doi.org/10.1016/j.lithos.2012.04.027
Roda-Robles, E., Pesquera Perez, A., Velasco Roldan, F., Fontan, F., 1999. The granitic pegmatites of
the Fregeneda area (Salamanca, Spain): characteristics and petrogenesis. Mineral. Mag. 63,
535–558.
Romer, R.L., Lehmann, B., 1995. U-Pb columbite age of Neoproterozoic Ta-Nb mineralization in
Burundi. Econ. Geol. 90, 2303–2309. https://doi.org/10.2113/gsecongeo.90.8.2303
Saleh, G.M., El Galy, M.M., Obeid, M.A., 2008. Geochemical characteristics and spectrometric
prospecting in the muscovite-bearing pegmatites and granites, southeastern Aswan, Egypt.
Chinese J. Geochemistry 27, 9–20. https://doi.org/10.1007/s11631-008-0009-2
Sharp, Z.D., 1990. A laser-based microanalytical method for the in situ determination of oxygen
isotope ratios of silicates and oxides. Geochim. Cosmochim. Acta 54, 1353–1357.
https://doi.org/10.1016/0016-7037(90)90160-M
Sheppard, S.M.F., 1986. Characterization and isotopic variations in natural waters, in: Valley, J.W.,
Taylor, H.P.J., O’Neil, J.R. (Eds.), Stable Isotopes in High Temperature Geological Processes. pp.
49–60.
Smeds, S.A., 1992. Trace elements in potassium-feldspar and muscovite as a guide in the prospecting

44
for lithium- and tin-bearing pegmatites in Sweden. J. Geochemical Explor. 42, 351–369.
https://doi.org/10.1016/0375-6742(92)90032-4
Suhr, N., Ingamells, C., 1966. Solution technique for the analysis of silicates. Anal. Chem. 38, 730–
734.
Tack, L., Liégeois, J.P., Deblond, a., Duchesne, J.C., 1994. Kibaran A-type granitoids and mafic rocks
generated by two mantle sources in a late orogenic setting (Burundi). Precambrian Res. 68,
323–356. https://doi.org/10.1016/0301-9268(94)90036-1
Tack, L., Wingate, M.T.D., De Waele, B., Meert, J., Belousova, E., Griffin, B., Tahon, A., Fernandez-
Alonso, M., 2010. The 1375 Ma “Kibaran event” in Central Africa: Prominent emplacement of
bimodal magmatism under extensional regime. Precambrian Res. 180, 63–84.
https://doi.org/10.1016/j.precamres.2010.02.022
Taylor, R.G., 1979. Geology of tin deposits. Elsevier, Amsterdam, Oxford and New York.
Tindle, A.G., 2001. Structural Formula Calculators (Excel format) - Muscovite [WWW Document]. URL
http://www.open.ac.uk/earth-research/tindle/AGT/AGT_Home_2010/Microprobe-2.html
(accessed 5.18.16).
Tindle, A.G., Webb, P.C., 1990. Estimation of lithium contents in trioctahedral micas using
microprobe data: application to micas from granitic rocks. Eur. J. Mineral. 2, 595–610.
https://doi.org/10.1127/ejm/2/5/0595
Tischendorf, G., Gottesmann, B., Förster, H.-J., Trumbull, R.B., 1997. On Li-bearing Micas: Estimating
Li from Electron Microprobe Analyses and an Improved Diagram for Graphical Representation.
Mineral. Mag. 61, 809–834. https://doi.org/10.1180/minmag.1997.061.409.05
Van Daele, J., 2016. Regional variation of and controls on the granite-related Nb-Ta-Sn deposits in the
Rwamagana-Musha-Ntunga area, East Rwanda. Unpublished masterthesis KU Leuven.

45
Van Lichtervelde, M., Grégoire, M., Linnen, R.L., Béziat, D., Salvi, S., 2008. Trace element
geochemistry by laser ablation ICP-MS of micas associated with Ta mineralization in the Tanco
pegmatite, Manitoba, Canada. Contrib. to Mineral. Petrol. 155, 791–806.
https://doi.org/10.1007/s00410-007-0271-z
Varlamoff, N., 1972. Central and West African Rare-Metal Granitic Pegmatites, Related Aplites,
Quartz veins and Mineral Deposits. Miner. Depos. 7, 202–216.
Varlamoff, N., 1969. Transitions entre les filons de quartz et les pegmatites stannifères de la régian
de Musha-Ntunga (Rwanda). Ann. la société géologique Belgique 92, 193–213.
Verbovsek, T., 2011. A comparison of parameters below the limit of detection in geochemical
analyses by substitution methods. RMZ – Mater. Geoenvironment 58, 393–404.
Vertriest, W., 2014. Petrographical, mineralogical and geochemical study of the Nb-Ta and Sn
mineralisations of Musha-Ntunga (Rwanda). KU Leuven.
Viana, R.R., Jordt-Evangelista, H., Stern, W.B., 2007. Geochemistry of muscovite from pegmatites of
the Eastern Brazilian pegmatite province: a clue to petrogenesis and mineralization potential.
Eur. J. Mineral. 19, 745–755. https://doi.org/10.1127/0935-1221/2007/0019-1760
Vieira, R., Roda-Robles, E., Pesquera, A., Lima, A., 2011. Chemical variation and significance of micas
from the Fregeneda-Almendra pegmatitic field (Central-Iberian Zone, Spain and Portugal). Am.
Mineral. 96, 637–645. https://doi.org/10.2138/am.2011.3584
Wilkinson, J.J., 1990. The role of metamorphic fluids in the development of the Cornubian orefield:
fluid inclusion evidence from south Cornwall. Mineral. Mag. 54, 219–230.
https://doi.org/10.1180/minmag.1990.054.375.08
Williamson, B.J., Müller, A., Shail, R.K., 2010. Source and partitioning of B and Sn in the Cornubian
batholith of southwest England. Ore Geol. Rev. 38, 1–8.

46
https://doi.org/10.1016/j.oregeorev.2010.05.002
Wise, M.A., Brown, C.D., 2010. Mineral chemistry, petrology and geochemistry of the Sebago granite-
pegmatite system, Southern Maine, USA. J. Geosci. 55, 3–26.
https://doi.org/10.3190/jgeosci.061
Wood, S.A., Samson, I.M., 2000. The hydrothermal geochemistry of tungsten in granitoid
environments: I. Relative solubilities of ferberite and scheelite as a function of T, P, pH, and
m(NaCl). Econ. Geol. 95, 143–182. https://doi.org/10.2113/gsecongeo.95.1.143
Zajacz, Z., Halter, W.E., Pettke, T., Guillong, M., 2008. Determination of fluid/melt partition
coefficients by LA-ICPMS analysis of co-existing fluid and silicate melt inclusions: Controls on
element partitioning. Geochim. Cosmochim. Acta 72, 2169–2197.
https://doi.org/10.1016/j.gca.2008.01.034
Zhang, R.-Q., Sun, W. -d., Lehmann, B., 2016. Multiple tin mineralization events in Africa: Constraints
by in-situ LA-ICPMS cassiterite U-PB ages, in: 35th International Geological Congress Cape
Town, South Africa.
Appendix
Table A.1 Major element composition of Rwamagana-Musha-Ntunga muscovite samples. All values
are in wt%. H2O is calculated stoechiometrically according to Tindle and Webb (1990).

47
Figure captions
Fig. 1 Schematic diagram illustrating primary granite-related W-Sn deposit styles in combination with
their type-localities (1: North American Cordillera, 2: Bolivian province, 3: Iberian – Panasqueira
province, 4: French Massif Central, 5: Cornwall, 6: Erzgebirge/Krušné Hory, 7: Kibara Metallogenic
province, 8: southeast China province, 9: Myanmar-Thailand-Maleysia and 10: east Australian
province). Styles partly after Baker et al. (2005). W-Sn province locations after Taylor (1979) and Beus
(1986), Nb-Ta-Sn provinces after Melcher et al. (2016). Figure from Hulsbosch (2016).
Fig. 2 Distribution of lithological groups, granite intrusions and Nb-Ta-Sn-W mineralization in
Rwanda. 1 = Rwamagana city, 2 = Musha-Ntunga, 3 = Kigali city, 4 = Nyakabingo, 5 = Rutongo, 6 =
Gatumba, 7 = Kibuye city. The Rwamagana-Musha-Ntunga study area is indicated with the blue
rectangle. Modified after Fernandez-Alonso et al. (2007).
Fig. 3 Geological map of the Rwamagana-Musha-Ntunga area with indication of pegmatite and
quartz vein occurrence (after Hanon and Rusanganwa, 1991; Hulsbosch et al., 2017).
Fig. 4 Petrography of the pegmatites and quartz veins: a) pegmatite (mu = muscovite, qz = quartz,
kaol kaolinite, fsp = feldspar), b) pegmatite crosscutting quartz vein with muscovite rim, c) folded
metamorphic quartz vein perpendicular to the bedding, d) inset of c), quartz vein deflects host rock
axial planar cleavage, e) bedding-parallel, metamorphic quartz vein with biotite-garnet rim, indicated
in red.
Fig. 5 δ18O – δD plot of the calculated and analyzed isotopic composition of the fluids present in the
Sn-bearing quartz veins in the Rwamagana-Musha-Ntunga area. The global meteoric water line and
the ranges of metamorphic water, magmatic water and water that interacted with organic matter
are indicated for comparison (cf. Hoefs, 2015; Sheppard, 1986).

48
Fig. 6 Trace element concentrations of muscovite samples of the Rwamagana-Musha-Ntunga area. A
distinction between non-mineralized and mineralized pegmatites and quartz veins is given.
Fig. 7 (A) and (B) fluid inclusions in magmatic quartz, (C) coarsely crystallized melt inclusion in
magmatic quartz, (D) fluid inclusions in metamorphic quartz.
Fig. 8 Fluid inclusion LA-ICP-MS data of magmatic and metamorphic quartz, from the RMN and
Kibuye area, respectively. Samples with one of the parameters below the detection limit were given
an arbitrary value of 1 ppm for that element to display them in the log-log diagrams.
Fig. 9 LA-ICP-MS spectra of two fluid inclusions in magmatic and metamorphic quartz, from the RMN
and Kibuye area, respectively.
Fig. 10 Comparison of Rwamagana-Musha-Ntunga muscovite samples of this study with the
pegmatitic muscovite zonation model of Gitarama-Gatumba of Hulsbosch et al. (2014) and the
Nyakabingo quartz vein muscovite samples of Hulsbosch et al. (2016). F represents the fraction of the
melt that crystallized.
Fig. 11 Conceptual representation of (a) the expected muscovite signature, (b) the expected fluid
signature and (c) the geological situation in case of early (1), intermediate (2) and late (3) exsolution
and subsequent mixing.
Fig. 12 Analyzed quartz vein muscovite (•) versus calculated quartz vein muscovite (x) composition
for multiple mixing ratios (∆). 0 = pegmatitic fluid, 1 = metamorphic fluid.

49
.

50
Table 1 Pegmatite and quartz vein mineralogy in the Rwamagana-Musha-Ntunga area (Varlamoff,
1969).
Type* Mineralogical description
A Pegmatite dyke with microcline, graphic feldspar-quartz, quartz, biotite, muscovite and schorl.
B Pegmatite dyke with microcline, graphic feldspar-quartz, quartz, muscovite and tourmaline.
C Partly albitised pegmatite dyke with microcline, quartz, and muscovite.
D Albitised pegmatite dyke with microcline, muscovite, amblygonite, spodumene, columbite-tantalite,
traces of cassiterite and a quartz-muscovite core zone
E Intensely albitised pegmatite dyke with muscovite, lepidolite, spodumene, beryl, columbite-tantalite
and traces of microcline.
F Quartz vein with quartz, feldspar, muscovite and cassiterite
* Varlamoff (1969)
Table 2 Stable isotope data of Sn-bearing quartz vein samples from the Rwamagana-Musha-Ntunga
area. All values are in ‰ V-SMOW.
δ18O V-SMOW (quartz)
δ18O V-SMOW (fluid, at 350
°C)
δD V-SMOW (water)
MN13VW13 14.9 9.6 -29.5
MN13VW21 14.6 9.3 -59.7
MN13VW23 14.7 9.4 -43.4
MN13VW32 14.7 9.4 -45.2
MN13VW33 15.2 9.9 -45.5
MN13VW35 13.8 8.5 -27.6
MN13VW37 14.3 9.0 -39.8
MN13VW39 15.8 10.5 -39.2
MN13VW41 13.1 7.8 -28.6
all values are in ‰ V-SMOW

51
Table 3 Trace element concentrations of Rwamagana-Musha-Ntunga muscovite samples. All values
are in ppm.
03J 19J 23J 44J 47J 49J 52J 53J 62J 67J 08N
P P P P P P P P P P P
Ba 16 30 41 58 83 23 12 14 100 162 24
Cs 225 67 96 82 88 348 291 212 110 / 359
K 83461 79570 83125 85919 86947 84343 8418
2 8319
2 8488
3 8212
0 7913
3
Li 924 1168 1987 117 110 582 392 452 1837 / 170
Nb 176 170 177 91 85 187 252 216 106 / 122
Rb 3046 1693 2368 2482 2699 5027 4464 4040 1771 1967 5337
Sn 345 121 231 531 467 466 410 428 212 360 482
Sr 11 8 10 11 13 18 15 14 11 10 20
Ta 29 10 15 68 72 44 27 22 11 / 48
W 6 17 8 3 3 4 2 2 7 / 2
Zn 432 272 536 182 194 893 385 557 388 62 132
17N 35N 37N 39N 50N 51N 54N 57N 17J 58J 59J
P P P P P P P P Q Q Q
Ba 305 185 79 91 51 173 24 22 130 2249 746
Cs 248 334 384 302 335 350 417 1180 62 157 /
K 82758 73008 82393 76237 84562 80327 8125
0 7993
9 8153
1 7534
0 7897
1
Li 575 556 465 780 444 431 387 288 1143 455 /
Nb 56 94 91 66 52 80 49 76 113 71 /
Rb 1462 2624 4056 3958 3376 3888 3647 8743 813 482 620
Sn 431 419 461 388 456 429 555 811 87 411 659
Sr 45 13 17 15 13 17 13 33 6 86 52
Ta 19 45 63 60 49 54 70 104 16 2 /
W 2 3 2 2 2 2 2 1 7 10 /
Zn 127 163 300 249 237 222 187 126 151 38 38
69J 07N 21N 32N 45N 52aN 52bN 58N 62N 64N 66N
Q Q Q Q Q Q Q Q Q Q Q
Ba 51 1552 638 531 530 22 574 355 2431 / 228
Cs 100 146 356 116 / / 384 150 336 405 /
K 84171 71598 83669 82671 81574 81445 8037
6 8280
8 7770
4 8327
7 7141
0
Li 1673 116 857 1038 / / 1517 429 646 835 /
Nb 109 41 69 19 / / 64 40 82 76 /
Rb 1648 749 1732 531 1748 3777 1496 595 2362 2383 610
Sn 213 579 527 237 749 586 680 556 696 689 549
Sr 8 44 66 76 37 13 45 58 44 45 55
Ta 11 3 60 6 / 49 54 7 18 13 /

52
W 7 3 6 5 / 2 2 4 9 7 /
Zn 382 41 122 47 181 192 147 39 77 89 39
P = pegmatitic muscovite, Q = quartz vein muscovite, / = not analyzed
Table 4 Microthermometric data of the H2O-CO2-N2-NaCl fluid inclusions in magmatic quartz.
Name Vgas Tm CO2 Tfm Tm ice Tm clath Th CO2 Th tot Mass %
NaCl
1 65 -59.1 -22.6 -6.4 8.4 30.8 302 12.6
2 67 -57.7 -22.6 -7.3 8.4 30.3 301 12.5
3 65 -59.2 -21.9 -7.3 8.4 30.3 302 12.5
4 65 -58.8 -21.9 -7.2 7.9 30.1 301 12.7
5 66 -58.9 -22.6 -7.5 8.5 30.3 304 12.6
6 66 -58.7 -26.1 -7.6 8.3 30.1 305 12.9
7 65 -59.1 -24.6 -7.1 8.4 31.1 312 12.6
8 68 -59.1 -24.6 -8.0 8.0 30.3 301 14.4
9 68 -59.1 -24.6 -7.6 8.6 31.2 299 11.8
10 67 -59.1 -24.6 -8.0 8.2 30.8 304 13.5
11 66 -58.8 -21.1 -8.1 8.3 30.1 304 12.9
12 65 -59.2 -21.7 -7.7 8.4 30.8 304 12.6
13 67 -59.2 -22.8 -7.3 8.3 30.1 304 12.9
14 68 -59.2 -22.8 -7.2 8.4 30.8 301 12.6
15 68 -58.9 -23.8 -7.5 7.9 30.1 302 12.7
16 64 -59.1 -23.8 -7.1 8.5 30.3 301 12.6
17 63 -59.1 -23.8 -7.6 8.3 30.1 304 12.9
18 60 -58.8 -22.6 -7.1 8.3 30.1 303 12.9
19 64 -58.9 -26.1 -8.0 8.4 30.8 302 12.6
20 66 -59.1 -22.6 -8.7 8.4 30.3 301 12.6
21 67 -58.1 -22.6 -6.4 8.4 30.8 308 12.6
22 67 -59.1 -22.6 -7.3 7.9 30.1 301 12.7
23 64 -58.8 -21.9 -7.3 8.4 30.8 301 12.6
24 65 -59.1 -22.6 -7.3 8.3 30.1 301 12.9
25 64 -59.1 -23.4 -7.2 7.9 30.1 302 12.7
26 63 -59.1 -23.5 -7.5 8.3 30.1 302 12.9
27 63 -59.1 -22.1 -7.6 8.3 30.1 302 12.9
28 68 -58.8 -21.1 -7.1 8.4 30.8 304 12.6
29 67 -58.8 -24.6 -6.8 7.9 30.1 306 12.7
30 66 -59.1 -22.6 -8.5 8.4 30.8 306 12.6
31 65 -58.8 -23.6 -7.1 8.0 29.8 303 11.8
32 66 -59.0 -24.7 -7.7 8.3 30.1 304 12.2

53
33 59 -58.9 -25.0 -7.7 8.2 30.0 302 11.9
34 66 -58.8 -22.1 -7.3 8.6 30.6 304 13.1
35 69 -58.6 -22.0 -6.8 8.3 30.2 301 13.0
36 60 -59.3 -24.7 -6.9 8.4 29.9 303 12.9
37 60 -58.9 -23.9 -7.4 8.4 30.4 309 12.7
38 59 -58.5 -21.4 -7.4 8.3 30.5 302 13.0
39 61 -59.1 -25.5 -7.0 8.6 29.6 300 12.7
40 68 -59.2 -22.8 -7.3 8.1 30.6 304 12.0
41 63 -58.8 -22.8 -7.7 8.5 30.7 303 12.1
42 65 -58.9 -22.4 -7.6 8.2 30.6 300 13.0
43 62 -58.8 -20.8 -8.0 8.4 30.5 304 12.6
44 59 -59.0 -22.3 -7.4 8.3 30.0 302 13.0
45 58 -58.9 -22.0 -7.7 8.0 30.2 303 13.0
46 63 -58.5 -24.9 -8.0 8.3 30.9 303 13.3
47 69 -58.9 -22.1 -7.7 8.6 30.8 303 12.7
48 71 -58.9 -22.5 -7.8 8.6 30.2 301 12.2
49 65 -59.5 -24.6 -7.6 8.3 30.9 300 12.7
50 63 -58.3 -20.2 -8.4 8.6 30.5 302 11.9
51 65 -58.8 -23.0 -6.9 8.0 30.5 302 12.1
52 69 -59.1 -23.3 -8.5 8.1 30.9 302 12.7
Table 5 Microthermometric data of the H2O-CO2-(N2)-NaCl fluid inclusions in metamorphic quartz.
Name Vgas Tm CO2 Tfm Tm ice Tm clath Th CO2 Th tot Mass %
NaCl
1 57 -57.3 n.o. -3.7 8.2 27.3 n.d. 5.9
2 55 -57.1 n.o. -3.3 9.1 29.0 n.d. 4.3
3 56 -56.9 n.o. -3.3 9.1 29.4 n.d. 4.3
4 57 -56.9 n.o. -3.3 9.1 29.1 n.d. 4.3
5 55 -57.0 n.o. -4.0 9.1 29.2 n.d. 4.3
6 57 -57.0 n.o. -4.0 9.1 29.2 n.d. 4.3
7 57 -56.9 n.o. -3.7 9.1 29.1 n.d. 4.3
8 53 -57.0 n.o. -3.3 9.0 29.1 n.d. 4.5
9 55 -56.9 n.o. -4.1 9.3 28.9 n.d. 3.9
10 54 -57.1 n.o. -4.0 9.2 29.3 n.d. 4.1
11 51 -56.9 n.o. -3.3 9.2 28.9 n.d. 4.1
12 57 -57.1 n.o. -3.3 9.2 29.1 n.d. 4.1
13 55 -56.9 n.o. -3.4 9.2 29.5 n.d. 4.1
14 53 -57.0 n.o. -3.6 9.1 29.1 n.d. 4.3
15 58 -56.9 n.o. -3.3 9.1 28.9 n.d. 4.3
16 54 -57.0 n.o. -3.7 9.2 28.9 n.d. 4.1
17 52 -57.0 n.o. -3.8 8.9 29.1 n.d. 4.6

54
18 52 -56.9 n.o. -3.3 9.1 29.1 n.d. 4.3
19 55 -56.9 n.o. -3.3 9.1 28.9 n.d. 4.3
20 56 -57.0 n.o. -3.5 9.1 28.9 n.d. 4.3
21 52 -56.9 n.o. -3.4 9.1 29.0 n.d. 3.9
22 55 -56.5 n.o. -3.7 8.7 28.7 n.d. 3.8
23 54 -57.3 n.o. -3.3 9.1 30.0 n.d. 3.9
24 55 -56.9 n.o. -3.3 9.3 28.6 n.d. 4.3
25 55 -57.0 n.o. -3.4 8.7 29.1 n.d. 5.0
26 54 -57.1 n.o. -3.3 9.0 29.6 n.d. 4.7
27 54 -57.1 -32 -3.3 8.8 30.1 n.d. 3.8
28 55 -56.9 n.o. -3.9 9.2 29.7 n.d. 4.9
29 54 -57.1 n.o. -2.4 8.9 28.9 n.d. 4.3
30 56 -57.0 n.o. -3.4 8.8 28.7 n.d. 4.0
31 53 -57.3 n.o. -4.0 8.9 29.1 n.d. 4.3
32 58 -56.9 n.o. -3.9 9.3 29.5 n.d. 3.8
33 56 -57.0 -34 -3.1 9.5 28.5 n.d. 4.1
34 55 -57.3 n.o. -3.8 8.9 28.4 n.d. 4.3
35 56 -56.6 n.o. -3.3 9.1 29.5 n.d. 3.9
36 53 -57.1 n.o. -3.1 9.2 29.8 n.d. 4.7
37 55 -57.0 n.o. -3.6 8.9 30.7 n.d. 4.0
38 53 -57.2 n.o. -3.4 9.3 30.0 n.d. 5.0
39 55 -57.0 n.o. -3.5 9.3 29.1 n.d. 4.1
40 56 -57.2 n.o. -3.9 8.7 28.6 n.d. 3.8
41 54 -56.9 n.o. -3.8 8.8 29.1 n.d. 4.1
42 54 -57.3 -28 -4.0 9.1 27.1 n.d. 4.4
43 58 -57.1 n.o. -3.4 8.8 28.9 n.d. 4.9
44 60 -57.2 n.o. -3.4 8.9 27.9 n.d. 4.2
45 53 -57.3 n.o. -3.6 9.1 28.5 n.d. 3.3
46 55 -56.9 n.o. -3.8 8.7 27.9 n.d. 4.7
47 55 -57.1 n.o. -3.4 9.0 27.6 n.d. 4.0
48 55 -57.3 n.o. -3.6 9.1 29.0 n.d. 4.3
49 53 -57.0 n.o. -3.5 9.1 27.9 n.d. 3.9
50 54 -57.1 n.o. -3.4 9.1 28.2 n.d. 4.1
51 54 -56.9 n.o. -3.8 9.2 29.9 n.d. 3.5
52 55 -57.4 n.o. -3.6 8.9 28.6 n.d. 4.2
53 56 -57.0 n.o. -3.9 9.0 29.2 n.d. 5.2
54 55 -57.2 n.o. -3.3 8.9 28.8 n.d. 4.1
55 55 -57.1 n.o. -3.6 8.9 29.1 n.d. 4.7
56 56 -57.0 n.o. -4.0 9.5 28.8 n.d. 4.5
57 52 -57.5 n.o. -3.0 9.1 29.0 n.d. 4.7
58 54 -56.9 -28 -3.7 8.8 29.0 n.d. 3.6
59 57 -57.5 -30 -3.4 8.9 28.4 n.d. 4.1
60 55 -56.8 n.o. -3.3 9.0 28.2 n.d. 4.7
61 58 -57.0 n.o. -3.7 8.7 27.1 n.d. 4.4
62 53 -57.2 -30.0 -3.3 8.8 29.2 n.d. 4.4
63 57 -56.9 n.o. -3.7 8.9 29.4 n.d. 4.4
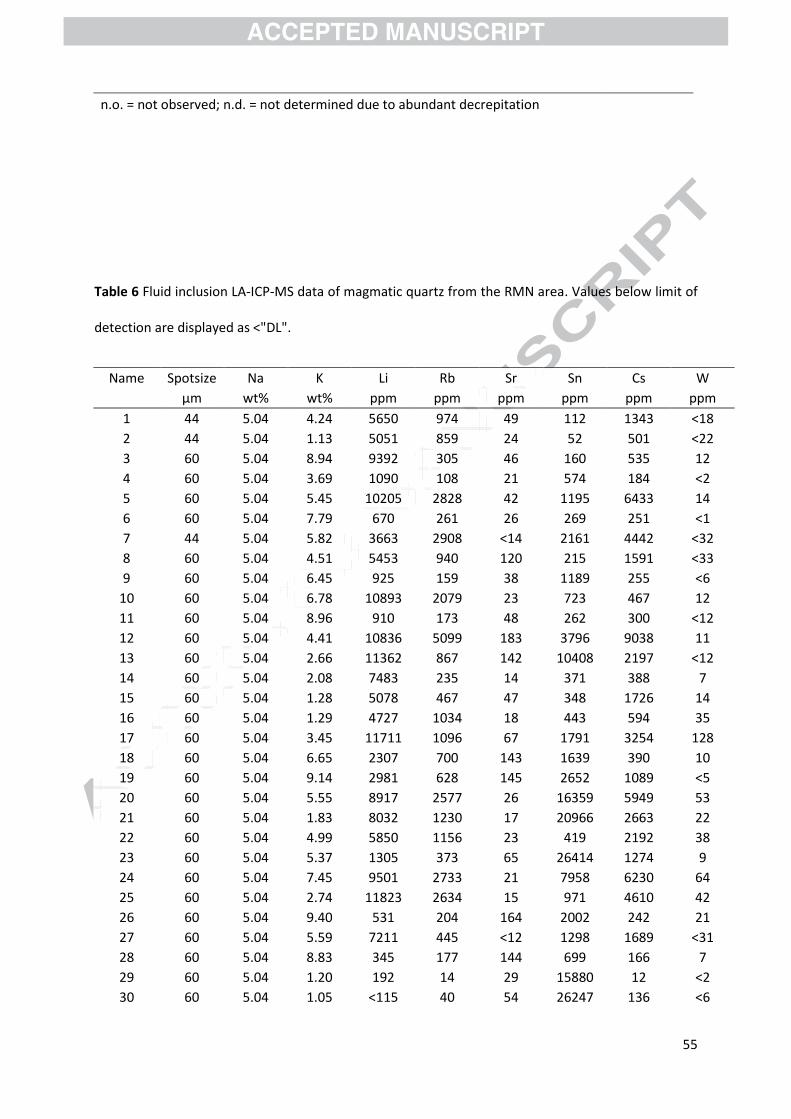
55
n.o. = not observed; n.d. = not determined due to abundant decrepitation
Table 6 Fluid inclusion LA-ICP-MS data of magmatic quartz from the RMN area. Values below limit of
detection are displayed as <"DL".
Name Spotsize Na K Li Rb Sr Sn Cs W
µm wt% wt% ppm ppm ppm ppm ppm ppm
1 44 5.04 4.24 5650 974 49 112 1343 <18
2 44 5.04 1.13 5051 859 24 52 501 <22
3 60 5.04 8.94 9392 305 46 160 535 12
4 60 5.04 3.69 1090 108 21 574 184 <2
5 60 5.04 5.45 10205 2828 42 1195 6433 14
6 60 5.04 7.79 670 261 26 269 251 <1
7 44 5.04 5.82 3663 2908 <14 2161 4442 <32
8 60 5.04 4.51 5453 940 120 215 1591 <33
9 60 5.04 6.45 925 159 38 1189 255 <6
10 60 5.04 6.78 10893 2079 23 723 467 12
11 60 5.04 8.96 910 173 48 262 300 <12
12 60 5.04 4.41 10836 5099 183 3796 9038 11
13 60 5.04 2.66 11362 867 142 10408 2197 <12
14 60 5.04 2.08 7483 235 14 371 388 7
15 60 5.04 1.28 5078 467 47 348 1726 14
16 60 5.04 1.29 4727 1034 18 443 594 35
17 60 5.04 3.45 11711 1096 67 1791 3254 128
18 60 5.04 6.65 2307 700 143 1639 390 10
19 60 5.04 9.14 2981 628 145 2652 1089 <5
20 60 5.04 5.55 8917 2577 26 16359 5949 53
21 60 5.04 1.83 8032 1230 17 20966 2663 22
22 60 5.04 4.99 5850 1156 23 419 2192 38
23 60 5.04 5.37 1305 373 65 26414 1274 9
24 60 5.04 7.45 9501 2733 21 7958 6230 64
25 60 5.04 2.74 11823 2634 15 971 4610 42
26 60 5.04 9.40 531 204 164 2002 242 21
27 60 5.04 5.59 7211 445 <12 1298 1689 <31
28 60 5.04 8.83 345 177 144 699 166 7
29 60 5.04 1.20 192 14 29 15880 12 <2
30 60 5.04 1.05 <115 40 54 26247 136 <6

56
31 60 5.04 2.08 1116 150 22 144 285 2
32 60 5.04 6.42 795 321 521 761 753 <5
33 60 5.04 2.86 6974 902 49 783 3233 2
34 60 5.04 5.53 5348 372 81 190 757 15
35 60 5.04 2.20 12341 1288 6 337 10545 14
36 60 5.04 2.87 11741 927 57 777 3104 7
37 60 5.04 5.75 42 9 16 1177 11 <3
38 60 5.04 3.76 11792 5047 5 239 9465 23
39 60 5.04 1.10 12461 1683 8 118 9864 15
40 60 5.04 2.64 11733 4277 18 254 10370 19
41 60 5.04 2.75 11356 1761 8 68 8081 10
42 60 5.04 2.74 11834 2210 6 256 8741 8
43 60 5.04 2.93 12248 4715 17 235 13871 <2
Table 7 Fluid inclusion LA-ICP-MS data of metamorphic quartz from the Kibuye area. Values below
limit of detection are displayed as <"DL".
Name Spotsize Na K Li Rb Sr Sn Cs W
µm wt% wt% ppm ppm ppm ppm ppm ppm
1 44 1.69 1.20 <270 <22 26 47 <12 24
2 60 1.69 0.17 53 5 384 81 <2 2
3 60 1.69 0.34 <293 <29 115 41 12 <14
4 60 1.69 2.41 <2005 <168 2977 292 <87 <89
5 60 1.69 0.71 <851 <76 80 254 59 64
6 60 1.69 0.20 <13 12 485 8 11 1
7 60 1.69 0.13 <289 <26 295 600 <11 <13
8 60 1.69 0.25 <99 10 44 9 <4 5
9 60 1.69 0.81 <227 22 124 81 <10 10
10 60 1.69 0.54 <33 9 482 71 1 <1
11 60 1.69 0.12 <114 <9 148 15 <4 5
12 60 1.69 0.17 94 <7 10 47 5 3
13 60 1.69 0.45 <328 <26 71 131 <13 15
14 60 1.69 0.39 <305 <24 29 129 <14 <14
15 60 1.69 1.72 <276 <27 62 669 8 <15
16 60 1.69 0.43 <60 5 7 6215 <2 <3
17 60 1.69 1.97 <286 <27 208 629 11 <16
18 60 1.69 0.05 <101 <8 5 134 <4 <4
19 60 1.69 1.06 <113 9 28 249 <5 <6
20 60 1.69 0.60 <195 19 302 186 <10 <12

57
21 60 1.69 0.03 <44 <3 2 <2 <2 2
22 60 1.69 0.91 18 8 26 19 1 3
23 60 1.69 2.89 <78 56 114 140 30 5
24 60 1.69 1.35 <176 83 300 292 <8 8
25 60 1.69 0.39 162 10 40 33 <3 12
26 60 1.69 0.20 177 <9 18 38 <4 <4
27 60 1.69 0.23 <87 <8 18 306 7 <4
28 60 1.69 0.15 112 <7 8 24 <3 23
29 60 1.69 1.81 <94 26 202 189 4 <5
30 60 1.69 0.16 167 <14 462 99 24 <8
31 60 1.69 0.14 91 <6 5 126 8 <3
32 60 1.69 0.77 63 95 20 42 1 2
33 60 1.69 2.18 51 13 12 488 2 3
34 60 1.69 3.69 64 34 21 30 1 1
35 60 1.69 0.34 <191 <18 14 13 <8 <9
36 60 1.69 2.35 72 15 35 29 <4 <5
37 60 1.69 1.36 155 28 25 67 6 4
38 60 1.69 5.36 <24 14 7 2 <1 <1
39 60 1.69 0.38 164 28 30 51 <4 <4
40 60 1.69 0.96 <103 26 26 24 6 <5
41 60 1.69 0.45 280 <20 20 95 15 <12
Table 8 Geochemistry of the magmatic and metamorphic fluid endmembers. Values are in ppm.
Rb Cs Sn
Magmatic fluid (RMN area, n = 43, median) 885 1640 769
Metamorphic fluid (Kibuye area, n = 41, median) 14 6 81
Table 9 Calculations of the fluid-crystal coefficients for Rb, Sn and Cs in muscovite (using the datasets
of Adam and Green, 2006; Hu et al., 2008; Icenhower and London, 1995; Zajacz et al., 2008)
Kd,muscovite Kfm Kcf,muscovite
range reference*
used value
range condition referen
ce * used value
Rb
0.96 - 1.75
[1] 1.51
0.16 - 1.08 [3] 0.54
(mean) 2.8
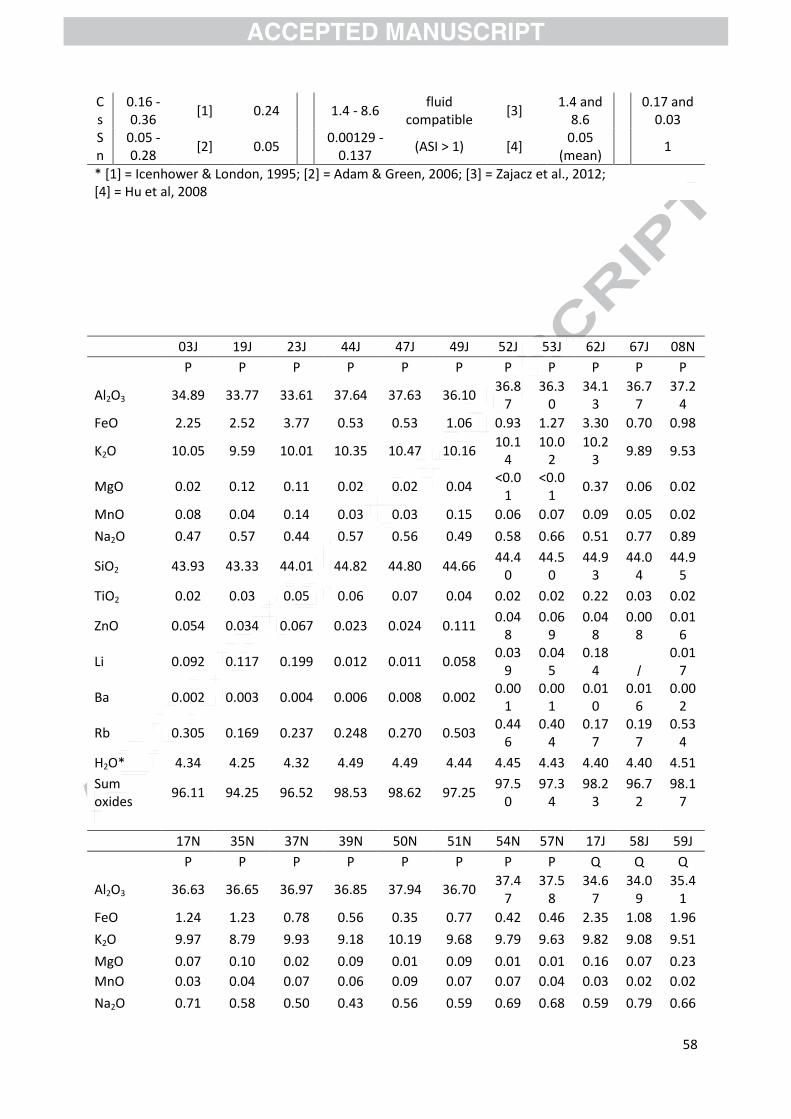
58
Cs
0.16 - 0.36
[1] 0.24
1.4 - 8.6 fluid
compatible [3]
1.4 and 8.6
0.17 and 0.03
Sn
0.05 - 0.28
[2] 0.05
0.00129 - 0.137
(ASI > 1) [4] 0.05
(mean) 1
* [1] = Icenhower & London, 1995; [2] = Adam & Green, 2006; [3] = Zajacz et al., 2012; [4] = Hu et al, 2008
03J 19J 23J 44J 47J 49J 52J 53J 62J 67J 08N
P P P P P P P P P P P
Al2O3 34.89 33.77 33.61 37.64 37.63 36.10 36.8
7 36.3
0 34.1
3 36.7
7 37.2
4
FeO 2.25 2.52 3.77 0.53 0.53 1.06 0.93 1.27 3.30 0.70 0.98
K2O 10.05 9.59 10.01 10.35 10.47 10.16 10.1
4 10.0
2 10.2
3 9.89 9.53
MgO 0.02 0.12 0.11 0.02 0.02 0.04 <0.0
1 <0.0
1 0.37 0.06 0.02
MnO 0.08 0.04 0.14 0.03 0.03 0.15 0.06 0.07 0.09 0.05 0.02
Na2O 0.47 0.57 0.44 0.57 0.56 0.49 0.58 0.66 0.51 0.77 0.89
SiO2 43.93 43.33 44.01 44.82 44.80 44.66 44.4
0 44.5
0 44.9
3 44.0
4 44.9
5
TiO2 0.02 0.03 0.05 0.06 0.07 0.04 0.02 0.02 0.22 0.03 0.02
ZnO 0.054 0.034 0.067 0.023 0.024 0.111 0.04
8 0.06
9 0.04
8 0.00
8 0.01
6
Li 0.092 0.117 0.199 0.012 0.011 0.058 0.03
9 0.04
5 0.18
4 /
0.017
Ba 0.002 0.003 0.004 0.006 0.008 0.002 0.00
1 0.00
1 0.01
0 0.01
6 0.00
2
Rb 0.305 0.169 0.237 0.248 0.270 0.503 0.44
6 0.40
4 0.17
7 0.19
7 0.53
4
H2O* 4.34 4.25 4.32 4.49 4.49 4.44 4.45 4.43 4.40 4.40 4.51
Sum oxides
96.11 94.25 96.52 98.53 98.62 97.25 97.5
0 97.3
4 98.2
3 96.7
2 98.1
7
17N 35N 37N 39N 50N 51N 54N 57N 17J 58J 59J
P P P P P P P P Q Q Q
Al2O3 36.63 36.65 36.97 36.85 37.94 36.70 37.4
7 37.5
8 34.6
7 34.0
9 35.4
1
FeO 1.24 1.23 0.78 0.56 0.35 0.77 0.42 0.46 2.35 1.08 1.96
K2O 9.97 8.79 9.93 9.18 10.19 9.68 9.79 9.63 9.82 9.08 9.51
MgO 0.07 0.10 0.02 0.09 0.01 0.09 0.01 0.01 0.16 0.07 0.23
MnO 0.03 0.04 0.07 0.06 0.09 0.07 0.07 0.04 0.03 0.02 0.02
Na2O 0.71 0.58 0.50 0.43 0.56 0.59 0.69 0.68 0.59 0.79 0.66

59
SiO2 44.79 45.22 44.97 44.80 45.02 44.73 44.4
2 44.2
8 44.5
7 45.1
6 45.5
9
TiO2 0.10 0.11 0.11 0.06 0.08 0.11 0.05 0.01 0.02 0.34 0.51
ZnO 0.016 0.020 0.037 0.031 0.029 0.028 0.02
3 0.01
6 0.01
9 0.00
5 0.00
5
Li 0.057 0.056 0.046 0.078 0.044 0.043 0.03
9 0.02
9 0.11
4 0.04
6 /
Ba 0.030 0.018 0.008 0.009 0.005 0.017 0.00
2 0.00
2 0.01
3 0.22
5 0.07
5
Rb 0.146 0.262 0.406 0.396 0.338 0.389 0.36
5 0.87
4 0.08
1 0.04
8 0.06
2
H2O* 4.44 4.46 4.48 4.44 4.51 4.45 4.46 4.51 4.35 4.36 4.46
Sum oxides
98.00 97.20 97.86 96.50 98.78 97.22 97.4
0 97.2
2 96.5
8 95.0
0 98.3
5
69J 07N 21N 32N 45N 52aN 52bN
58N 62N 64N 66N
Q Q Q Q Q Q Q Q Q Q Q
Al2O3 34.46 37.06 35.37 34.76 34.30 37.52 34.0
0 35.1
7 34.4
4 35.1
8 36.5
8
FeO 3.12 0.87 2.10 1.71 2.74 0.43 2.54 1.87 1.92 2.22 1.31
K2O 10.14 8.62 10.08 9.96 9.83 9.81 9.68 9.98 9.36 10.0
3 8.60
MgO 0.22 0.06 0.28 0.48 0.49 0.01 0.41 0.32 0.40 0.42 0.07
MnO 0.08 0.01 0.05 0.02 0.02 0.07 0.04 0.03 0.02 0.02 0.01
Na2O 0.54 1.23 0.69 0.64 0.60 0.69 0.64 0.64 0.75 0.65 1.13
SiO2 45.14 45.45 45.61 46.38 45.48 44.51 44.5
8 44.9
6 45.9
8 45.5
4 45.9
8
TiO2 0.12 0.43 0.25 0.32 0.34 0.06 0.40 0.13 0.53 0.59 0.18
ZnO 0.048 0.005 0.015 0.006 0.023 0.024 0.01
8 0.00
5 0.01
0 0.01
1 0.00
5
Li 0.167 0.012
0.086 0.104 / / 0.15
2 0.04
3 0.06
5 0.08
4 /
Ba 0.005 0.155 0.064 0.053 0.053 0.002 0.05
7 0.03
5 0.24
3 /
0.023
Rb 0.165 0.075 0.173 0.053 0.175 0.378 0.15
0 0.05
9 0.23
6 0.23
8 0.06
1
H2O* 4.41 4.49 4.47 4.47 4.43 4.47 4.36 4.40 4.45 4.48 4.49
Sum oxides
98.28 98.23 98.91 98.75 98.25 97.59 96.6
6 97.5
1 97.8
6 99.1
4 98.3
6
P = pegmatitic muscovite, Q = quartz vein muscovite, / = not analyzed
*H2O calculated stoechiometrically according to Tindle & Webb (1990)

60
Highlights
Peribatholitic Sn-quartz veins often show secondary overprinting signatures.
Fluid mixing was quantified by muscovite and fluid inclusion geochemistry
Fluid mixing plays an important role in the genesis of Sn-quartz veins.

61
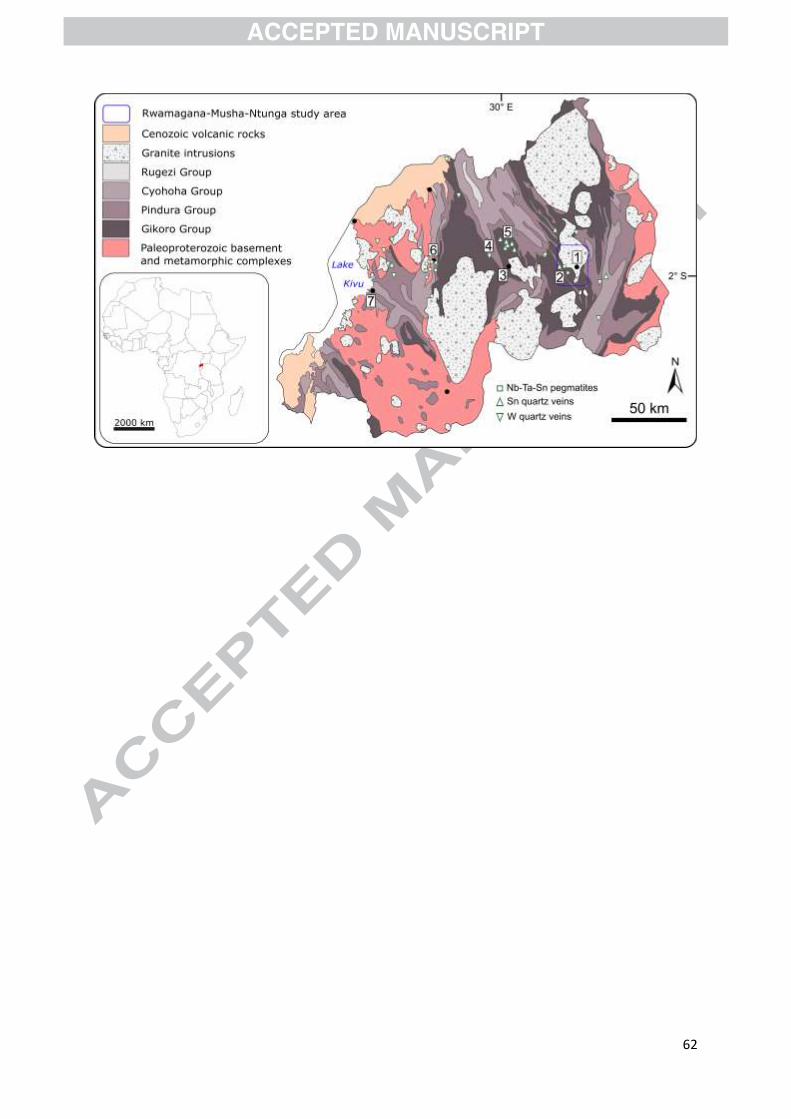
62
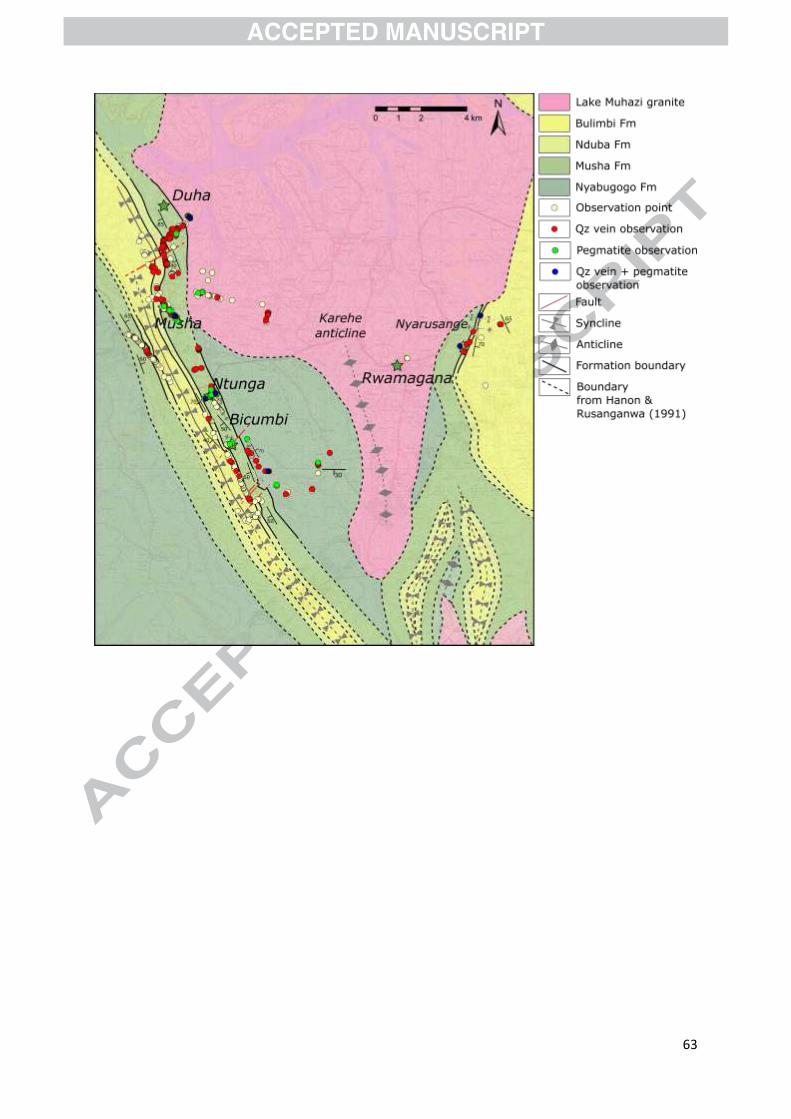
63

64
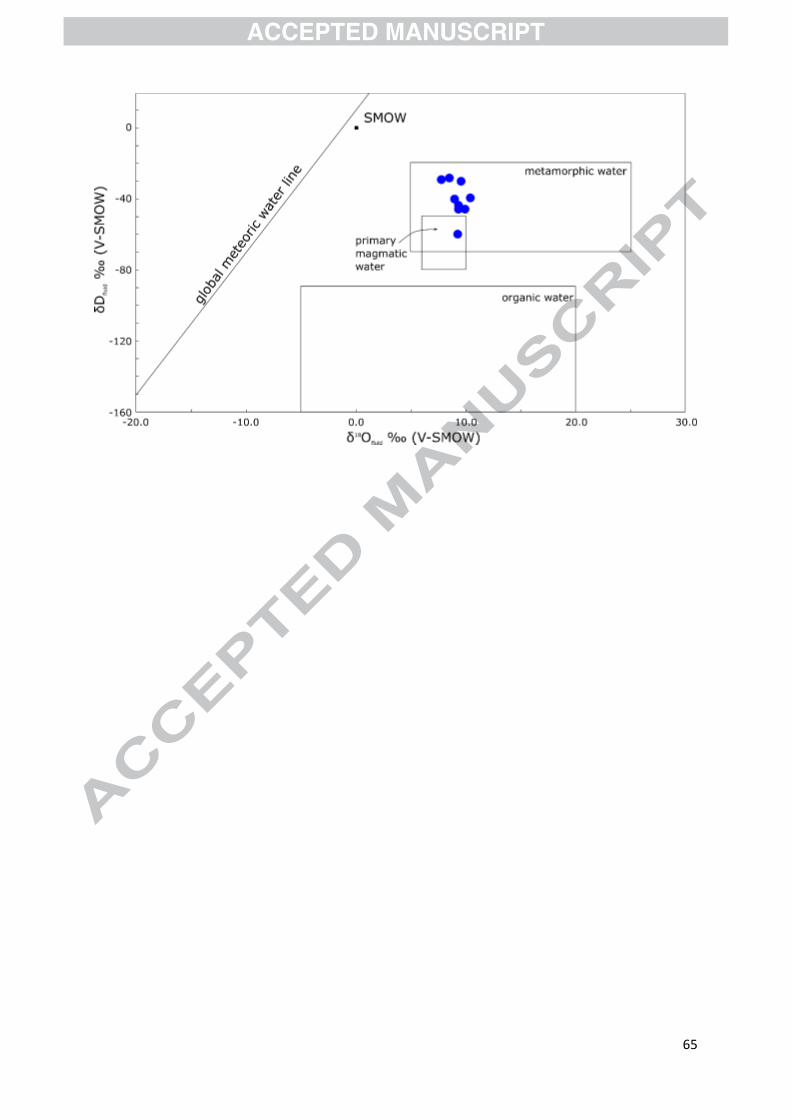
65

66

67

68

69

70

71

72

73
Graphical abstract


![Geochemical Aspects of Na-Metasomatism in Sargaz Granitic ... · rocks is similar to some hydrothermal parageneses related to post magmatic events ([25,22,2]) and records all evidences](https://img.pdfslide.us/doc/110x75/5e9c3e43d749a5049c4b166e/geochemical-aspects-of-na-metasomatism-in-sargaz-granitic-rocks-is-similar-to.jpg)