Embed Size (px)
Citation preview

8/8/2019 Pwc Entertainment and Media Outlook 2009 2013marcel
http://slidepdf.com/reader/full/pwc-entertainment-and-media-outlook-2009-2013marcel 1/18
The Entertainment & Media Outlook: 2009 - 2013
Dublin Launch – 7 July 2009
Marcel FenezGlobal Leader, Entertainment and Media PracticePricewaterhouseCoopers
8/8/2019 Pwc Entertainment and Media Outlook 2009 2013marcel
http://slidepdf.com/reader/full/pwc-entertainment-and-media-outlook-2009-2013marcel 2/18
Slide 4
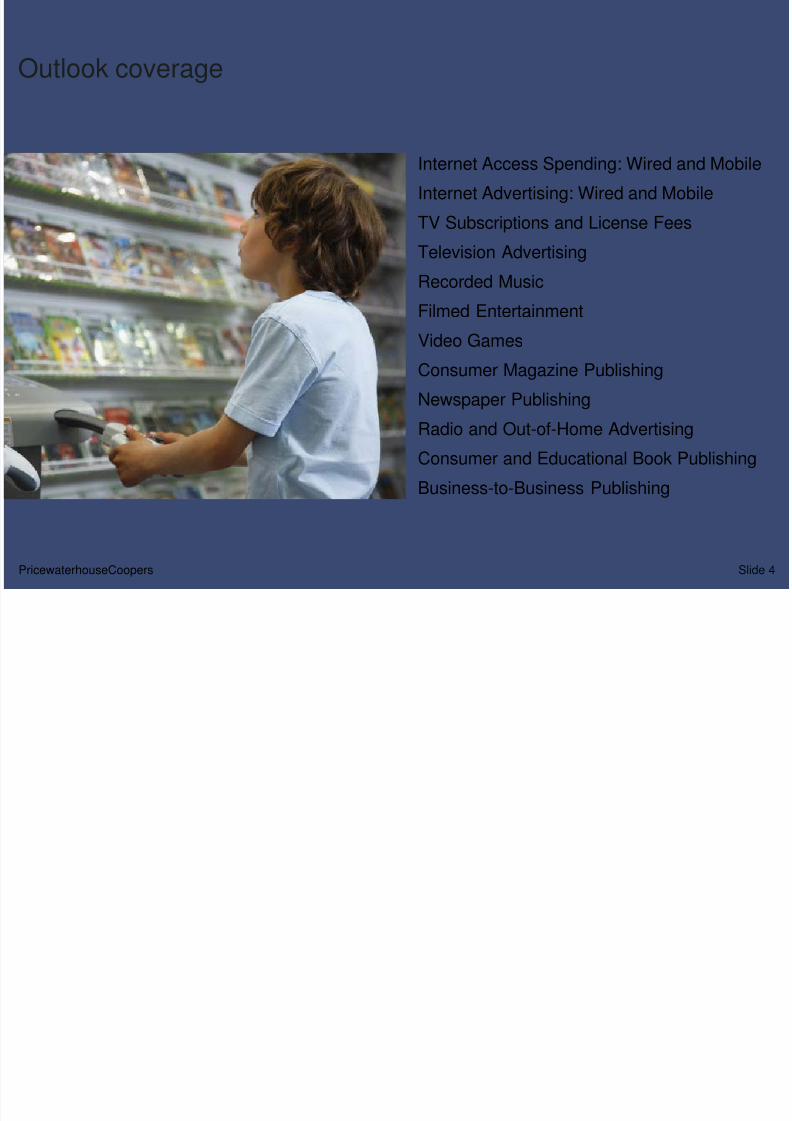
Outlook coverage
Internet Access Spending: Wired and Mobile
Internet Advertising: Wired and Mobile
TV Subscriptions and License Fees
Television Advertising
Recorded Music
Filmed Entertainment
Video Games
Consumer Magazine Publishing
Newspaper Publishing
Radio and Out-of-Home Advertising
Consumer and Educational Book Publishing
Business-to-Business Publishing
Slide 4PricewaterhouseCoopers

8/8/2019 Pwc Entertainment and Media Outlook 2009 2013marcel
http://slidepdf.com/reader/full/pwc-entertainment-and-media-outlook-2009-2013marcel 3/18
No place to hide from the digital transformation
Slide 5PricewaterhouseCoopers

8/8/2019 Pwc Entertainment and Media Outlook 2009 2013marcel
http://slidepdf.com/reader/full/pwc-entertainment-and-media-outlook-2009-2013marcel 4/18
2009-10 CAGR
Global E&M Outlook 2009-10: -1.8% CAGR, $1.4 trillion
Slide 6PricewaterhouseCoopers
North America
Latin America
Europe, Middle East,Africa (EMEA)
Asia Pacific
-4.2%
0.4%
-1.9%
1.2%

8/8/2019 Pwc Entertainment and Media Outlook 2009 2013marcel
http://slidepdf.com/reader/full/pwc-entertainment-and-media-outlook-2009-2013marcel 5/18
8/8/2019 Pwc Entertainment and Media Outlook 2009 2013marcel
http://slidepdf.com/reader/full/pwc-entertainment-and-media-outlook-2009-2013marcel 6/18
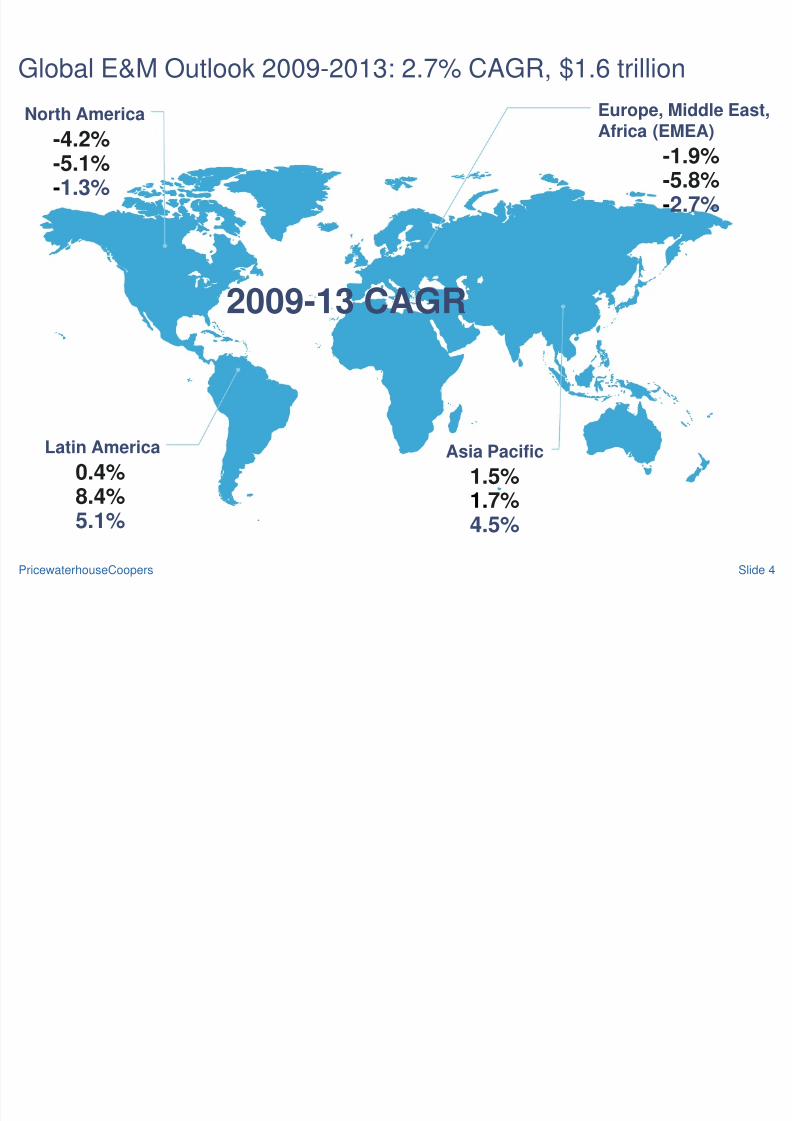
2009-13 CAGR
Global E&M Outlook 2009-2013: 2.7% CAGR, $1.6 trillion
Slide 4PricewaterhouseCoopers
North America
Latin America
Europe, Middle East,Africa (EMEA)
Asia Pacific
-4.2%
0.4%
-1.9%
1.5%
-5.1%
8.4%
-5.8%
1.7%
-1.3%
5.1%
-2.7%
4.5%
8/8/2019 Pwc Entertainment and Media Outlook 2009 2013marcel
http://slidepdf.com/reader/full/pwc-entertainment-and-media-outlook-2009-2013marcel 7/18
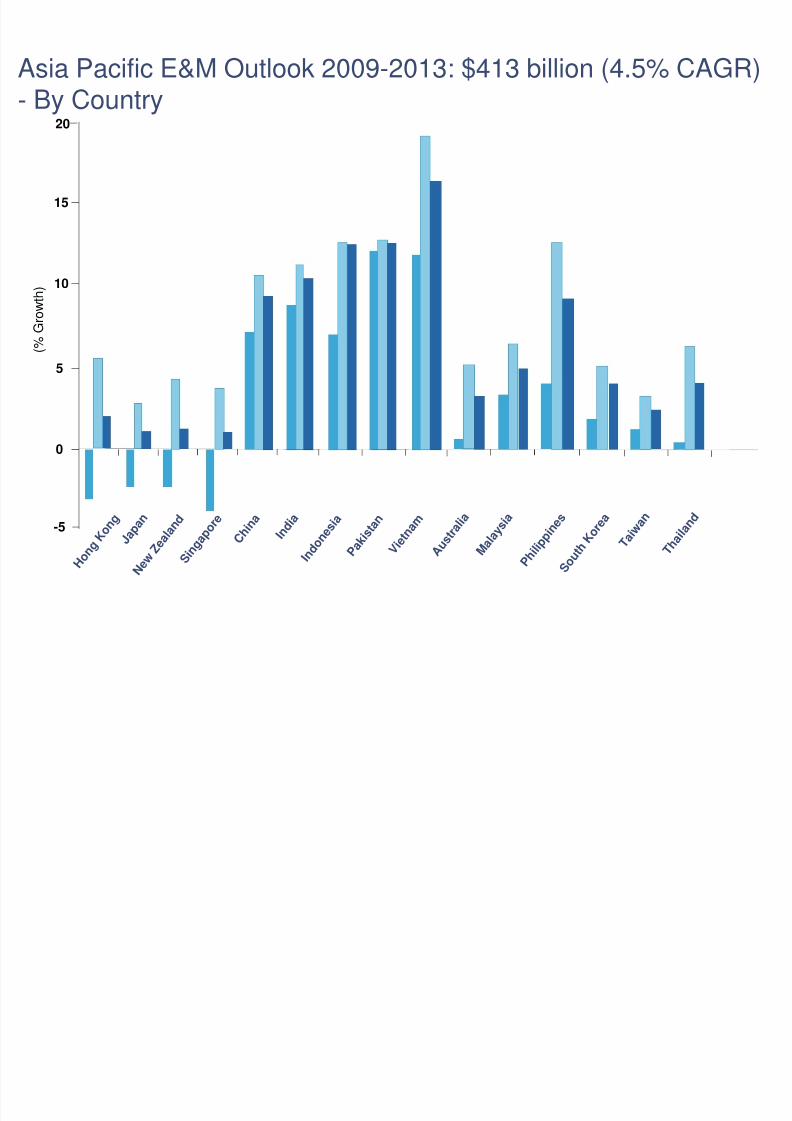
Asia Pacific E&M Outlook 2009-2013: $413 billion (4.5% CAGR)
- By Country
( % G
r o w
t h )
C h i n a
I n d i a
I n d o n e
s i a
P a k i
s t a n
V i e t n a m
A u s t r a l i a
M a l a y s i a
P h i l i p
p i n e s
S o u t h K o
r e a
T a i w a n
T h a i l a n d
0
5
10
15
20
-5
H o n g
K o n g
J a p a n
N e w
Z e a l a n d
S i n g
a p o r e

8/8/2019 Pwc Entertainment and Media Outlook 2009 2013marcel
http://slidepdf.com/reader/full/pwc-entertainment-and-media-outlook-2009-2013marcel 8/18
-10.0 -5.0
Slide 5
A fragmented road to recovery
2009-10 CAGR
2011-13 CAGR
% % % % %
2.4
2.0
3.1
1.5
2.8
8.0
5.4
-0.2
4.0
8.3
12.9
11.8
-8.8
-1.6
-4.4
-7.1
-6.2
6.6
1.9
-5.9
-5.8
3.4
0.3
5.4
0.0 5.0 10.0 15.0
B2B Publishing
Cons. & Edu. Book Pub.
Radio/Out-of-Home
Newspaper Pub.
Consumer Mag. Pub.
Video Games
Filmed Entertainment
Recorded Music
TV Advertising
TV Sub. and Lic. Fees
Internet Ad: Wired & Mobile
Internet Access

8/8/2019 Pwc Entertainment and Media Outlook 2009 2013marcel
http://slidepdf.com/reader/full/pwc-entertainment-and-media-outlook-2009-2013marcel 9/18Slide 11
Slow economy increases the speed of digital migration
Slide 8PricewaterhouseCoopers
8/8/2019 Pwc Entertainment and Media Outlook 2009 2013marcel
http://slidepdf.com/reader/full/pwc-entertainment-and-media-outlook-2009-2013marcel 10/18
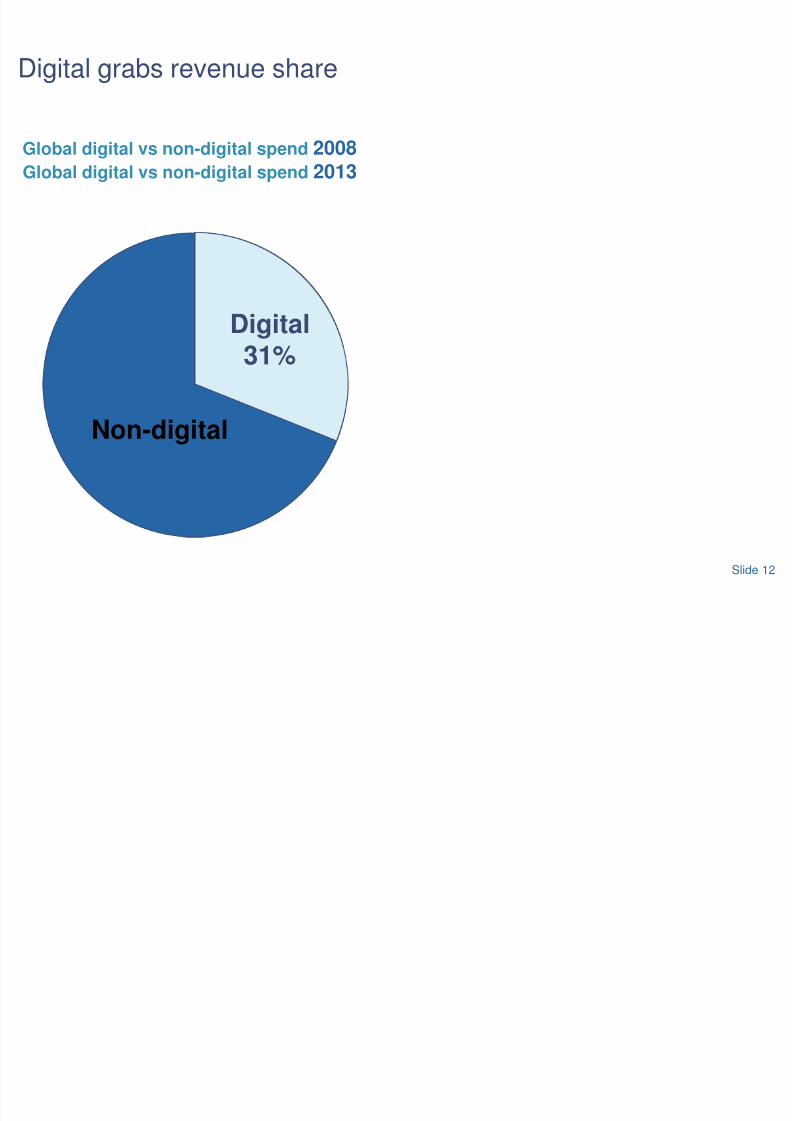
Digital grabs revenue share
Global digital vs non-digital spend 2008
Slide 12
Non-digital
Digital21%Digital31%
Global digital vs non-digital spend 2013
8/8/2019 Pwc Entertainment and Media Outlook 2009 2013marcel
http://slidepdf.com/reader/full/pwc-entertainment-and-media-outlook-2009-2013marcel 11/18Slide 12
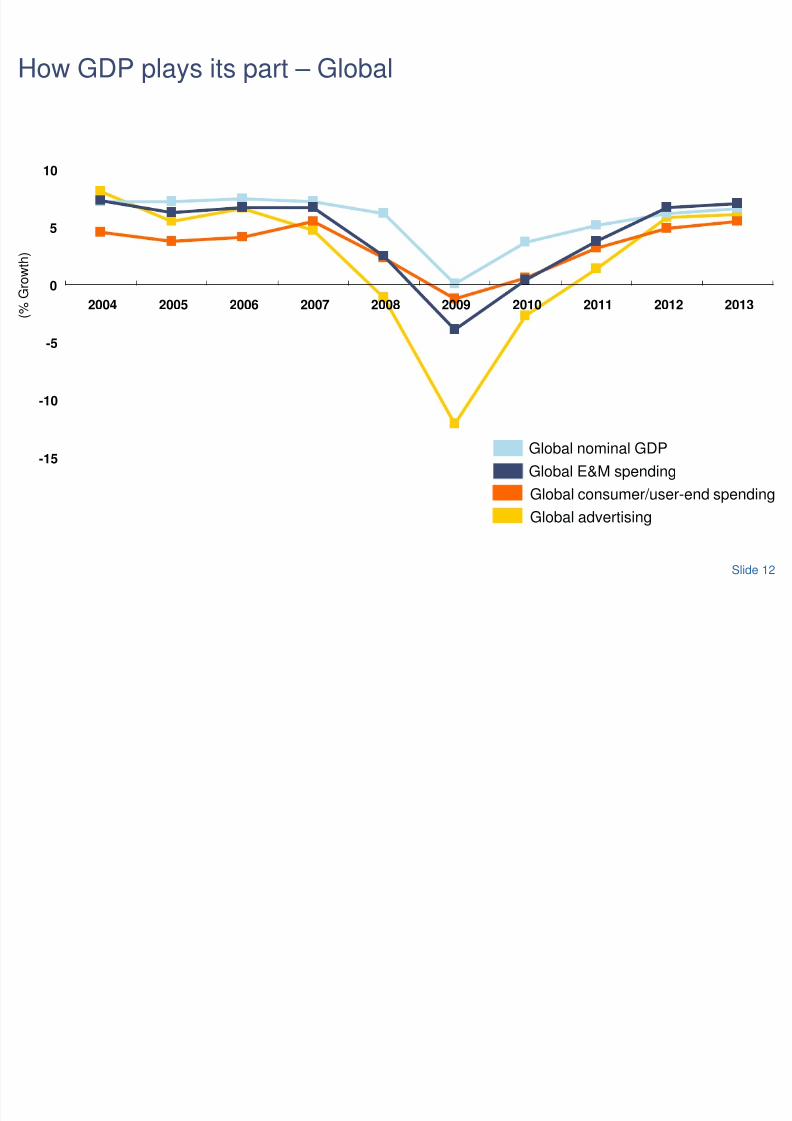
Global nominal GDP
Global E&M spending
How GDP plays its part – Global
Global consumer/user-end spending
Global advertising
( %
G r o w t h )
2009
-15
-10
-5
0
5
10
2004 2005 2006 2007 2008 2010 2011 2012 2013

8/8/2019 Pwc Entertainment and Media Outlook 2009 2013marcel
http://slidepdf.com/reader/full/pwc-entertainment-and-media-outlook-2009-2013marcel 12/18
Consumer behaviour
8/8/2019 Pwc Entertainment and Media Outlook 2009 2013marcel
http://slidepdf.com/reader/full/pwc-entertainment-and-media-outlook-2009-2013marcel 13/18
Slide 15
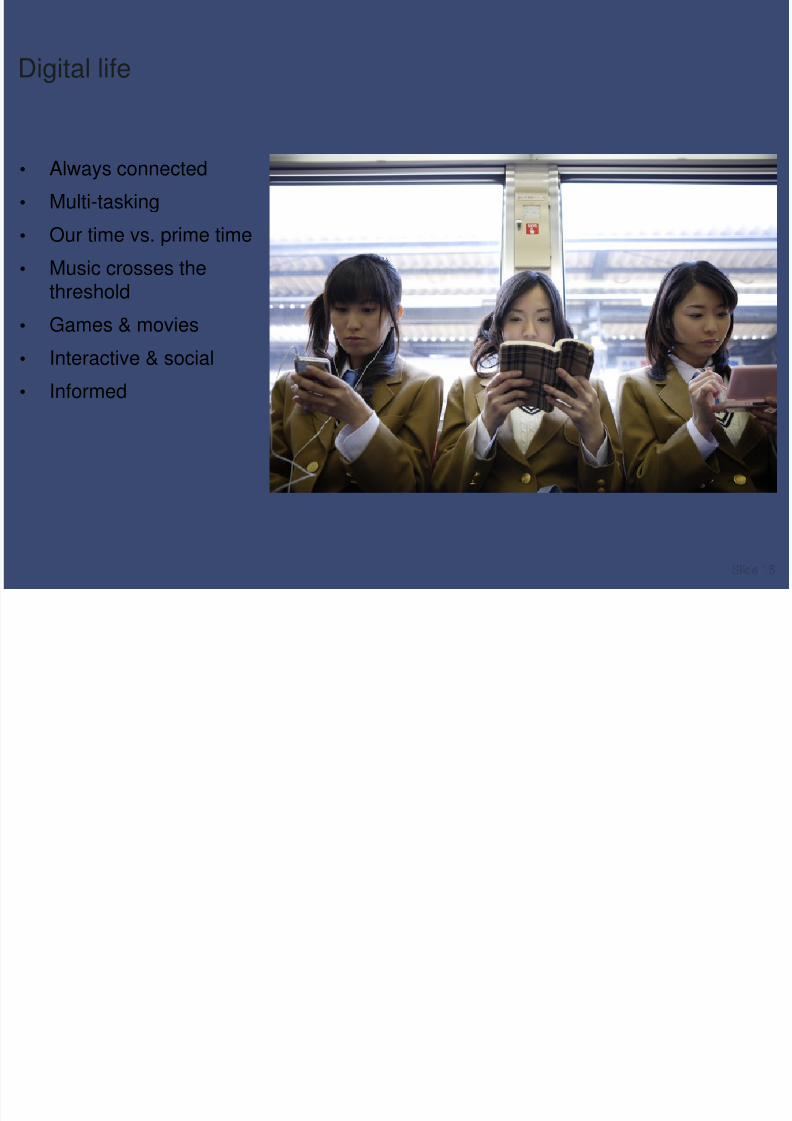
Digital life
Slide 15PricewaterhouseCoopers
• Always connected
• Multi-tasking• Our time vs. prime time
• Music crosses thethreshold
• Games & movies
• Interactive & social
• Informed

8/8/2019 Pwc Entertainment and Media Outlook 2009 2013marcel
http://slidepdf.com/reader/full/pwc-entertainment-and-media-outlook-2009-2013marcel 14/18
Slide 19
Digital/mobile to account for 78% of all E&M growth – Global
Total spending ondigital/mobile platforms
Other consumer/end-
user/access spending
0 100,000 200,000 300,000 400,000 500,000 600,000 700,000 800,000
2004
2005
2006
2007
2008p
2009
2010
2011
2012
2013
(US$ Millions)

8/8/2019 Pwc Entertainment and Media Outlook 2009 2013marcel
http://slidepdf.com/reader/full/pwc-entertainment-and-media-outlook-2009-2013marcel 15/18
Advertising

8/8/2019 Pwc Entertainment and Media Outlook 2009 2013marcel
http://slidepdf.com/reader/full/pwc-entertainment-and-media-outlook-2009-2013marcel 16/18
Slide 23
2013 global ad spend still trails 2007 levels
Global advertising market
( U
S $ M i l l i o n s )
400,000
425,000
450,000
475,000
500,000
2004 2005 2006 2007 2008 2009 2010 2011 2012 2013
8.1%
6.6%
5.5%
4.7%
1.4%
5.9%
6.1%
-1.1%
-12.1%
-2.7%
8/8/2019 Pwc Entertainment and Media Outlook 2009 2013marcel
http://slidepdf.com/reader/full/pwc-entertainment-and-media-outlook-2009-2013marcel 17/18
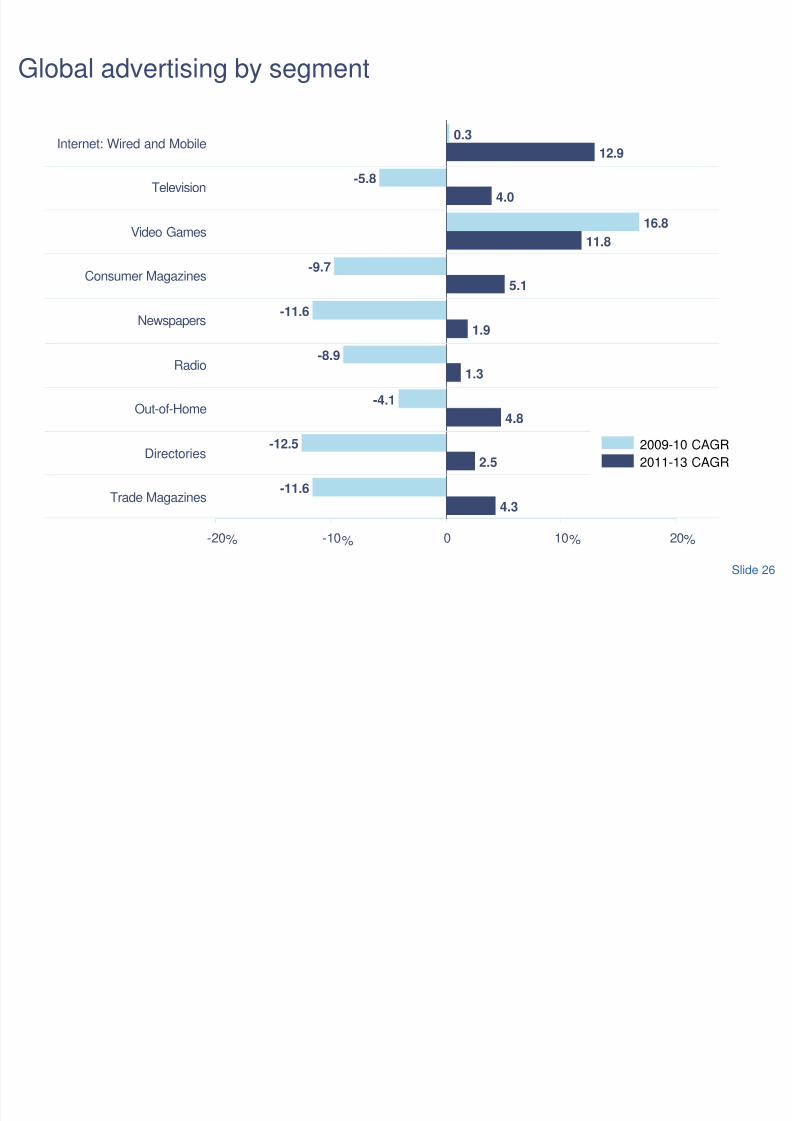
Slide 26
Global advertising by segment
4.3
2.5
4.8
1.3
1.9
5.1
11.8
4.0
12.9
-11.6
-12.5
-4.1
-8.9
-11.6
-9.7
16.8
-5.8
0.3
-20 -10 0 10 20
Trade Magazines
Directories
Out-of-Home
Radio
Newspapers
Consumer Magazines
Video Games
Television
Internet: Wired and Mobile
% % % %
2009-10 CAGR
2011-13 CAGR
8/8/2019 Pwc Entertainment and Media Outlook 2009 2013marcel
http://slidepdf.com/reader/full/pwc-entertainment-and-media-outlook-2009-2013marcel 18/18
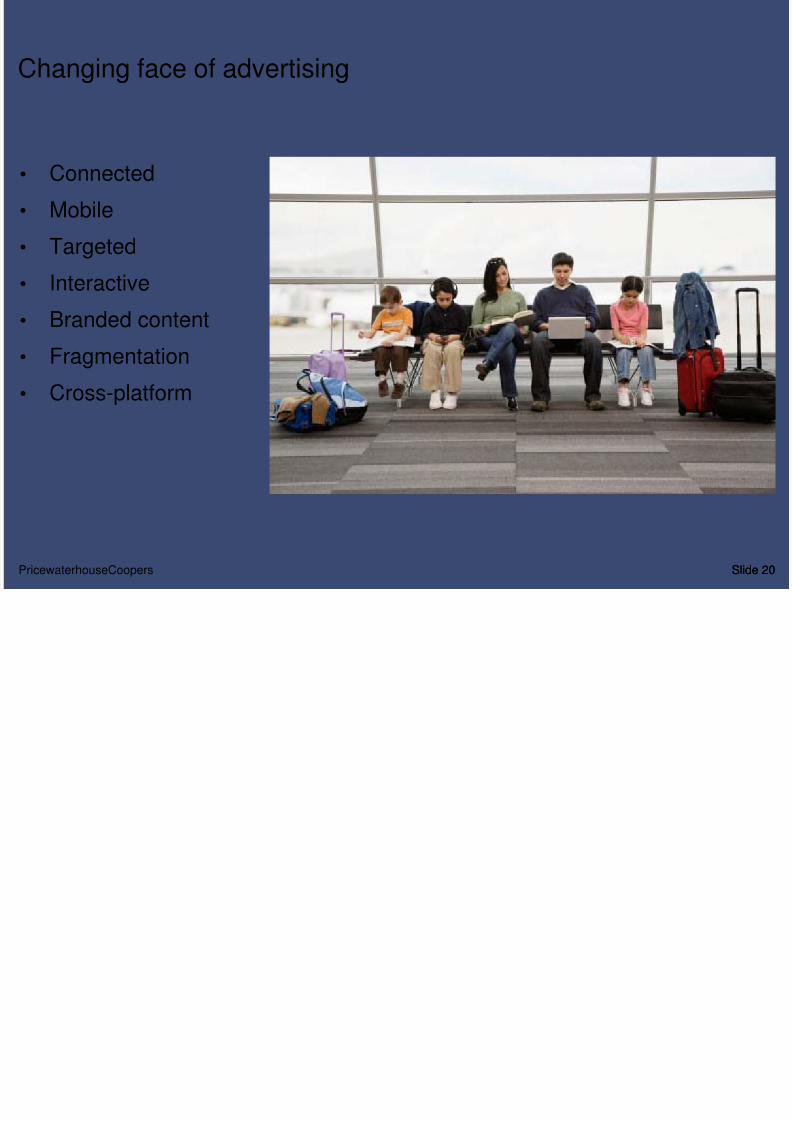
Slide 20
Changing face of advertising
Slide 20PricewaterhouseCoopers
• Connected
• Mobile
• Targeted
• Interactive
• Branded content
• Fragmentation
• Cross-platform