Embed Size (px)
Citation preview
Indian entertainment and media outlook 2009Ind
ian entertainment and
med
ia outlook 2009
pwc.com/india
© 2009 PricewaterhouseCoopers. All rights reserved. “PricewaterhouseCoopers”, a registered trademark, refers to PricewaterhouseCoopers Private Limited (a limited company in India) or, as the context requires, other member firms of PricewaterhouseCoopers International Limited, each of which is a separate and independent legal entity.

About PricewaterhouseCoopers
PricewaterhouseCoopers Pvt. Ltd. (www.pwc.com/india) provides industry - focused tax and advisory services to build public trust and enhance value for its clients and their stakeholders. PwC professionals work collaboratively using connected thinking to develop fresh perspectives and practical advice.
Complementing our depth of industry expertise and breadth of skills is our sound knowledge of the local business environment in India.
PricewaterhouseCoopers is committed to working with our clients to deliver the solutions that help them take on the challenges of the ever-changing business environment.PwC has offices in Ahmedabad, Bangalore, Bhubaneshwar, Chennai, Delhi NCR, Hyderabad, Kolkata, Mumbai and Pune.

3
Contents
Introduction................................................................................................................................... 4
Executive Summary ..................................................................................................................... 5
Television ................................................................................................................................... 29
Print Media ................................................................................................................................. 49
Filmed Entertainment ................................................................................................................. 61
Radio .......................................................................................................................................... 71
Emerging Segments ................................................................................................................... 79
Music ...................................................................................................................................... 80
Internet Advertising ................................................................................................................ 84
Out-Of-Home Advertising ....................................................................................................... 93
Animation, Gaming and VFX Industry ..................................................................................... 97
Sports Entertainment ............................................................................................................ 103
Tax and Regulatory issues impacting the Indian E&M industry ............................................... 109
PricewaterhouseCoopers Entertainment & Media Practice-contacts and office addresses ................................................................................. 122
Glossary of terms and abbreviations ....................................................................................... 124
Glossary of tables and charts .................................................................................................. 125
4
July 29, 2009
Dear Friends,
Welcome to the 2009 edition of PricewaterhouseCoopers’ Indian Entertainment and Media (E&M) Outlook, covering the forecast period of 2009–2013. Our forecasts and analysis for this edition focus on eight major E&M industry segments. To reflect the current slow-pace in the industry, we have included in the executive summary, a section on how E&M companies can cope with the slowdown and prepare for the upturn. We have also included a chapter on the tax and regulatory impact on the various E&M segments, incorporating the Union Budget 2009 recommendations
Although the global economy was showing signs of weakness, the performance of many of the E&M sector companies in India during the first nine months of 2008 was buoyant. However, after October 2008, the negative impact of the economic downturn on the E&M industry became apparent.
The prevailing slowdown is expected to reduce growth rates in the near future. Moreover, the pace of change is likely to increase with greater economic pressure, as consumers seek higher value from the content they consume and advertisers seek more accountability. Nevertheless, the India E&M growth story continues to provide excellent opportunities.
Media segments that are currently experiencing declining revenues are not necessarily because of declining demand. In fact, demand for E&M offerings appears to be increasing. What has changed in some cases is the ability to monetise that demand. Industry must create new models to restore that ability which is why there will be “no place to hide” from new models and dynamics across the industry. Whatever the revenue model be it ad-funded, subscription-based or a combination of both the key to sustainable revenue streams lie in providing a ‘content experience’ that cannot be readily duplicated.
Monetising the increasing demand for E&M content, capitalising on evolving consumption habits, and developing diverse new advertising revenue models are challenges that companies will need to address. The slowdown presents an ideal time to differentiate through innovation of and capitalization on new forms of collaboration across the entertainment, media and communications value chains.
At PricewaterhouseCoopers, we continue to monitor trends and developments that may impact your business now and in the future, and we look forward to further sharing our thoughts with you. We appreciate your feedback and ask that you continue to tell us what we can do to make the Indian E&M Outlook more useful to you. If you wish additional clarification on any matters included in the Indian E&M Outlook, or you believe we can be of service to your business in any way, please contact one of the PricewaterhouseCoopers E&M professionals listed in the report.
Finally, we thank you for your support and wish you an exciting and rewarding year ahead.
Sincerely,
Jairaj Purandare Timmy KandhariCountry Leader - Markets & Industries Leader - Entertainment and Media PricewaterhouseCoopers India PricewaterhouseCoopers India
PricewaterhouseCooopers I Indian entertainment and media outlook 2009
Executive Summary
GDP and the Indian E&M Industry: Impact of the Global Economic Crisis
Managing downturn and preparing for the upturn
Performance of Indian E&M Industry in 2008
Key developments in the Indian E&M Industry in 2008
Key developments in the Global E&M Industry in 2008
Outlook for the Indian E&M Industry 2009-2013
6
We are pleased to present our annual edition of the Indian Entertainment and Media (E&M) Outlook, 2009. Our forecasts and analyses for this edition focus on eight major E&M industry segments.
As we prepare the Indian E&M Outlook, the full extent of the impact of the international financial crisis on the economy, the credit crunch and cutbacks in consumer spending are yet to be determined. It is not clear whether and to what extent the various stimulus packages and bailout plans will halt, slow, or reverse the slide. We do know that the Indian E&M industry is more interrelated than ever to the global economy and that developments globally can quickly affect the this industry. Historical precedent—the benchmark from which forecasts are developed—is now a less reliable guide because the economic climate in most countries, including India, is more volatile than at any other time in recent past. While it is clear that changes in the economic environment in 2009 could significantly affect the projections, we believe that many of the underlying trends we identify in the Indian E&M Outlook, that are driving change in the industry, will remain on course.
GDP and the Indian E&M Industry: Impact of the Global Economic Crisis
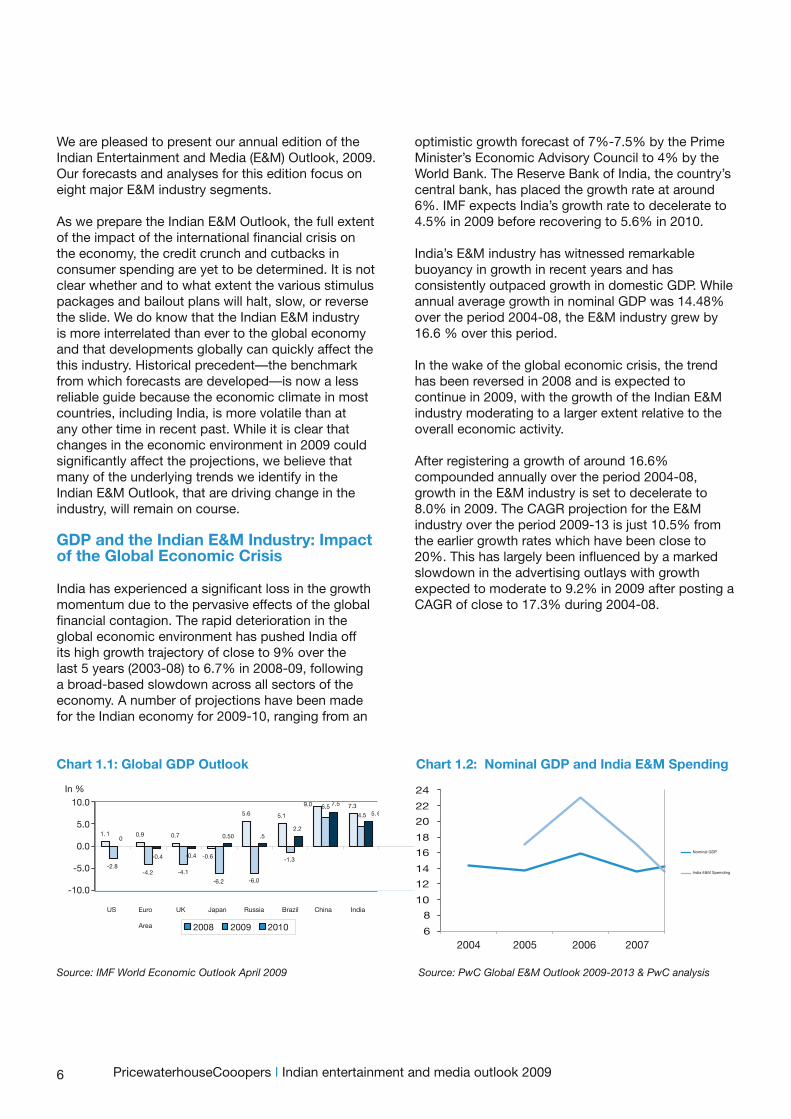
India has experienced a significant loss in the growth momentum due to the pervasive effects of the global financial contagion. The rapid deterioration in the global economic environment has pushed India off its high growth trajectory of close to 9% over the last 5 years (2003-08) to 6.7% in 2008-09, following a broad-based slowdown across all sectors of the economy. A number of projections have been made for the Indian economy for 2009-10, ranging from an
Chart 1.1: Global GDP Outlook
Source: IMF World Economic Outlook April 2009
optimistic growth forecast of 7%-7.5% by the Prime Minister’s Economic Advisory Council to 4% by the World Bank. The Reserve Bank of India, the country’s central bank, has placed the growth rate at around 6%. IMF expects India’s growth rate to decelerate to 4.5% in 2009 before recovering to 5.6% in 2010.
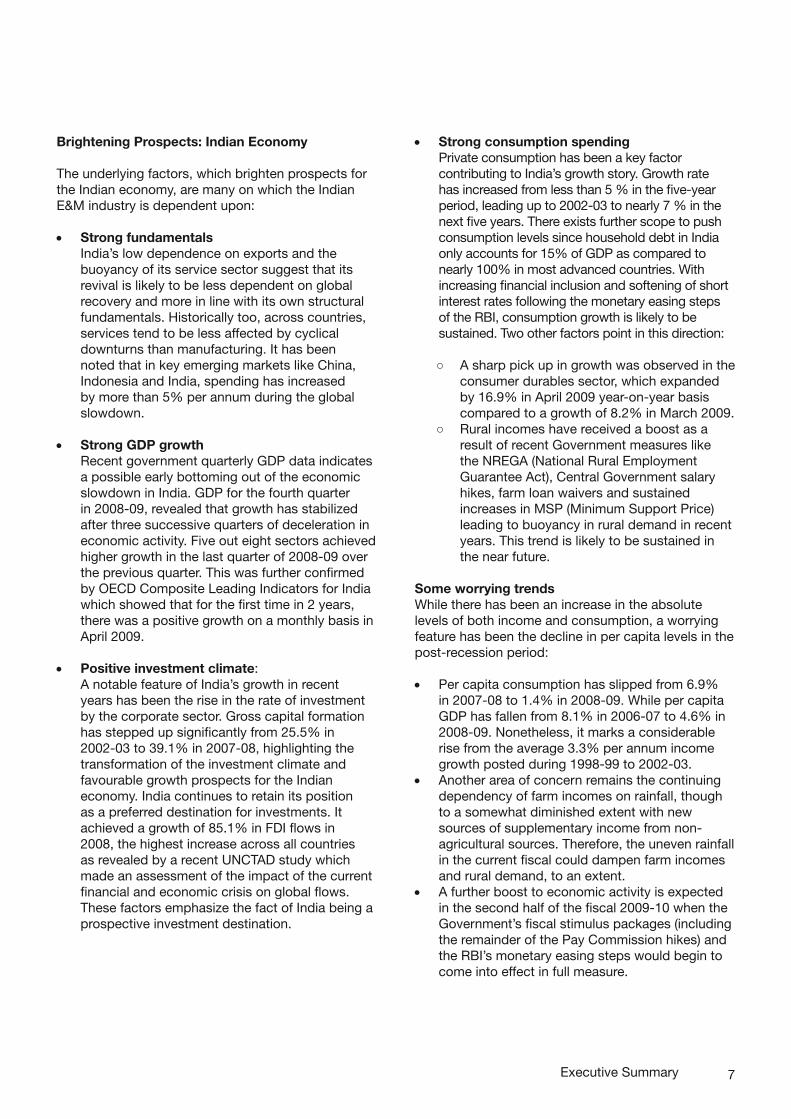
India’s E&M industry has witnessed remarkable buoyancy in growth in recent years and has consistently outpaced growth in domestic GDP. While annual average growth in nominal GDP was 14.48% over the period 2004-08, the E&M industry grew by 16.6 % over this period.
In the wake of the global economic crisis, the trend has been reversed in 2008 and is expected to continue in 2009, with the growth of the Indian E&M industry moderating to a larger extent relative to the overall economic activity.
After registering a growth of around 16.6% compounded annually over the period 2004-08, growth in the E&M industry is set to decelerate to 8.0% in 2009. The CAGR projection for the E&M industry over the period 2009-13 is just 10.5% from the earlier growth rates which have been close to 20%. This has largely been influenced by a marked slowdown in the advertising outlays with growth expected to moderate to 9.2% in 2009 after posting a CAGR of close to 17.3% during 2004-08.
1. 1 0.9 0.7
5.6 5.1
7.3
-2.8-4.2 -4.1
-6.2 -6.0
-1.3
0
-0.4
0.50 .52.2
-0.6
9.0
4.56.5
-0.4
7.5
5. 6
2008 2009 2010
In %10.0
5.0
0.0
-5.0
-10.0
PricewaterhouseCooopers I Indian entertainment and media outlook 2009
US Euro
Area
UK Japan Russia Brazil China India
Chart 1.2: Nominal GDP and India E&M Spending
Source: PwC Global E&M Outlook 2009-2013 & PwC analysis
6
8
10
12
14
16
18
20
22
24
2004 2005 2006 2007
Nominal GDP
India E&M Spemding
7
Brightening Prospects: Indian Economy
The underlying factors, which brighten prospects for the Indian economy, are many on which the Indian E&M industry is dependent upon:
• Strong fundamentalsIndia’s low dependence on exports and the buoyancy of its service sector suggest that its revival is likely to be less dependent on global recovery and more in line with its own structural fundamentals. Historically too, across countries, services tend to be less affected by cyclical downturns than manufacturing. It has been noted that in key emerging markets like China, Indonesia and India, spending has increased by more than 5% per annum during the global slowdown.
• Strong GDP growthRecent government quarterly GDP data indicates a possible early bottoming out of the economic slowdown in India. GDP for the fourth quarter in 2008-09, revealed that growth has stabilized after three successive quarters of deceleration in economic activity. Five out eight sectors achieved higher growth in the last quarter of 2008-09 over the previous quarter. This was further confirmed by OECD Composite Leading Indicators for India which showed that for the first time in 2 years, there was a positive growth on a monthly basis in April 2009.
• Positive investment climate: A notable feature of India’s growth in recent years has been the rise in the rate of investment by the corporate sector. Gross capital formation has stepped up significantly from 25.5% in 2002-03 to 39.1% in 2007-08, highlighting the transformation of the investment climate and favourable growth prospects for the Indian economy. India continues to retain its position as a preferred destination for investments. It achieved a growth of 85.1% in FDI flows in 2008, the highest increase across all countries as revealed by a recent UNCTAD study which made an assessment of the impact of the current financial and economic crisis on global flows. These factors emphasize the fact of India being a prospective investment destination.
• Strong consumption spendingPrivate consumption has been a key factor contributing to India’s growth story. Growth rate has increased from less than 5 % in the five-year period, leading up to 2002-03 to nearly 7 % in the next five years. There exists further scope to push consumption levels since household debt in India only accounts for 15% of GDP as compared to nearly 100% in most advanced countries. With increasing financial inclusion and softening of short interest rates following the monetary easing steps of the RBI, consumption growth is likely to be sustained. Two other factors point in this direction:
○ A sharp pick up in growth was observed in the consumer durables sector, which expanded by 16.9% in April 2009 year-on-year basis compared to a growth of 8.2% in March 2009.
○ Rural incomes have received a boost as a result of recent Government measures like the NREGA (National Rural Employment Guarantee Act), Central Government salary hikes, farm loan waivers and sustained increases in MSP (Minimum Support Price) leading to buoyancy in rural demand in recent years. This trend is likely to be sustained in the near future.
Some worrying trendsWhile there has been an increase in the absolute levels of both income and consumption, a worrying feature has been the decline in per capita levels in the post-recession period:
• Per capita consumption has slipped from 6.9% in 2007-08 to 1.4% in 2008-09. While per capita GDP has fallen from 8.1% in 2006-07 to 4.6% in 2008-09. Nonetheless, it marks a considerable rise from the average 3.3% per annum income growth posted during 1998-99 to 2002-03.
• Another area of concern remains the continuing dependency of farm incomes on rainfall, though to a somewhat diminished extent with new sources of supplementary income from non-agricultural sources. Therefore, the uneven rainfall in the current fiscal could dampen farm incomes and rural demand, to an extent.
• A further boost to economic activity is expected in the second half of the fiscal 2009-10 when the Government’s fiscal stimulus packages (including the remainder of the Pay Commission hikes) and the RBI’s monetary easing steps would begin to come into effect in full measure.
Executive Summary
8
Brightening Prospects: Indian E&M Industry
With the likely bottoming out of the economic recession by 2010, the Indian E&M industry is expected to make a strong recovery. In line with this recovery, the Indian E&M industry is projected to grow by 11% compounded annually over the forecast period 2009-13, well above the global average growth of 2.7% compounded annually. Advertising expenditure is also likely to follow a similar trend.
Indian Entertainment and Media: The contradictions within
Leading consumers • Over ~1,000 movies released annually (largest in the
world) • ~3.2 billion movie tickets sold annually (largest in the
world) • ~80 million pay-TV homes (third largest in the world) • ~119 million television households • ~450 television channels • ~Over 300 million mobile subscribers (second largest
in the world) • ~Over 350 radio stations • ~ 6,000 newspapers published, including the world’s
largest circulated daily • ~10,000 music tracks released annually
Poor revenue generators • Low ARPUs:
○ Average ticket price in India: Less than $1; ○ Average ticket price in US: $6 ○ Average monthly-spend on pay-TV in India: $3.5; ○ Average monthly-spend on pay-TV in US: $15
• Low Ad-GDP ratio: ○ India – 0.55 , USA – 1.18 , World – 0.86
• Low media penetration ○ TV penetration – India -40% , USA – 98%
India is among the largest media consuming and content creating industries. Despite this exciting profile of the Indian E&M industry, it constitutes only around 1% of the global industry. Despite these constraints, India E&M industry is expected to consolidate its position in the global E&M space. Some of the factors that will contribute to this growth are:
Under-penetration and unadvertised marketMost media forms in India have penetration levels
that are well below global levels. In India, TV penetration is close to 50% contrasted with over 90% in markets such as US and China. Similarly, only a third of the population has access to cable and satellite compared to over 85% in the US. The poor penetration and advertising spends coupled with the strong appetite for various forms of media content signals the vast underlying potential and opportunities to unleash growth of the Indian E&M industry in coming years.
Rising growth of E&M and share in GDP Strong consumption spending trends for the recreation, education and cultural services also reflect the sector’s strong fundamentals and the country’s strong appetite for entertainment and leisure. There has been acceleration in growth from 11.4% in 2005-06 to 12.2% in 2007-08. Correspondingly, the share of the sector in total private final consumption expenditure has moved up consistently in recent years from 4% in 2003-04 to 5% in 2007-08.
Budget boostersUnion Budget 2009-10 has made some key announcements which would benefit the E&M industry. The Fringe Benefit Tax amounting to 20, % which was being charged for travel, food, hotel and other expenses incurred by the workforce engaged in outdoor shoots, has been completely eliminated. The budget has also provided for an extension of the stimulus package (announced in February 2009) for print media comprising waiver of 15% agency commission on DAVP advertisements and 10% increase in DAVP rates to December 2009. It has also announced a reduction in the import duties on LCD panels and the re-introduction of the exemption of countervailing duties on accessories, parts and components for the manufacturing of mobile phones for one year. However, a not-so-encouraging announcement for the industry is an imposition of 5 % customs duty on set top boxes for television broadcasting.
Favourable demographic trendsIndia’s young demographic profile (experts point to India’s `youth bulge’ lasting until 2050) with higher propensity for discretionary spending would present unparallel opportunities for the E&M industry. Further, the growing level of urbanisation with over 41% percent of the population living in cities and towns by 2030 from the present level of 28% as per UNDP India Urban Poverty Report 2009 and rising affluence levels would have a sustainable impact on demand creation for leisure and entertainment activities in the coming years.
PricewaterhouseCooopers I Indian entertainment and media outlook 2009

9
Managing downturn and preparing for the upturn
Advertising is in a downturn, after years of heady growth. The job market is in doldrums and consumers are wary of spending money on non-essentials, be it leisure subscriptions, or events. Structural change from analogue to digital distribution, penetration of the internet and broadband usage also presents significant threats and opportunities. Regulatory burdens – from FDI restrictions, to CAS rollouts, to cross media ownership rules and to news on radio – are hampering growth more than ever. While the stable government has buoyed sentiment, industry captains are not sure whether the upturn is for real or a mere blip, and hence corporate confidence is yet to return. Financiers are nervous, shortening their time horizons, and becoming more active in their asset management activities. Preservation, through a ruthless focus on cash generation, is the order of the day and assets are being sweated harder than ever, wherever possible. After the hit taken by some major players, equity for advertising is being undertaken only in exceptional cases. Flawless execution and strategic investments and new deals are being scrutinised with more vigour than ever before. New media assets that were acquired or being considered as an option for future gain are off the priority list for most.
Short-tem Strategy
Media is facing both a cyclical downturn and a structural transition. Media companies are responding to the downturn by driving through a series of cost-cutting measures. Production costs are being cut, whether TV shows, films or print editions. Sales and marketing activities that do not demonstrate their return on investment, defined in hard financials, are been cut or restructured. While many of these changes are long-overdue – the slowdown provides the immediate necessity. Some adopt an incremental approach – tactical activities in specific functional areas to reduce cost. Others take a more transformational approach involving organisational re-design. Incumbents look to preserve their competitive positions in face of stiff competition. The leaders look for cheap buyouts, while at the same time selling non-core, non-cash generating assets.
Acquisition focus • In such times cash and liquidity provide
significant advantages in the E&M world.
• With many PE players being cash starved and unsuccessful as well as over-leveraged media companies compelled to dispose off media properties, companies with excellent fundamentals will have good acquisition opportunities on the table.
• While consolidation is expected to occur in some strong media sectors such as television broadcasting, television distribution and others, it is expected that most deals will be small in size, designed primarily to help media companies extend geographic reach or add critical new capabilities.
Cost Management • The experience of previous slowdowns reveals
that the businesses of industry leaders who undertook cost management exercises were stronger when the economy turned. The starting point would be to shed businesses that may have limited potential for growth. Such steps will not be easy especially with brands having emotional heritage. Nevertheless, the current crisis gives an opportunity to direct investments and attention to related areas that are crucial for growth when the economy turns around.
• The cost management exercises will involve scanning the length and breadth of the organization across various functions to identify areas in which immediate payback is possible. Some of the steps will entail outsourcing beyond the apparent into sales, marketing, editorial and key IT functions which were never thought of outsourcing opportunities before. It may also involve company-wide shared operations.
• Purchasing influences a very significant portion of the cost base. Hence, companies need to re-look at purchasing processes and supplier management.
Portfolio management • A handful of products result in a bulk of profit
for most E&M companies- be it the General Entertainment Channel (GEC) for a broadcaster with a bouquet of channels, or the national edition of a publishing company. While there are many other media properties in the basket of most E&M companies, they contribute very little or none to the overall revenues. These laggards are old businesses that have stagnated over the years; or new launches that have not delivered.
• E&M companies need to ensure that management’s time and money are not being
Executive Summary
10
unnecessarily channelized into sub-optimal portfolio area.
• This needs to be followed by a thorough introspection of whether to stay in businesses that are not adding value to the bottom-line.
Organization structure redesign • Such efforts are first off the block during a
slowdown. However, the measures undertaken are often knee-jerk rather than far reaching; often not encompassing replication within business units, salary levels across the board and management structures that are inflated among other things. This half hearted approach will result in excess coming back in the future.
• Organization redesign, if orchestrated efficiently, can result in ongoing savings over time.
Purchasing dynamics • This aspect contributes a substantial portion of
the costs in most E&M companies. Hence, having a committed and expert purchasing department can result in substantial savings.
• In order to get started, companies need to undertake a review of their purchasing policies at the earliest to understand if significant savings can be realized.
Outsourcing • E&M companies in the west have been
outsourcing their work to countries like India to extract cost savings. Now, as the Indian market matures, it is the turn of Indian E&M companies to outsource central functions such as sales, editorial and content development to cut overheads and scale up efficiently; this aspect being applicable to E&M companies across the spectrum whether it is in television, radio, print, magazines etc.
• Companies can consider various models wherein the most critical functions can be managed in-house, whereas the less important ones can be handed over outside. This could result in substantial cost savings.
Consolidating common functions • While such exercise have always been
undertaken for mundane activities like finance and payroll, the time has come for much more specialized activities such as content development or editorial to be handled centrally as this could result in substantial flab being cut.
• Only functions in which IP creation are involved,
or which entails a lot of secrecy can be continued in decentralized units.
Re-invigorate media sales • With an ad space glut, sales teams of big media
need to adopt an approach, wherein they can move from being commoditized space sellers to a partner of choice.
• To further this cause, they must start off by being able to clearly segment the media-buyers they deal with on a day-to-day basis using the appropriate CRM (Customer Relationship Management).
• Media companies must develop a proper framework, wherein the sales team must be able to provide consumer insights relevant to the media-buyers audience so that reach and frequency goals can take a backseat and higher end parameters such as purchasing intent and media affinity come to the forefront. This will involve setting up a centralized set up which can feed data to the various brands.
• Another area which needs immediate attention is the differentiation between high value inventory and commoditized offerings. With mega profits being made on flagship properties such as the IPL T20 cricket league or the highest rated soap, a paradigm shift is required in the approach to sell both these different offerings.
• For this purpose, media companies need sales organizations to address these two types of inventory and tools such as CRM to segment the buyers and deal with them appropriately. For instance, in order to sell their low value inventory, companies could look at selling their unused inventory over the internet or other low cost mechanism at the last minute. Some of the large television stations in the west are allowing internet search engines such as Google, to broker a small amount of their cable inventory over the internet.
Tackling legacy assets • Often, legacy assets have been bolted on to
existing businesses in the hope of synergies, or as a response to a market fad – online is one example.
• The increasing role of private equity and other financiers has brought an increased focus on financial and operating discipline in a world, where strategic or creative flair has been more openly recognised and rewarded within the corridors of power. With highly leveraged
PricewaterhouseCooopers I Indian entertainment and media outlook 2009
11
assets, they are looking for an exit or radical improvements in operational performance.
• Now is the time to reconsider the organisation afresh and identify which assets would benefit from consolidation in operational management.
Real estate optimization • From separate locations within the same city
to excess or exorbitantly priced real estate, there usually is an opportunity to prune real estate costs if a real estate review has not been undertaken for some time.
• Other options to manage such costs include electricity saving measures as well as considering alternate sources like solar energy.
• Work from home is yet another tactic which has been successfully used in the west and can bring down the real estate costs substantially.
Implementation • Downturn means less strategizing and fast
decisions. The top management needs to pay immediate heed to the below-mentioned areas, while at the same time planning for the future upturn. ○ Contract management – enforcing the terms
of agreements and re-negotiating key terms, in order to collect cash more aggressively.
○ Talent cost reduction – hiring and pay freeze. ○ Terms of content and talent contracts. ○ Reducing capital expenditure or delaying
capital expenditure programmes. ○ Structures and terms of partnerships and
alliances. ○ Re-negotiating financing arrangements. ○ Seeking regulatory relief for onerous licence
obligations or barriers to industry change. ○ Cutting costs in finance and IT . ○ Disposals, wherever possible.
New opportunities • While the present is gloomy it would not stay that
way forever. The economy will improve over time. At that time, media companies need to be nimble to take an advantage of opportunities as they emerge.
• Decisions that may improve cash flows in the short term, – unnecessary job cuts, or improper supplier management among others – but hamper the ability of the organisation to ride the uptrend will prove extremely negative.
• For instance, many of the broadcasting companies have undertaken capital intensive
businesses such as DTH, which will not offer immediate payback .However, they will be instrumental in developing new business models and future value. Businesses such as these should be nurtured with care even in the face of the downturn.
Long-tem Strategy
Media companies, which emerge from the downturn with a lower cost base and a differentiated business model, will redefine the competitive dynamics. Many media companies talk about a vision of putting customers at the heart of everything they do and managing their IP across all platforms. Taking this vision as into account; differentiating the winners from the losers will be down to the decisions taken along the way, and the execution of the vision. Some steps a CEO or Board member of any media company could consider in the transformation journey to both survive and thrive in this turbulent world, are as follows:
Focus on IP profit maximisation across all channels • The spoils from exploiting and protecting
monopoly assets, from broadcast licences to print franchises, are diminishing.
• The challenge is now to attract and keep customers in a fragmented, multi-channel world.
• Viewers do not want to wait until they are in front of a television to check T20 cricket scores, or the latest news on the Dalal Street. They want this data to be available everywhere and all the time. This means re-allocating content commissioning, production, sales and distribution of assets accordingly.
• Cross platform exploitation of brands, characters, titles, programmes or patents is the order of the day. In practice, this means investing in and managing assets across the portfolio in order to maximise overall profitability.
• This involves hard-to-find investment in digitisation of the archive, rights negotiations and search functionality to ensure consumers can find the ‘Long Tail’ easily. It also means driving new content hard for mass market exploitation and protecting rights vigorously. Last but not the least, large media companies need to use CRM strategies and their clout in one industry , say television or radio, to drive consumers into their own theatres or to buy DTH sets from their sister concern .
Executive Summary
12
• For instance, a Viewer who votes aggressively for his favourite contestant on a particular television channel could be attracted to buy a product from the channel’s sister concern in the media group.
Changes in organisational structures, personal incentives and financial reporting • Brand managers have been appointed in many
media companies and there is much talk about the role of ‘super brands’.
• The next step is to translate statements of “anyplace, anytime, anywhere” models of content delivery into new organisational structures and day-to-day commercial decisions.
• Delivering this objective requires collecting, analysing and reporting financial information across all channels in order to calculate the return on investment per brand and make informed-decisions as a result.
• Understanding the interaction of brands across channels, particularly the potential for cannibalisation and synergies is a priority, as is willingness-to-pay and the factors driving uptake and churn. In practice, these interactions are often assumed or under-analysed even when new decisions are taken on which brands, services or platforms to invest in, close or re-position.
Treat accountability as a must, not a luxury • A cyclical downturn and an industry in structural
transition mean that ‘accountability’ takes on an enhanced importance. Technological change – through new optimisation models, usage metrics and search – has increased the expectation for accountability across the whole media sector.
• Data management and CRM become the new core competencies – lessons from retail and financial services markets, further ahead than media, should be heeded. In practice, this means:
• Using technology to its full potential to optimally use the consumer data.
• Communicating the value of more advertisement. • Being clearer about the measures used to
make the cross-platform usage more attractive, particularly in commissioning and sales.
• Rethinking the effectiveness of sales teams – client account management takes on a new meaning in this environment.
• Identifying the value of content in driving other sales and hence the commercial arrangements that should be in place – examples include follow-on sales (downloads, events) and hence
the tariffs charged. • Identifying customer profitability by segment,
leveraging research where appropriate.
Re-visit fundamentals and accepted norms • In re-balancing the portfolio in response to the
cyclical downturn and structural transition, it is vital to re-asses the fundamental value of IP and businesses within it.
• Historical legacies in old contracts require re-examination. Comparable deals used to justify pricing arrangements, may bear little, if any, relation to the intrinsic value of the asset.
• Too often, pricing structures reflect the past, lagging the present. New measurement models will come to the fore to support and shape these new structures. In practice, this means:
• Protecting core assets by minimising revenue leakage and identifying new revenue streams.
• Re-examining the relevance of tariffs and royalty rates stated in existing contracts in light of current and future market conditions. Active consideration of how profitability can be increased, for example, through re-negotiation or more effective price discrimination, should be a priority.
• Assessing how advertising price premia can be supported in the digital era and what can be done to affect them.
• Evaluating how advertising sales models should develop, learning lessons across media, and exploring the role of product placement in media. This will require more investment in the cross-media measurement required to support new models and platforms.
• Developing and applying new transfer pricing policies. Marginal cost-based-pricing for new media services may be difficult to justify in a world, in which cross-platform exploitation is factored into content commissioning decisions from the outset.
• Re-assessing which activities can be shared with partners or outsourced, especially those with a historical legacy or deemed to be ‘core’ activities.
• Considering how regulatory restrictions –licence obligations (including content restrictions) and ownership rules to name but a few – could change in light of the changing industry dynamics and new government.
PricewaterhouseCooopers I Indian entertainment and media outlook 2009
13
New partnership models • Partnerships and alliances abound in the media
sector, in fact far more than other sectors according to our recent PwC Global CEO survey
• Partnership structuring is a high profile activity that often attracts the best companies, as well as top talent.
• In a cash-starved, risk averse environment, it pays to adopt a systematic approach to partnership structuring that avoids the following common problems:
• Regulatory/legal hurdles identified too late, or insufficient attention paid at the early stages of the partnership structuring.
• A deal structure that is difficult to implement and monitor.
• Deal terms that turn out to be unattractive when the full cost of operating the partnership is uncovered; and
• Un-intended consequences from partnership decisions that have an impact on other relationships in the sector calls for a holistic view to save a loss of trust and significant cost.
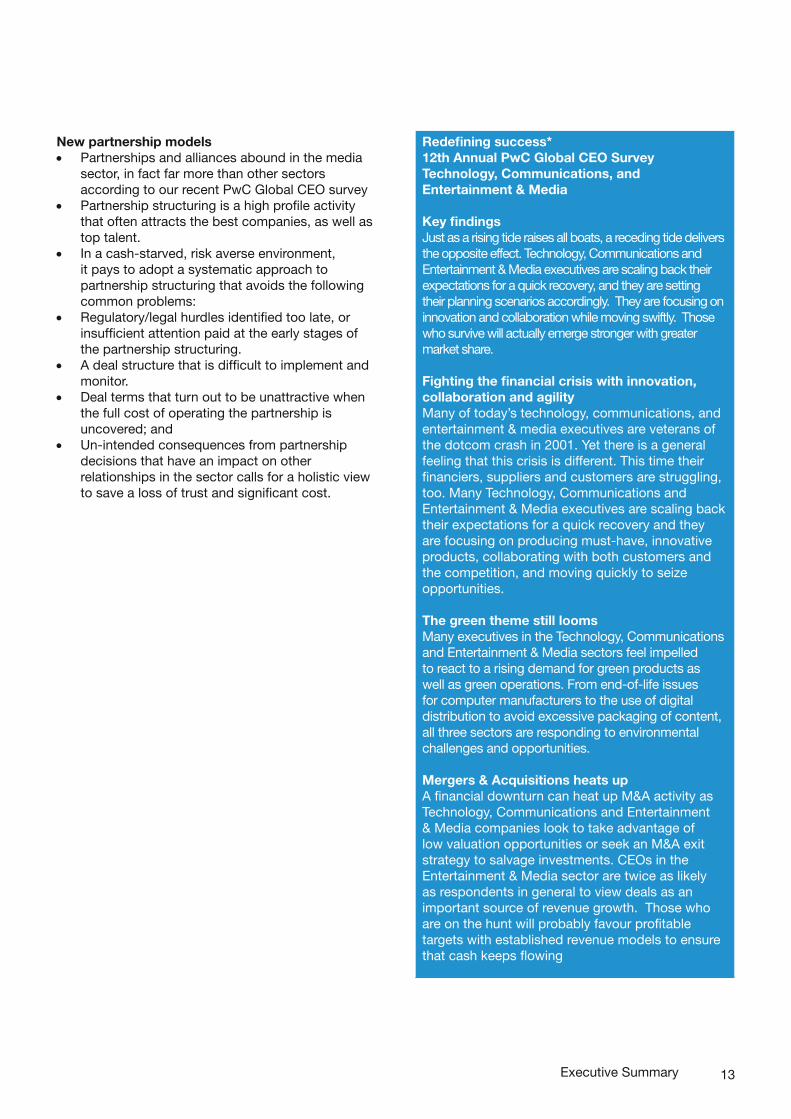
Redefining success*12th Annual PwC Global CEO SurveyTechnology, Communications, and Entertainment & Media
Key findingsJust as a rising tide raises all boats, a receding tide delivers the opposite effect. Technology, Communications and Entertainment & Media executives are scaling back their expectations for a quick recovery, and they are setting their planning scenarios accordingly. They are focusing on innovation and collaboration while moving swiftly. Those who survive will actually emerge stronger with greater market share.
Fighting the financial crisis with innovation, collaboration and agilityMany of today’s technology, communications, and entertainment & media executives are veterans of the dotcom crash in 2001. Yet there is a general feeling that this crisis is different. This time their financiers, suppliers and customers are struggling, too. Many Technology, Communications and Entertainment & Media executives are scaling back their expectations for a quick recovery and they are focusing on producing must-have, innovative products, collaborating with both customers and the competition, and moving quickly to seize opportunities.
The green theme still loomsMany executives in the Technology, Communications and Entertainment & Media sectors feel impelled to react to a rising demand for green products as well as green operations. From end-of-life issues for computer manufacturers to the use of digital distribution to avoid excessive packaging of content, all three sectors are responding to environmental challenges and opportunities.
Mergers & Acquisitions heats upA financial downturn can heat up M&A activity as Technology, Communications and Entertainment & Media companies look to take advantage of low valuation opportunities or seek an M&A exit strategy to salvage investments. CEOs in the Entertainment & Media sector are twice as likely as respondents in general to view deals as an important source of revenue growth. Those who are on the hunt will probably favour profitable targets with established revenue models to ensure that cash keeps flowing
Executive Summary
14
New Markets • The right strategy for which areas to enter
followed by ways in which to orchestrate the entry is the most important step. This may mean challenging the basic premise of various companies. For example, a company may need to start off with dubbing local content rather than producing content.
• “Slumdog Millionaire” and “Bollywood” are some examples to show that significant potential exists for Indian content in many markets. The key is to choose the right opportunity based on the likelihood of monetizable growth.
• Significant new lines of business exist by re-purposing the very data that is at the heart of E&M companies. For instance, media companies interact with large number of audiences on a daily or weekly basis and hence monetizable opportunities in Relationship Management exist. These opportunities can provide additional value to the sales deal by getting clients to use this data on a per-usage-basis.
• Below-the-line marketing spends are increasing at a rapid pace as it is response driven and hence such new models make sense in a downturn where advertising spends are tight.
• Moreover, E&M companies can increase revenues from the same customer by getting new spends beyond traditional advertising.
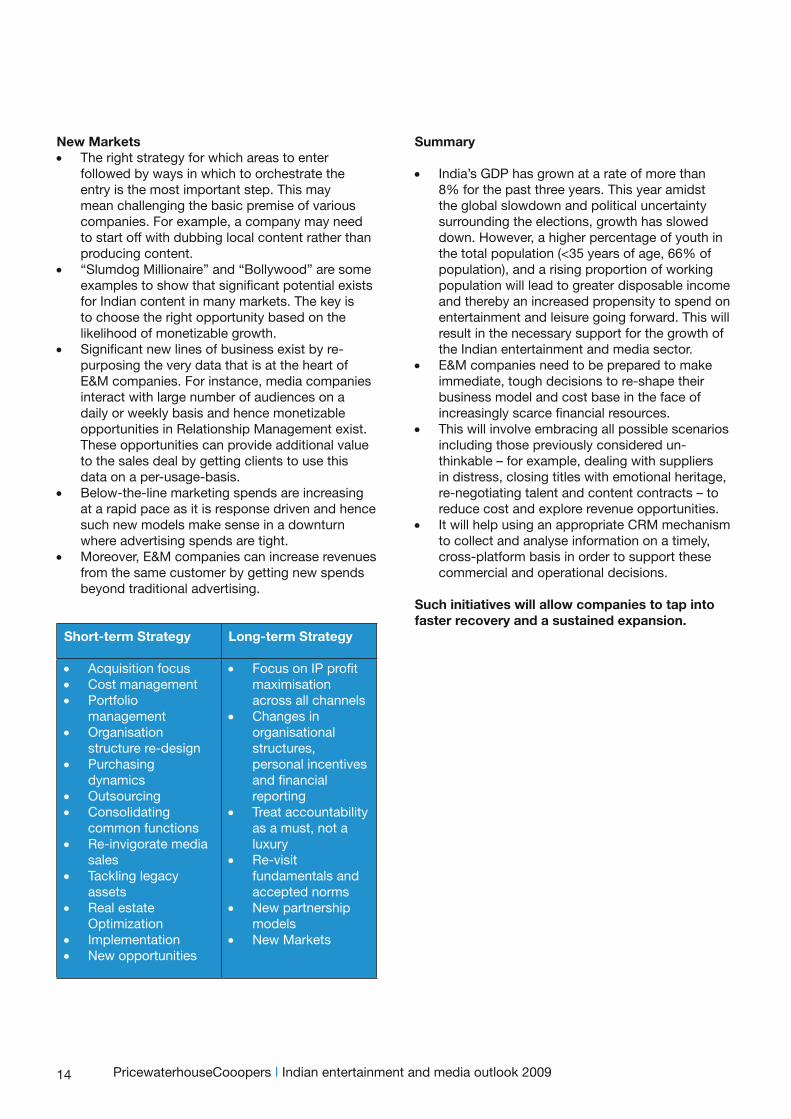
Short-term Strategy Long-term Strategy
• Acquisition focus • Cost management • Portfolio
management • Organisation
structure re-design • Purchasing
dynamics • Outsourcing • Consolidating
common functions • Re-invigorate media
sales • Tackling legacy
assets • Real estate
Optimization • Implementation • New opportunities
• Focus on IP profit maximisation across all channels
• Changes in organisational structures, personal incentives and financial reporting
• Treat accountability as a must, not a luxury
• Re-visit fundamentals and accepted norms
• New partnership models
• New Markets
Summary
• India’s GDP has grown at a rate of more than 8% for the past three years. This year amidst the global slowdown and political uncertainty surrounding the elections, growth has slowed down. However, a higher percentage of youth in the total population (<35 years of age, 66% of population), and a rising proportion of working population will lead to greater disposable income and thereby an increased propensity to spend on entertainment and leisure going forward. This will result in the necessary support for the growth of the Indian entertainment and media sector.
• E&M companies need to be prepared to make immediate, tough decisions to re-shape their business model and cost base in the face of increasingly scarce financial resources.
• This will involve embracing all possible scenarios including those previously considered un-thinkable – for example, dealing with suppliers in distress, closing titles with emotional heritage, re-negotiating talent and content contracts – to reduce cost and explore revenue opportunities.
• It will help using an appropriate CRM mechanism to collect and analyse information on a timely, cross-platform basis in order to support these commercial and operational decisions.
Such initiatives will allow companies to tap into faster recovery and a sustained expansion.
PricewaterhouseCooopers I Indian entertainment and media outlook 2009
15
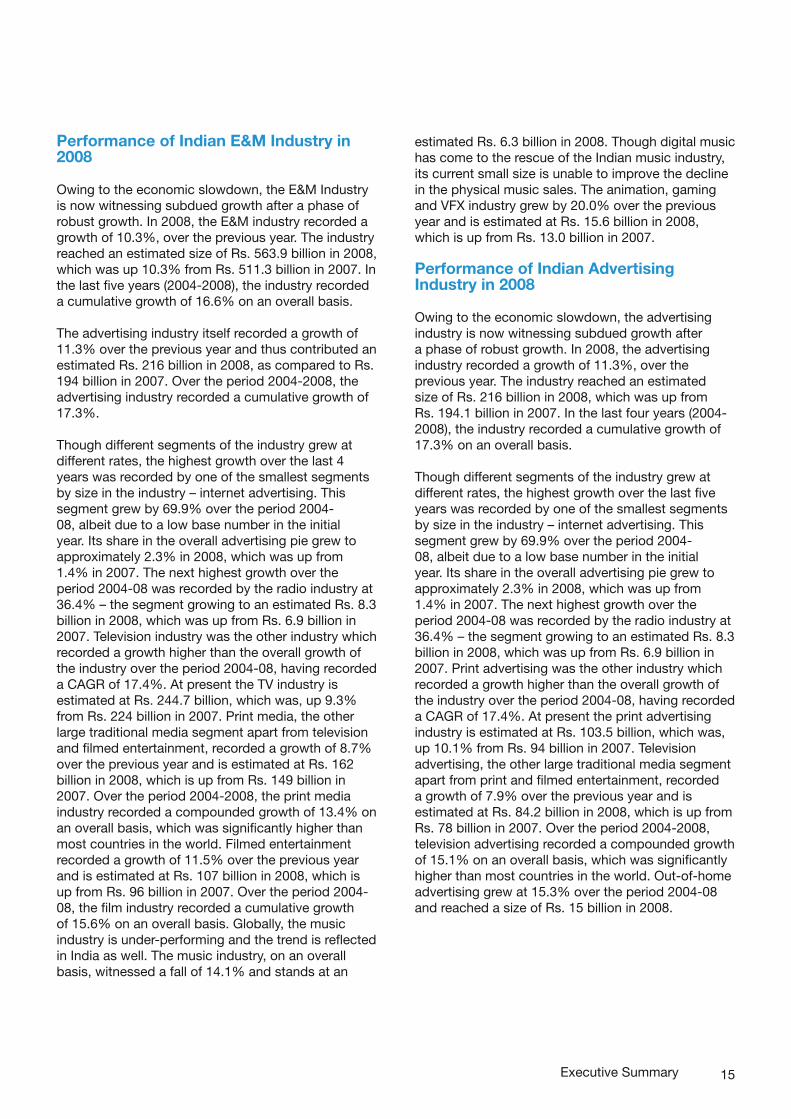
Performance of Indian E&M Industry in 2008
Owing to the economic slowdown, the E&M Industry is now witnessing subdued growth after a phase of robust growth. In 2008, the E&M industry recorded a growth of 10.3%, over the previous year. The industry reached an estimated size of Rs. 563.9 billion in 2008, which was up 10.3% from Rs. 511.3 billion in 2007. In the last five years (2004-2008), the industry recorded a cumulative growth of 16.6% on an overall basis.
The advertising industry itself recorded a growth of 11.3% over the previous year and thus contributed an estimated Rs. 216 billion in 2008, as compared to Rs. 194 billion in 2007. Over the period 2004-2008, the advertising industry recorded a cumulative growth of 17.3%.
Though different segments of the industry grew at different rates, the highest growth over the last 4 years was recorded by one of the smallest segments by size in the industry – internet advertising. This segment grew by 69.9% over the period 2004-08, albeit due to a low base number in the initial year. Its share in the overall advertising pie grew to approximately 2.3% in 2008, which was up from 1.4% in 2007. The next highest growth over the period 2004-08 was recorded by the radio industry at 36.4% – the segment growing to an estimated Rs. 8.3 billion in 2008, which was up from Rs. 6.9 billion in 2007. Television industry was the other industry which recorded a growth higher than the overall growth of the industry over the period 2004-08, having recorded a CAGR of 17.4%. At present the TV industry is estimated at Rs. 244.7 billion, which was, up 9.3% from Rs. 224 billion in 2007. Print media, the other large traditional media segment apart from television and filmed entertainment, recorded a growth of 8.7% over the previous year and is estimated at Rs. 162 billion in 2008, which is up from Rs. 149 billion in 2007. Over the period 2004-2008, the print media industry recorded a compounded growth of 13.4% on an overall basis, which was significantly higher than most countries in the world. Filmed entertainment recorded a growth of 11.5% over the previous year and is estimated at Rs. 107 billion in 2008, which is up from Rs. 96 billion in 2007. Over the period 2004-08, the film industry recorded a cumulative growth of 15.6% on an overall basis. Globally, the music industry is under-performing and the trend is reflected in India as well. The music industry, on an overall basis, witnessed a fall of 14.1% and stands at an
estimated Rs. 6.3 billion in 2008. Though digital music has come to the rescue of the Indian music industry, its current small size is unable to improve the decline in the physical music sales. The animation, gaming and VFX industry grew by 20.0% over the previous year and is estimated at Rs. 15.6 billion in 2008, which is up from Rs. 13.0 billion in 2007.
Performance of Indian Advertising Industry in 2008
Owing to the economic slowdown, the advertising industry is now witnessing subdued growth after a phase of robust growth. In 2008, the advertising industry recorded a growth of 11.3%, over the previous year. The industry reached an estimated size of Rs. 216 billion in 2008, which was up from Rs. 194.1 billion in 2007. In the last four years (2004-2008), the industry recorded a cumulative growth of 17.3% on an overall basis.
Though different segments of the industry grew at different rates, the highest growth over the last five years was recorded by one of the smallest segments by size in the industry – internet advertising. This segment grew by 69.9% over the period 2004-08, albeit due to a low base number in the initial year. Its share in the overall advertising pie grew to approximately 2.3% in 2008, which was up from 1.4% in 2007. The next highest growth over the period 2004-08 was recorded by the radio industry at 36.4% – the segment growing to an estimated Rs. 8.3 billion in 2008, which was up from Rs. 6.9 billion in 2007. Print advertising was the other industry which recorded a growth higher than the overall growth of the industry over the period 2004-08, having recorded a CAGR of 17.4%. At present the print advertising industry is estimated at Rs. 103.5 billion, which was, up 10.1% from Rs. 94 billion in 2007. Television advertising, the other large traditional media segment apart from print and filmed entertainment, recorded a growth of 7.9% over the previous year and is estimated at Rs. 84.2 billion in 2008, which is up from Rs. 78 billion in 2007. Over the period 2004-2008, television advertising recorded a compounded growth of 15.1% on an overall basis, which was significantly higher than most countries in the world. Out-of-home advertising grew at 15.3% over the period 2004-08 and reached a size of Rs. 15 billion in 2008.
Executive Summary
16 PricewaterhouseCooopers I Indian entertainment and media outlook 2009
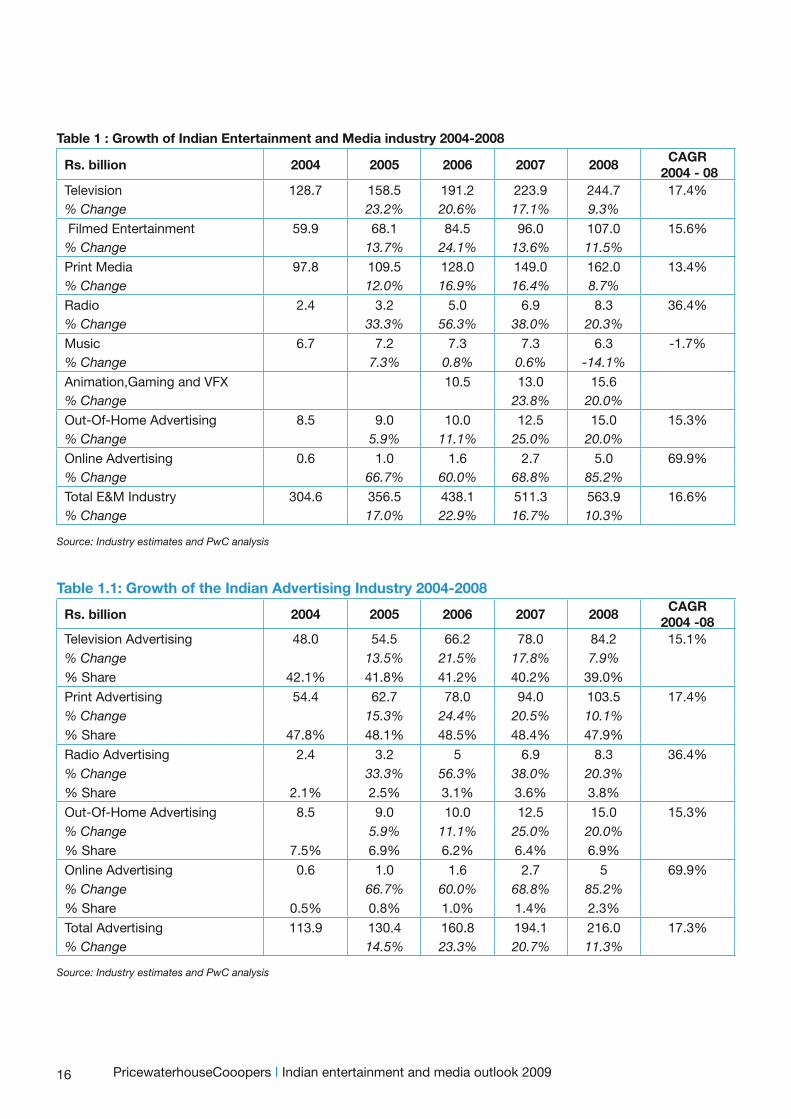
Table 1 : Growth of Indian Entertainment and Media industry 2004-2008
Rs. billion 2004 2005 2006 2007 2008CAGR
2004 - 08Television 128.7 158.5 191.2 223.9 244.7 17.4%% Change 23.2% 20.6% 17.1% 9.3%
Filmed Entertainment 59.9 68.1 84.5 96.0 107.0 15.6%% Change 13.7% 24.1% 13.6% 11.5%
Print Media 97.8 109.5 128.0 149.0 162.0 13.4%% Change 12.0% 16.9% 16.4% 8.7%
Radio 2.4 3.2 5.0 6.9 8.3 36.4%% Change 33.3% 56.3% 38.0% 20.3%
Music 6.7 7.2 7.3 7.3 6.3 -1.7%% Change 7.3% 0.8% 0.6% -14.1%
Animation,Gaming and VFX 10.5 13.0 15.6% Change 23.8% 20.0%
Out-Of-Home Advertising 8.5 9.0 10.0 12.5 15.0 15.3%% Change 5.9% 11.1% 25.0% 20.0%
Online Advertising 0.6 1.0 1.6 2.7 5.0 69.9%% Change 66.7% 60.0% 68.8% 85.2%
Total E&M Industry 304.6 356.5 438.1 511.3 563.9 16.6%% Change 17.0% 22.9% 16.7% 10.3%
Source: Industry estimates and PwC analysis
Table 1.1: Growth of the Indian Advertising Industry 2004-2008
Rs. billion 2004 2005 2006 2007 2008CAGR
2004 -08Television Advertising 48.0 54.5 66.2 78.0 84.2 15.1%% Change 13.5% 21.5% 17.8% 7.9%% Share 42.1% 41.8% 41.2% 40.2% 39.0%
Print Advertising 54.4 62.7 78.0 94.0 103.5 17.4%% Change 15.3% 24.4% 20.5% 10.1%% Share 47.8% 48.1% 48.5% 48.4% 47.9%
Radio Advertising 2.4 3.2 5 6.9 8.3 36.4%% Change 33.3% 56.3% 38.0% 20.3%% Share 2.1% 2.5% 3.1% 3.6% 3.8%
Out-Of-Home Advertising 8.5 9.0 10.0 12.5 15.0 15.3%% Change 5.9% 11.1% 25.0% 20.0%% Share 7.5% 6.9% 6.2% 6.4% 6.9%
Online Advertising 0.6 1.0 1.6 2.7 5 69.9%% Change 66.7% 60.0% 68.8% 85.2%% Share 0.5% 0.8% 1.0% 1.4% 2.3%
Total Advertising 113.9 130.4 160.8 194.1 216.0 17.3%% Change 14.5% 23.3% 20.7% 11.3%
Source: Industry estimates and PwC analysis
17
Key developments in the Indian E&M Industry in 2008
Impact of global economic downturn Slowdown has impacted the Indian E&M industry more from an advertising standpoint than a subscription standpoint. Advertising revenues have slowed down as a result of declining advertising bugets owing to the economic slowdown. Comparatively, subscription revenues remained flat except in the film industry where admissions have seen a negative growth, due to the producer multiplex standoff.
In the last quarter of 2008, spends of the key print advertisers like realty, banking/finance, IT/telecom and durables nosedived and some categories totally stopped spends. The slowdown impacted the print industry more than the television industry. However, internet advertising picked up; marketers looking to measurability increasing internet spends manifold.
As immediate measures to tackle the impact of the global economic downturn, E&M industry professionals have resorted to costs rationalisation. These vary from cutting staff costs to real-estate and other administrative costs. Advertisers, both from the E&M industry and others, have significantly reduced their advertisement budgets except for FMCG and Telecom. Severe cost-cutting measures are the order of the day. The impact on key segments is as follows:
• Print and Magazines - Newspapers and publications have reduced the number of pages to cope with the recession. Magazines too have discontinued supplements, which were earlier distributed free of cost with the main product. Rising newsprint costs have added to the woes of the print media industry.
• Television - In the television sector, competition among broadcasters is expected to drive profitability drastically downwards. In addition, funding for distribution investments is expected to slowdown considerably and carriage fees will be pruned down considerably. A silver lining for the television industry is that viewing hours tend to increase in tough times as consumers stay at home and hence this may be a good time for television to develop an unassailable lead between itself and other media.
• Film Industry - For the Indian film industry, the global economic downturn has resulted in rationalization of costs across the spectrum of the industry. Moreover, there is a decrease in the number of film releases due to shortage of funds for completion of projects, marketing and and promotion activities. Budgets have been scaled down for expansion plans by major corporate film entities and some of the corporates have terminated several of their film projects. Most film budgets planned have also been scaled down owing to de-acelerated growth in expansion of screens for multiplex chains, which is resulting into lower occupancy levels for the exhibitors and thereby lower admissions.
• Radio Industry - The radio industry has witnessed unprecedented deceleration in the third and fourth quarter on the back of an advertising slowdown. To battle recession FM radio stations have cut down on broadcast hours during late hours in smaller cities. The silver lining for the radio industry in a tough economic environment is that advertisers are clearly seeing the benefit of the ability of radio to deliver superior reach compared to print in a far better cost-effective manner. Moreover, as opposed to print and television, micro-targeting, localization and integration with BTL is also possible.
• Music- Soaring music acquisition rights have witnessed some corrections with music companies acquiring rights by bundling movies. In addition , a slowdown in physical sales due to drop in consumer spending has led to an inventory build-up for the distributors and retailers who have been returning the physical stock of cassettes and CDs back to the music companies to optimize their shelf space.
• Out-Of-Home (OOH)- Lack of proper accountability and measurability has resulted in this medium being one of the worst hit amidst the slowdown. Advertising budgets have shrunk by almost 35-40% especially in sectors such as financial services which contributed significantly to the OOH advertising industry. The slowdown has also resulted in a rationalization of bid prices in the market, with some long-term properties not finding any takers and the new players are being forced to shut shop.
Executive Summary
18
• Animation – The disappointing performances at the box office of many animation and VFX movies released in 2008 such as Jumbo, Roadside Romeo, Lovestory 2050 has made producers more cautious and they are looking closely at the story and script before sanctioning financial investment for animation or VFX movies amidst the slowdown.
• Internet - Internet advertising is one of the few segments that have had a low impact of the slowdown. The measurability factor often a subject of wrath for the on-line medium, has turned a saviour where marketers are looking to optimize and increase their efficacy through on-line platforms.
Indian E&M companies going international
• Reliance- Spielberg - Anil Ambani’s Reliance ADA Group formalised its association with DreamWorks Studios promoted by Hollywood director Steven Spielberg and his partner Stacey Snider. As part of the deal finalised in July 2009, the two players will have a 50 per cent stake in DreamWorks and will make movies with an initial funding of $825 million.
• BCCL - Virgin Radio UK - Radio sector’s first out-bound investment took place in 2008 with Bennett Coleman and Company Ltd. (BCCL) acquiring Virgin Radio Holdings from UK-based SMG Plc for a consideration of $106 million (Rs. 448 crore). Virgin Radio is a music station, which operates under a FM licence in London and an AM licence in the rest of the UK.
• Reliance Anil Dhirubhai Ambani Group (R-ADAG) has launched a 24-hour FM radio station in Singapore Big Bollywood 96.3 FM that will broadcast Indian film music, news and other entertainment trivia in a collaborative venture with local station Media Corp. Radio.
• Compact Disc India Ltd (CDIL) has teamed up with Pele, the legendary soccer player, to develop a 3D animation feature film on the game of soccer.
• Toonz Animation India, Gang of 7 Animation and Hyde Park Entertainment (Ashok Amritraj’s company) to produce the 60-80 minute feature The Life and Adventures of Santa Claus. targeted at families worldwide .
Launch of new products and offerings
• Launch of new General Entertainment Channels - Four new GECs were launched between the end of 2007 and mid-2009. These were 9X (INX Group), NDTV Imagine (NDTV Group), Colors (Viacom 18 Group) and Real (Miditech Turner).
• New genres of programming on television channels - Long-running popular shows on Star Plus, such as “Kyuunki”, “Kasautii” and “Kahani”were phased out.Newer shows like Balika Vadhu , Bidayii , Big Boss 2 and Khatron Ki Khiladi took centre stage.
• Growth in niche channels - 2008 was the year of launching specialised channels catering to the needs of up-scale and urban audiences. These new niche offerings included Showbiz, NDTV Lumiere, World Movies, E24, Firangi and Topper TV among others.
• Newspaper publishers such as Dainik Bhaskar , Mint , Jagran Prakashan , Lokmat and Pudhari among others launched new editions during the year .
• Magazine publishing segment saw the maximum activity with launch of several new titles such as ‘Forbes India’ , ‘Open’ , ‘Career’s 360’ , ‘Technology Review’,’Harper’s Bazaar’ , ‘FNL’ , ‘What Women Want’ among many others
• The new season of IPL, IPL2 was termed more successful than IPL1 despite it being held outside India, with more afternoon matches alongside elections – highlighting the success of the concept. Numbers of viewers in IPL2 were estimated at ~90million, significantly higher than IPL1 of ~ 85 million.
Digitalisation initiatives in 2008
• Television – The CAS (Conditional Access System) rollout is underway in the Metros of Mumbai, Delhi, Kolkata and Chennai . In the quarter ending 31st December 2008, the STB ( Set Top Box) number is 767616 in the CAS notified areas of Delhi, Mumbai, Kolkata and Chennai.
• Print goes online – Almost all the Indian newspaper and magazine groups are now online. However , although there is a huge potential for growth online, print remains the largest source of revenue generation for newspaper publishers, and will continue to be so for some time
• Digital music- UTV New Media Ltd., the digital arm of UTV announced plans to launch an
PricewaterhouseCooopers I Indian entertainment and media outlook 2009
19
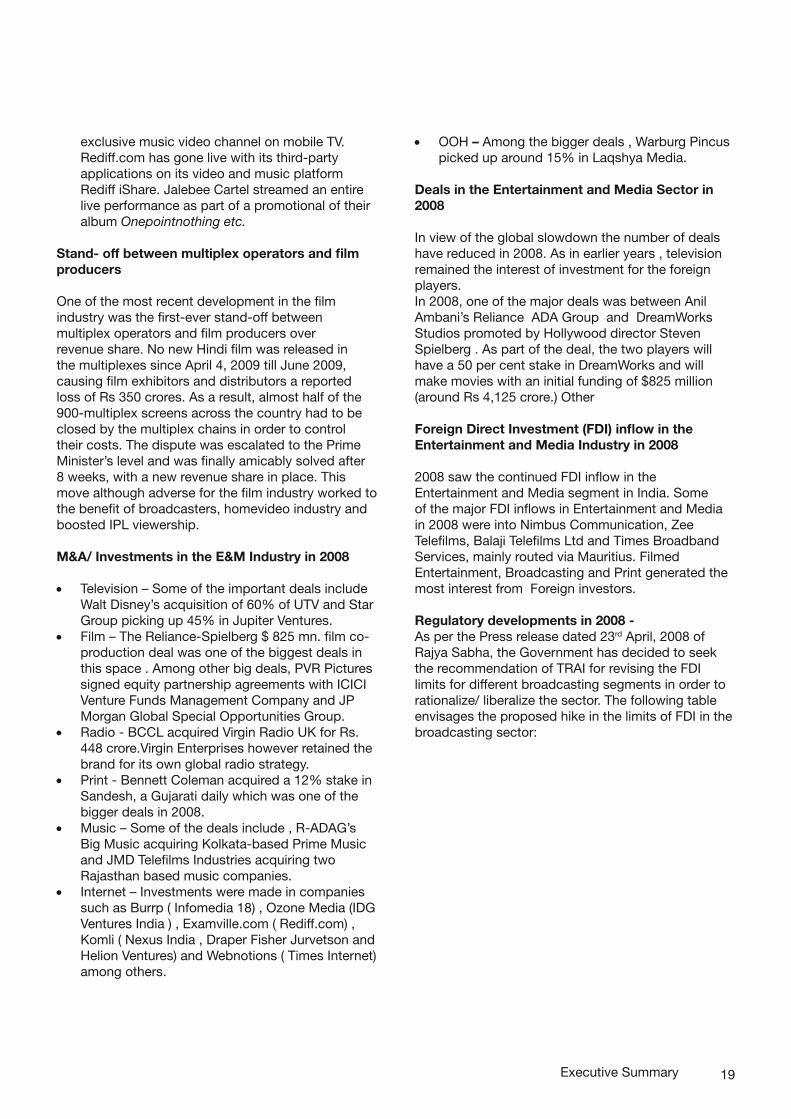
exclusive music video channel on mobile TV. Rediff.com has gone live with its third-party applications on its video and music platform Rediff iShare. Jalebee Cartel streamed an entire live performance as part of a promotional of their album Onepointnothing etc.
Stand- off between multiplex operators and film producers
One of the most recent development in the film industry was the first-ever stand-off between multiplex operators and film producers over revenue share. No new Hindi film was released in the multiplexes since April 4, 2009 till June 2009, causing film exhibitors and distributors a reported loss of Rs 350 crores. As a result, almost half of the 900-multiplex screens across the country had to be closed by the multiplex chains in order to control their costs. The dispute was escalated to the Prime Minister’s level and was finally amicably solved after 8 weeks, with a new revenue share in place. This move although adverse for the film industry worked to the benefit of broadcasters, homevideo industry and boosted IPL viewership.
M&A/ Investments in the E&M Industry in 2008
• Television – Some of the important deals include Walt Disney’s acquisition of 60% of UTV and Star Group picking up 45% in Jupiter Ventures.
• Film – The Reliance-Spielberg $ 825 mn. film co-production deal was one of the biggest deals in this space . Among other big deals, PVR Pictures signed equity partnership agreements with ICICI Venture Funds Management Company and JP Morgan Global Special Opportunities Group.
• Radio - BCCL acquired Virgin Radio UK for Rs. 448 crore.Virgin Enterprises however retained the brand for its own global radio strategy.
• Print - Bennett Coleman acquired a 12% stake in Sandesh, a Gujarati daily which was one of the bigger deals in 2008.
• Music – Some of the deals include , R-ADAG’s Big Music acquiring Kolkata-based Prime Music and JMD Telefilms Industries acquiring two Rajasthan based music companies.
• Internet – Investments were made in companies such as Burrp ( Infomedia 18) , Ozone Media (IDG Ventures India ) , Examville.com ( Rediff.com) , Komli ( Nexus India , Draper Fisher Jurvetson and Helion Ventures) and Webnotions ( Times Internet) among others.
• OOH – Among the bigger deals , Warburg Pincus picked up around 15% in Laqshya Media.
Deals in the Entertainment and Media Sector in 2008
In view of the global slowdown the number of deals have reduced in 2008. As in earlier years , television remained the interest of investment for the foreign players.In 2008, one of the major deals was between Anil Ambani’s Reliance ADA Group and DreamWorks Studios promoted by Hollywood director Steven Spielberg . As part of the deal, the two players will have a 50 per cent stake in DreamWorks and will make movies with an initial funding of $825 million (around Rs 4,125 crore.) Other
Foreign Direct Investment (FDI) inflow in the Entertainment and Media Industry in 2008
2008 saw the continued FDI inflow in the Entertainment and Media segment in India. Some of the major FDI inflows in Entertainment and Media in 2008 were into Nimbus Communication, Zee Telefilms, Balaji Telefilms Ltd and Times Broadband Services, mainly routed via Mauritius. Filmed Entertainment, Broadcasting and Print generated the most interest from Foreign investors.
Regulatory developments in 2008 - As per the Press release dated 23rd April, 2008 of Rajya Sabha, the Government has decided to seek the recommendation of TRAI for revising the FDI limits for different broadcasting segments in order to rationalize/ liberalize the sector. The following table envisages the proposed hike in the limits of FDI in the broadcasting sector:
Executive Summary
20
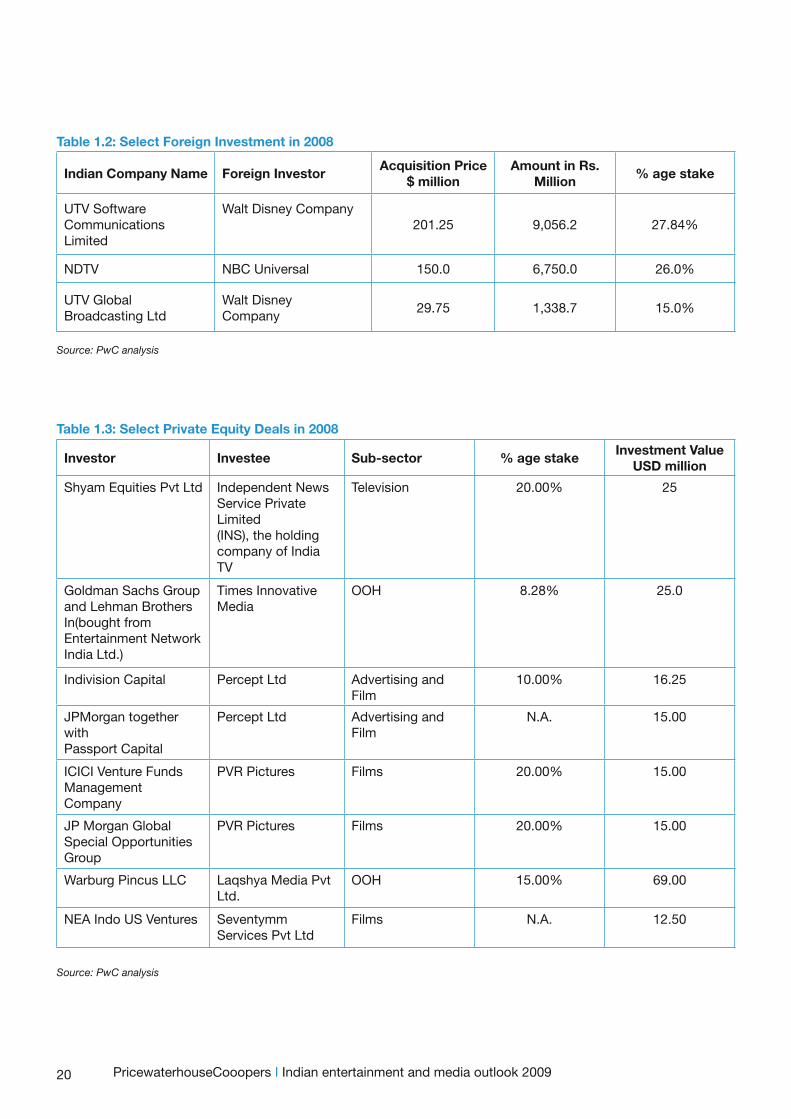
Table 1.2: Select Foreign Investment in 2008
Indian Company Name Foreign InvestorAcquisition Price
$ millionAmount in Rs.
Million% age stake
UTV Software Communications Limited
Walt Disney Company201.25 9,056.2 27.84%
NDTV NBC Universal 150.0 6,750.0 26.0%
UTV GlobalBroadcasting Ltd
Walt DisneyCompany
29.75 1,338.7 15.0%
Source: PwC analysis
Table 1.3: Select Private Equity Deals in 2008
Investor Investee Sub-sector % age stakeInvestment Value
USD million
Shyam Equities Pvt Ltd Independent NewsService Private Limited(INS), the holdingcompany of India TV
Television 20.00% 25
Goldman Sachs Group and Lehman Brothers In(bought fromEntertainment NetworkIndia Ltd.)
Times InnovativeMedia
OOH 8.28% 25.0
Indivision Capital Percept Ltd Advertising and Film
10.00% 16.25
JPMorgan together withPassport Capital
Percept Ltd Advertising and Film
N.A. 15.00
ICICI Venture FundsManagement Company
PVR Pictures Films 20.00% 15.00
JP Morgan GlobalSpecial OpportunitiesGroup
PVR Pictures Films 20.00% 15.00
Warburg Pincus LLC Laqshya Media PvtLtd.
OOH 15.00% 69.00
NEA Indo US Ventures Seventymm Services Pvt Ltd
Films N.A. 12.50
Source: PwC analysis
PricewaterhouseCooopers I Indian entertainment and media outlook 2009
21
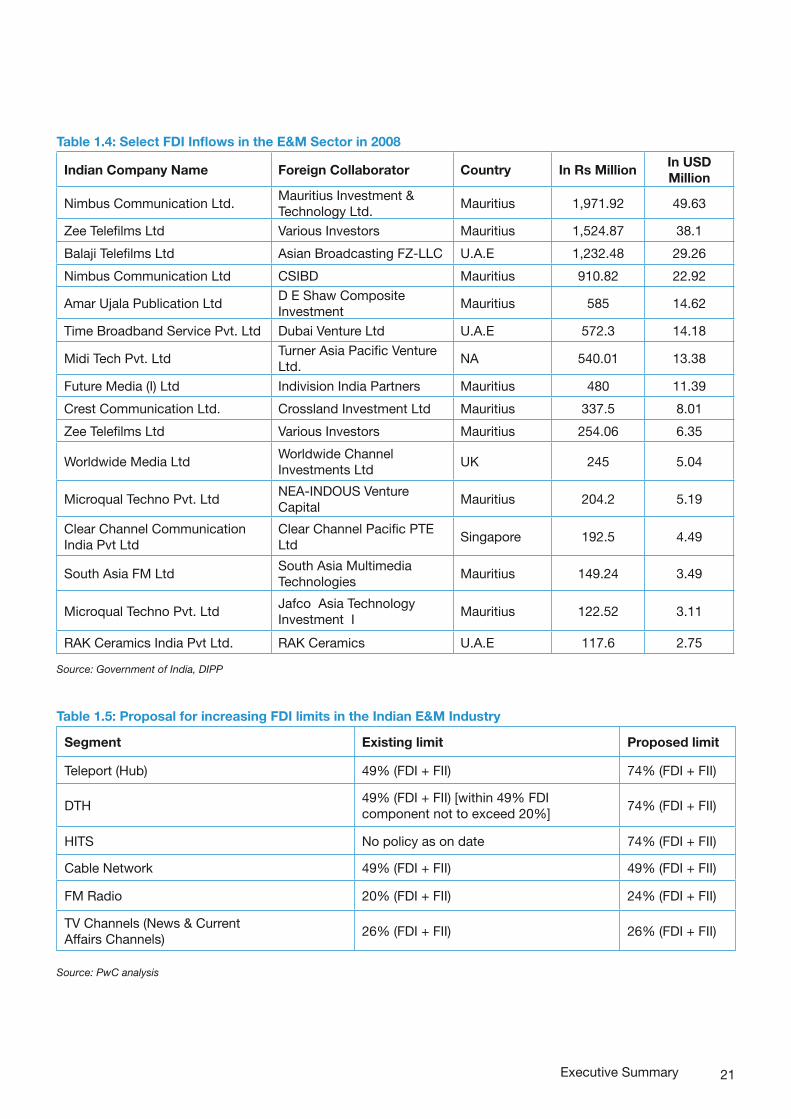
Table 1.4: Select FDI Inflows in the E&M Sector in 2008
Indian Company Name Foreign Collaborator Country In Rs MillionIn USD Million
Nimbus Communication Ltd.Mauritius Investment & Technology Ltd.
Mauritius 1,971.92 49.63
Zee Telefilms Ltd Various Investors Mauritius 1,524.87 38.1
Balaji Telefilms Ltd Asian Broadcasting FZ-LLC U.A.E 1,232.48 29.26
Nimbus Communication Ltd CSIBD Mauritius 910.82 22.92
Amar Ujala Publication LtdD E Shaw Composite Investment
Mauritius 585 14.62
Time Broadband Service Pvt. Ltd Dubai Venture Ltd U.A.E 572.3 14.18
Midi Tech Pvt. LtdTurner Asia Pacific Venture Ltd.
NA 540.01 13.38
Future Media (I) Ltd Indivision India Partners Mauritius 480 11.39
Crest Communication Ltd. Crossland Investment Ltd Mauritius 337.5 8.01
Zee Telefilms Ltd Various Investors Mauritius 254.06 6.35
Worldwide Media LtdWorldwide Channel Investments Ltd
UK 245 5.04
Microqual Techno Pvt. LtdNEA-INDOUS Venture Capital
Mauritius 204.2 5.19
Clear Channel Communication India Pvt Ltd
Clear Channel Pacific PTE Ltd
Singapore 192.5 4.49
South Asia FM LtdSouth Asia Multimedia Technologies
Mauritius 149.24 3.49
Microqual Techno Pvt. LtdJafco Asia Technology Investment I
Mauritius 122.52 3.11
RAK Ceramics India Pvt Ltd. RAK Ceramics U.A.E 117.6 2.75
Source: Government of India, DIPP
Table 1.5: Proposal for increasing FDI limits in the Indian E&M Industry
Segment Existing limit Proposed limit
Teleport (Hub) 49% (FDI + FII) 74% (FDI + FII)
DTH49% (FDI + FII) [within 49% FDI component not to exceed 20%]
74% (FDI + FII)
HITS No policy as on date 74% (FDI + FII)
Cable Network 49% (FDI + FII) 49% (FDI + FII)
FM Radio 20% (FDI + FII) 24% (FDI + FII)
TV Channels (News & Current Affairs Channels)
26% (FDI + FII) 26% (FDI + FII)
Source: PwC analysis
Executive Summary
22
Key developments in the Global E&M Industry in 2008
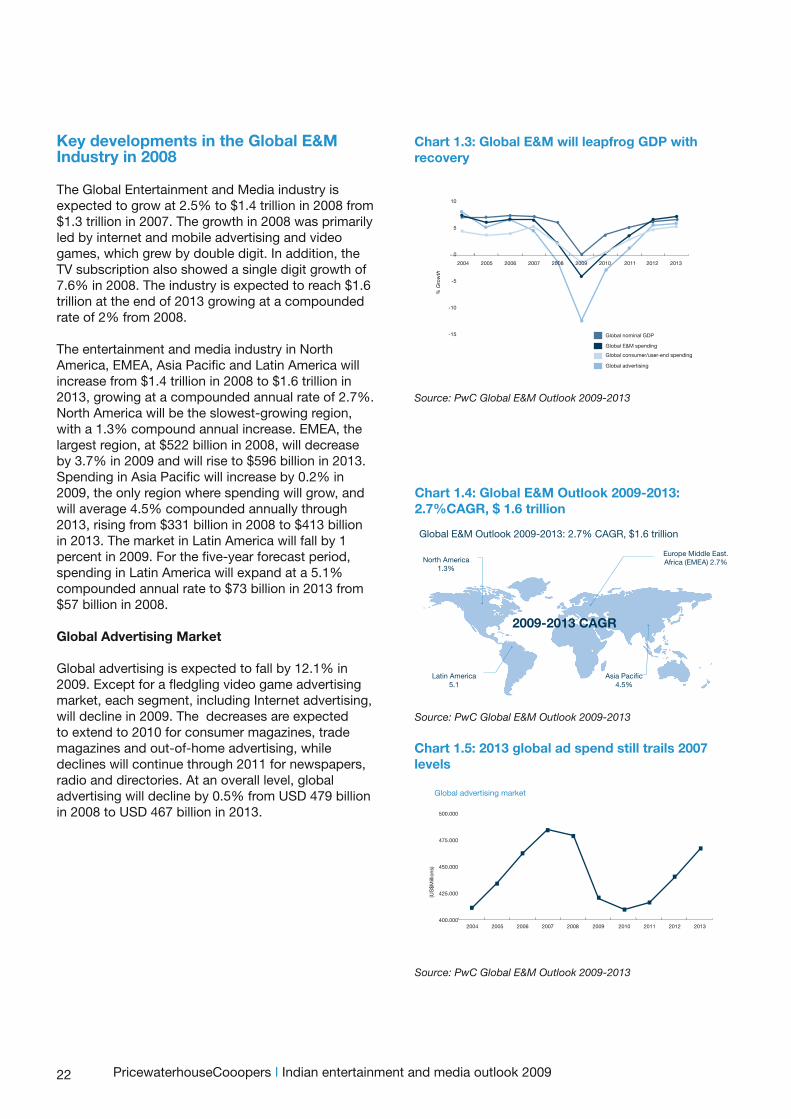
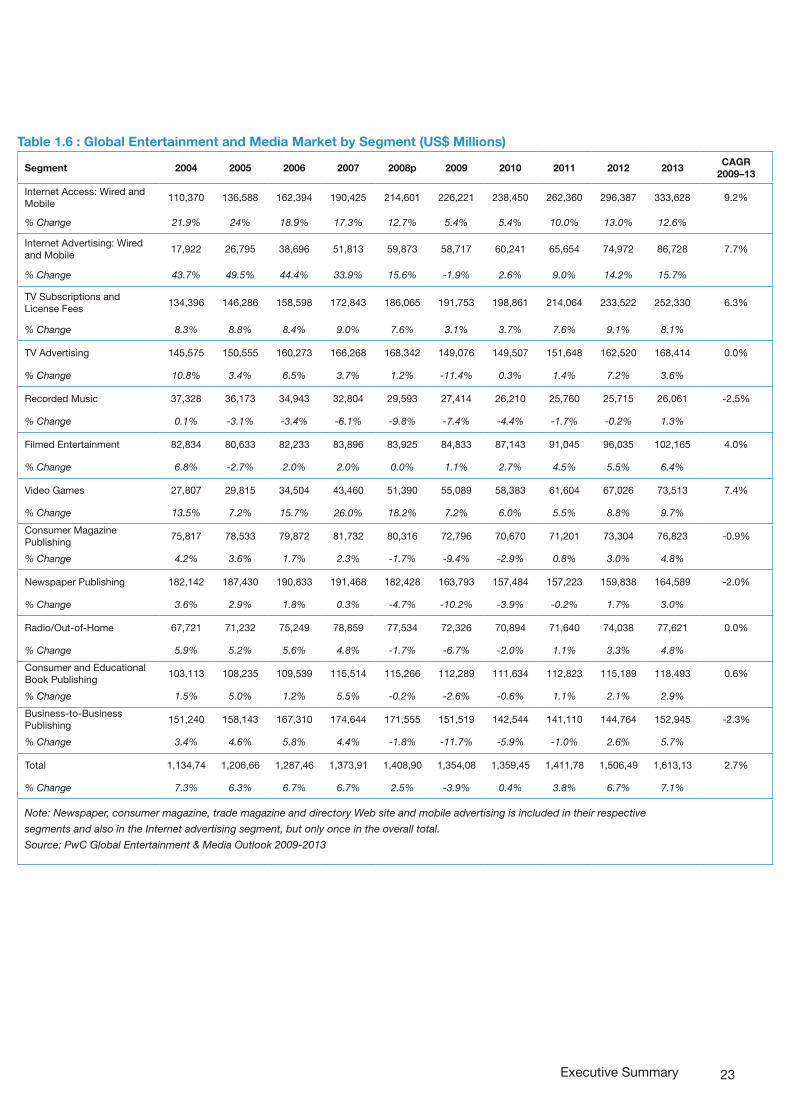
The Global Entertainment and Media industry is expected to grow at 2.5% to $1.4 trillion in 2008 from $1.3 trillion in 2007. The growth in 2008 was primarily led by internet and mobile advertising and video games, which grew by double digit. In addition, the TV subscription also showed a single digit growth of 7.6% in 2008. The industry is expected to reach $1.6 trillion at the end of 2013 growing at a compounded rate of 2% from 2008.
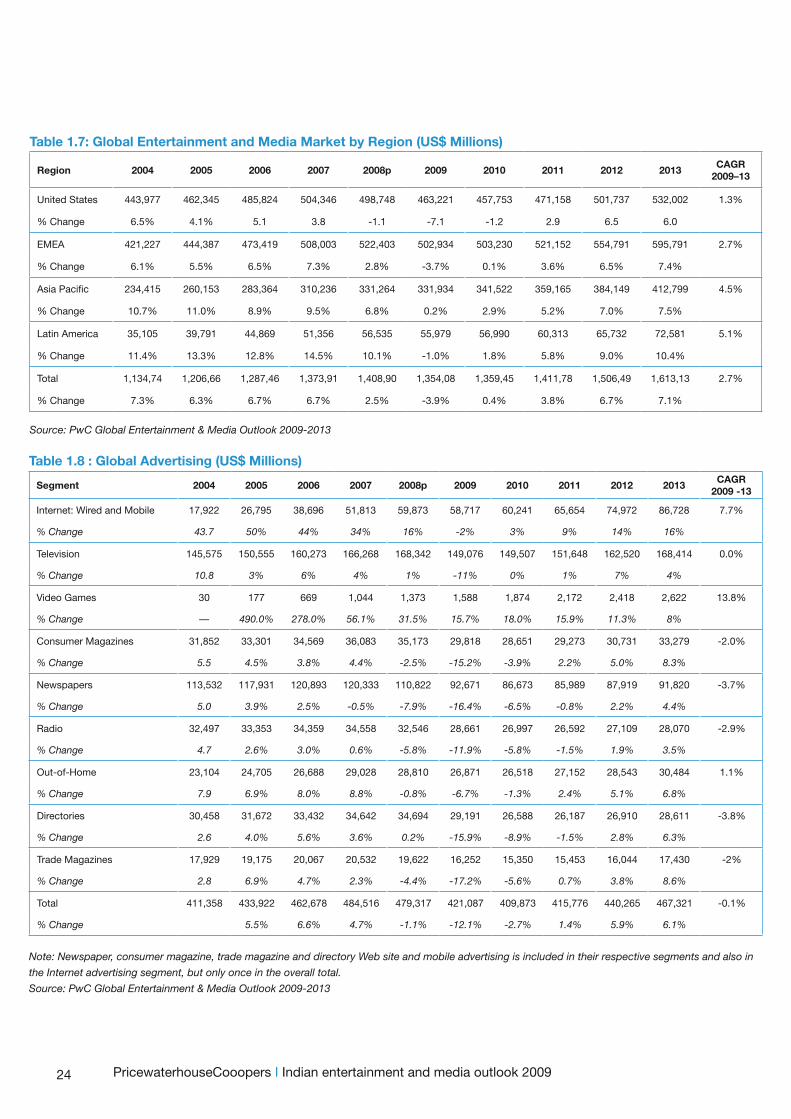
The entertainment and media industry in North America, EMEA, Asia Pacific and Latin America will increase from $1.4 trillion in 2008 to $1.6 trillion in 2013, growing at a compounded annual rate of 2.7%. North America will be the slowest-growing region, with a 1.3% compound annual increase. EMEA, the largest region, at $522 billion in 2008, will decrease by 3.7% in 2009 and will rise to $596 billion in 2013. Spending in Asia Pacific will increase by 0.2% in 2009, the only region where spending will grow, and will average 4.5% compounded annually through 2013, rising from $331 billion in 2008 to $413 billion in 2013. The market in Latin America will fall by 1 percent in 2009. For the five-year forecast period, spending in Latin America will expand at a 5.1% compounded annual rate to $73 billion in 2013 from $57 billion in 2008.
Global Advertising Market
Global advertising is expected to fall by 12.1% in 2009. Except for a fledgling video game advertising market, each segment, including Internet advertising, will decline in 2009. The decreases are expected to extend to 2010 for consumer magazines, trade magazines and out-of-home advertising, while declines will continue through 2011 for newspapers, radio and directories. At an overall level, global advertising will decline by 0.5% from USD 479 billion in 2008 to USD 467 billion in 2013.
Chart 1.4: Global E&M Outlook 2009-2013: 2.7%CAGR, $ 1.6 trillion
Source: PwC Global E&M Outlook 2009-2013
Global E&M Outlook 2009-2013: 2.7% CAGR, $1.6 trillion
North America1.3%
Europe Middle East.Africa (EMEA) 2.7%
Asia Pacific4.5%
Latin America5.1
2009-2013 CAGR
Chart 1.3: Global E&M will leapfrog GDP with recovery
Source: PwC Global E&M Outlook 2009-2013
% G
row
th
2004 2005 2006 2007 2008 2009 2010 2011 2012 2013
Global nominal GDP
Global E&M spending
Global advertising
Global consumer/user-end spending
10
5
0
-5
-10
-15
Chart 1.5: 2013 global ad spend still trails 2007 levels
Source: PwC Global E&M Outlook 2009-2013
2004 2005 2006 2007 2008 2009 2010 2011 2012 2013
Global advertising market
(US
$Mill
ions
)
500.000
475.000
450.000
425.000
400.000
PricewaterhouseCooopers I Indian entertainment and media outlook 2009
23
Table 1.6 : Global Entertainment and Media Market by Segment (US$ Millions)
Segment 2004 2005 2006 2007 2008p 2009 2010 2011 2012 2013CAGR
2009–13
Internet Access: Wired and Mobile
110,370 136,588 162,394 190,425 214,601 226,221 238,450 262,360 296,387 333,628 9.2%
% Change 21.9% 24% 18.9% 17.3% 12.7% 5.4% 5.4% 10.0% 13.0% 12.6%
Internet Advertising: Wired and Mobile
17,922 26,795 38,696 51,813 59,873 58,717 60,241 65,654 74,972 86,728 7.7%
% Change 43.7% 49.5% 44.4% 33.9% 15.6% -1.9% 2.6% 9.0% 14.2% 15.7%
TV Subscriptions and License Fees
134,396 146,286 158,598 172,843 186,065 191,753 198,861 214,064 233,522 252,330 6.3%
% Change 8.3% 8.8% 8.4% 9.0% 7.6% 3.1% 3.7% 7.6% 9.1% 8.1%
TV Advertising 145,575 150,555 160,273 166,268 168,342 149,076 149,507 151,648 162,520 168,414 0.0%
% Change 10.8% 3.4% 6.5% 3.7% 1.2% -11.4% 0.3% 1.4% 7.2% 3.6%
Recorded Music 37,328 36,173 34,943 32,804 29,593 27,414 26,210 25,760 25,715 26,061 -2.5%
% Change 0.1% -3.1% -3.4% -6.1% -9.8% -7.4% -4.4% -1.7% -0.2% 1.3%
Filmed Entertainment 82,834 80,633 82,233 83,896 83,925 84,833 87,143 91,045 96,035 102,165 4.0%
% Change 6.8% -2.7% 2.0% 2.0% 0.0% 1.1% 2.7% 4.5% 5.5% 6.4%
Video Games 27,807 29,815 34,504 43,460 51,390 55,089 58,383 61,604 67,026 73,513 7.4%
% Change 13.5% 7.2% 15.7% 26.0% 18.2% 7.2% 6.0% 5.5% 8.8% 9.7%
Consumer Magazine Publishing
75,817 78,533 79,872 81,732 80,316 72,796 70,670 71,201 73,304 76,823 -0.9%
% Change 4.2% 3.6% 1.7% 2.3% -1.7% -9.4% -2.9% 0.8% 3.0% 4.8%
Newspaper Publishing 182,142 187,430 190,833 191,468 182,428 163,793 157,484 157,223 159,838 164,589 -2.0%
% Change 3.6% 2.9% 1.8% 0.3% -4.7% -10.2% -3.9% -0.2% 1.7% 3.0%
Radio/Out-of-Home 67,721 71,232 75,249 78,859 77,534 72,326 70,894 71,640 74,038 77,621 0.0%
% Change 5.9% 5.2% 5.6% 4.8% -1.7% -6.7% -2.0% 1.1% 3.3% 4.8%
Consumer and Educational Book Publishing
103,113 108,235 109,539 115,514 115,266 112,289 111,634 112,823 115,189 118,493 0.6%
% Change 1.5% 5.0% 1.2% 5.5% -0.2% -2.6% -0.6% 1.1% 2.1% 2.9%
Business-to-Business Publishing
151,240 158,143 167,310 174,644 171,555 151,519 142,544 141,110 144,764 152,945 -2.3%
% Change 3.4% 4.6% 5.8% 4.4% -1.8% -11.7% -5.9% -1.0% 2.6% 5.7%
Total 1,134,74 1,206,66 1,287,46 1,373,91 1,408,90 1,354,08 1,359,45 1,411,78 1,506,49 1,613,13 2.7%
% Change 7.3% 6.3% 6.7% 6.7% 2.5% -3.9% 0.4% 3.8% 6.7% 7.1%
Note: Newspaper, consumer magazine, trade magazine and directory Web site and mobile advertising is included in their respective
segments and also in the Internet advertising segment, but only once in the overall total.
Source: PwC Global Entertainment & Media Outlook 2009-2013
Executive Summary
24 PricewaterhouseCooopers I Indian entertainment and media outlook 2009
Table 1.7: Global Entertainment and Media Market by Region (US$ Millions)
Region 2004 2005 2006 2007 2008p 2009 2010 2011 2012 2013CAGR
2009–13
United States 443,977 462,345 485,824 504,346 498,748 463,221 457,753 471,158 501,737 532,002 1.3%
% Change 6.5% 4.1% 5.1 3.8 -1.1 -7.1 -1.2 2.9 6.5 6.0
EMEA 421,227 444,387 473,419 508,003 522,403 502,934 503,230 521,152 554,791 595,791 2.7%
% Change 6.1% 5.5% 6.5% 7.3% 2.8% -3.7% 0.1% 3.6% 6.5% 7.4%
Asia Pacific 234,415 260,153 283,364 310,236 331,264 331,934 341,522 359,165 384,149 412,799 4.5%
% Change 10.7% 11.0% 8.9% 9.5% 6.8% 0.2% 2.9% 5.2% 7.0% 7.5%
Latin America 35,105 39,791 44,869 51,356 56,535 55,979 56,990 60,313 65,732 72,581 5.1%
% Change 11.4% 13.3% 12.8% 14.5% 10.1% -1.0% 1.8% 5.8% 9.0% 10.4%
Total 1,134,74 1,206,66 1,287,46 1,373,91 1,408,90 1,354,08 1,359,45 1,411,78 1,506,49 1,613,13 2.7%
% Change 7.3% 6.3% 6.7% 6.7% 2.5% -3.9% 0.4% 3.8% 6.7% 7.1%
Source: PwC Global Entertainment & Media Outlook 2009-2013
Table 1.8 : Global Advertising (US$ Millions)
Segment 2004 2005 2006 2007 2008p 2009 2010 2011 2012 2013CAGR
2009 -13
Internet: Wired and Mobile 17,922 26,795 38,696 51,813 59,873 58,717 60,241 65,654 74,972 86,728 7.7%
% Change 43.7 50% 44% 34% 16% -2% 3% 9% 14% 16%
Television 145,575 150,555 160,273 166,268 168,342 149,076 149,507 151,648 162,520 168,414 0.0%
% Change 10.8 3% 6% 4% 1% -11% 0% 1% 7% 4%
Video Games 30 177 669 1,044 1,373 1,588 1,874 2,172 2,418 2,622 13.8%
% Change — 490.0% 278.0% 56.1% 31.5% 15.7% 18.0% 15.9% 11.3% 8%
Consumer Magazines 31,852 33,301 34,569 36,083 35,173 29,818 28,651 29,273 30,731 33,279 -2.0%
% Change 5.5 4.5% 3.8% 4.4% -2.5% -15.2% -3.9% 2.2% 5.0% 8.3%
Newspapers 113,532 117,931 120,893 120,333 110,822 92,671 86,673 85,989 87,919 91,820 -3.7%
% Change 5.0 3.9% 2.5% -0.5% -7.9% -16.4% -6.5% -0.8% 2.2% 4.4%
Radio 32,497 33,353 34,359 34,558 32,546 28,661 26,997 26,592 27,109 28,070 -2.9%
% Change 4.7 2.6% 3.0% 0.6% -5.8% -11.9% -5.8% -1.5% 1.9% 3.5%
Out-of-Home 23,104 24,705 26,688 29,028 28,810 26,871 26,518 27,152 28,543 30,484 1.1%
% Change 7.9 6.9% 8.0% 8.8% -0.8% -6.7% -1.3% 2.4% 5.1% 6.8%
Directories 30,458 31,672 33,432 34,642 34,694 29,191 26,588 26,187 26,910 28,611 -3.8%
% Change 2.6 4.0% 5.6% 3.6% 0.2% -15.9% -8.9% -1.5% 2.8% 6.3%
Trade Magazines 17,929 19,175 20,067 20,532 19,622 16,252 15,350 15,453 16,044 17,430 -2%
% Change 2.8 6.9% 4.7% 2.3% -4.4% -17.2% -5.6% 0.7% 3.8% 8.6%
Total 411,358 433,922 462,678 484,516 479,317 421,087 409,873 415,776 440,265 467,321 -0.1%
% Change 5.5% 6.6% 4.7% -1.1% -12.1% -2.7% 1.4% 5.9% 6.1%
Note: Newspaper, consumer magazine, trade magazine and directory Web site and mobile advertising is included in their respective segments and also in
the Internet advertising segment, but only once in the overall total.
Source: PwC Global Entertainment & Media Outlook 2009-2013
25
Entertainment and Media Market in BRIC Countries
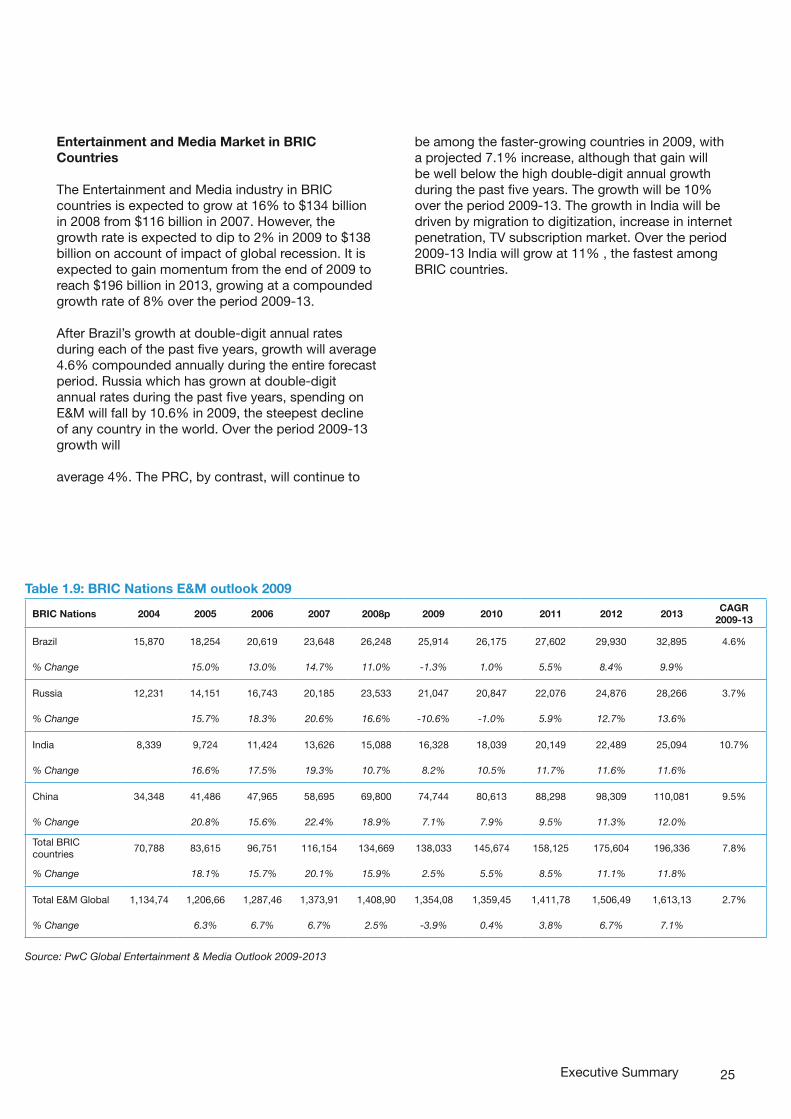
The Entertainment and Media industry in BRIC countries is expected to grow at 16% to $134 billion in 2008 from $116 billion in 2007. However, the growth rate is expected to dip to 2% in 2009 to $138 billion on account of impact of global recession. It is expected to gain momentum from the end of 2009 to reach $196 billion in 2013, growing at a compounded growth rate of 8% over the period 2009-13.
After Brazil’s growth at double-digit annual rates during each of the past five years, growth will average 4.6% compounded annually during the entire forecast period. Russia which has grown at double-digit annual rates during the past five years, spending on E&M will fall by 10.6% in 2009, the steepest decline of any country in the world. Over the period 2009-13 growth will
average 4%. The PRC, by contrast, will continue to
Executive Summary
Table 1.9: BRIC Nations E&M outlook 2009
BRIC Nations 2004 2005 2006 2007 2008p 2009 2010 2011 2012 2013CAGR
2009-13
Brazil 15,870 18,254 20,619 23,648 26,248 25,914 26,175 27,602 29,930 32,895 4.6%
% Change 15.0% 13.0% 14.7% 11.0% -1.3% 1.0% 5.5% 8.4% 9.9%
Russia 12,231 14,151 16,743 20,185 23,533 21,047 20,847 22,076 24,876 28,266 3.7%
% Change 15.7% 18.3% 20.6% 16.6% -10.6% -1.0% 5.9% 12.7% 13.6%
India 8,339 9,724 11,424 13,626 15,088 16,328 18,039 20,149 22,489 25,094 10.7%
% Change 16.6% 17.5% 19.3% 10.7% 8.2% 10.5% 11.7% 11.6% 11.6%
China 34,348 41,486 47,965 58,695 69,800 74,744 80,613 88,298 98,309 110,081 9.5%
% Change 20.8% 15.6% 22.4% 18.9% 7.1% 7.9% 9.5% 11.3% 12.0%
Total BRIC countries
70,788 83,615 96,751 116,154 134,669 138,033 145,674 158,125 175,604 196,336 7.8%
% Change 18.1% 15.7% 20.1% 15.9% 2.5% 5.5% 8.5% 11.1% 11.8%
Total E&M Global 1,134,74 1,206,66 1,287,46 1,373,91 1,408,90 1,354,08 1,359,45 1,411,78 1,506,49 1,613,13 2.7%
% Change 6.3% 6.7% 6.7% 2.5% -3.9% 0.4% 3.8% 6.7% 7.1%
Source: PwC Global Entertainment & Media Outlook 2009-2013
be among the faster-growing countries in 2009, with a projected 7.1% increase, although that gain will be well below the high double-digit annual growth during the past five years. The growth will be 10% over the period 2009-13. The growth in India will be driven by migration to digitization, increase in internet penetration, TV subscription market. Over the period 2009-13 India will grow at 11% , the fastest among BRIC countries.
26
Outlook for the Indian E&M Industry 2009-2013
The Indian E&M industry is estimated to grow from Rs. 563.9 billion in 2008, at a CAGR of 10.5% for the next 5 years to reach Rs. 929.5 billion in 2013. Television industry is projected to continue to be the major contributor to the overall industry revenue pie and is estimated to grow at a stable rate of 11.4% cumulatively over the next 5 years, from an estimated Rs. 244.7 billion in 2008. The overall television industry is projected to reach Rs. 420.0 billion by 2013. In the Television pie, television distribution is projected to garner a share of 60% in 2013. On the other hand, television advertising industry is projected to command a share of 41.0% in 2013, having increased from a present share of 39.0% in the total ad industry pie. The relative share of the television content industry is expected to remain constant at 4%.
The Indian film industry is projected to grow at a CAGR of 11.6% over the next five years, reaching to Rs. 185 billion in 2013 from the present Rs. 107 billion in 2008. The relative shares of the film industry are expected to shift marginally from the traditional revenues to the new emerging revenues.
The Indian print media industry is projected to grow by 5.6% over the period 2009-13, reaching to Rs. 213 billion in 2013 from the present Rs. 162 billion in 2008. The relative shares of newspaper publishing and magazine publishing are not expected to change significantly and are expected to remain the same at around 87% in favour of newspaper publishing. Magazine publishing is expected to grow at a higher rate of 6.5% as compared with newspaper publishing which is expected to grow at 5.6% for the next 5 years. The Indian radio advertising industry is projected to grow at a CAGR of 18% over 2009-13, reaching Rs. 19 billion in 2013 from the present Rs. 8.3 billion in 2008; more than double its present size. In terms of share of ad pie, it is projected that the radio advertising industry will be able to increase its share from 3.8% to 5.2% in the next five years.
The animation, gaming and VFX industry will continue to maintain its growth pace and is projected to grow at a CAGR of 22% to Rs. 42.5 billion in 2013 from its current size of Rs. 15.6 billion. In the animation space, domestic demand will create the fillip in its growth, as well as contribution from international co-productions, in the film and television space. The
Indian gaming industry is projected to grow from an estimated size of Rs. 3.9 billion in 2008 to an estimated Rs. 16.3 billion by 2013; translating into a cumulative growth of 32.7% over the next five years. Mobile gaming will dominate the segment with 74 % share, driven by the growth in the high-end segment of the mobile users, new content by mobile operators and the availability of 3G spectrum that enables easy of play. Online gaming will be the next highest contributor followed by console gaming. This will be fuelled by the growth of internet users and especially the growth of the target segment of users aged between 15-34 years. The growth in console gaming will also be aided by falling cost of console prices and availability of local games.
Given the trends of increased internet usage, internet advertising is projected to grow by 32% over the next five years and reach an estimated Rs. 20 billion in 2013 from the present Rs. 5 billion in 2008. The share of the online advertising too is projected to grow from 2.3% in 2008 to 5.5% in 2013 of the overall advertising pie.
The estimated size of the OOH industry is Rs 15 billion in 2008, which is projected to become almost twice its current size in 2013 (i.e., Rs 25 billion). Its share in the total ad pie is expected to go down marginally to 6.8% in 2013 from a current level of 6.9% in 2008.
The key growth driver for the music industry over the next five years will be digital music, and its share is expected to move from 16% in 2008 to 60% in 2013. Within digital music, mobile music will continue to increase its share and maintain its dominance.
PricewaterhouseCooopers I Indian entertainment and media outlook 2009
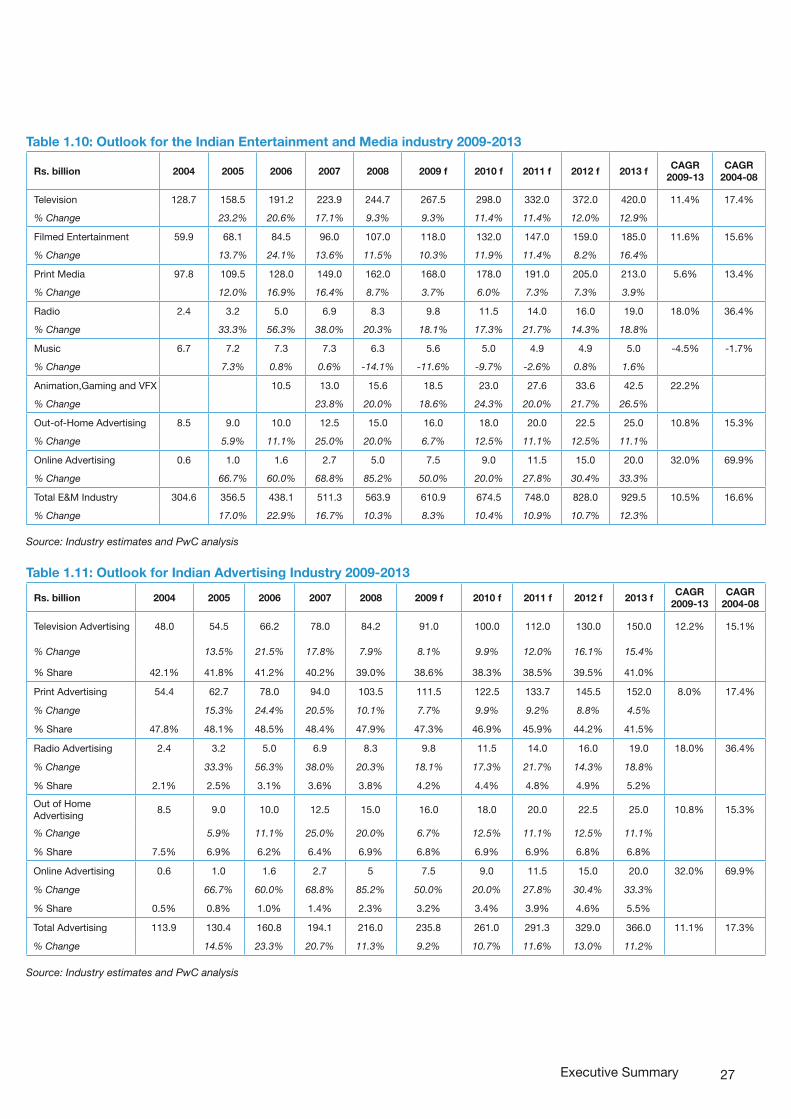
27
Table 1.10: Outlook for the Indian Entertainment and Media industry 2009-2013
Rs. billion 2004 2005 2006 2007 2008 2009 f 2010 f 2011 f 2012 f 2013 fCAGR
2009-13CAGR
2004-08
Television 128.7 158.5 191.2 223.9 244.7 267.5 298.0 332.0 372.0 420.0 11.4% 17.4%
% Change 23.2% 20.6% 17.1% 9.3% 9.3% 11.4% 11.4% 12.0% 12.9%
Filmed Entertainment 59.9 68.1 84.5 96.0 107.0 118.0 132.0 147.0 159.0 185.0 11.6% 15.6%
% Change 13.7% 24.1% 13.6% 11.5% 10.3% 11.9% 11.4% 8.2% 16.4%
Print Media 97.8 109.5 128.0 149.0 162.0 168.0 178.0 191.0 205.0 213.0 5.6% 13.4%
% Change 12.0% 16.9% 16.4% 8.7% 3.7% 6.0% 7.3% 7.3% 3.9%
Radio 2.4 3.2 5.0 6.9 8.3 9.8 11.5 14.0 16.0 19.0 18.0% 36.4%
% Change 33.3% 56.3% 38.0% 20.3% 18.1% 17.3% 21.7% 14.3% 18.8%
Music 6.7 7.2 7.3 7.3 6.3 5.6 5.0 4.9 4.9 5.0 -4.5% -1.7%
% Change 7.3% 0.8% 0.6% -14.1% -11.6% -9.7% -2.6% 0.8% 1.6%
Animation,Gaming and VFX 10.5 13.0 15.6 18.5 23.0 27.6 33.6 42.5 22.2%
% Change 23.8% 20.0% 18.6% 24.3% 20.0% 21.7% 26.5%
Out-of-Home Advertising 8.5 9.0 10.0 12.5 15.0 16.0 18.0 20.0 22.5 25.0 10.8% 15.3%
% Change 5.9% 11.1% 25.0% 20.0% 6.7% 12.5% 11.1% 12.5% 11.1%
Online Advertising 0.6 1.0 1.6 2.7 5.0 7.5 9.0 11.5 15.0 20.0 32.0% 69.9%
% Change 66.7% 60.0% 68.8% 85.2% 50.0% 20.0% 27.8% 30.4% 33.3%
Total E&M Industry 304.6 356.5 438.1 511.3 563.9 610.9 674.5 748.0 828.0 929.5 10.5% 16.6%
% Change 17.0% 22.9% 16.7% 10.3% 8.3% 10.4% 10.9% 10.7% 12.3%
Source: Industry estimates and PwC analysis
Table 1.11: Outlook for Indian Advertising Industry 2009-2013
Rs. billion 2004 2005 2006 2007 2008 2009 f 2010 f 2011 f 2012 f 2013 fCAGR
2009-13CAGR
2004-08
Television Advertising 48.0 54.5 66.2 78.0 84.2 91.0 100.0 112.0 130.0 150.0 12.2% 15.1%
% Change 13.5% 21.5% 17.8% 7.9% 8.1% 9.9% 12.0% 16.1% 15.4%
% Share 42.1% 41.8% 41.2% 40.2% 39.0% 38.6% 38.3% 38.5% 39.5% 41.0%
Print Advertising 54.4 62.7 78.0 94.0 103.5 111.5 122.5 133.7 145.5 152.0 8.0% 17.4%
% Change 15.3% 24.4% 20.5% 10.1% 7.7% 9.9% 9.2% 8.8% 4.5%
% Share 47.8% 48.1% 48.5% 48.4% 47.9% 47.3% 46.9% 45.9% 44.2% 41.5%
Radio Advertising 2.4 3.2 5.0 6.9 8.3 9.8 11.5 14.0 16.0 19.0 18.0% 36.4%
% Change 33.3% 56.3% 38.0% 20.3% 18.1% 17.3% 21.7% 14.3% 18.8%
% Share 2.1% 2.5% 3.1% 3.6% 3.8% 4.2% 4.4% 4.8% 4.9% 5.2%
Out of Home Advertising
8.5 9.0 10.0 12.5 15.0 16.0 18.0 20.0 22.5 25.0 10.8% 15.3%
% Change 5.9% 11.1% 25.0% 20.0% 6.7% 12.5% 11.1% 12.5% 11.1%
% Share 7.5% 6.9% 6.2% 6.4% 6.9% 6.8% 6.9% 6.9% 6.8% 6.8%
Online Advertising 0.6 1.0 1.6 2.7 5 7.5 9.0 11.5 15.0 20.0 32.0% 69.9%
% Change 66.7% 60.0% 68.8% 85.2% 50.0% 20.0% 27.8% 30.4% 33.3%
% Share 0.5% 0.8% 1.0% 1.4% 2.3% 3.2% 3.4% 3.9% 4.6% 5.5%
Total Advertising 113.9 130.4 160.8 194.1 216.0 235.8 261.0 291.3 329.0 366.0 11.1% 17.3%
% Change 14.5% 23.3% 20.7% 11.3% 9.2% 10.7% 11.6% 13.0% 11.2%
Source: Industry estimates and PwC analysis
Executive Summary
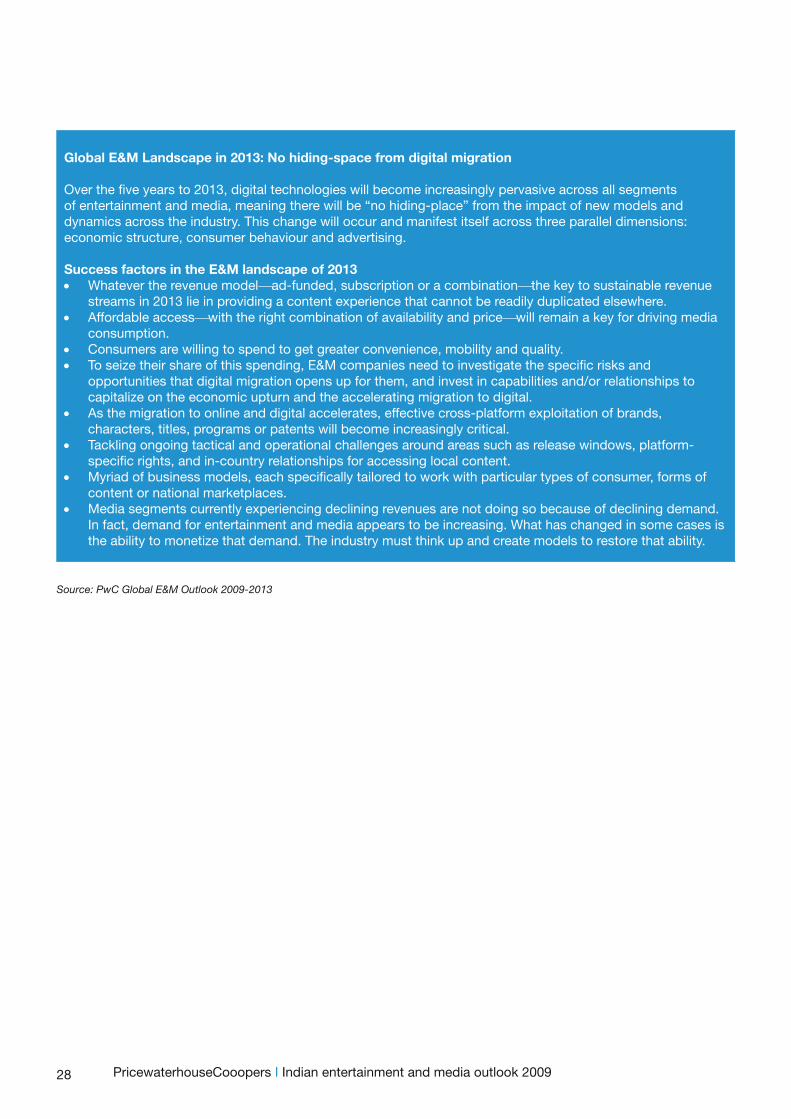
28 PricewaterhouseCooopers I Indian entertainment and media outlook 2009
Global E&M Landscape in 2013: No hiding-space from digital migration
Over the five years to 2013, digital technologies will become increasingly pervasive across all segments of entertainment and media, meaning there will be “no hiding-place” from the impact of new models and dynamics across the industry. This change will occur and manifest itself across three parallel dimensions: economic structure, consumer behaviour and advertising.
Success factors in the E&M landscape of 2013 • Whatever the revenue modelad-funded, subscription or a combinationthe key to sustainable revenue
streams in 2013 lie in providing a content experience that cannot be readily duplicated elsewhere. • Affordable accesswith the right combination of availability and pricewill remain a key for driving media
consumption. • Consumers are willing to spend to get greater convenience, mobility and quality. • To seize their share of this spending, E&M companies need to investigate the specific risks and
opportunities that digital migration opens up for them, and invest in capabilities and/or relationships to capitalize on the economic upturn and the accelerating migration to digital.
• As the migration to online and digital accelerates, effective cross-platform exploitation of brands, characters, titles, programs or patents will become increasingly critical.
• Tackling ongoing tactical and operational challenges around areas such as release windows, platform-specific rights, and in-country relationships for accessing local content.
• Myriad of business models, each specifically tailored to work with particular types of consumer, forms of content or national marketplaces.
• Media segments currently experiencing declining revenues are not doing so because of declining demand. In fact, demand for entertainment and media appears to be increasing. What has changed in some cases is the ability to monetize that demand. The industry must think up and create models to restore that ability.
Source: PwC Global E&M Outlook 2009-2013
Indian Television Industry
Performance of Indian Television Industry in 2008
Impact of global economic downturn on the Indian Television Industry
Key developments in the Indian Television Industry in 2008
Key International Trends in the Indian Television Industry in 2008
Outlook for the Indian Television Industry 2009-2013
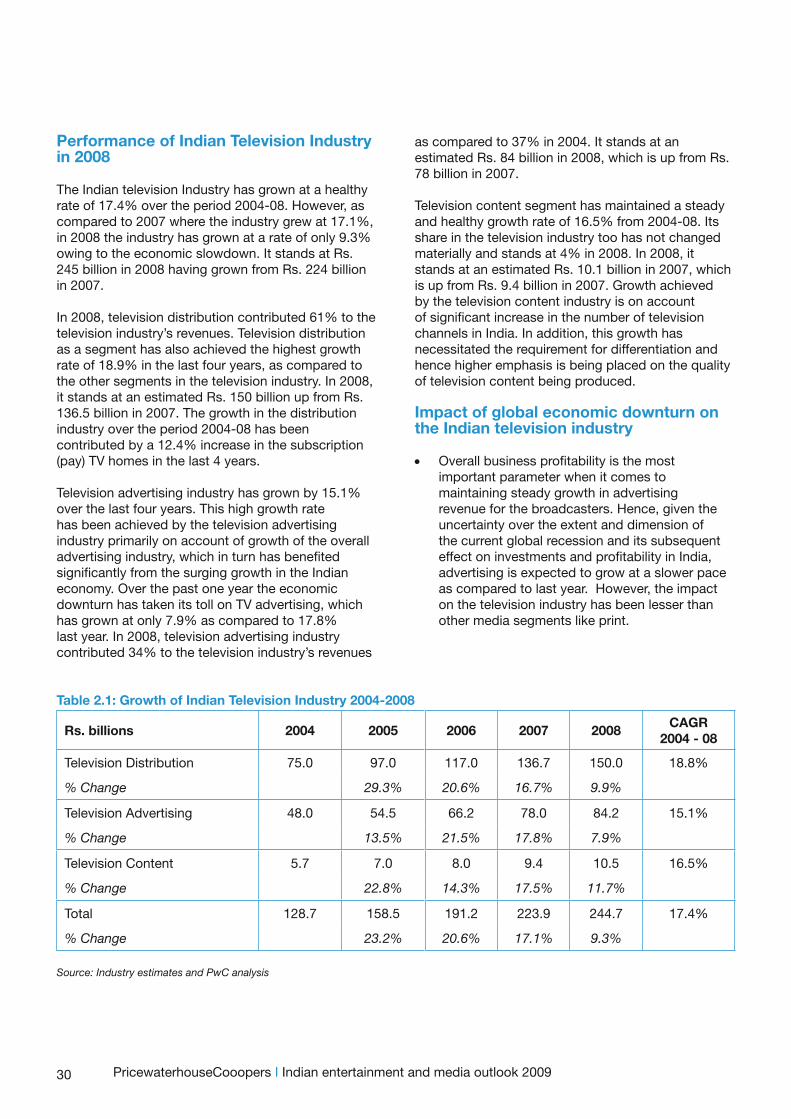
30
Performance of Indian Television Industry in 2008
The Indian television Industry has grown at a healthy rate of 17.4% over the period 2004-08. However, as compared to 2007 where the industry grew at 17.1%, in 2008 the industry has grown at a rate of only 9.3% owing to the economic slowdown. It stands at Rs. 245 billion in 2008 having grown from Rs. 224 billion in 2007.
In 2008, television distribution contributed 61% to the television industry’s revenues. Television distribution as a segment has also achieved the highest growth rate of 18.9% in the last four years, as compared to the other segments in the television industry. In 2008, it stands at an estimated Rs. 150 billion up from Rs. 136.5 billion in 2007. The growth in the distribution industry over the period 2004-08 has been contributed by a 12.4% increase in the subscription (pay) TV homes in the last 4 years.
Television advertising industry has grown by 15.1% over the last four years. This high growth rate has been achieved by the television advertising industry primarily on account of growth of the overall advertising industry, which in turn has benefited significantly from the surging growth in the Indian economy. Over the past one year the economic downturn has taken its toll on TV advertising, which has grown at only 7.9% as compared to 17.8% last year. In 2008, television advertising industry contributed 34% to the television industry’s revenues
as compared to 37% in 2004. It stands at an estimated Rs. 84 billion in 2008, which is up from Rs. 78 billion in 2007.
Television content segment has maintained a steady and healthy growth rate of 16.5% from 2004-08. Its share in the television industry too has not changed materially and stands at 4% in 2008. In 2008, it stands at an estimated Rs. 10.1 billion in 2007, which is up from Rs. 9.4 billion in 2007. Growth achieved by the television content industry is on account of significant increase in the number of television channels in India. In addition, this growth has necessitated the requirement for differentiation and hence higher emphasis is being placed on the quality of television content being produced.
Impact of global economic downturn on the Indian television industry
• Overall business profitability is the most important parameter when it comes to maintaining steady growth in advertising revenue for the broadcasters. Hence, given the uncertainty over the extent and dimension of the current global recession and its subsequent effect on investments and profitability in India, advertising is expected to grow at a slower pace as compared to last year. However, the impact on the television industry has been lesser than other media segments like print.
PricewaterhouseCooopers I Indian entertainment and media outlook 2009
Table 2.1: Growth of Indian Television Industry 2004-2008
Rs. billions 2004 2005 2006 2007 2008CAGR
2004 - 08
Television Distribution 75.0 97.0 117.0 136.7 150.0 18.8%
% Change 29.3% 20.6% 16.7% 9.9%
Television Advertising 48.0 54.5 66.2 78.0 84.2 15.1%
% Change 13.5% 21.5% 17.8% 7.9%
Television Content 5.7 7.0 8.0 9.4 10.5 16.5%
% Change 22.8% 14.3% 17.5% 11.7%
Total 128.7 158.5 191.2 223.9 244.7 17.4%
% Change 23.2% 20.6% 17.1% 9.3%
Source: Industry estimates and PwC analysis
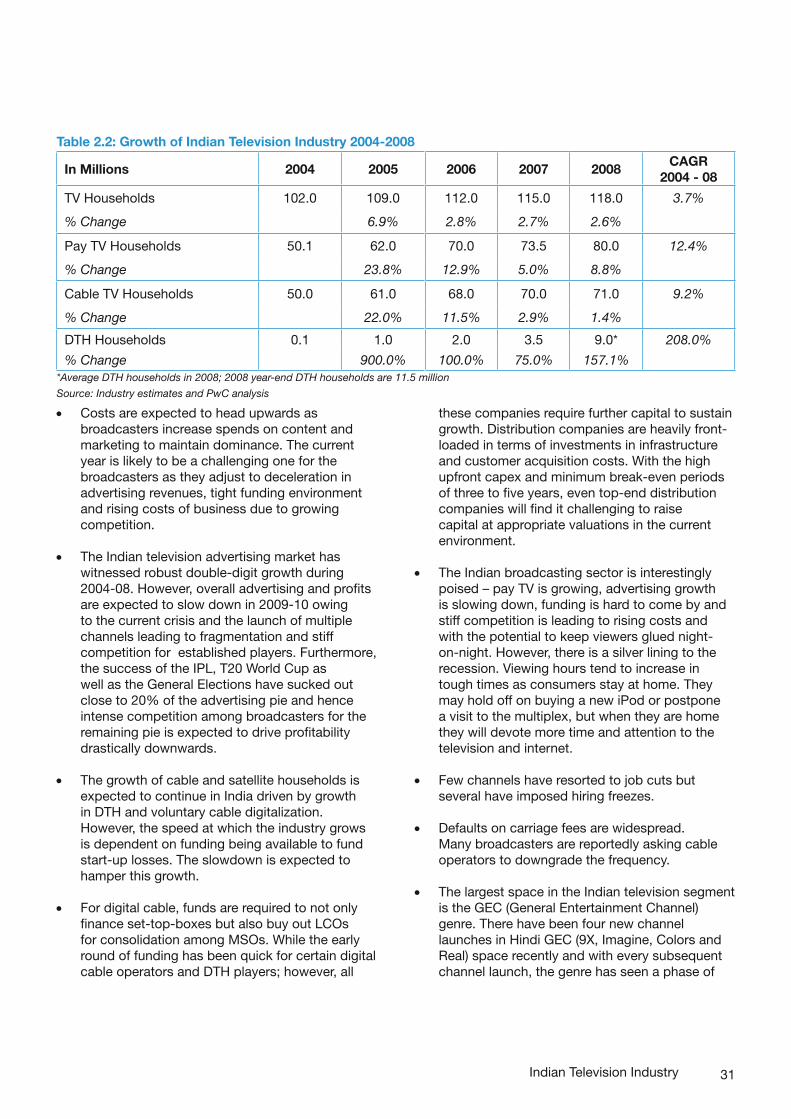
31
• Costs are expected to head upwards as broadcasters increase spends on content and marketing to maintain dominance. The current year is likely to be a challenging one for the broadcasters as they adjust to deceleration in advertising revenues, tight funding environment and rising costs of business due to growing competition.
• The Indian television advertising market has witnessed robust double-digit growth during 2004-08. However, overall advertising and profits are expected to slow down in 2009-10 owing to the current crisis and the launch of multiple channels leading to fragmentation and stiff competition for established players. Furthermore, the success of the IPL, T20 World Cup as well as the General Elections have sucked out close to 20% of the advertising pie and hence intense competition among broadcasters for the remaining pie is expected to drive profitability drastically downwards.
• The growth of cable and satellite households is expected to continue in India driven by growth in DTH and voluntary cable digitalization. However, the speed at which the industry grows is dependent on funding being available to fund start-up losses. The slowdown is expected to hamper this growth.
• For digital cable, funds are required to not only finance set-top-boxes but also buy out LCOs for consolidation among MSOs. While the early round of funding has been quick for certain digital cable operators and DTH players; however, all
these companies require further capital to sustain growth. Distribution companies are heavily front-loaded in terms of investments in infrastructure and customer acquisition costs. With the high upfront capex and minimum break-even periods of three to five years, even top-end distribution companies will find it challenging to raise capital at appropriate valuations in the current environment.
• The Indian broadcasting sector is interestingly poised – pay TV is growing, advertising growth is slowing down, funding is hard to come by and stiff competition is leading to rising costs and with the potential to keep viewers glued night-on-night. However, there is a silver lining to the recession. Viewing hours tend to increase in tough times as consumers stay at home. They may hold off on buying a new iPod or postpone a visit to the multiplex, but when they are home they will devote more time and attention to the television and internet.
• Few channels have resorted to job cuts but several have imposed hiring freezes.
• Defaults on carriage fees are widespread. Many broadcasters are reportedly asking cable operators to downgrade the frequency.
• The largest space in the Indian television segment is the GEC (General Entertainment Channel) genre. There have been four new channel launches in Hindi GEC (9X, Imagine, Colors and Real) space recently and with every subsequent channel launch, the genre has seen a phase of
Indian Television Industry
Table 2.2: Growth of Indian Television Industry 2004-2008
In Millions 2004 2005 2006 2007 2008CAGR
2004 - 08
TV Households 102.0 109.0 112.0 115.0 118.0 3.7%
% Change 6.9% 2.8% 2.7% 2.6%
Pay TV Households 50.1 62.0 70.0 73.5 80.0 12.4%
% Change 23.8% 12.9% 5.0% 8.8%
Cable TV Households 50.0 61.0 68.0 70.0 71.0 9.2%
% Change 22.0% 11.5% 2.9% 1.4%
DTH Households 0.1 1.0 2.0 3.5 9.0* 208.0%
% Change 900.0% 100.0% 75.0% 157.1%*Average DTH households in 2008; 2008 year-end DTH households are 11.5 million
Source: Industry estimates and PwC analysis
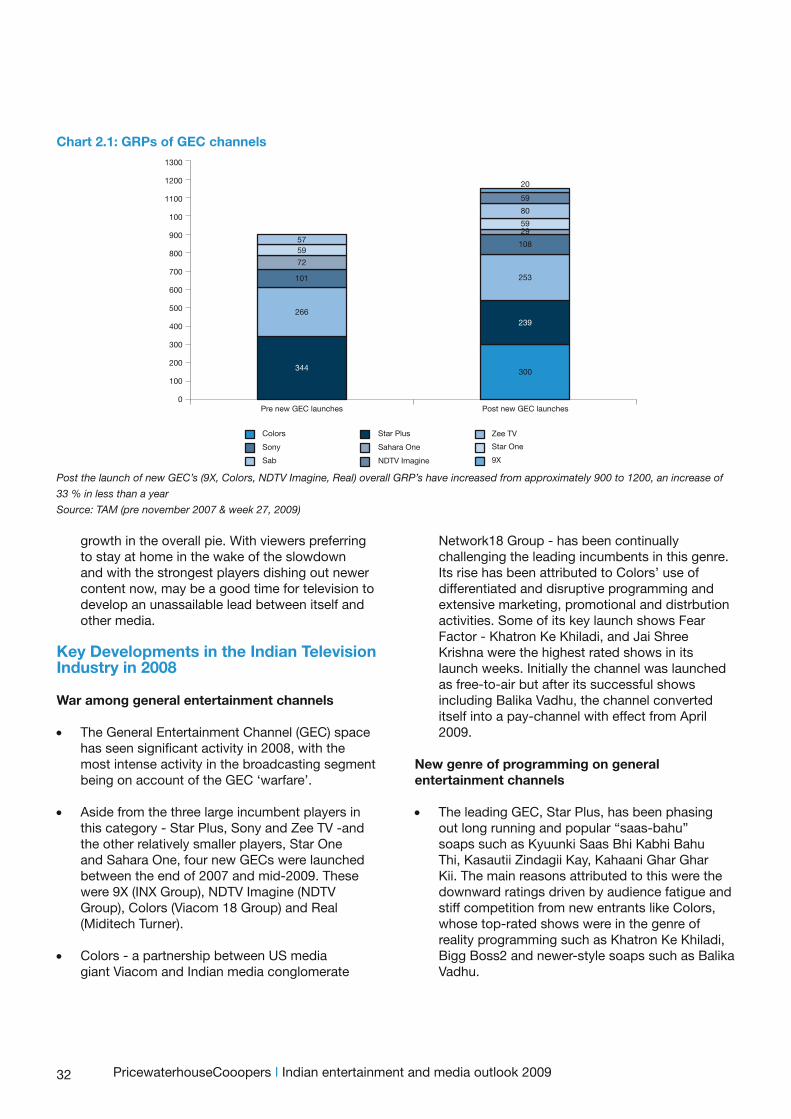
32
growth in the overall pie. With viewers preferring to stay at home in the wake of the slowdown and with the strongest players dishing out newer content now, may be a good time for television to develop an unassailable lead between itself and other media.
Key Developments in the Indian Television Industry in 2008 War among general entertainment channels
• The General Entertainment Channel (GEC) space has seen significant activity in 2008, with the most intense activity in the broadcasting segment being on account of the GEC ‘warfare’.
• Aside from the three large incumbent players in this category - Star Plus, Sony and Zee TV -and the other relatively smaller players, Star One and Sahara One, four new GECs were launched between the end of 2007 and mid-2009. These were 9X (INX Group), NDTV Imagine (NDTV Group), Colors (Viacom 18 Group) and Real (Miditech Turner).
• Colors - a partnership between US media giant Viacom and Indian media conglomerate
Post the launch of new GEC’s (9X, Colors, NDTV Imagine, Real) overall GRP’s have increased from approximately 900 to 1200, an increase of
33 % in less than a year
Source: TAM (pre november 2007 & week 27, 2009)
Network18 Group - has been continually challenging the leading incumbents in this genre. Its rise has been attributed to Colors’ use of differentiated and disruptive programming and extensive marketing, promotional and distrbution activities. Some of its key launch shows Fear Factor - Khatron Ke Khiladi, and Jai Shree Krishna were the highest rated shows in its launch weeks. Initially the channel was launched as free-to-air but after its successful shows including Balika Vadhu, the channel converted itself into a pay-channel with effect from April 2009.
New genre of programming on general entertainment channels
• The leading GEC, Star Plus, has been phasing out long running and popular “saas-bahu” soaps such as Kyuunki Saas Bhi Kabhi Bahu Thi, Kasautii Zindagii Kay, Kahaani Ghar Ghar Kii. The main reasons attributed to this were the downward ratings driven by audience fatigue and stiff competition from new entrants like Colors, whose top-rated shows were in the genre of reality programming such as Khatron Ke Khiladi, Bigg Boss2 and newer-style soaps such as Balika Vadhu.
Chart 2.1: GRPs of GEC channels
PricewaterhouseCooopers I Indian entertainment and media outlook 2009
1300
1200
1100
100
900
800
700
600
500
400
300
200
100
0Pre new GEC launches Post new GEC launches
Colors Star Plus Zee TV
Star One
9X
Sahara One
NDTV Imagine
Sony
Sab
57
20
59
59
72
80
101
5929
266
108
253
300344
239
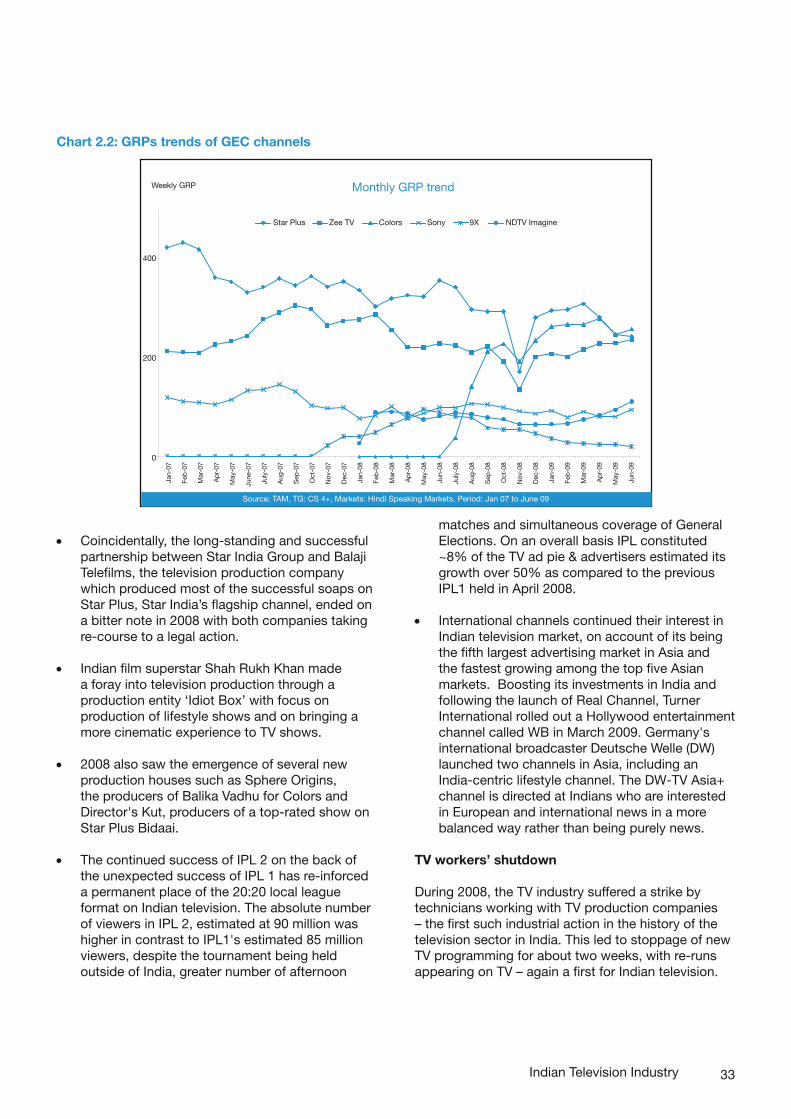
33
• Coincidentally, the long-standing and successful partnership between Star India Group and Balaji Telefilms, the television production company which produced most of the successful soaps on Star Plus, Star India’s flagship channel, ended on a bitter note in 2008 with both companies taking re-course to a legal action.
• Indian film superstar Shah Rukh Khan made a foray into television production through a production entity ‘Idiot Box’ with focus on production of lifestyle shows and on bringing a more cinematic experience to TV shows.
• 2008 also saw the emergence of several new production houses such as Sphere Origins, the producers of Balika Vadhu for Colors and Director's Kut, producers of a top-rated show on Star Plus Bidaai.
• The continued success of IPL 2 on the back of the unexpected success of IPL 1 has re-inforced a permanent place of the 20:20 local league format on Indian television. The absolute number of viewers in IPL 2, estimated at 90 million was higher in contrast to IPL1's estimated 85 million viewers, despite the tournament being held outside of India, greater number of afternoon
Chart 2.2: GRPs trends of GEC channels
matches and simultaneous coverage of General Elections. On an overall basis IPL constituted ~8% of the TV ad pie & advertisers estimated its growth over 50% as compared to the previous IPL1 held in April 2008.
• International channels continued their interest in Indian television market, on account of its being the fifth largest advertising market in Asia and the fastest growing among the top five Asian markets. Boosting its investments in India and following the launch of Real Channel, Turner International rolled out a Hollywood entertainment channel called WB in March 2009. Germany's international broadcaster Deutsche Welle (DW) launched two channels in Asia, including an India-centric lifestyle channel. The DW-TV Asia+ channel is directed at Indians who are interested in European and international news in a more balanced way rather than being purely news.
TV workers’ shutdown
During 2008, the TV industry suffered a strike by technicians working with TV production companies – the first such industrial action in the history of the television sector in India. This led to stoppage of new TV programming for about two weeks, with re-runs appearing on TV – again a first for Indian television.
Indian Television Industry
Monthly GRP trend
Star Plus
Weekly GRP
Source: TAM, TG: CS 4+, Markets: Hindi Speaking Markets, Period: Jan 07 to June 09
Zee TV Colors Sony 9X NDTV Imagine
400
200
0
Jan-
07
Feb
-07
Mar
-07
Ap
r-07
May
-07
June
-07
July
-07
Aug
-07
Sep
-07
Oct
-07
Nov
-07
Dec
-07
Jan-
08
Feb
-08
Mar
-08
Ap
r-08
May
-08
Jun-
08
July
-08
Aug
-08
Sep
-08
Oct
-08
Nov
-08
Dec
-08
Jan-
09
Feb
-09
Mar
-09
Ap
r-09
May
-09
Jun-
09
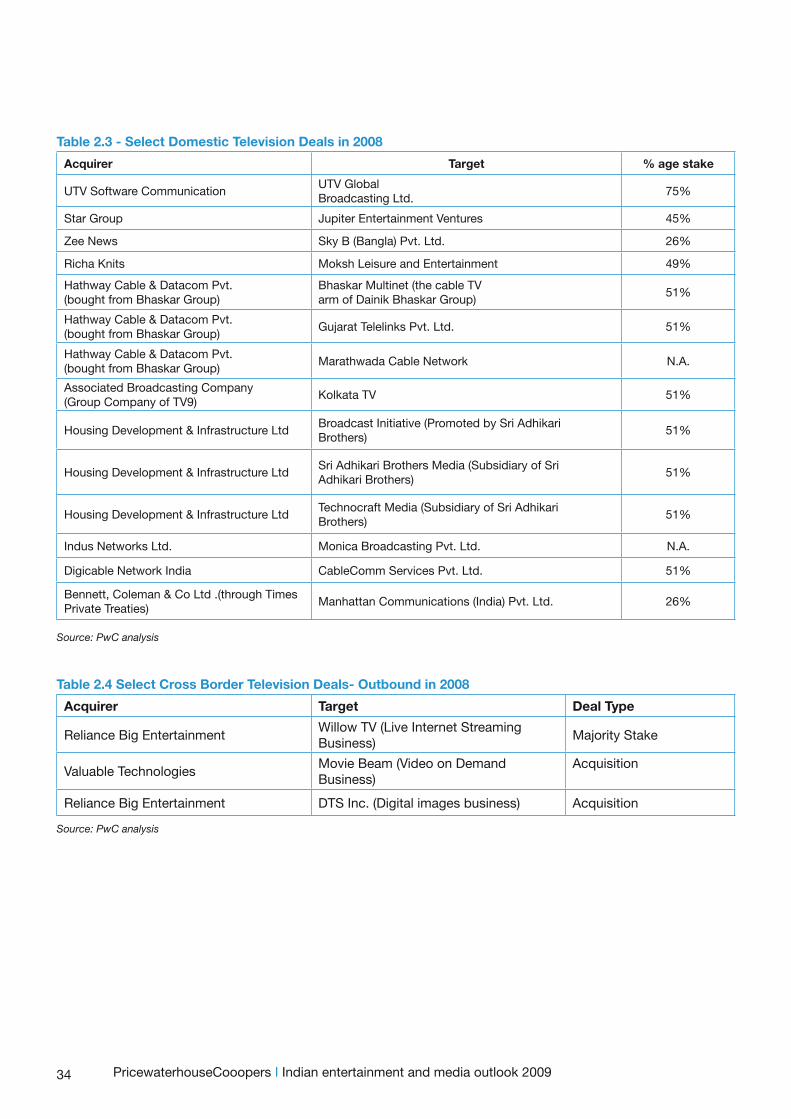
34
Table 2.3 - Select Domestic Television Deals in 2008
Acquirer Target % age stake
UTV Software CommunicationUTV GlobalBroadcasting Ltd.
75%
Star Group Jupiter Entertainment Ventures 45%
Zee News Sky B (Bangla) Pvt. Ltd. 26%
Richa Knits Moksh Leisure and Entertainment 49%
Hathway Cable & Datacom Pvt.(bought from Bhaskar Group)
Bhaskar Multinet (the cable TVarm of Dainik Bhaskar Group)
51%
Hathway Cable & Datacom Pvt.(bought from Bhaskar Group)
Gujarat Telelinks Pvt. Ltd. 51%
Hathway Cable & Datacom Pvt.(bought from Bhaskar Group)
Marathwada Cable Network N.A.
Associated Broadcasting Company (Group Company of TV9)
Kolkata TV 51%
Housing Development & Infrastructure LtdBroadcast Initiative (Promoted by Sri AdhikariBrothers)
51%
Housing Development & Infrastructure LtdSri Adhikari Brothers Media (Subsidiary of SriAdhikari Brothers)
51%
Housing Development & Infrastructure LtdTechnocraft Media (Subsidiary of Sri AdhikariBrothers)
51%
Indus Networks Ltd. Monica Broadcasting Pvt. Ltd. N.A.
Digicable Network India CableComm Services Pvt. Ltd. 51%
Bennett, Coleman & Co Ltd .(through Times Private Treaties)
Manhattan Communications (India) Pvt. Ltd. 26%
Source: PwC analysis
Table 2.4 Select Cross Border Television Deals- Outbound in 2008
Acquirer Target Deal Type
Reliance Big Entertainment Willow TV (Live Internet Streaming Business)
Majority Stake
Valuable Technologies Movie Beam (Video on Demand Business)
Acquisition
Reliance Big Entertainment DTS Inc. (Digital images business) Acquisition
Source: PwC analysis
PricewaterhouseCooopers I Indian entertainment and media outlook 2009
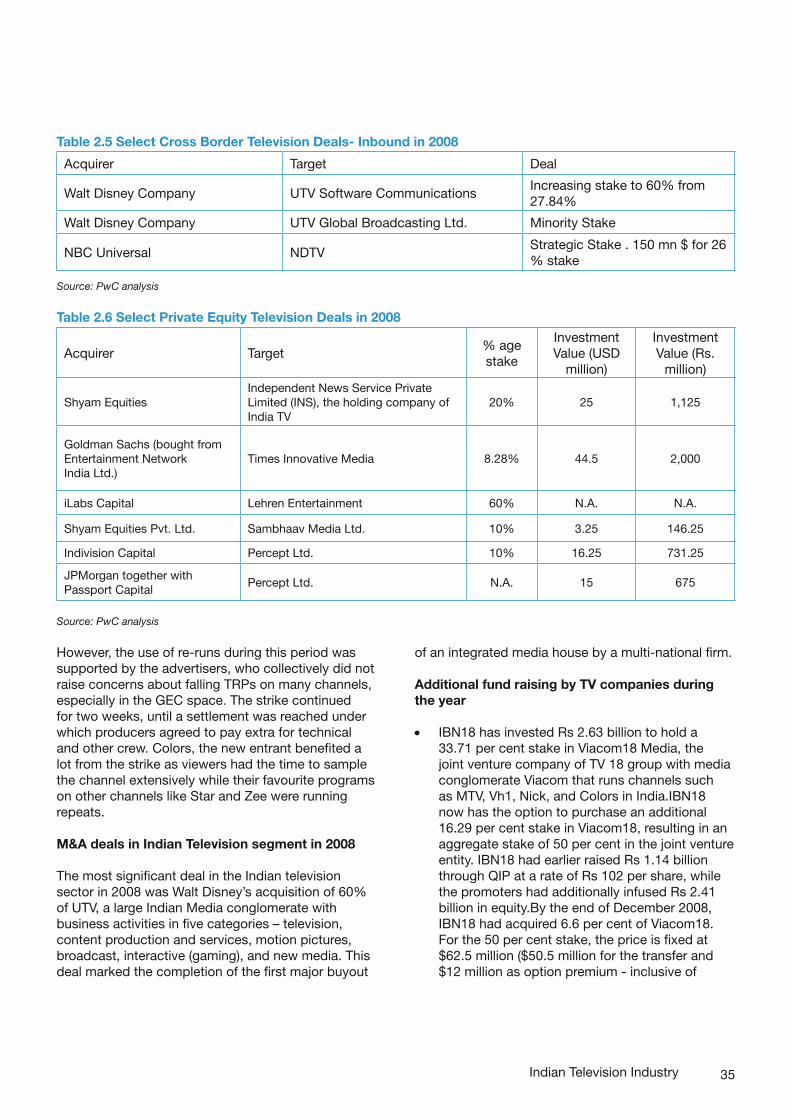
35
However, the use of re-runs during this period was supported by the advertisers, who collectively did not raise concerns about falling TRPs on many channels, especially in the GEC space. The strike continued for two weeks, until a settlement was reached under which producers agreed to pay extra for technical and other crew. Colors, the new entrant benefited a lot from the strike as viewers had the time to sample the channel extensively while their favourite programs on other channels like Star and Zee were running repeats.
M&A deals in Indian Television segment in 2008
The most significant deal in the Indian television sector in 2008 was Walt Disney’s acquisition of 60% of UTV, a large Indian Media conglomerate with business activities in five categories – television, content production and services, motion pictures, broadcast, interactive (gaming), and new media. This deal marked the completion of the first major buyout
Table 2.6 Select Private Equity Television Deals in 2008
Acquirer Target% age stake
Investment Value (USD
million)
Investment Value (Rs.
million)
Shyam Equities Independent News Service Private Limited (INS), the holding company of India TV
20% 25 1,125
Goldman Sachs (bought fromEntertainment NetworkIndia Ltd.)
Times Innovative Media 8.28% 44.5 2,000
iLabs Capital Lehren Entertainment 60% N.A. N.A.
Shyam Equities Pvt. Ltd. Sambhaav Media Ltd. 10% 3.25 146.25
Indivision Capital Percept Ltd. 10% 16.25 731.25
JPMorgan together with Passport Capital
Percept Ltd. N.A. 15 675
Source: PwC analysis
Table 2.5 Select Cross Border Television Deals- Inbound in 2008
Acquirer Target Deal
Walt Disney Company UTV Software CommunicationsIncreasing stake to 60% from 27.84%
Walt Disney Company UTV Global Broadcasting Ltd. Minority Stake
NBC Universal NDTVStrategic Stake . 150 mn $ for 26 % stake
Source: PwC analysis
of an integrated media house by a multi-national firm.
Additional fund raising by TV companies during the year
• IBN18 has invested Rs 2.63 billion to hold a 33.71 per cent stake in Viacom18 Media, the joint venture company of TV 18 group with media conglomerate Viacom that runs channels such as MTV, Vh1, Nick, and Colors in India.IBN18 now has the option to purchase an additional 16.29 per cent stake in Viacom18, resulting in an aggregate stake of 50 per cent in the joint venture entity. IBN18 had earlier raised Rs 1.14 billion through QIP at a rate of Rs 102 per share, while the promoters had additionally infused Rs 2.41 billion in equity.By the end of December 2008, IBN18 had acquired 6.6 per cent of Viacom18. For the 50 per cent stake, the price is fixed at $62.5 million ($50.5 million for the transfer and $12 million as option premium - inclusive of
Indian Television Industry
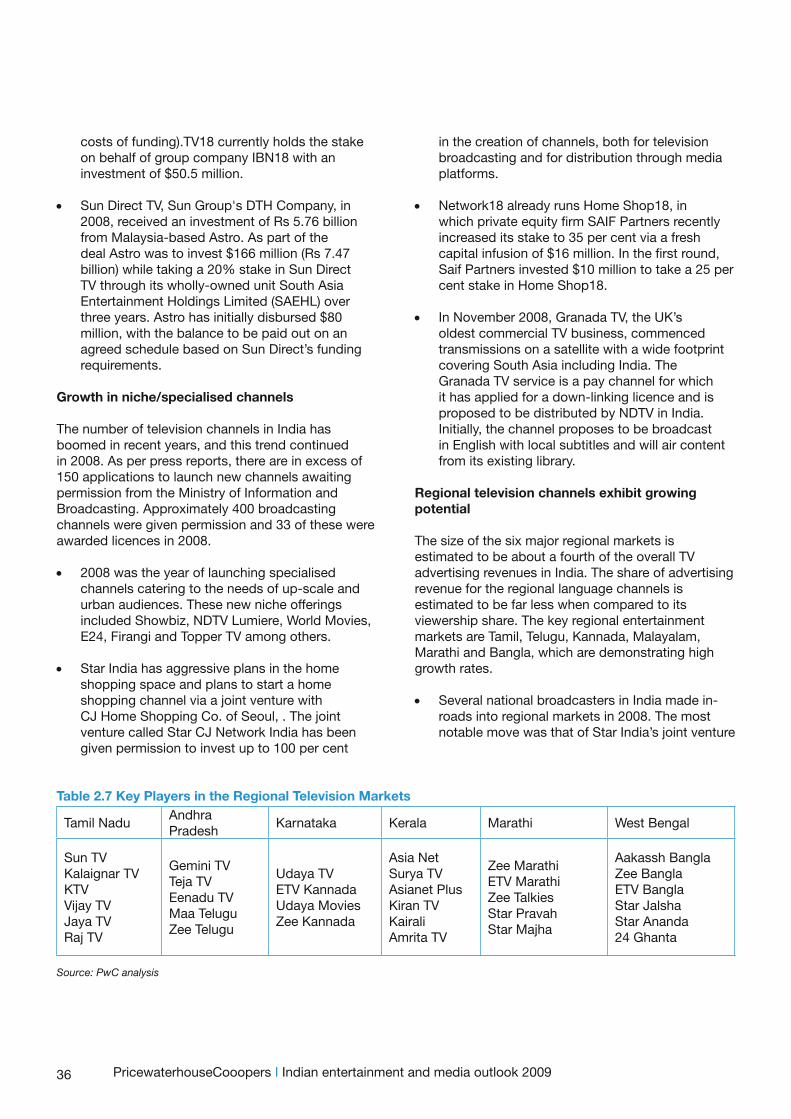
36
costs of funding).TV18 currently holds the stake on behalf of group company IBN18 with an investment of $50.5 million.
• Sun Direct TV, Sun Group's DTH Company, in 2008, received an investment of Rs 5.76 billion from Malaysia-based Astro. As part of the deal Astro was to invest $166 million (Rs 7.47 billion) while taking a 20% stake in Sun Direct TV through its wholly-owned unit South Asia Entertainment Holdings Limited (SAEHL) over three years. Astro has initially disbursed $80 million, with the balance to be paid out on an agreed schedule based on Sun Direct’s funding requirements.
Growth in niche/specialised channels
The number of television channels in India has boomed in recent years, and this trend continued in 2008. As per press reports, there are in excess of 150 applications to launch new channels awaiting permission from the Ministry of Information and Broadcasting. Approximately 400 broadcasting channels were given permission and 33 of these were awarded licences in 2008.
• 2008 was the year of launching specialised channels catering to the needs of up-scale and urban audiences. These new niche offerings included Showbiz, NDTV Lumiere, World Movies, E24, Firangi and Topper TV among others.
• Star India has aggressive plans in the home shopping space and plans to start a home shopping channel via a joint venture with CJ Home Shopping Co. of Seoul, . The joint venture called Star CJ Network India has been given permission to invest up to 100 per cent
Table 2.7 Key Players in the Regional Television Markets
Tamil NaduAndhra Pradesh
Karnataka Kerala Marathi West Bengal
Sun TVKalaignar TVKTVVijay TVJaya TVRaj TV
Gemini TVTeja TVEenadu TVMaa TeluguZee Telugu
Udaya TVETV KannadaUdaya MoviesZee Kannada
Asia NetSurya TVAsianet PlusKiran TVKairaliAmrita TV
Zee MarathiETV MarathiZee TalkiesStar PravahStar Majha
Aakassh BanglaZee BanglaETV BanglaStar JalshaStar Ananda24 Ghanta
Source: PwC analysis
in the creation of channels, both for television broadcasting and for distribution through media platforms.
• Network18 already runs Home Shop18, in which private equity firm SAIF Partners recently increased its stake to 35 per cent via a fresh capital infusion of $16 million. In the first round, Saif Partners invested $10 million to take a 25 per cent stake in Home Shop18.
• In November 2008, Granada TV, the UK’s oldest commercial TV business, commenced transmissions on a satellite with a wide footprint covering South Asia including India. The Granada TV service is a pay channel for which it has applied for a down-linking licence and is proposed to be distributed by NDTV in India. Initially, the channel proposes to be broadcast in English with local subtitles and will air content from its existing library.
Regional television channels exhibit growing potential
The size of the six major regional markets is estimated to be about a fourth of the overall TV advertising revenues in India. The share of advertising revenue for the regional language channels is estimated to be far less when compared to its viewership share. The key regional entertainment markets are Tamil, Telugu, Kannada, Malayalam, Marathi and Bangla, which are demonstrating high growth rates.
• Several national broadcasters in India made in-roads into regional markets in 2008. The most notable move was that of Star India’s joint venture
PricewaterhouseCooopers I Indian entertainment and media outlook 2009
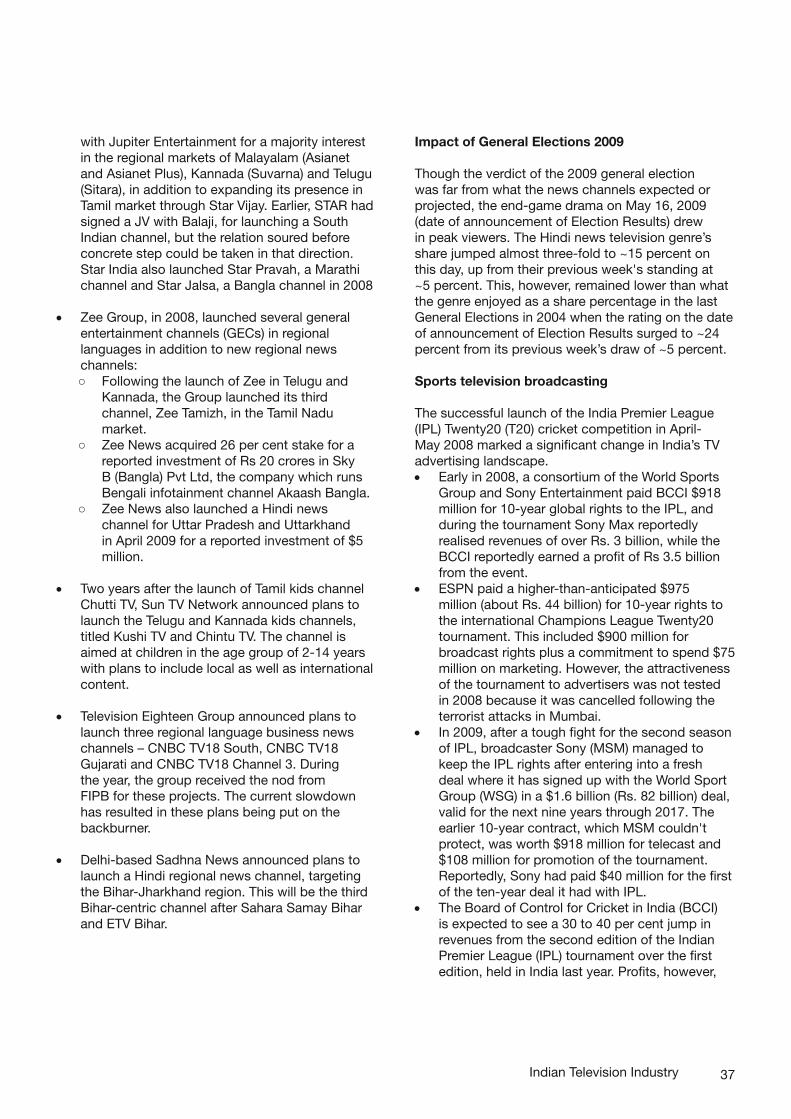
37
with Jupiter Entertainment for a majority interest in the regional markets of Malayalam (Asianet and Asianet Plus), Kannada (Suvarna) and Telugu (Sitara), in addition to expanding its presence in Tamil market through Star Vijay. Earlier, STAR had signed a JV with Balaji, for launching a South Indian channel, but the relation soured before concrete step could be taken in that direction. Star India also launched Star Pravah, a Marathi channel and Star Jalsa, a Bangla channel in 2008
• Zee Group, in 2008, launched several general entertainment channels (GECs) in regional languages in addition to new regional news channels: ○ Following the launch of Zee in Telugu and
Kannada, the Group launched its third channel, Zee Tamizh, in the Tamil Nadu market.
○ Zee News acquired 26 per cent stake for a reported investment of Rs 20 crores in Sky B (Bangla) Pvt Ltd, the company which runs Bengali infotainment channel Akaash Bangla.
○ Zee News also launched a Hindi news channel for Uttar Pradesh and Uttarkhand in April 2009 for a reported investment of $5 million.
• Two years after the launch of Tamil kids channel Chutti TV, Sun TV Network announced plans to launch the Telugu and Kannada kids channels, titled Kushi TV and Chintu TV. The channel is aimed at children in the age group of 2-14 years with plans to include local as well as international content.
• Television Eighteen Group announced plans to launch three regional language business news channels – CNBC TV18 South, CNBC TV18 Gujarati and CNBC TV18 Channel 3. During the year, the group received the nod from FIPB for these projects. The current slowdown has resulted in these plans being put on the backburner.
• Delhi-based Sadhna News announced plans to launch a Hindi regional news channel, targeting the Bihar-Jharkhand region. This will be the third Bihar-centric channel after Sahara Samay Bihar and ETV Bihar.
Impact of General Elections 2009
Though the verdict of the 2009 general election was far from what the news channels expected or projected, the end-game drama on May 16, 2009 (date of announcement of Election Results) drew in peak viewers. The Hindi news television genre’s share jumped almost three-fold to ~15 percent on this day, up from their previous week's standing at ~5 percent. This, however, remained lower than what the genre enjoyed as a share percentage in the last General Elections in 2004 when the rating on the date of announcement of Election Results surged to ~24 percent from its previous week’s draw of ~5 percent.
Sports television broadcasting
The successful launch of the India Premier League (IPL) Twenty20 (T20) cricket competition in April-May 2008 marked a significant change in India’s TV advertising landscape. • Early in 2008, a consortium of the World Sports
Group and Sony Entertainment paid BCCI $918 million for 10-year global rights to the IPL, and during the tournament Sony Max reportedly realised revenues of over Rs. 3 billion, while the BCCI reportedly earned a profit of Rs 3.5 billion from the event.
• ESPN paid a higher-than-anticipated $975 million (about Rs. 44 billion) for 10-year rights to the international Champions League Twenty20 tournament. This included $900 million for broadcast rights plus a commitment to spend $75 million on marketing. However, the attractiveness of the tournament to advertisers was not tested in 2008 because it was cancelled following the terrorist attacks in Mumbai.
• In 2009, after a tough fight for the second season of IPL, broadcaster Sony (MSM) managed to keep the IPL rights after entering into a fresh deal where it has signed up with the World Sport Group (WSG) in a $1.6 billion (Rs. 82 billion) deal, valid for the next nine years through 2017. The earlier 10-year contract, which MSM couldn't protect, was worth $918 million for telecast and $108 million for promotion of the tournament. Reportedly, Sony had paid $40 million for the first of the ten-year deal it had with IPL.
• The Board of Control for Cricket in India (BCCI) is expected to see a 30 to 40 per cent jump in revenues from the second edition of the Indian Premier League (IPL) tournament over the first edition, held in India last year. Profits, however,
Indian Television Industry
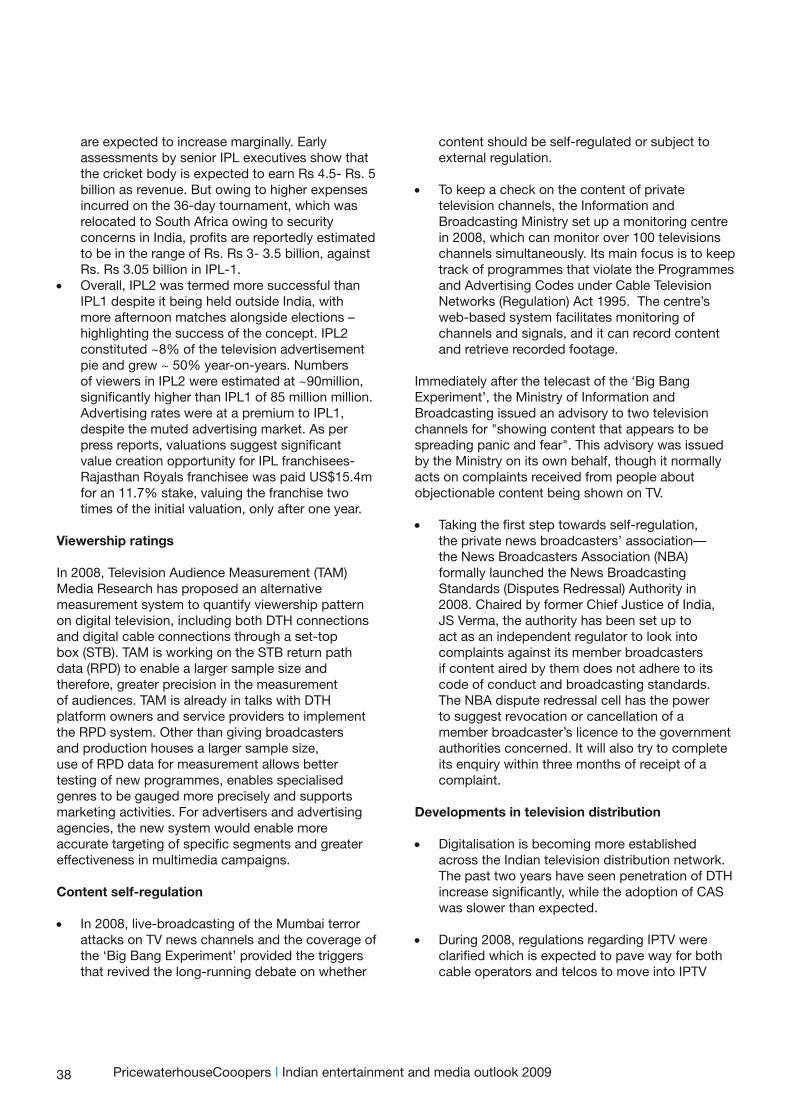
38
are expected to increase marginally. Early assessments by senior IPL executives show that the cricket body is expected to earn Rs 4.5- Rs. 5 billion as revenue. But owing to higher expenses incurred on the 36-day tournament, which was relocated to South Africa owing to security concerns in India, profits are reportedly estimated to be in the range of Rs. Rs 3- 3.5 billion, against Rs. Rs 3.05 billion in IPL-1.
• Overall, IPL2 was termed more successful than IPL1 despite it being held outside India, with more afternoon matches alongside elections – highlighting the success of the concept. IPL2 constituted ~8% of the television advertisement pie and grew ~ 50% year-on-years. Numbers of viewers in IPL2 were estimated at ~90million, significantly higher than IPL1 of 85 million million. Advertising rates were at a premium to IPL1, despite the muted advertising market. As per press reports, valuations suggest significant value creation opportunity for IPL franchisees- Rajasthan Royals franchisee was paid US$15.4m for an 11.7% stake, valuing the franchise two times of the initial valuation, only after one year.
Viewership ratings
In 2008, Television Audience Measurement (TAM) Media Research has proposed an alternative measurement system to quantify viewership pattern on digital television, including both DTH connections and digital cable connections through a set-top box (STB). TAM is working on the STB return path data (RPD) to enable a larger sample size and therefore, greater precision in the measurement of audiences. TAM is already in talks with DTH platform owners and service providers to implement the RPD system. Other than giving broadcasters and production houses a larger sample size, use of RPD data for measurement allows better testing of new programmes, enables specialised genres to be gauged more precisely and supports marketing activities. For advertisers and advertising agencies, the new system would enable more accurate targeting of specific segments and greater effectiveness in multimedia campaigns.
Content self-regulation
• In 2008, live-broadcasting of the Mumbai terror attacks on TV news channels and the coverage of the ‘Big Bang Experiment’ provided the triggers that revived the long-running debate on whether
content should be self-regulated or subject to external regulation.
• To keep a check on the content of private television channels, the Information and Broadcasting Ministry set up a monitoring centre in 2008, which can monitor over 100 televisions channels simultaneously. Its main focus is to keep track of programmes that violate the Programmes and Advertising Codes under Cable Television Networks (Regulation) Act 1995. The centre’s web-based system facilitates monitoring of channels and signals, and it can record content and retrieve recorded footage.
Immediately after the telecast of the ‘Big Bang Experiment’, the Ministry of Information and Broadcasting issued an advisory to two television channels for "showing content that appears to be spreading panic and fear". This advisory was issued by the Ministry on its own behalf, though it normally acts on complaints received from people about objectionable content being shown on TV.
• Taking the first step towards self-regulation, the private news broadcasters’ association—the News Broadcasters Association (NBA) formally launched the News Broadcasting Standards (Disputes Redressal) Authority in 2008. Chaired by former Chief Justice of India, JS Verma, the authority has been set up to act as an independent regulator to look into complaints against its member broadcasters if content aired by them does not adhere to its code of conduct and broadcasting standards. The NBA dispute redressal cell has the power to suggest revocation or cancellation of a member broadcaster’s licence to the government authorities concerned. It will also try to complete its enquiry within three months of receipt of a complaint.
Developments in television distribution
• Digitalisation is becoming more established across the Indian television distribution network. The past two years have seen penetration of DTH increase significantly, while the adoption of CAS was slower than expected.
• During 2008, regulations regarding IPTV were clarified which is expected to pave way for both cable operators and telcos to move into IPTV
PricewaterhouseCooopers I Indian entertainment and media outlook 2009
39
without the need for any additional licences.
• While public broadcaster Doordarshan launched its mobile TV pilot project in 2007 with handset major Nokia, there were no other significant developments in this front since then. However, there have been numerous initiatives by TV broadcasters for bringing re-purposed television contents on to mobile handsets, in-anticipation-of-growth in Mobile TV services. These include Star TV’s launch of the PLUS application and the Essel Group DMCL collaboration with BSNL to launch a mobile application. In 2009, Doordarshan released an Expression of Interest to hire a consultant for developing a roadmap for ‘Public Private Partnership’ for the growth of DD’s mobile TV service.
• Reliance Communications now offers BBC news round-the-clock via a mobile streaming (uni-cast) service to its mobile users across the country. Through this agreement, Reliance Mobile users can access BBC's trademark live-breaking-news and other programming initiatives as they happen directly on their handsets.
• While the conditional access system (CAS) was introduced in 2007 in select areas of Mumbai, Delhi and Kolkata, there have been no developments in this front since then.
• In 2008, News Corp.– owned entity Star India formed a 50-50 joint venture with DEN Digital Entertainment Networks to distribute television channels on all fixed networks, including cable, DTH (direct to home), IPTV, HITS (Headend in the Sky) and MMDS (multichannel multipoint distribution service).
Direct-to-home (DTH) services
• Investments by five large corporates in DTH services- Dish TV (Zee Group), Tata-Sky (Newscorp-Tata JV), Big TV (Reliance Group), Digital TV (Bharti Airtel Group) and Sun Direct (Sun TV Group)- is leading to a rapid increase in DTH subscriber growth rates of ~0.5 million subscriber additions per month as against ~ 50,000 in 2006. Videocon, sixth DTH operator, is expected to launch services shortly.
• In 2008, there is a significant churn of subscribers from cable in favour of DTH, as the latter
subsidizes hardware, reduces installation costs and introduces value packs. Aggressive marketing and promotions also helped DTH lap up subscribers in 2008 which reached ~11.5 million at the end of the year from ~3.5 million in the beginning of 2008.
• Bharti Airtel launched its DTH services under the brand ‘Digital TV’ in October 2008. As per press reports, the launch was delayed due to inquiries about cross-media holdings since Bharti Airtel had a 40% share in the DTH licensee company, which was registered as a cable operator. The eligibility conditions for DTH licences provide that the licensee shall not allow broadcasting and/or cable network companies to collectively hold or own more than 20% of the total paid up equity in the DTH venture. As per press reports, this cross-holding issue was then resolved by Bharti Airtel by surrendering its cable operator licence.
• Reliance Communications launched its DTH services at the same time under the brand ‘Big TV’, and claimed to attract 500,000 subscribers within the first two months. As part of its ramp-up plan, Reliance also tied up with LG to offer its DTH service at half its existing tariff for a limited period to customers buying 29-inch television sets.
• 2008 also witnessed a ‘technology-war’ amongst DTH players. With new players Bharti Airtel’s Digital TV and Reliance’s DTH service Big TV launched in 2008, a technology war erupted between these new players and the older players, Dish TV and Tata Sky use of technology in the set-top-boxes. The older DTH players claimed that the latest MPEG-4 technology, as used by the new DTH players, violates existing guidelines for DTH operations citing reasons of inter-operability. In the view of the older DTH players, the new DTH players are required to offer commercial inter-operability with the existing MPEG-2 set top boxes being used by the older DTH players. The matter is currently under dispute with BIS.
• DTH operators wooed subscribers with several value additions including release of latest Hindi films. Film production house Eros International’s release Aa Dekhe Zara became the first film to be available on demand for DTH service users less than two weeks after its cinema hall release.
Indian Television Industry
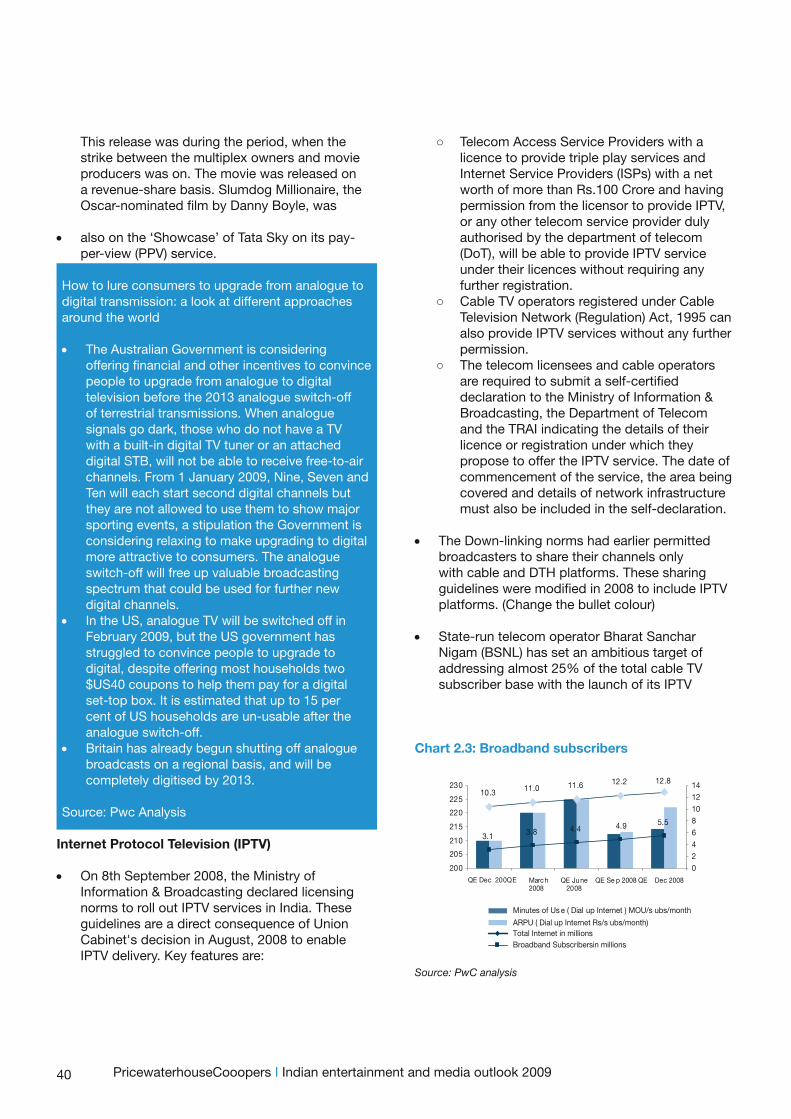
40
This release was during the period, when the strike between the multiplex owners and movie producers was on. The movie was released on a revenue-share basis. Slumdog Millionaire, the Oscar-nominated film by Danny Boyle, was
• also on the ‘Showcase’ of Tata Sky on its pay-per-view (PPV) service.
How to lure consumers to upgrade from analogue to digital transmission: a look at different approaches around the world
• The Australian Government is considering offering financial and other incentives to convince people to upgrade from analogue to digital television before the 2013 analogue switch-off of terrestrial transmissions. When analogue signals go dark, those who do not have a TV with a built-in digital TV tuner or an attached digital STB, will not be able to receive free-to-air channels. From 1 January 2009, Nine, Seven and Ten will each start second digital channels but they are not allowed to use them to show major sporting events, a stipulation the Government is considering relaxing to make upgrading to digital more attractive to consumers. The analogue switch-off will free up valuable broadcasting spectrum that could be used for further new digital channels.
• In the US, analogue TV will be switched off in February 2009, but the US government has struggled to convince people to upgrade to digital, despite offering most households two $US40 coupons to help them pay for a digital set-top box. It is estimated that up to 15 per cent of US households are un-usable after the analogue switch-off.
• Britain has already begun shutting off analogue broadcasts on a regional basis, and will be completely digitised by 2013.
Source: Pwc Analysis
Internet Protocol Television (IPTV)
• On 8th September 2008, the Ministry of Information & Broadcasting declared licensing norms to roll out IPTV services in India. These guidelines are a direct consequence of Union Cabinet's decision in August, 2008 to enable IPTV delivery. Key features are: ○
○ Telecom Access Service Providers with a licence to provide triple play services and Internet Service Providers (ISPs) with a net worth of more than Rs.100 Crore and having permission from the licensor to provide IPTV, or any other telecom service provider duly authorised by the department of telecom (DoT), will be able to provide IPTV service under their licences without requiring any further registration.
○ Cable TV operators registered under Cable Television Network (Regulation) Act, 1995 can also provide IPTV services without any further permission.
○ The telecom licensees and cable operators are required to submit a self-certified declaration to the Ministry of Information & Broadcasting, the Department of Telecom and the TRAI indicating the details of their licence or registration under which they propose to offer the IPTV service. The date of commencement of the service, the area being covered and details of network infrastructure must also be included in the self-declaration.
• The Down-linking norms had earlier permitted broadcasters to share their channels only with cable and DTH platforms. These sharing guidelines were modified in 2008 to include IPTV platforms. (Change the bullet colour)
• State-run telecom operator Bharat Sanchar Nigam (BSNL) has set an ambitious target of addressing almost 25% of the total cable TV subscriber base with the launch of its IPTV
PricewaterhouseCooopers I Indian entertainment and media outlook 2009
Chart 2.3: Broadband subscribers
Source: PwC analysis
10.3 11.0 11.6 12.2 12.8
3.1 3.8 4.4 4.9 5.5
200
205
210
215
220
225
230
March2008
QE Se p 2008 QE Dec 2008
024
6810
1214
Minutes of Us e ( Dial up Internet ) MOU/s ubs/month
ARPU ( Dial up Internet Rs/s ubs/month)Total Internet in millionsBroadband Subscribersin millions
QE Dec 200QE QE Ju ne2008
41
service in the country. The company, which recently launched its IPTV services in Rajasthan, is planning to bring upon100 cities under this service by the end of the current financial year.
Important TRAI pronouncements in 2008
Recommendations on who should be allowed into TV broadcasting and distribution activities.
In 2007, the Information & Broadcasting Ministry had requested TRAI to examine and recommend whether certain entities such as State Governments, urban and local bodies, three-tier Panchayati Raj bodies, publicly funded bodies, political bodies and religious bodies should be allowed to enter into broadcasting activities, which may include starting broadcast channels or distribution platforms such as cable services and DTH. After issuing a consultation paper in February 2008 and several discussions, TRAI issued its recommendations in November 2008. The key recommendations include:• State Governments are not allowed into
broadcasting• State Governments are also not allowed into
distribution• Political bodies should not be allowed into
broadcasting• Religious bodies are also not permitted into
broadcasting and teleports
Public Service Broadcasting Fund - In order to provide funds to create public service broadcasting programs, the TRAI has recommended the establishment of a ‘Public Service Broadcasting Obligation Fund’, on lines similar to the Universal Service Obligation (USO) Fund in the telecom sector. Community Television - To date, terrestrial TV broadcasting has been very tightly held by the government, and Doordarshan is the only entity permitted to undertake terrestrial TV broadcasting, (analogue and DTT) in India. The TRAI had earlier recommended that terrestrial television broadcasting should be permitted for community television. The eligibility conditions should be broadly on similar lines as those already prescribed for community radio stations. The TRAI has reiterated this recommendation.
Cross Media.
The first serious brakes on cross-media ownership could be on in India with the Telecom Regulatory Authority of India (TRAI) recommending that any entity which holds 20 per cent or more in a broadcasting company cannot have more than 20 per cent in a media distribution company such as MSO (multi-system operator), cable TV operator, DTH (direct-to-home, HITS (Headend-In-The-Sky) and mobile TV. If approved by the Government, the regulations would upset big media houses like Essel Group, Star and Sun Network who have interests spread over the broadcasting and distribution value chain.
Re-structuring of Cable TV services.
TRAI has recommended a separate licensing framework for local cable operators and multi system operators in its draft recommendations to restructure cable television services. The draft recommendations include an entry fee for different areas of operations and a five-year licence fee. It also encourages use of advanced transmission technology.
Source: TRAI & PwC analysis
Broadband
Broadband subscribers continued its slow growth through 2008 and reached 5.52 million subscribers by end-2008 and 6.22million by March 2009. The average ARPUs touched Rs. Rs. 222 per month in December 2008.
• Bharat Sanchar Nigam Ltd. (BSNL) announced plans in 2008 to extend broadband coverage to 148,000 villages during early 2009. BSNL, which offers broadband services across 3,261 cities, also aims to expand to 5,000 cities during early 2009. The rapid deployment will primarily be implemented by Wireless Broadband - WiMAX, with support from the USO fund. BSNL has decided to adopt the franchisee model for rolling out wireless broadband using WiMAX technology. It has invited bids from prospective partners on a revenue-sharing basis.
• BSNL wants to be the first to roll out wireless broadband on the 2.5-Ghz band. While private telecom companies have to bid for spectrum in
Indian Television Industry
42
this band, BSNL and MTNL will get automatic allocation. Broadband services on WiMAX technology promise high-speed Internet access on laptops and mobile handsets. BSNL has earmarked close to $750 million for its WiMAX project. The potential for WiMAX is mainly in emerging markets, where wired infrastructure is poor or non-existent, and where fixed broadband penetration is consequently very low.
HITS (Headend in the Sky)
• The Government is working on devising a suitable regulatory framework for digitalization of cable services. This is the key factor in overcoming problems such as under-declaration of subscribers and the practice of carriage fees being charged by cable operators. (change the bullet colour)
• The TRAI recommendations on HITS are being considered by the Ministry of Information and Broadcasting for laying down a policy. The broad outlines of the HITS policy under consideration are already in the public domain. It aims to expand the penetration of cable services into rural areas through low-cost set-top-boxes. It is also likely to lead to further consolidation of the cable market and attract further investments by improving the return on investments.
Key Government Initiatives in 2008
The Ministry of Information & Broadcasting released its policy initiatives and operational measures taken by it during 2008. These include:
• Policy on Internet Protocol TV- The policy on Internet Protocol TV (IPTV) was announced on September 8, 2008. This opened the way for another mode of distribution of signals by close to 400 permitted satellite TV channels through the Telecom Networks. This gives a new digital visual experience to the Indian viewer, while also providing opportunities for both the broadcasters and the platform service providers to create diverse business models. The policy on IPTV offers greater clarity on the issues involved, enabling both the telecom operators and the cable operators to provide IPTV services that are regulated as per their respective licensing conditions. Furthermore, the policy enables IPTV
service providers to create their own content except for the news and current affairs. With the Government committed to expanding the broadband penetration, IPTV is expected to play a major role in distribution of content.
• Digitalisation of cable services – as discussed earlier under HITS.
• Restructuring of cable services - It has been proposed to prescribe a time period of five years within which the existing and new Multi System Operators (MSOs) and Local Cable Operators (LCOs) will have to digitalise, with some incentivisation from the license fee as well as support from the Universal Service Obligation Fund (USOF) for setting up two way cable networks for providing broadband services in rural areas. Beyond the five-year period no new licences will be issued for analogue cable services.
• Conditional Access System- The Ministry is also working on extending the Conditional Access System (CAS) area, firstly to the remaining parts of the three metros of Delhi, Mumbai and Kolkata, and then to the 55 cities as suggested by the TRAI group. Measures are also being considered to bring down the cost of the set-top-box by rationalisation of tax and duty structure.
• Mobile TV - Because of the large potential of Mobile TV and the level of interest shown by the industry, the Ministry of I&B asked TRAI to make recommendations for this sector after due consultations with stakeholders. TRAI has since submitted its recommendations, which are under examination by the Government. The Ministry is also considering permitting field trials for different broadcasting technologies for mobile TV transmission.
• Code of Ethics- The News Broadcasters’ Association (NBA), a representative organisation for the TV news channels which started functioning from October 2, 2008 on self-regulation basis, has submitted its Code of Ethics and the guidelines for the Disputes Redressal Authority to the Ministry. The NBA was formed because news broadcasters were opposed to any kind of regulation or Content Code drawn by Government.
PricewaterhouseCooopers I Indian entertainment and media outlook 2009
43
• Detailed guidelines have been framed for the State Level and District Level Monitoring Committees to look into the violation of Cable TV Networks Rules in an uniform manner. These committees would include representatives of leading NGOs, as well as specialists.
• General advisories/warnings have been issued to private TV channels to remind them of the provisions of the Programme and Advertising Codes which they are required to follow as part of the permission issued to them for operating TV channels in India, keeping especially in mind the impact of obtrusive content on the impressionable minors.
• A state-of-art facility, the Electric Media Monitoring Centre (EMMC), was set up in 2008 to continuously record the broadcast signals being received in India. It is initially monitoring 100 TV channels, and it is proposed to upgrade this monitoring to 300 TV channels during the 2008-2009 financial year.
• CCEA approved the proposal of Prasar Bharati as Host Broadcaster and PIB as Press Organisation for the coverage of Commonwealth Youth Games in Pune in 2008 and the Commonwealth Games in Delhi in 2010. The Commonwealth Youth Games in Pune were widely covered by Prasar Bharati.
Key International Trends in the Television Industry in 2008
Television Advertising
Global Outlook
• The adverse economy will lead to an 11.4 percent decline in overall television advertising in 2009, and will further depress spending during 2010-11, with an improving economic environment contributing to a recovery in 2012–13. As a result, total television advertising will be flat during the forecast period, returning in 2013 to the $168 billion level last seen in 2008.
• Global terrestrial advertising is the dominant component of total television advertising, at $125 billion in 2008, 74 percent of the total. Terrestrial advertising will slump by 13 percent in 2009 and will continue to decline through 2011 before staging a modest recovery. Spending in 2013 will
be $116.2 billion, a 1.5 percent compound annual decrease from 2008.
• Multi-channel advertising will be less affected by the economy, and will be the fastest-growing sector in each region. However, it will fall by 7.1 percent in 2009 before re-bounding. Over the forecast period it will average 3.8 percent growth compounded annually, rising from $43.3 billion in 2008 to $52 billion in 2013.
• However, terrestrial television advertising will still be the dominant component in 2013, accounting for almost 69 percent of the total television advertising market.
Regional growth
• North America will remain the largest market in 2013, at $69.3 billion, having declined by 0.6 percent compounded annually over the five years since 2008.
• EMEA will be flat, having declined in 2009 and 2010 before recovering in the following three years. In 2013, it will return to the $48.9 billion level last seen in 2008.
• Latin America will be the fastest-growing market, with a compound annual increase of 1.4 percent to $13.1 billion.
• Asia Pacific will be the next fastest-growing, with a projected 0.7 percent compound annual gain to $37.2 billion in 2013.
Key drivers
• Near-term economic declines will be the dominant factor affecting the market in each region, with an improvement in the economic environment contributing to the recovery during 2012-13.
• Multi-channel advertising will be the fastest-growing sector globally, buoyed by large increases in digital households and viewing-share gains for cable, satellite channels and DTT channels.
• High-definition television (HDTV) will also boost advertising on free-to-air channels once the underlying economic environment improves.
Indian Television Industry
44 PricewaterhouseCooopers I Indian entertainment and media outlook 2009
Television Subscriptions and Licence Fees
Global outlook
• Globally, television subscription and licence fee spending will increase from $186.1 billion in 2008 to $252.3 billion in 2013, a compound annual growth rate of 6.3 percent.
• Subscription spending—the principal component of the market, at $146.6 billion in 2008, 79 percent of the total—will increase at a 6.7 percent compound annual rate to $202.5 billion in 2013.
• Pay-per-view spending will decline during the period, totaling $4 billion in 2013, down from $4.2 billion in 2008.
• Video-on-demand will expand from $4.6 billion in 2008 to $9.2 billion in 2013, a 14.7 percent compound annual increase.
• Public TV licence fees will grow by 1.8 percent annually to $32.5 billion from $29.7 billion.
• Mobile TV subscription spending will be the fastest-growing category, from a small base, reaching $4.2 billion in 2013.
Regional growth
• North America and EMEA are virtually equal in size as the two largest markets, at more than $74 billion in 2008.
• These two regions will experience similar growth rates over the five-year forecast period, both growing at 5.4 percent compounded annually to take North America to $97.3 billion in 2013, and EMEA to $96.7 billion
• The smaller Asia Pacific market will be the fastest-growing region over the period, with a 10.5 percent compound annual increase, taking it to $45.4 billion in 2013 from $27.5 billion in 2008.
• Latin America will grow by 6.5 percent compounded annually to reach $13 billion in 2013.
Key drivers:
• In each region, weakening economic conditions will lead to slower growth in television subscription and licence fee spending in 2009 and 2010, while the expected economic recovery will drive a recovery in spending during 2011-13.
• Subscribers upgrading from analog to digital multi-channel video will boost video-on-demand. However, VOD growth will largely come at the expense of pay-per-view spending.
• Free mobile TV services will cut into the potential for subscription spending on mobile television.
• Internet protocol television (IPTV)—which contributes to subscription spending, VOD and pay-per-view—will be the fastest-growing subscription technology in each region.
• In EMEA, free digital terrestrial television (DTT) services will limit subscription spending.
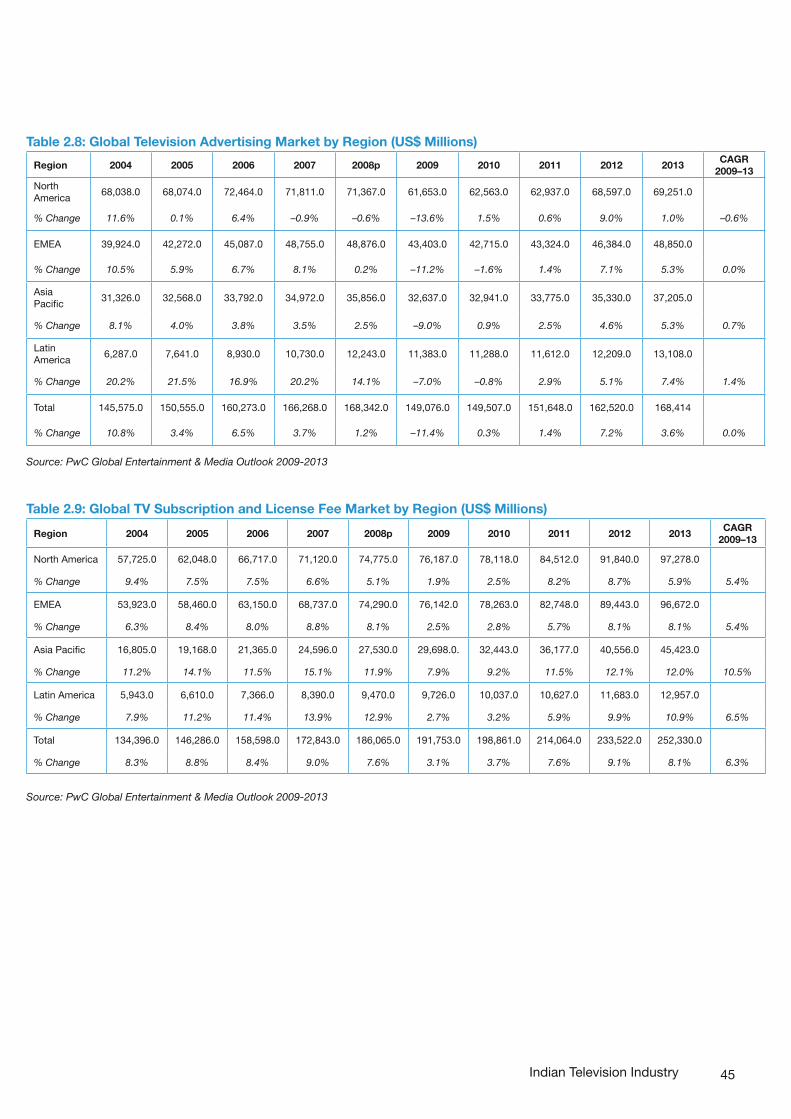
45
Table 2.9: Global TV Subscription and License Fee Market by Region (US$ Millions)
Region 2004 2005 2006 2007 2008p 2009 2010 2011 2012 2013CAGR
2009–13
North America 57,725.0 62,048.0 66,717.0 71,120.0 74,775.0 76,187.0 78,118.0 84,512.0 91,840.0 97,278.0
% Change 9.4% 7.5% 7.5% 6.6% 5.1% 1.9% 2.5% 8.2% 8.7% 5.9% 5.4%
EMEA 53,923.0 58,460.0 63,150.0 68,737.0 74,290.0 76,142.0 78,263.0 82,748.0 89,443.0 96,672.0
% Change 6.3% 8.4% 8.0% 8.8% 8.1% 2.5% 2.8% 5.7% 8.1% 8.1% 5.4%
Asia Pacific 16,805.0 19,168.0 21,365.0 24,596.0 27,530.0 29,698.0. 32,443.0 36,177.0 40,556.0 45,423.0
% Change 11.2% 14.1% 11.5% 15.1% 11.9% 7.9% 9.2% 11.5% 12.1% 12.0% 10.5%
Latin America 5,943.0 6,610.0 7,366.0 8,390.0 9,470.0 9,726.0 10,037.0 10,627.0 11,683.0 12,957.0
% Change 7.9% 11.2% 11.4% 13.9% 12.9% 2.7% 3.2% 5.9% 9.9% 10.9% 6.5%
Total 134,396.0 146,286.0 158,598.0 172,843.0 186,065.0 191,753.0 198,861.0 214,064.0 233,522.0 252,330.0
% Change 8.3% 8.8% 8.4% 9.0% 7.6% 3.1% 3.7% 7.6% 9.1% 8.1% 6.3%
Source: PwC Global Entertainment & Media Outlook 2009-2013
Table 2.8: Global Television Advertising Market by Region (US$ Millions)
Region 2004 2005 2006 2007 2008p 2009 2010 2011 2012 2013CAGR
2009–13North America
68,038.0 68,074.0 72,464.0 71,811.0 71,367.0 61,653.0 62,563.0 62,937.0 68,597.0 69,251.0
% Change 11.6% 0.1% 6.4% –0.9% –0.6% –13.6% 1.5% 0.6% 9.0% 1.0% –0.6%
EMEA 39,924.0 42,272.0 45,087.0 48,755.0 48,876.0 43,403.0 42,715.0 43,324.0 46,384.0 48,850.0
% Change 10.5% 5.9% 6.7% 8.1% 0.2% –11.2% –1.6% 1.4% 7.1% 5.3% 0.0%
Asia Pacific
31,326.0 32,568.0 33,792.0 34,972.0 35,856.0 32,637.0 32,941.0 33,775.0 35,330.0 37,205.0
% Change 8.1% 4.0% 3.8% 3.5% 2.5% –9.0% 0.9% 2.5% 4.6% 5.3% 0.7%
Latin America
6,287.0 7,641.0 8,930.0 10,730.0 12,243.0 11,383.0 11,288.0 11,612.0 12,209.0 13,108.0
% Change 20.2% 21.5% 16.9% 20.2% 14.1% –7.0% –0.8% 2.9% 5.1% 7.4% 1.4%
Total 145,575.0 150,555.0 160,273.0 166,268.0 168,342.0 149,076.0 149,507.0 151,648.0 162,520.0 168,414
% Change 10.8% 3.4% 6.5% 3.7% 1.2% –11.4% 0.3% 1.4% 7.2% 3.6% 0.0%
Source: PwC Global Entertainment & Media Outlook 2009-2013
Indian Television Industry
46
Outlook for the Indian Television Industry 2009-2013
The Indian television industry is projected to grow by 11.4% over the period 2009-13 and is projected to reach an estimated Rs. 420 billion in 2013 from the present estimate of Rs. 245 billion in 2008. No significant shift is projected within the relative shares of the television distribution and television advertising industry over the next five years. Hence, television distribution is projected to garner a share of 60% in 2013; on the other hand, television advertising industry is projected to command a share of 36% in 2013 (34% in 2008). The relative share of the television content industry is expected to remain constant at around 4% though in respect to growth, the television content industry is expected to grow at a CAGR of 13.8%.
Television distribution industry is expected to reach Rs. 250 billion in 2013 from the current estimated size of Rs. 150 billion in 2008, which translates into a growth of 12.2% on cumulative basis over the next five years. The growth in the television distribution industry is expected to be contributed by both subscription spending, by Pay TV subscribers as well as growth in the Pay TV homes (cable and DTH). While the dominant mode of distribution will continue to be cable (80 million households at CAGR 2.4% ) , DTH households will grow to 35 million at a CAGR of 31.2% for the next 5 years. Television advertising industry is expected to reach Rs. 150 billion in 2013 from the current estimated size of Rs. 84.2 billion in 2008, which translates into a growth of 12.2% on cumulative basis over the next five years. The television advertising industry growth is expected to slowdown because of the economic crisis the world is going through. Inspite of the slowdown in growth, India spurred on by domestic demand is still expected to have among the highest growth rates in television advertising along with China.
Television content industry is projected to maintain a growth rate of 11.4% over the next five years and is expected to reach Rs.20 billion in 2013 from its present size of Rs.10.5 billion, fuelled largely by the continued increase in the number of television channels in the country. Moreover, audience fragmentation is expected to further intensify, which will result in greater need for quality content. This will benefit the television content industry.
The growth in the television distribution industry is expected to be contributed by both subscriptions spending by pay TV subscribers as well as growth in the pay TV homes. The pay TV homes are projected to increase from 80 million in 2008 to 115 million in 2013. Currently, cable TV homes command a penetration of 89% of the pay TV homes in 2008. This is projected to come down to 70% by 2013, largely in favour of the emerging DTH homes. Cable homes are projected to increase from 71 million in 2008 to 80 million households in 2013. This growth is projected to be largely from semi-urban and rural areas. DTH homes are projected to grow to 35 million in 20013 from 9 million in 2008, thus increasing their penetration from 8% of the television homes in 2008 to 26% in 2013. Overall, pay television homes are projected to increase from 80 million in 2008 to 115 million by 2013 at a growth rate of 7.5% over the next five years.
PricewaterhouseCooopers I Indian entertainment and media outlook 2009
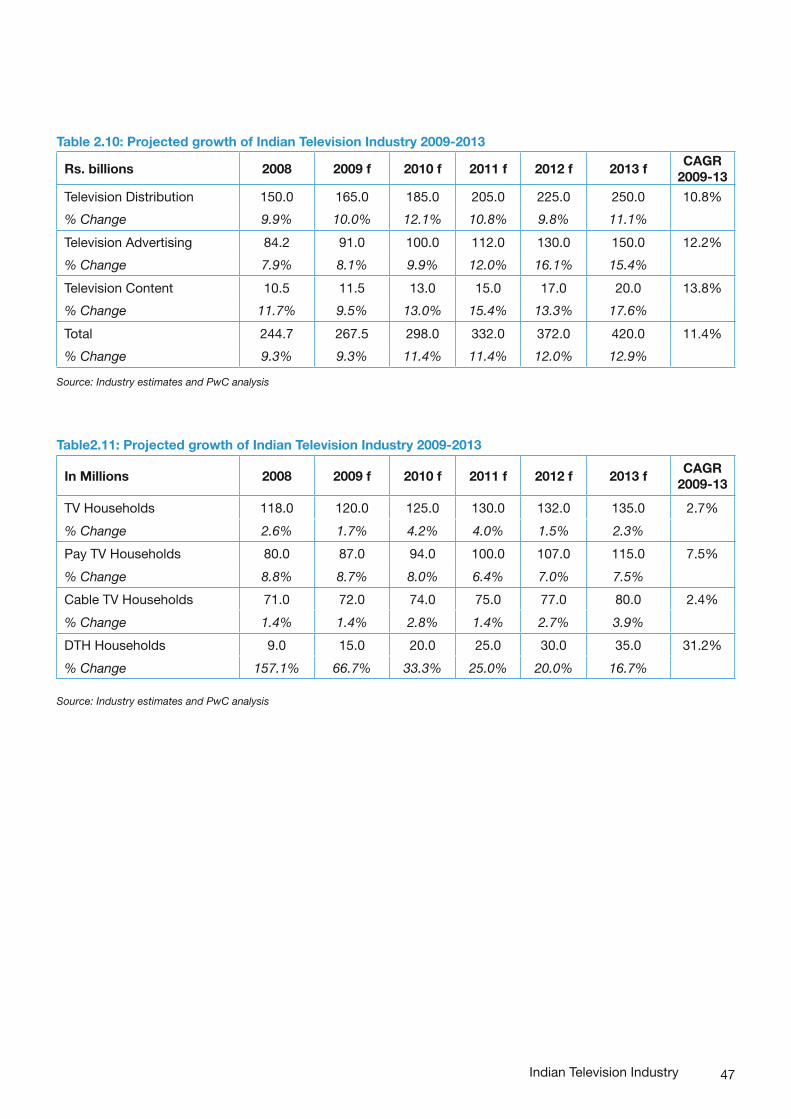
47
Table 2.10: Projected growth of Indian Television Industry 2009-2013
Rs. billions 2008 2009 f 2010 f 2011 f 2012 f 2013 fCAGR
2009-13
Television Distribution 150.0 165.0 185.0 205.0 225.0 250.0 10.8%
% Change 9.9% 10.0% 12.1% 10.8% 9.8% 11.1%
Television Advertising 84.2 91.0 100.0 112.0 130.0 150.0 12.2%
% Change 7.9% 8.1% 9.9% 12.0% 16.1% 15.4%
Television Content 10.5 11.5 13.0 15.0 17.0 20.0 13.8%
% Change 11.7% 9.5% 13.0% 15.4% 13.3% 17.6%
Total 244.7 267.5 298.0 332.0 372.0 420.0 11.4%
% Change 9.3% 9.3% 11.4% 11.4% 12.0% 12.9%
Source: Industry estimates and PwC analysis
Table2.11: Projected growth of Indian Television Industry 2009-2013
In Millions 2008 2009 f 2010 f 2011 f 2012 f 2013 fCAGR
2009-13
TV Households 118.0 120.0 125.0 130.0 132.0 135.0 2.7%
% Change 2.6% 1.7% 4.2% 4.0% 1.5% 2.3%
Pay TV Households 80.0 87.0 94.0 100.0 107.0 115.0 7.5%
% Change 8.8% 8.7% 8.0% 6.4% 7.0% 7.5%
Cable TV Households 71.0 72.0 74.0 75.0 77.0 80.0 2.4%
% Change 1.4% 1.4% 2.8% 1.4% 2.7% 3.9%
DTH Households 9.0 15.0 20.0 25.0 30.0 35.0 31.2%
% Change 157.1% 66.7% 33.3% 25.0% 20.0% 16.7%
Source: Industry estimates and PwC analysis
Indian Television Industry

Indian Print Media Industry
Performance of Indian Print Media Industry in 2008
Impact of the global economic downturn on the Indian Print Media Industry
Key developments in the Indian Print Media Industry in 2008
Key International Trends in the Print Media Industry in 2008
Outlook for the Indian Print Media Industry 2009-2013
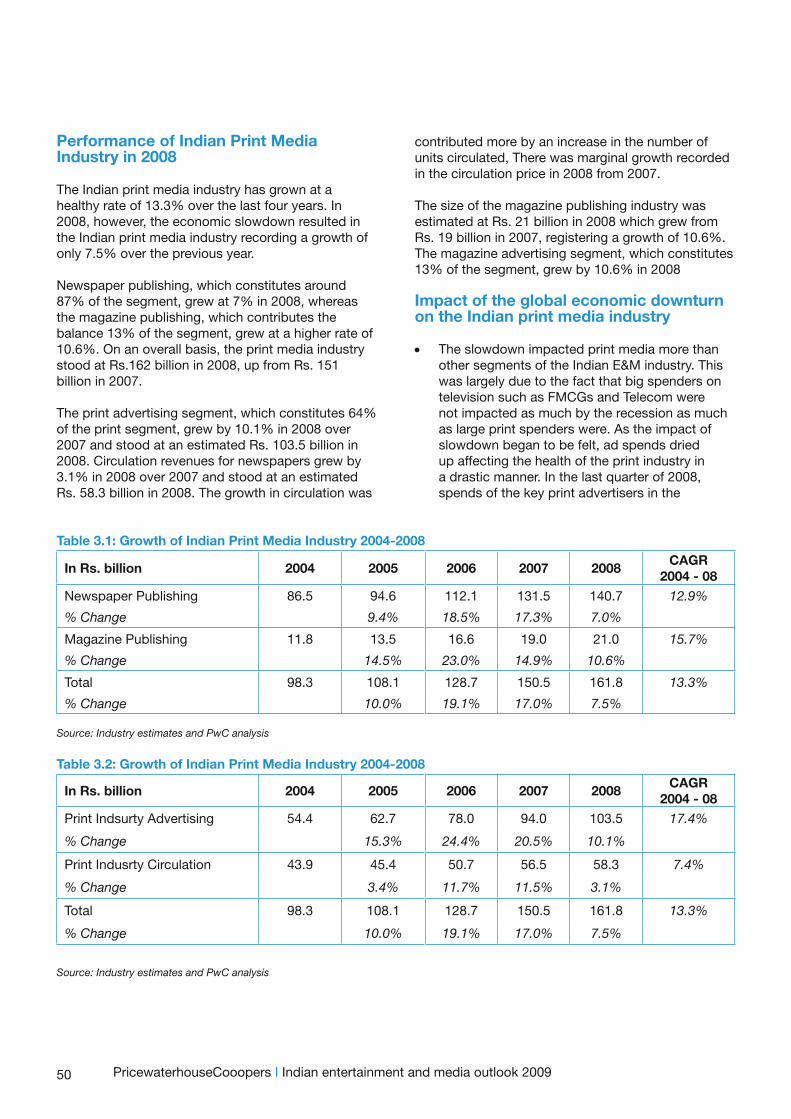
50
Performance of Indian Print Media Industry in 2008
The Indian print media industry has grown at a healthy rate of 13.3% over the last four years. In 2008, however, the economic slowdown resulted in the Indian print media industry recording a growth of only 7.5% over the previous year.
Newspaper publishing, which constitutes around 87% of the segment, grew at 7% in 2008, whereas the magazine publishing, which contributes the balance 13% of the segment, grew at a higher rate of 10.6%. On an overall basis, the print media industry stood at Rs.162 billion in 2008, up from Rs. 151 billion in 2007.
The print advertising segment, which constitutes 64% of the print segment, grew by 10.1% in 2008 over 2007 and stood at an estimated Rs. 103.5 billion in 2008. Circulation revenues for newspapers grew by 3.1% in 2008 over 2007 and stood at an estimated Rs. 58.3 billion in 2008. The growth in circulation was
contributed more by an increase in the number of units circulated, There was marginal growth recorded in the circulation price in 2008 from 2007.
The size of the magazine publishing industry was estimated at Rs. 21 billion in 2008 which grew from Rs. 19 billion in 2007, registering a growth of 10.6%. The magazine advertising segment, which constitutes 13% of the segment, grew by 10.6% in 2008
Impact of the global economic downturn on the Indian print media industry
• The slowdown impacted print media more than other segments of the Indian E&M industry. This was largely due to the fact that big spenders on television such as FMCGs and Telecom were not impacted as much by the recession as much as large print spenders were. As the impact of slowdown began to be felt, ad spends dried up affecting the health of the print industry in a drastic manner. In the last quarter of 2008, spends of the key print advertisers in the
PricewaterhouseCooopers I Indian entertainment and media outlook 2009
Table 3.1: Growth of Indian Print Media Industry 2004-2008
In Rs. billion 2004 2005 2006 2007 2008CAGR
2004 - 08Newspaper Publishing 86.5 94.6 112.1 131.5 140.7 12.9%
% Change 9.4% 18.5% 17.3% 7.0%
Magazine Publishing 11.8 13.5 16.6 19.0 21.0 15.7%
% Change 14.5% 23.0% 14.9% 10.6%
Total 98.3 108.1 128.7 150.5 161.8 13.3%
% Change 10.0% 19.1% 17.0% 7.5%
Source: Industry estimates and PwC analysis
Table 3.2: Growth of Indian Print Media Industry 2004-2008
In Rs. billion 2004 2005 2006 2007 2008CAGR
2004 - 08Print Indsurty Advertising 54.4 62.7 78.0 94.0 103.5 17.4%
% Change 15.3% 24.4% 20.5% 10.1%
Print Indusrty Circulation 43.9 45.4 50.7 56.5 58.3 7.4%
% Change 3.4% 11.7% 11.5% 3.1%
Total 98.3 108.1 128.7 150.5 161.8 13.3%
% Change 10.0% 19.1% 17.0% 7.5%
Source: Industry estimates and PwC analysis
51
categories of realty, banking/finance, IT/telecom and durables nosedived and some of these categories totally stopped spending.
• Another issue which has added to the woes of the newspaper industry is rising newsprint costs. The price of newsprint, imported or indigenous, touched $1,000 per tonne in April 2008, and this after a 23 per cent increase over the previous four months that took prices to $760 a tonne in March 2008. Thus, newsprint prices, which typically account for 50 to 60 per cent of production costs, rose over 60 per cent over a period of six months. This hit margins of print players very significantly.
• The print media industry has beenhence resorting to downsizing, as ad revenues have slowed down dramatically. Many newspapers/publications decided to shut down certain offices/editions. For example, the Business Standard decided to wind up its Gujarati edition, and Jagran put on hold its expansion plans for new editions and launches in new markets.
• Magazines have discontinued supplements earlier distributed free of cost with the main product, while new entrants have delayed or shelved launch plans. Newspapers and publications have also reduced the number of pages to cope with the recession.
• Despite having the stable government, risks abound with continued slowdown in the economy, which may dry advertisement spending. Upward movement in newsprint prices may put a further pressure on margins.
Key Developments in the Indian print media industry in 2008
New publications launched
• Magazine publishing segment saw the maximum activity with launch of several new titles. The most notable of the magazine launched was that of Forbes India in May 2009 by Network18 and Forbes Media combine.
• There were several niche titles that were launched in 2008. These include: ○ RPG Group’s ‘Open’ a weekly magazine
aimed at addressing the needs of evolved Indian readers who are well-informed, well-
traveled and identify themselves as global citizens. It is available in 12 cities
○ Pathfinder Publishing’s maiden title Career’s 360 a monthly publication from Pathfinder, focusing on the career for the people between the age of 17-35
○ Technology Review a technology magazine launched in India jointly by MIT’s Technology Review magazine and CyberMedia India Ltd.
○ Hearst Corporation’s Harper’s Bazaar a fashion and beauty magazine in partnership with India Today
○ The relaunch of Delhi Press’ The Caravan a fortnightly magazine that covers politics, culture, arts and literature.
○ Images Group’s FNL and Salon and Living etc. an Indian edition of international homes magazine
○ Gill India Communications’ What Women Want a woman’s magazine for women aged between 20 and 45 years and ‘Lifestyle Living’ a lifestyle magazine dedicated to those with a creative and edgy lifestyle.
• Springer India has 12 proposals pending with the central government for the launch of Indian editions of its specialist international publications in areas such as orthopedic, neurology, cancer and intensive care.
• Newspaper publishers also launched new editions, though most were in the early part of 2008 before the impact of the global slowdown was felt. Dainik Bhaskar launched the 12th edition of its Hindi financial daily Business Bhaskar, while Jagran Prakashan has launched I-Next and City Plus papers. Lokmat was launched in Goa, while Financial Chronicle, which has a tie-up with International Herald Tribune, was launched in Delhi. Mint the English business daily from HT Media launched new editions in Kolkata and Chennai.
• Regional publications continued their growth momentum. Marathi daily Pudhari continued to expand its footprint across Maharashtra inspite of the slowdown. The publication announced plans for launch of its 11th edition in 2009 in Mumbai followed by editions in Aurangabad, Nasik and Nagpur.
Indian Print Media Industry
52
New revenue streams for publishers
• Print media companies have started diversifying their revenue streams and have been entering related business sectors to offset the lower margins. Recent examples include :
• Jagran Prakashan, publishers of ragional Hindi newspaper Dainik Jagran, launched an out-of-home (OOH) media and event management company.
• Mint, the English business daily of the HT Media Group partnered with business television leader CNBC-TV18.
• HT Media, publisher of national English newspaper Hindustan Times and regional Hindi newspaper Hindustan, launched a job portal called shine.com, and also entered the high-end magazine and catalogue printing segments. HT Media had earlier diversified into radio with the launch of Fever104 FM radio channel and also launched an English business newspaper Mint.
• Deccan Chronicle ventured into IPL by investing in a franchisee Deccan Chargers in 2008. Deccan Chronicle also launched Odyssey Bookstores and various assorted internet ventures.
M&A and Investments in Print Media in 2008
Not much significant deal activity occurred in 2008 in the print media industry in 2008. Bennett Coleman acquiring a 12% stake in Sandesh, a Gujarati daily was the only notable deal in 2008. Additionally, Infomedia18, a TV18-owned publishing company, raised up to Rs 1 billion through a rights issue in 2008.
Key Government Initiatives
• In December 2008, the Indian Government had unveiled a set of guidelines for allowing publication of Indian editions of foreign news and current affairs magazines, to be allowed 26 per cent FDI as long as all key executives and editorial staff are Indians. Similarly, a 100% percent slab is now allowed for special interest publications.
PricewaterhouseCooopers I Indian entertainment and media outlook 2009
• During the year, the Ministry of Information & Broadcasting has for the first time given approval for the publication of the facsimile edition of foreign newspapers by allowing the publication of ‘The Wall Street Journal’ and ‘The Wall Street Journal Asia’ in India. The aforementioned newspapers would be brought out by Wall Street Journal India Publishing Pvt Ltd, a wholly owned subsidiary of Dow Jones and Company Inc., USA.
• Government has announced customs duty exemption on newsprint for the newspaper and magazine publishing industry. These concessions were announced in Feb 2009 in view of the current economic slowdown and the high newsprint cost which spiralled close to 25%.
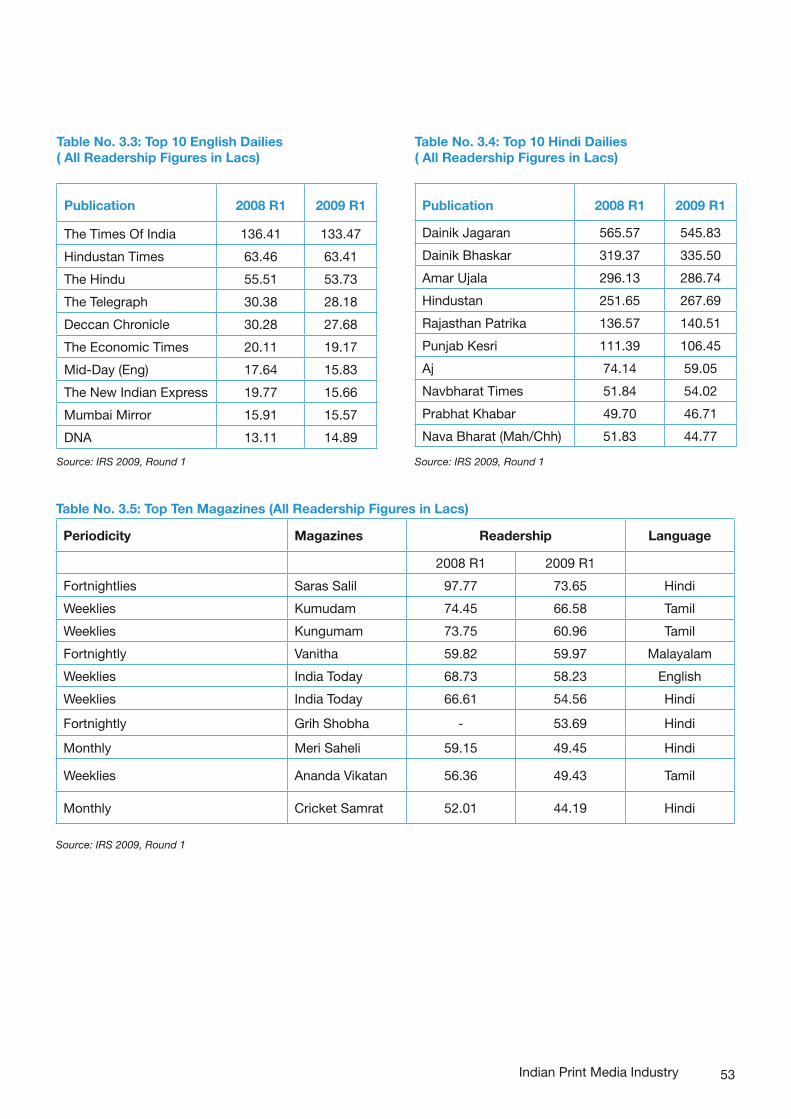
53Indian Print Media Industry
Table No. 3.3: Top 10 English Dailies ( All Readership Figures in Lacs)
Publication 2008 R1 2009 R1
The Times Of India 136.41 133.47
Hindustan Times 63.46 63.41
The Hindu 55.51 53.73
The Telegraph 30.38 28.18
Deccan Chronicle 30.28 27.68
The Economic Times 20.11 19.17
Mid-Day (Eng) 17.64 15.83
The New Indian Express 19.77 15.66
Mumbai Mirror 15.91 15.57
DNA 13.11 14.89
Source: IRS 2009, Round 1
Table No. 3.4: Top 10 Hindi Dailies ( All Readership Figures in Lacs)
Publication 2008 R1 2009 R1
Dainik Jagaran 565.57 545.83
Dainik Bhaskar 319.37 335.50
Amar Ujala 296.13 286.74
Hindustan 251.65 267.69
Rajasthan Patrika 136.57 140.51
Punjab Kesri 111.39 106.45
Aj 74.14 59.05
Navbharat Times 51.84 54.02
Prabhat Khabar 49.70 46.71
Nava Bharat (Mah/Chh) 51.83 44.77
Source: IRS 2009, Round 1
Table No. 3.5: Top Ten Magazines (All Readership Figures in Lacs)
Periodicity Magazines Readership Language
2008 R1 2009 R1
Fortnightlies Saras Salil 97.77 73.65 Hindi
Weeklies Kumudam 74.45 66.58 Tamil
Weeklies Kungumam 73.75 60.96 Tamil
Fortnightly Vanitha 59.82 59.97 Malayalam
Weeklies India Today 68.73 58.23 English
Weeklies India Today 66.61 54.56 Hindi
Fortnightly Grih Shobha - 53.69 Hindi
Monthly Meri Saheli 59.15 49.45 Hindi
Weeklies Ananda Vikatan 56.36 49.43 Tamil
Monthly Cricket Samrat 52.01 44.19 Hindi
Source: IRS 2009, Round 1
54
Outlook for Newspaper Publishing in the Digital Age
The newspaper publishing industry is facing a structural challenge in which paid titles have seen a long-term decline in circulation volume while advertisers have been moving from newspapers to online channels and into new formats. These trends are forecast to continue, and structural changes are now being exacerbated and accelerated by the global economic downturn. How can newspaper publishers successfully address these challenges? Our research shows that:
• Although there is a huge potential for growth online, print remains the largest source of revenue generation for newspaper publishers, and will continue to be so for some time.
• Newspapers have a long-term future and will coexist with other media. However this is unlikely to be either in the formats or volumes seen today and there will some casualties and losses of well-known papers along the way.
• Consumers place high value on the deep insight and analysis provided by journalists over and above general or breaking news stories.
• Consumers see breaking news and general interest news as commodities, but there is always a market for high value online content in specific topics. Our consumer research indicates that consumers are willing to pay for this content, but newspapers need to develop strategies for monetising their content and intellectual capital.
• Newspapers have been able to earn their readers’ trust and loyalty, giving them the opportunity to both lead and follow audiences as they migrate online and into the use of portable electronic media. Indeed, with the core principles of deep analysis and trusted editorial, the medium is secondary to the brand.
• Use of video in online news sites gives the feel of a ‘TV-like’ experience (consumers’ favourite medium for news) giving newspaper brands the opportunity to secure online audiences beyond their print readership and into the television audience more generally.
• Newspaper publishers have responded to the economic downturn by increasing their focus on cost reduction. Many are also using multiple platforms and new technologies as channels for content distribution in order to
reach their audiences. However, many have still to fully review their existing business models to take full advantage of the innovation in the marketplace and the demands of consumers.
• The rapid adoption of the Internet and mobile technology have created a market for mobile devices – particularly for the ‘net generation’, those under 35 in age. Though the devices give immediate access to breaking news and information, they are low on the list of preferences for accessing information due to the difficulty of reading content on the devices.
• Sustainability has increased in importance both for the newspaper publishers and for their readers, who attach high values to a publishing company using sustainable production methods. Some newspapers have addressed this issue, but many have not.
• For advertisers, access to mass markets remains key, so major newspaper brands with large loyal customer bases will be high on the spending plans of advertisers. The overall shift from print to online will continue however, so newspaper publishers must continue to develop innovative advertising packages combining both print and online to secure the advertising spend for their brands.
• Niche audiences continue to demand specialised, targeted and relevant information. This creates both an opportunity for advertisers to reach their consumers and for newspapers to develop ‘hyper-local’ or ‘local-local’ sites addressing content at the neighborhood and suburban level. This is particularly prevalent in the USA.
Source : PwC’s Outlook for Newspaper Publishing in the Digital
Age
Outlook for Magazine Publishing in the Digital Age
The global publishing industry is undergoing major changes. A growing number of people are migrating from the printed page to the Internet for information and entertainment. So what should consumer magazine publishers and media buyers do to succeed in the digital age? We have looked at how the behaviour of consumers is shifting, and how the industry leaders are responding. Our research shows that:
PricewaterhouseCooopers I Indian entertainment and media outlook 2009
55
• Most consumers still prefer to read hard copies of magazines, but many are also interested in reading digital content (by which we mean interactive materials, not PDFs or other static formats which can be viewed online) – and younger consumers would rather access content digitally.
• A significant number of consumers also express interest in using new digital devices to read digital content, once these devices are commercially available.
• However, consumers expect to pay more for printed content than for content distributed electronically. Indeed, our research suggests that they are not prepared to pay more than half the sum they would pay for a printed magazine.
• Moreover, many consumers see digital-only content as a substitute for printed content. So any magazine publisher which launches digital content connected to its brands risks cannibalising subscription and circulation revenues from its traditional print magazines. However, there is no evidence thus far that consumer magazine print products have been cannibalized by the presence of digital versions of the magazine on the title’s website. This fear may therefore be groundless.
• A number of magazine publishers have responded to the digital revolution by reshuffling their portfolios through acquisitions, disposals and new launches, or by forming strategic alliances to get access to the skills they need. As progress in developing digital media is being made in mainland Europe, Britain and in North America, we see Eastern European publishers continuing to build up their print portfolios, as this relatively new industry develops.
• British and North American magazine publishers expect to generate as much as 20% of their total revenues from digital platforms within the next five years, whereas mainland European publishers expect to generate only 10% of their revenues from online activities. This reflects consumers’ willingness to pay for digital content in these markets. According to third party research, smaller publishers in Britain and in North America are far ahead of their mainland European counterparts in digital investment and development.
• The magazine publishers that have proved most successful in entering the digital space are those that have been able to leverage strong brands across multiple media platforms and generate revenues from online advertising, search-engine marketing and e-commerce. In short, they have recognized that digital media require different business models from those they have developed to support their traditional print operations.
• However, only a few magazine publishers seem to have developed business models which make these activities self-supporting. If they are to ensure that they are ready to accommodate the changing preferences of consumers, they will need to consider their future investment plans (and the potential impact on their financial situation) very carefully.
• Most magazine publishers may also have to make major organizational changes. Traditional publishers typically organise their operations around different media types, whereas consumers use multiple channels. If these publishers are to stay close to their readers, they may need to integrate their operations and hire employees with the right blend of creative and technological skills.
• The digital age could have equally significant consequences for advertising agencies. The traditional agencies have already acquired new skills, but many still need to build truly multi-functional teams capable of offering multimedia solutions rather than focusing on a particular medium.
• Both magazine publishers and media buyers will also have to invest in developing effective consumer-tracking and measurement systems. Lack of robust consumer metrics has exposed companies in both sectors to competition from new entrants, some of which (like auFeminin.com and Google) have been very successful.
Source : PwC’s Outlook for Magazine Publishing in the Digital
Age
Indian Print Media Industry
56
Key International Trends in the Print Media Industry in 2008
Newspaper Publishing
Global outlook
• Globally, the newspaper market will decline by 10.2 percent in 2009, and average a 2 percent compound annual decrease to $164.6 billion in 2013 from $182.4 billion in 2008.
• Print advertising will remain the largest component of the newspaper market throughout the forecast period, despite being the most severely impacted by the economic downturn. Global print advertising fell by 8.7 percent in 2008 and will decline by an additional 24 percent during the next three years, from $104.8 billion in 2008 to $83.5 billion in 2013, a 4.5 percent compound annual decrease.
• As a result of this decline, the proportion of total newspaper revenues accounted for by print advertising will fall from 57 percent in 2008 to 51 percent in 2013.
• Digital advertising on newspaper web sites will increase at a 6.8 percent compound annual rate to $8.3 billion in 2013 from $6 billion in 2008, increasing its share of total newspaper advertising to 9.1 percent from 5.4 percent in 2008.
• This growth in digital advertising will not be enough to offset decline in print advertising, and total newspaper advertising will fall from $110.8 billion in 2008 to $91.8 billion in 2013, a 3.7 percent compound annual decline.
• Global circulation spending will fall a little in 2009 and 2010, but will more than recover the lost ground in the following three years, rising to $72.8 billion in 2013 from $71.6 billion in 2008, a 0.3 percent compound annual increase.
Regional growth:
• Spending in EMEA, the largest newspaper market at $73.1 billion in 2008, will decline by 8.8 percent in 2009 and at a 1.6 percent compound annual rate over the five-year forecast period to $67.5 billion in 2013.
• Spending in North America will fall more sharply, contracting by 17.7 percent in 2009 and at a 5.8 percent compound annual rate through 2013, falling from $50.8 billion to $37.7 billion.
• Asia Pacific will record a more modest 5.8 percent decrease in 2009, and renewed growth during 2011-13 will lead to an overall 0.1 percent compound annual gain to $51.9 billion from $51.7 billion in 2008.
• Latin America will have the best-performing market during the next five years, with a projected 1.9 percent compound annual increase, although it too will experience decline during the next two years. Spending in Latin America will increase from $6.8 billion in 2008 to $7.5 billion in 2013.
Key drivers
• The economic downturn will lead to sharp declines in print advertising in all regions in 2009, with further decrease expected in 2010.
• However, improved economic conditions during the latter part of the forecast period will lead to a modest recovery during 2012-13 in all regions.
• The re-bound will be muted by continuing migration of advertising, particularly classified advertising, to the Internet. But rising web site traffic will boost digital advertising.
• Decline in paid circulation in North America and EMEA will adversely affect circulation spending, while rising circulation in Latin America, India, the People’s Republic of China and several other territories in Asia Pacific will boost paid circulation spending. Latin America will out perform other regions because newspapers face less competition from the Internet.
• Decline in circulation of free papers in response to the drop in advertising will further depress print advertising in the near term in North America and EMEA.
Consumer Magazine Publishing
Global Outlook
• Globally, overall spending on consumer magazine publishing will decline during the next two years by a cumulative 12 percent, before rebounding by 8.7 percent during the subsequent three years.
• Following this partial recovery, spending will total $76.8 billion in 2013, down 0.9 percent compounded annually from $80.3 billion in 2008.
• Global print advertising will be the component hit hardest by the economic downturn. A cumulative three-year drop of 23.4 percent in 2008-2010 will be followed by a recovery totaling 11.4 percent in 2011-2013. By 2013, print advertising spending
PricewaterhouseCooopers I Indian entertainment and media outlook 2009
57
of $30.2 billion will be 2.3 percent lower on a compound annual basis than the $33.8 billion spent in 2008.
• In contrast, digital advertising on magazine Web sites and mobile sites will rise strongly from a relatively low base, rising from $1.3 billion in 2008 to $3.1 billion in 2013, an 18.3 percent compound annual increase.
• As a result, digital advertising will account for 9.3 percent of total consumer magazine advertising in 2013, up from 3.8 percent in 2008.
• However, digital growth will not be enough to offset the print decline, and total magazine advertising will drop from $35.2 billion in 2008 to $33.3 billion in 2013, a 1.1 percent compound annual decline.
• Circulation spending will decline through to 2011 before recovering, and will stand at $43.5 billion in 2013, 0.7 percent lower on a compound annual basis from $45.1 billion in 2008.
Regional growth
• In each region except Latin America, declines during the next two years will be steeper than the subsequent rebound, leading to lower spending in 2013 than in 2008.
• EMEA will remain the largest region throughout the forecast period, despite falling by 7.5 percent in 2009 and at a 0.7 percent compound annual rate over the five years, slipping to $35 billion in 2013 from $36.2 billion in 2008.
• In North America, spending will fall by 13.5 percent in 2009 and by 1.7 percent compounded annually through 2013 to $22.6 billion, from $24.5 billion in 2008.
• The Asia Pacific market will decline by 8 percent in 2009, and by 0.6 percent compounded annually over the five years to $15.7 billion in 2013 from $16.2 billion in 2008.
• In Latin America, gains during 2011–13 will offset the near-term declines, and spending will rise by 1.3 percent compounded annually to $3.6 billion in 2013 from $3.4 billion in 2008.
Key Drivers
• The economic environment will be the principal driver of consumer magazine publishing, leading to steep decreases in the near term and a subsequent rebound when economic conditions improve.
• Migration of advertising and readers from print to
digital will dampen print advertising over the long run while benefiting an emerging digital market. Broadband household growth and an expanding mobile access market will also fuel digital advertising.
• Newsstand sales will be particularly vulnerable to the economic cycle in many countries during the next two years, and subscription sales will also be at risk when they are due for renewal.
• Rising discretionary income during the latter part of the forecast period will lead to a rebound in circulation spending.
Indian Print Media Industry
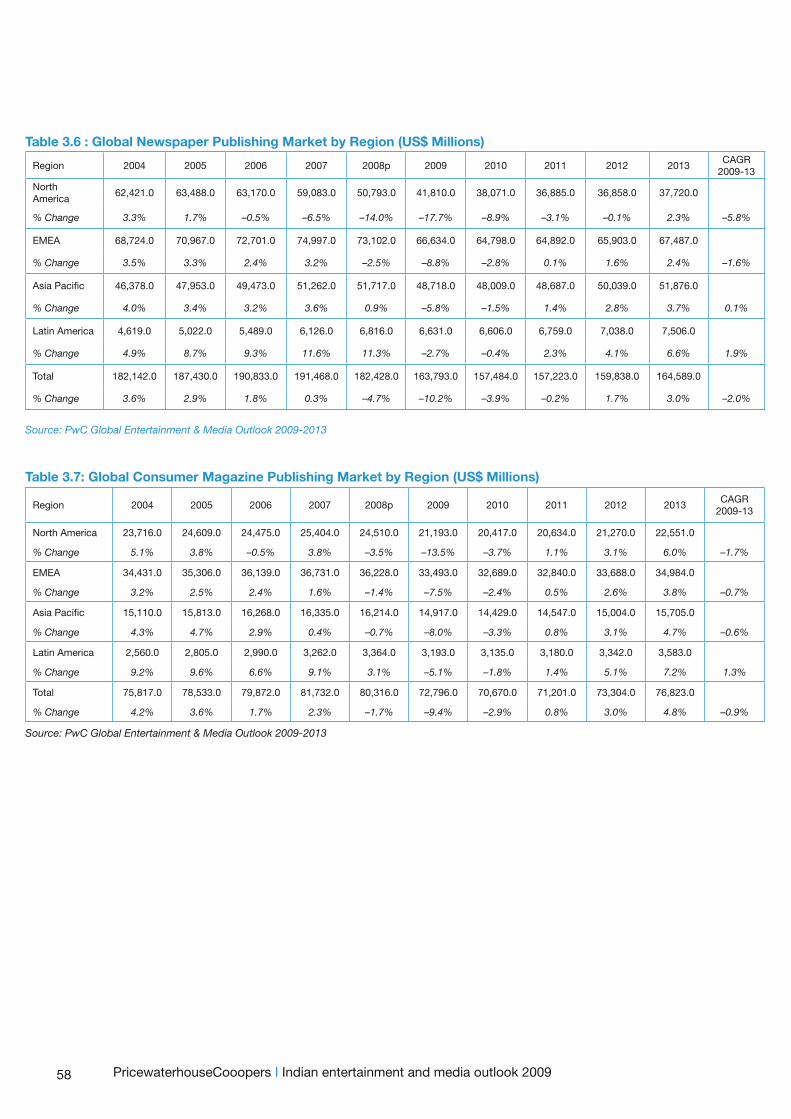
58
Table 3.6 : Global Newspaper Publishing Market by Region (US$ Millions)
Region 2004 2005 2006 2007 2008p 2009 2010 2011 2012 2013CAGR
2009-13
North America
62,421.0 63,488.0 63,170.0 59,083.0 50,793.0 41,810.0 38,071.0 36,885.0 36,858.0 37,720.0
% Change 3.3% 1.7% –0.5% –6.5% –14.0% –17.7% –8.9% –3.1% –0.1% 2.3% –5.8%
EMEA 68,724.0 70,967.0 72,701.0 74,997.0 73,102.0 66,634.0 64,798.0 64,892.0 65,903.0 67,487.0
% Change 3.5% 3.3% 2.4% 3.2% –2.5% –8.8% –2.8% 0.1% 1.6% 2.4% –1.6%
Asia Pacific 46,378.0 47,953.0 49,473.0 51,262.0 51,717.0 48,718.0 48,009.0 48,687.0 50,039.0 51,876.0
% Change 4.0% 3.4% 3.2% 3.6% 0.9% –5.8% –1.5% 1.4% 2.8% 3.7% 0.1%
Latin America 4,619.0 5,022.0 5,489.0 6,126.0 6,816.0 6,631.0 6,606.0 6,759.0 7,038.0 7,506.0
% Change 4.9% 8.7% 9.3% 11.6% 11.3% –2.7% –0.4% 2.3% 4.1% 6.6% 1.9%
Total 182,142.0 187,430.0 190,833.0 191,468.0 182,428.0 163,793.0 157,484.0 157,223.0 159,838.0 164,589.0
% Change 3.6% 2.9% 1.8% 0.3% –4.7% –10.2% –3.9% –0.2% 1.7% 3.0% –2.0%
Source: PwC Global Entertainment & Media Outlook 2009-2013
Table 3.7: Global Consumer Magazine Publishing Market by Region (US$ Millions)
Region 2004 2005 2006 2007 2008p 2009 2010 2011 2012 2013CAGR
2009-13
North America 23,716.0 24,609.0 24,475.0 25,404.0 24,510.0 21,193.0 20,417.0 20,634.0 21,270.0 22,551.0
% Change 5.1% 3.8% –0.5% 3.8% –3.5% –13.5% –3.7% 1.1% 3.1% 6.0% –1.7%
EMEA 34,431.0 35,306.0 36,139.0 36,731.0 36,228.0 33,493.0 32,689.0 32,840.0 33,688.0 34,984.0
% Change 3.2% 2.5% 2.4% 1.6% –1.4% –7.5% –2.4% 0.5% 2.6% 3.8% –0.7%
Asia Pacific 15,110.0 15,813.0 16,268.0 16,335.0 16,214.0 14,917.0 14,429.0 14,547.0 15,004.0 15,705.0
% Change 4.3% 4.7% 2.9% 0.4% –0.7% –8.0% –3.3% 0.8% 3.1% 4.7% –0.6%
Latin America 2,560.0 2,805.0 2,990.0 3,262.0 3,364.0 3,193.0 3,135.0 3,180.0 3,342.0 3,583.0
% Change 9.2% 9.6% 6.6% 9.1% 3.1% –5.1% –1.8% 1.4% 5.1% 7.2% 1.3%
Total 75,817.0 78,533.0 79,872.0 81,732.0 80,316.0 72,796.0 70,670.0 71,201.0 73,304.0 76,823.0
% Change 4.2% 3.6% 1.7% 2.3% –1.7% –9.4% –2.9% 0.8% 3.0% 4.8% –0.9%
Source: PwC Global Entertainment & Media Outlook 2009-2013
PricewaterhouseCooopers I Indian entertainment and media outlook 2009
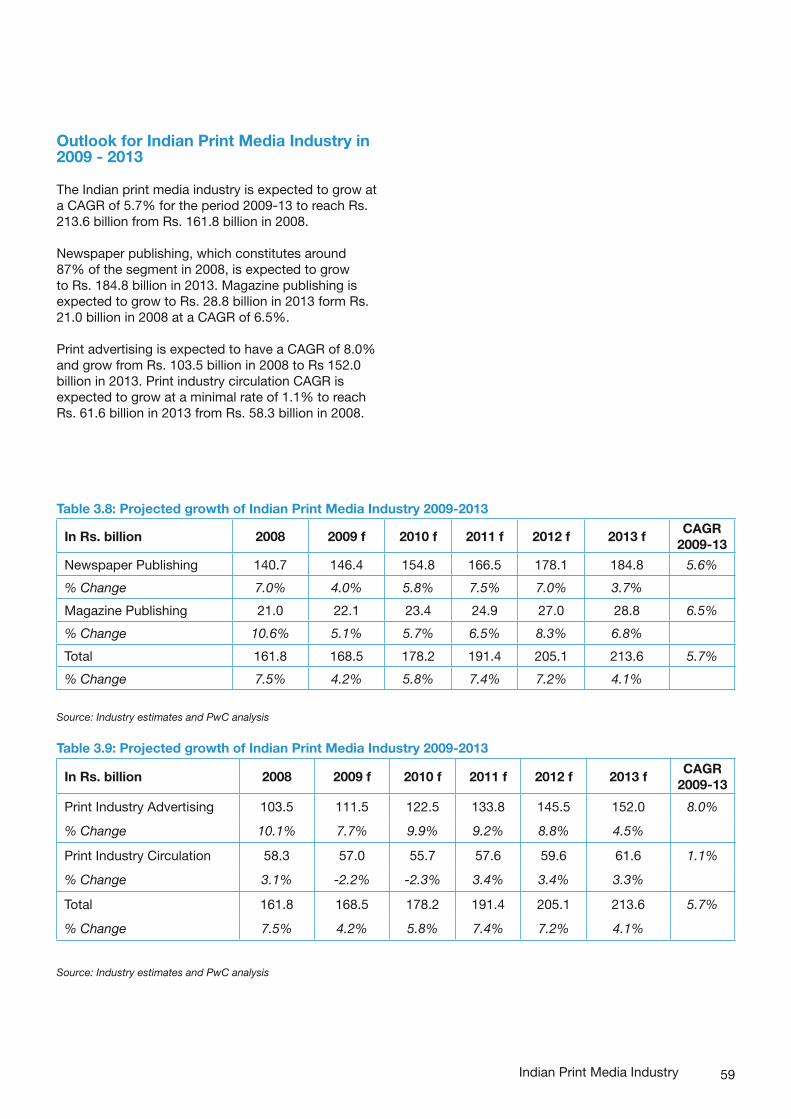
59
Outlook for Indian Print Media Industry in 2009 - 2013
The Indian print media industry is expected to grow at a CAGR of 5.7% for the period 2009-13 to reach Rs. 213.6 billion from Rs. 161.8 billion in 2008.
Newspaper publishing, which constitutes around 87% of the segment in 2008, is expected to grow to Rs. 184.8 billion in 2013. Magazine publishing is expected to grow to Rs. 28.8 billion in 2013 form Rs. 21.0 billion in 2008 at a CAGR of 6.5%.
Print advertising is expected to have a CAGR of 8.0% and grow from Rs. 103.5 billion in 2008 to Rs 152.0 billion in 2013. Print industry circulation CAGR is expected to grow at a minimal rate of 1.1% to reach Rs. 61.6 billion in 2013 from Rs. 58.3 billion in 2008.
Table 3.8: Projected growth of Indian Print Media Industry 2009-2013
In Rs. billion 2008 2009 f 2010 f 2011 f 2012 f 2013 fCAGR
2009-13
Newspaper Publishing 140.7 146.4 154.8 166.5 178.1 184.8 5.6%
% Change 7.0% 4.0% 5.8% 7.5% 7.0% 3.7%
Magazine Publishing 21.0 22.1 23.4 24.9 27.0 28.8 6.5%
% Change 10.6% 5.1% 5.7% 6.5% 8.3% 6.8%
Total 161.8 168.5 178.2 191.4 205.1 213.6 5.7%
% Change 7.5% 4.2% 5.8% 7.4% 7.2% 4.1%
Source: Industry estimates and PwC analysis
Table 3.9: Projected growth of Indian Print Media Industry 2009-2013
In Rs. billion 2008 2009 f 2010 f 2011 f 2012 f 2013 fCAGR
2009-13
Print Industry Advertising 103.5 111.5 122.5 133.8 145.5 152.0 8.0%
% Change 10.1% 7.7% 9.9% 9.2% 8.8% 4.5%
Print Industry Circulation 58.3 57.0 55.7 57.6 59.6 61.6 1.1%
% Change 3.1% -2.2% -2.3% 3.4% 3.4% 3.3%
Total 161.8 168.5 178.2 191.4 205.1 213.6 5.7%
% Change 7.5% 4.2% 5.8% 7.4% 7.2% 4.1%
Source: Industry estimates and PwC analysis
Indian Print Media Industry

Indian Filmed Entertainment Industry
Performance of the Indian Filmed Entertainment Industry in 2008
Impact of global economic slowdown on the Indian Filmed Entertainment industry
Key developments in the Indian Filmed Entertainment Industry in 2008
Key International Trends in the Filmed Entertainment Industry in 2008
Outlook for the Indian Filmed EntertainmentIndustry 2009-2013
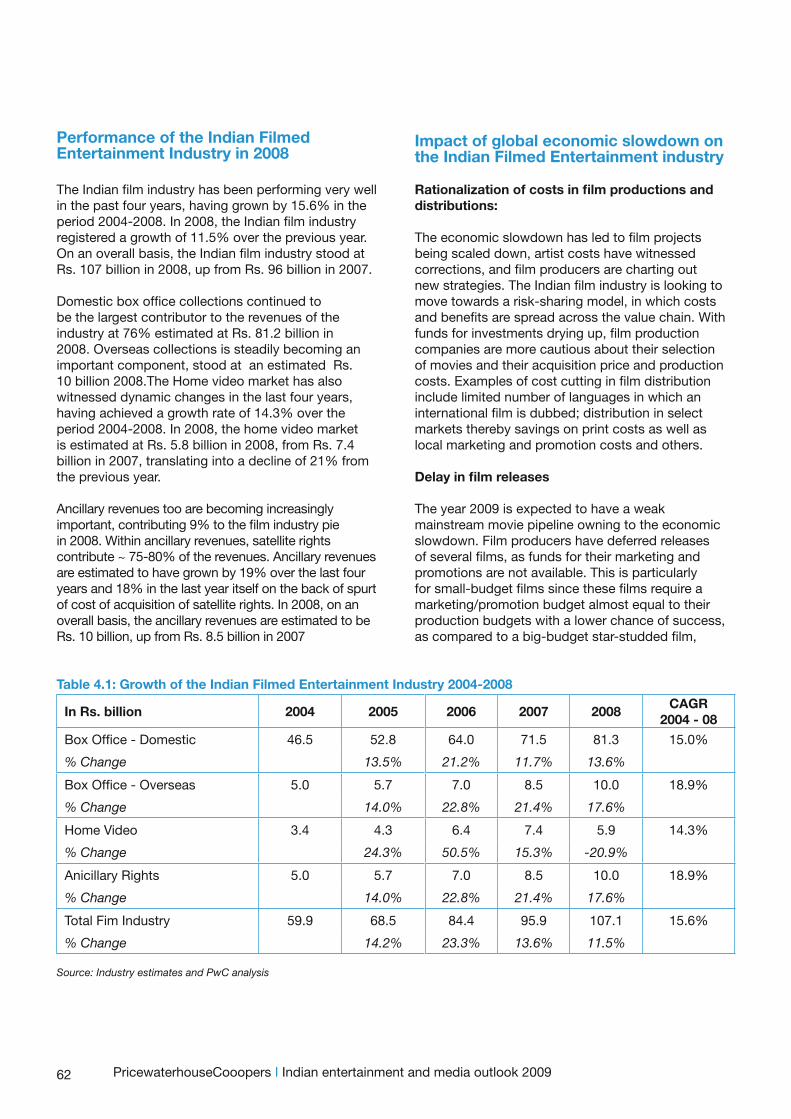
62
Performance of the Indian Filmed Entertainment Industry in 2008
The Indian film industry has been performing very well in the past four years, having grown by 15.6% in the period 2004-2008. In 2008, the Indian film industry registered a growth of 11.5% over the previous year. On an overall basis, the Indian film industry stood at Rs. 107 billion in 2008, up from Rs. 96 billion in 2007.
Domestic box office collections continued to be the largest contributor to the revenues of the industry at 76% estimated at Rs. 81.2 billion in 2008. Overseas collections is steadily becoming an important component, stood at an estimated Rs. 10 billion 2008.The Home video market has also witnessed dynamic changes in the last four years, having achieved a growth rate of 14.3% over the period 2004-2008. In 2008, the home video market is estimated at Rs. 5.8 billion in 2008, from Rs. 7.4 billion in 2007, translating into a decline of 21% from the previous year.
Ancillary revenues too are becoming increasingly important, contributing 9% to the film industry pie in 2008. Within ancillary revenues, satellite rights contribute ~ 75-80% of the revenues. Ancillary revenues are estimated to have grown by 19% over the last four years and 18% in the last year itself on the back of spurt of cost of acquisition of satellite rights. In 2008, on an overall basis, the ancillary revenues are estimated to be Rs. 10 billion, up from Rs. 8.5 billion in 2007
PricewaterhouseCooopers I Indian entertainment and media outlook 2009
Table 4.1: Growth of the Indian Filmed Entertainment Industry 2004-2008
In Rs. billion 2004 2005 2006 2007 2008CAGR
2004 - 08
Box Office - Domestic 46.5 52.8 64.0 71.5 81.3 15.0%
% Change 13.5% 21.2% 11.7% 13.6%
Box Office - Overseas 5.0 5.7 7.0 8.5 10.0 18.9%
% Change 14.0% 22.8% 21.4% 17.6%
Home Video 3.4 4.3 6.4 7.4 5.9 14.3%
% Change 24.3% 50.5% 15.3% -20.9%
Anicillary Rights 5.0 5.7 7.0 8.5 10.0 18.9%
% Change 14.0% 22.8% 21.4% 17.6%
Total Fim Industry 59.9 68.5 84.4 95.9 107.1 15.6%
% Change 14.2% 23.3% 13.6% 11.5%
Source: Industry estimates and PwC analysis
Impact of global economic slowdown on the Indian Filmed Entertainment industry
Rationalization of costs in film productions and distributions:
The economic slowdown has led to film projects being scaled down, artist costs have witnessed corrections, and film producers are charting out new strategies. The Indian film industry is looking to move towards a risk-sharing model, in which costs and benefits are spread across the value chain. With funds for investments drying up, film production companies are more cautious about their selection of movies and their acquisition price and production costs. Examples of cost cutting in film distribution include limited number of languages in which an international film is dubbed; distribution in select markets thereby savings on print costs as well as local marketing and promotion costs and others.
Delay in film releases
The year 2009 is expected to have a weak mainstream movie pipeline owning to the economic slowdown. Film producers have deferred releases of several films, as funds for their marketing and promotions are not available. This is particularly for small-budget films since these films require a marketing/promotion budget almost equal to their production budgets with a lower chance of success, as compared to a big-budget star-studded film,
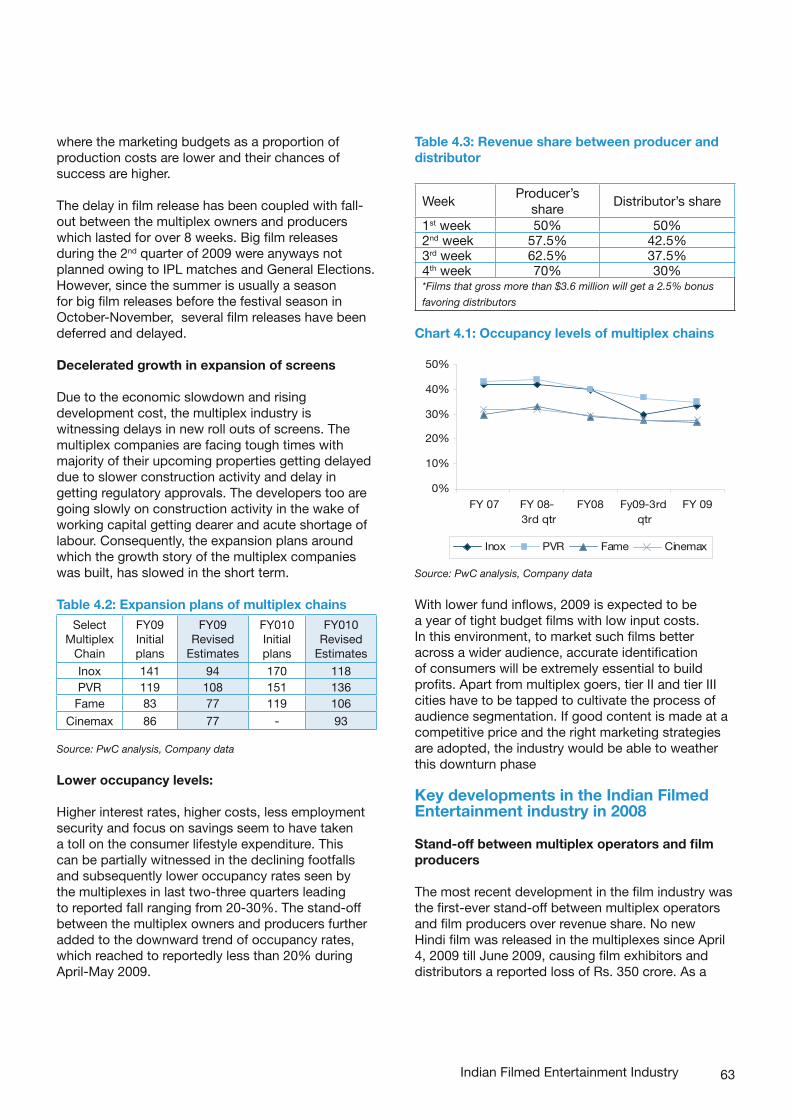
63
where the marketing budgets as a proportion of production costs are lower and their chances of success are higher.
The delay in film release has been coupled with fall-out between the multiplex owners and producers which lasted for over 8 weeks. Big film releases during the 2nd quarter of 2009 were anyways not planned owing to IPL matches and General Elections. However, since the summer is usually a season for big film releases before the festival season in October-November, several film releases have been deferred and delayed.
Decelerated growth in expansion of screens
Due to the economic slowdown and rising development cost, the multiplex industry is witnessing delays in new roll outs of screens. The multiplex companies are facing tough times with majority of their upcoming properties getting delayed due to slower construction activity and delay in getting regulatory approvals. The developers too are going slowly on construction activity in the wake of working capital getting dearer and acute shortage of labour. Consequently, the expansion plans around which the growth story of the multiplex companies was built, has slowed in the short term.
Table 4.2: Expansion plans of multiplex chains
SelectMultiplex
Chain
FY09Initial plans
FY09 Revised
Estimates
FY010 Initial plans
FY010 Revised
Estimates
Inox 141 94 170 118PVR 119 108 151 136
Fame 83 77 119 106
Cinemax 86 77 - 93
Source: PwC analysis, Company data
Lower occupancy levels:
Higher interest rates, higher costs, less employment security and focus on savings seem to have taken a toll on the consumer lifestyle expenditure. This can be partially witnessed in the declining footfalls and subsequently lower occupancy rates seen by the multiplexes in last two-three quarters leading to reported fall ranging from 20-30%. The stand-off between the multiplex owners and producers further added to the downward trend of occupancy rates, which reached to reportedly less than 20% duringApril-May 2009.
Table 4.3: Revenue share between producer and distributor
WeekProducer’s
shareDistributor’s share
1st week 50% 50%2nd week 57.5% 42.5%3rd week 62.5% 37.5%4th week 70% 30%*Films that gross more than $3.6 million will get a 2.5% bonus
favoring distributors
With lower fund inflows, 2009 is expected to be a year of tight budget films with low input costs. In this environment, to market such films better across a wider audience, accurate identification of consumers will be extremely essential to build profits. Apart from multiplex goers, tier II and tier III cities have to be tapped to cultivate the process of audience segmentation. If good content is made at a competitive price and the right marketing strategies are adopted, the industry would be able to weather this downturn phase
Key developments in the Indian Filmed Entertainment industry in 2008
Stand-off between multiplex operators and film producers
The most recent development in the film industry was the first-ever stand-off between multiplex operators and film producers over revenue share. No new Hindi film was released in the multiplexes since April 4, 2009 till June 2009, causing film exhibitors and distributors a reported loss of Rs. 350 crore. As a
Indian Filmed Entertainment Industry
Chart 4.1: Occupancy levels of multiplex chains
Source: PwC analysis, Company data
0%
10%
20%
30%
40%
50%
FY 07 FY
08-3rd qtr
FY08 Fy09-3rdqtr
FY 09
Inox PVR Fame Cinemax
64
result, almost half of the 900 multiplex screens across the country had to be closed by the multiplex chains in order to control their costs. Bollywood producers also incurred losses running into hundred of crores, due to delay in the film releases.
Global players entering the Indian Film business
• Walt Disney produced and released its first film in India with Yash Raj Films. Roadside Romeo in a full-length animation feature film in 2008. Disney also announced its independent plans to produce four live action films as well as three in a joint venture with Yash Raj. Tamil superstar Kamal Haasan also starred in two Disney productions - ‘Marmayogi’ and ‘19 Steps’. Earlier in 2008, the production house bought the Home Video rights of Aamir Khan’s directorial debut ‘Taare Zameen Par’ for release in the US.
• Warner Bros released its film made in association with Ramesh and Rohan Sippy: Chandni Chowk to China in January 2009. It ventured in India as distributors with the film Saas, Bahu Aur Sensex. Warner Bros also signed a three-movie deal with People Tree Films and a one film tie-up with Tandav Films (producers of Khosla Ka Ghosla). The production house has also brought in internationally acclaimed Indian filmmaker Shekhar Kapur to direct a $200-million Hollywood fantasy-epic ‘Larklight’.
• Fox STAR Studios, a joint venture between Twentieth Century Fox and the Star Entertainment and Media Group, owned by Rupert Murdoch’s News Corp, announced its entry into India with multiple deals with various Indian producers for worldwide distribution. It tied up with Vipul Amrutlal Shah for a multiple-film exclusive deal.
• Mexican global multiplex operator Cinepolis announced plans to invest Rs. 1,700 crore in India for its film exhibition business over the next seven years. It has already established an Indian subsidiary that is in talks with mall developers for opening 500 movie screens by 2016. In the first phase of expansion, the company plans to invest Rs 370 crore for opening 110 screens across eight locations
Local players entering the film business
• Mumbai Mantra Media (a company floated by auto major Mahindra & Mahindra and venture capitalists) has entered the film production business. It has announced a slate of 10 films to roll out over the next year and thereafter 25-30 films annually with investments of up to Rs. 400 crores in the next three to four years.
• B.K Modi’s new venture, Spice Enfotainment, has announced plans of investing Rs. 4 billion in the entertainment and media businesses and has signed two directors Ashutosh Gowarikar and Anees Bazmee to direct films.
New film financing models:
• During 2008, India’s first film fund was created in India by Vistaar Religare Film Fund and Manmohan Shetty’s Walkwater Media. Vistaar Religare Film Fund invested over $1 million (Rs 5 crores) –in Walkwater Media’s film Victory – and shared the upside of this deal.
• Nomad Film Fund is another new fund formed with a corpus of Rs 250 crore ($50 million), 10% of which will come from the promoters and $25-$30 million from foreign institutional investors and $15-$20 million from the retail investors. The fund plans to rope in a top Bollywood actor for its management team and it will have a life of five years and is currently in the process of getting a SEBI approval.
• Consortium finance, a well-established concept in the corporate world, has now entered the world of films. In a first of its kind deal, Exim Bank and Indian Overseas Bank (IOB) have come together to co-finance the Akshay Kumar-Katrina Kaif starrer De Dhana Dhan. The Rs. 70-crore film has been sanctioned; Rs. 25 crore from Exim Bank and Rs. 10 crore from IOB. The rate of interest is reported to be around 12.5 to 13% with the period being till the film’s release, the only collateral bring the negative of the film. Produced by Venus Records and directed by Priyadarshan, the film is expected to release in the third quarter of 2009.
Indian film makers going global
• The most notable co-production between Indian and international studios in 2008 was UTV’s
PricewaterhouseCooopers I Indian entertainment and media outlook 2009
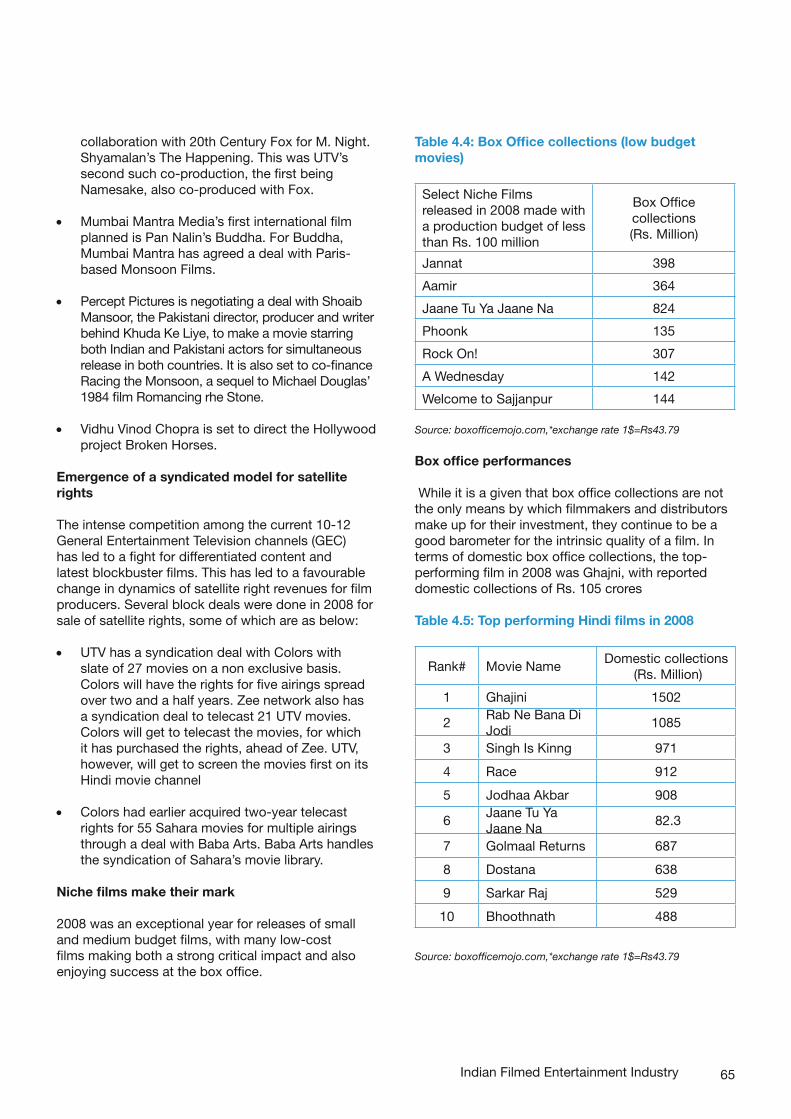
65
collaboration with 20th Century Fox for M. Night. Shyamalan’s The Happening. This was UTV’s second such co-production, the first being Namesake, also co-produced with Fox.
• Mumbai Mantra Media’s first international film planned is Pan Nalin’s Buddha. For Buddha, Mumbai Mantra has agreed a deal with Paris-based Monsoon Films.
• Percept Pictures is negotiating a deal with Shoaib Mansoor, the Pakistani director, producer and writer behind Khuda Ke Liye, to make a movie starring both Indian and Pakistani actors for simultaneous release in both countries. It is also set to co-finance Racing the Monsoon, a sequel to Michael Douglas’ 1984 film Romancing rhe Stone.
• Vidhu Vinod Chopra is set to direct the Hollywood project Broken Horses.
Emergence of a syndicated model for satellite rights
The intense competition among the current 10-12 General Entertainment Television channels (GEC) has led to a fight for differentiated content and latest blockbuster films. This has led to a favourable change in dynamics of satellite right revenues for film producers. Several block deals were done in 2008 for sale of satellite rights, some of which are as below:
• UTV has a syndication deal with Colors with slate of 27 movies on a non exclusive basis. Colors will have the rights for five airings spread over two and a half years. Zee network also has a syndication deal to telecast 21 UTV movies. Colors will get to telecast the movies, for which it has purchased the rights, ahead of Zee. UTV, however, will get to screen the movies first on its Hindi movie channel
• Colors had earlier acquired two-year telecast rights for 55 Sahara movies for multiple airings through a deal with Baba Arts. Baba Arts handles the syndication of Sahara’s movie library.
Niche films make their mark
2008 was an exceptional year for releases of small and medium budget films, with many low-cost films making both a strong critical impact and also enjoying success at the box office.
Table 4.4: Box Office collections (low budget movies)
Select Niche Films released in 2008 made with a production budget of less than Rs. 100 million
Box Office collections (Rs. Million)
Jannat 398
Aamir 364
Jaane Tu Ya Jaane Na 824
Phoonk 135
Rock On! 307
A Wednesday 142
Welcome to Sajjanpur 144
Source: boxofficemojo.com,*exchange rate 1$=Rs43.79
Box office performances
While it is a given that box office collections are not the only means by which filmmakers and distributors make up for their investment, they continue to be a good barometer for the intrinsic quality of a film. In terms of domestic box office collections, the top-performing film in 2008 was Ghajni, with reported domestic collections of Rs. 105 crores
Table 4.5: Top performing Hindi films in 2008
Rank# Movie NameDomestic collections
(Rs. Million)
1 Ghajini 1502
2Rab Ne Bana Di Jodi
1085
3 Singh Is Kinng 971
4 Race 912
5 Jodhaa Akbar 908
6Jaane Tu Ya Jaane Na
82.3
7 Golmaal Returns 687
8 Dostana 638
9 Sarkar Raj 529
10 Bhoothnath 488
Source: boxofficemojo.com,*exchange rate 1$=Rs43.79
Indian Filmed Entertainment Industry
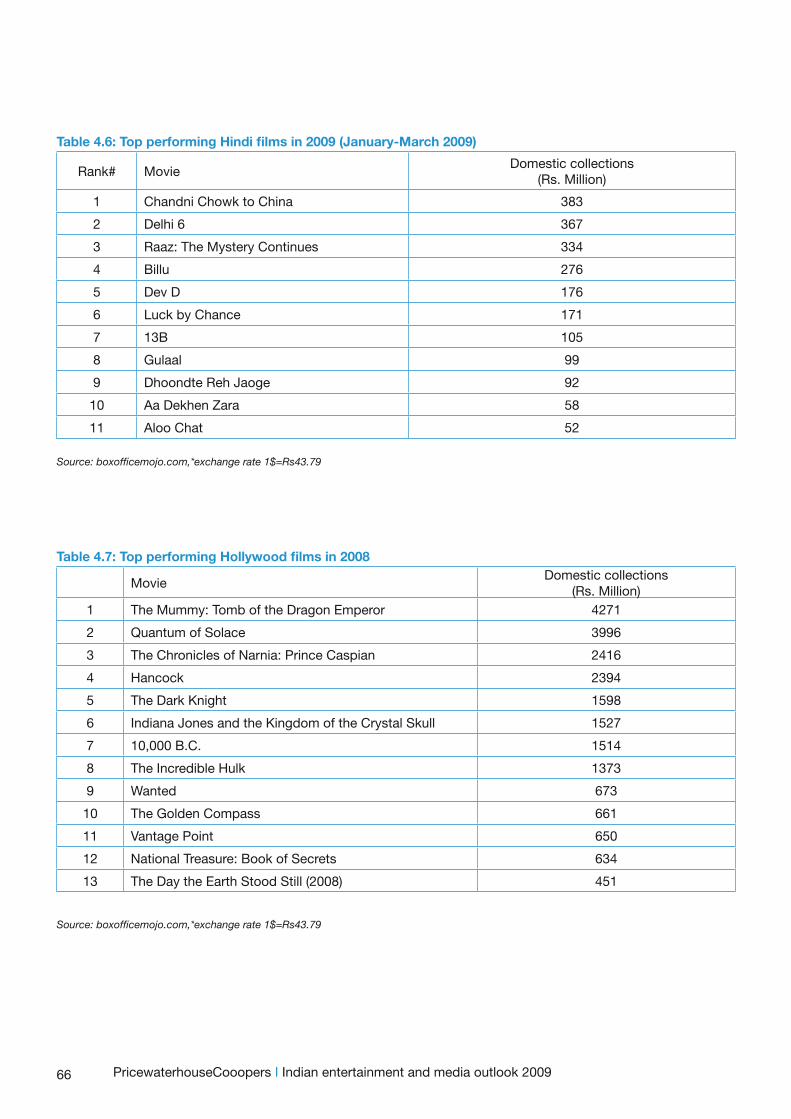
66
Table 4.6: Top performing Hindi films in 2009 (January-March 2009)
Rank# MovieDomestic collections
(Rs. Million)
1 Chandni Chowk to China 383
2 Delhi 6 367
3 Raaz: The Mystery Continues 334
4 Billu 276
5 Dev D 176
6 Luck by Chance 171
7 13B 105
8 Gulaal 99
9 Dhoondte Reh Jaoge 92
10 Aa Dekhen Zara 58
11 Aloo Chat 52
Source: boxofficemojo.com,*exchange rate 1$=Rs43.79
Table 4.7: Top performing Hollywood films in 2008
MovieDomestic collections
(Rs. Million)1 The Mummy: Tomb of the Dragon Emperor 4271
2 Quantum of Solace 3996
3 The Chronicles of Narnia: Prince Caspian 2416
4 Hancock 2394
5 The Dark Knight 1598
6 Indiana Jones and the Kingdom of the Crystal Skull 1527
7 10,000 B.C. 1514
8 The Incredible Hulk 1373
9 Wanted 673
10 The Golden Compass 661
11 Vantage Point 650
12 National Treasure: Book of Secrets 634
13 The Day the Earth Stood Still (2008) 451
Source: boxofficemojo.com,*exchange rate 1$=Rs43.79
PricewaterhouseCooopers I Indian entertainment and media outlook 2009
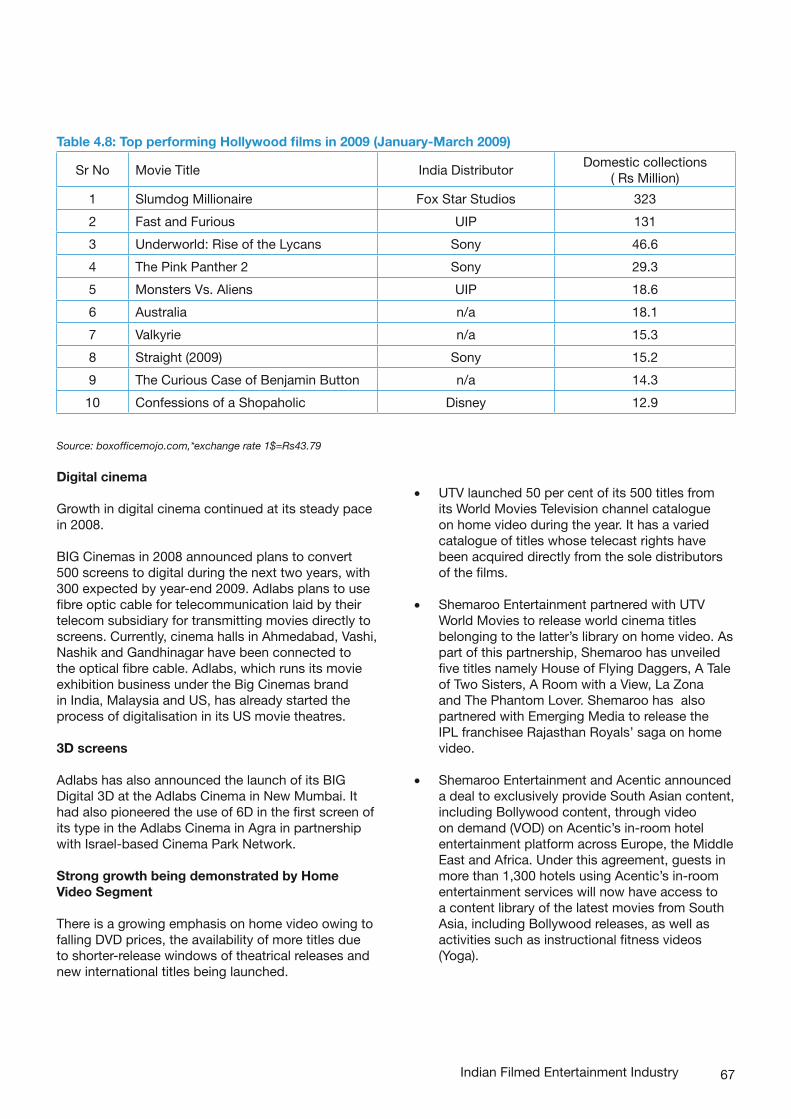
67
Table 4.8: Top performing Hollywood films in 2009 (January-March 2009)
Sr No Movie Title India DistributorDomestic collections
( Rs Million)
1 Slumdog Millionaire Fox Star Studios 323
2 Fast and Furious UIP 131
3 Underworld: Rise of the Lycans Sony 46.6
4 The Pink Panther 2 Sony 29.3
5 Monsters Vs. Aliens UIP 18.6
6 Australia n/a 18.1
7 Valkyrie n/a 15.3
8 Straight (2009) Sony 15.2
9 The Curious Case of Benjamin Button n/a 14.3
10 Confessions of a Shopaholic Disney 12.9
Source: boxofficemojo.com,*exchange rate 1$=Rs43.79
Digital cinema
Growth in digital cinema continued at its steady pace in 2008.
BIG Cinemas in 2008 announced plans to convert 500 screens to digital during the next two years, with 300 expected by year-end 2009. Adlabs plans to use fibre optic cable for telecommunication laid by their telecom subsidiary for transmitting movies directly to screens. Currently, cinema halls in Ahmedabad, Vashi, Nashik and Gandhinagar have been connected to the optical fibre cable. Adlabs, which runs its movie exhibition business under the Big Cinemas brand in India, Malaysia and US, has already started the process of digitalisation in its US movie theatres.
3D screens
Adlabs has also announced the launch of its BIG Digital 3D at the Adlabs Cinema in New Mumbai. It had also pioneered the use of 6D in the first screen of its type in the Adlabs Cinema in Agra in partnership with Israel-based Cinema Park Network.
Strong growth being demonstrated by Home Video Segment
There is a growing emphasis on home video owing to falling DVD prices, the availability of more titles due to shorter-release windows of theatrical releases and new international titles being launched.
• UTV launched 50 per cent of its 500 titles from its World Movies Television channel catalogue on home video during the year. It has a varied catalogue of titles whose telecast rights have been acquired directly from the sole distributors of the films.
• Shemaroo Entertainment partnered with UTV World Movies to release world cinema titles belonging to the latter’s library on home video. As part of this partnership, Shemaroo has unveiled five titles namely House of Flying Daggers, A Tale of Two Sisters, A Room with a View, La Zona and The Phantom Lover. Shemaroo has also partnered with Emerging Media to release the IPL franchisee Rajasthan Royals’ saga on home video.
• Shemaroo Entertainment and Acentic announced a deal to exclusively provide South Asian content, including Bollywood content, through video on demand (VOD) on Acentic’s in-room hotel entertainment platform across Europe, the Middle East and Africa. Under this agreement, guests in more than 1,300 hotels using Acentic’s in-room entertainment services will now have access to a content library of the latest movies from South Asia, including Bollywood releases, as well as activities such as instructional fitness videos (Yoga).
Indian Filmed Entertainment Industry
68
Key Government Initiatives in 2008:
The Government released in 2008 its various initiatives for the Indian film industry, some of which are as below:
• The Government is working with the industry to set up an Export Promotion Council, following a recommendation made by the Core Group on ‘Export of films and related issues’ in 2007.
• The provision for grants-in-aid to the Federation of Film Societies of India and support to non-governmental and state government organizations to promote Indian cinema in the country and overseas has been more than doubled to Rs. 206.9 million in the Eleventh Plan, as compared to the allocation of Rs. 98.94 million in the Tenth Plan.
• The Government is promoting films through a scheme called ‘Export Promotion through film festivals in India and Abroad’ implemented through the Directorate of Film Festivals. The scheme covers the organisation of the International Film Festival of India, participation in various film festivals in India and abroad and conducting film festivals. Films are also sent to various Indian embassies for them to stage their own festivals.
• The existing Main Secretariat Scheme of the Ministry, ‘Participation in Film Markets’, envisages providing support, facilitation and promotion of the export potential of the Indian film industry. The scheme intends to cover not only specific institutionalised international markets such as Cannes Film Market/Berlin Film Festival/American Film Market/MIPCOM, Cannes among others (participation to be decided yearly) but also the Film Bazaar which is held along side the International Film Festival of India each year.
M&A / Investments in Indian Film Industry in 2008:
• PVR Pictures in 2008 signed equity partnership agreements with ICICI Venture Funds Management Company and JP Morgan Global Special Opportunities Group for an investment of Rs. l20 crore in the company. JP Morgan and ICICI Venture will each invest Rs. 60 crore for a 20% stake each. This will enable PVR Pictures to enable the parent, PVR, to become a fully
integrated film and entertainment company with interests across the entire value chain including production, distribution and exhibition.
• Nomura Holdings invested USD 16 million to India’s digital media and entertainment provider Real Image Media Technologies Pvt. Ltd.
• Mukta Arts Limited announced acquisition of Mobile Content and company - Coruscant Tec in an all cash deal for a controlling stake in the company for an unspecified amount.
Key International Trends in the Filmed Entertainment Industry in 2008
Global Outlook
• Global box office spending will increase from $28.3 billion in 2008 to $37.7 billion in 2013, a 5.9 percent compound annual increase.
• Box office will outpace overall home video spending, which will expand at a projected 3 percent compound annual rate to $64.5 billion from $55.6 billion in 2008.
• Physical sell-through spending will decline during the next two years and then re-bound, with mid- to high-single-digit growth projected for 2012-13.
• Sell-through spending will total $38.8 billion in 2013 from $34.7 billion in 2008, a 2.2 percent increase compounded annually.
• In-store rental spending will be relatively flat at $17.6 billion in 2013 compared with $17.7 billion in 2008, edging down at only a 0.1 percent compound annual rate.
• Online rental subscriptions will expand at an 18.2 percent compound annual rate to $6.7 billion from $2.9 billion in 2008.
• Digital downloads will rise to $1.4 billion in 2013 from only $286 million in 2008, a 37.7 percent compound annual increase from a small base.
Regional growth
• Filmed entertainment spending in North America, EMEA (Europe, Middle East, and Africa), Asia Pacific and Latin America will rise at a 4 percent compound annual rate, reaching $102.2 billion in 2013 from $83.9 billion in 2008.
• Asia Pacific will be the fastest-growing region, increasing by 5.7 percent compounded annually to $23.3 billion in 2013 compared with $17.7 billion in 2008.
PricewaterhouseCooopers I Indian entertainment and media outlook 2009
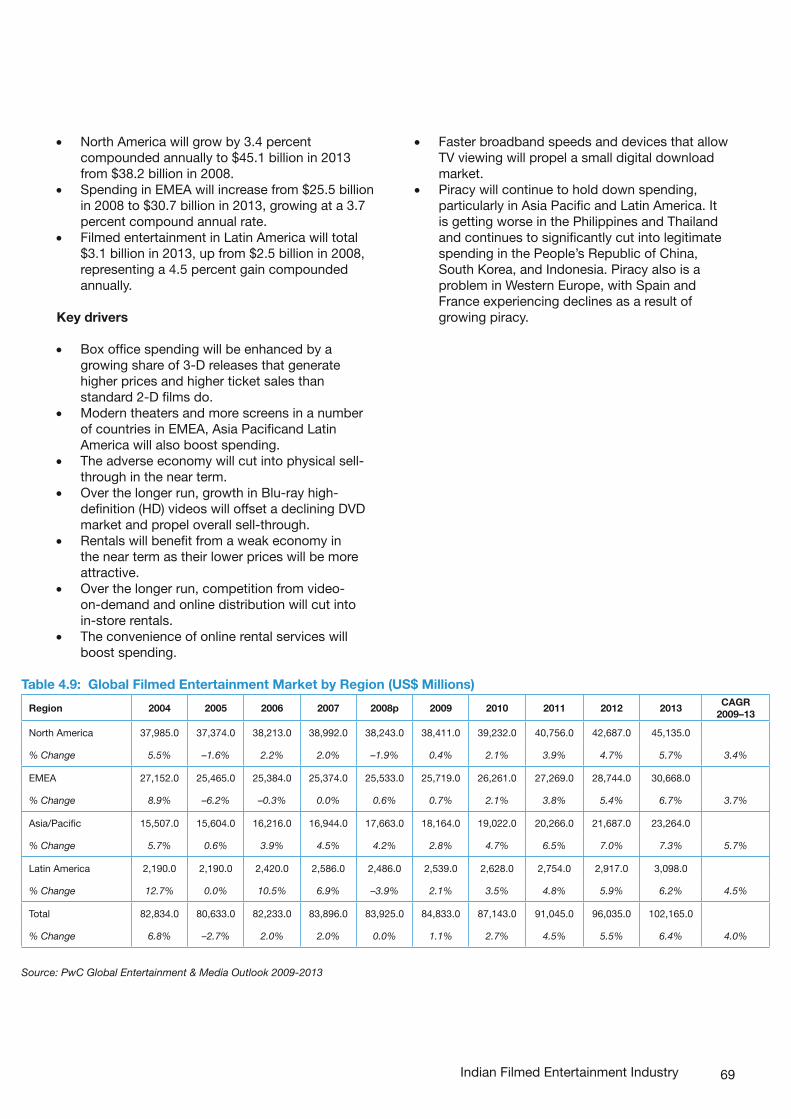
69
• North America will grow by 3.4 percent compounded annually to $45.1 billion in 2013 from $38.2 billion in 2008.
• Spending in EMEA will increase from $25.5 billion in 2008 to $30.7 billion in 2013, growing at a 3.7 percent compound annual rate.
• Filmed entertainment in Latin America will total $3.1 billion in 2013, up from $2.5 billion in 2008, representing a 4.5 percent gain compounded annually.
Key drivers
• Box office spending will be enhanced by a growing share of 3-D releases that generate higher prices and higher ticket sales than standard 2-D films do.
• Modern theaters and more screens in a number of countries in EMEA, Asia Pacificand Latin America will also boost spending.
• The adverse economy will cut into physical sell-through in the near term.
• Over the longer run, growth in Blu-ray high-definition (HD) videos will offset a declining DVD market and propel overall sell-through.
• Rentals will benefit from a weak economy in the near term as their lower prices will be more attractive.
• Over the longer run, competition from video-on-demand and online distribution will cut into in-store rentals.
• The convenience of online rental services will boost spending.
Table 4.9: Global Filmed Entertainment Market by Region (US$ Millions)
Region 2004 2005 2006 2007 2008p 2009 2010 2011 2012 2013CAGR
2009–13
North America 37,985.0 37,374.0 38,213.0 38,992.0 38,243.0 38,411.0 39,232.0 40,756.0 42,687.0 45,135.0
% Change 5.5% –1.6% 2.2% 2.0% –1.9% 0.4% 2.1% 3.9% 4.7% 5.7% 3.4%
EMEA 27,152.0 25,465.0 25,384.0 25,374.0 25,533.0 25,719.0 26,261.0 27,269.0 28,744.0 30,668.0
% Change 8.9% –6.2% –0.3% 0.0% 0.6% 0.7% 2.1% 3.8% 5.4% 6.7% 3.7%
Asia/Pacific 15,507.0 15,604.0 16,216.0 16,944.0 17,663.0 18,164.0 19,022.0 20,266.0 21,687.0 23,264.0
% Change 5.7% 0.6% 3.9% 4.5% 4.2% 2.8% 4.7% 6.5% 7.0% 7.3% 5.7%
Latin America 2,190.0 2,190.0 2,420.0 2,586.0 2,486.0 2,539.0 2,628.0 2,754.0 2,917.0 3,098.0
% Change 12.7% 0.0% 10.5% 6.9% –3.9% 2.1% 3.5% 4.8% 5.9% 6.2% 4.5%
Total 82,834.0 80,633.0 82,233.0 83,896.0 83,925.0 84,833.0 87,143.0 91,045.0 96,035.0 102,165.0
% Change 6.8% –2.7% 2.0% 2.0% 0.0% 1.1% 2.7% 4.5% 5.5% 6.4% 4.0%
Source: PwC Global Entertainment & Media Outlook 2009-2013
• Faster broadband speeds and devices that allow TV viewing will propel a small digital download market.
• Piracy will continue to hold down spending, particularly in Asia Pacific and Latin America. It is getting worse in the Philippines and Thailand and continues to significantly cut into legitimate spending in the People’s Republic of China, South Korea, and Indonesia. Piracy also is a problem in Western Europe, with Spain and France experiencing declines as a result of growing piracy.
Indian Filmed Entertainment Industry
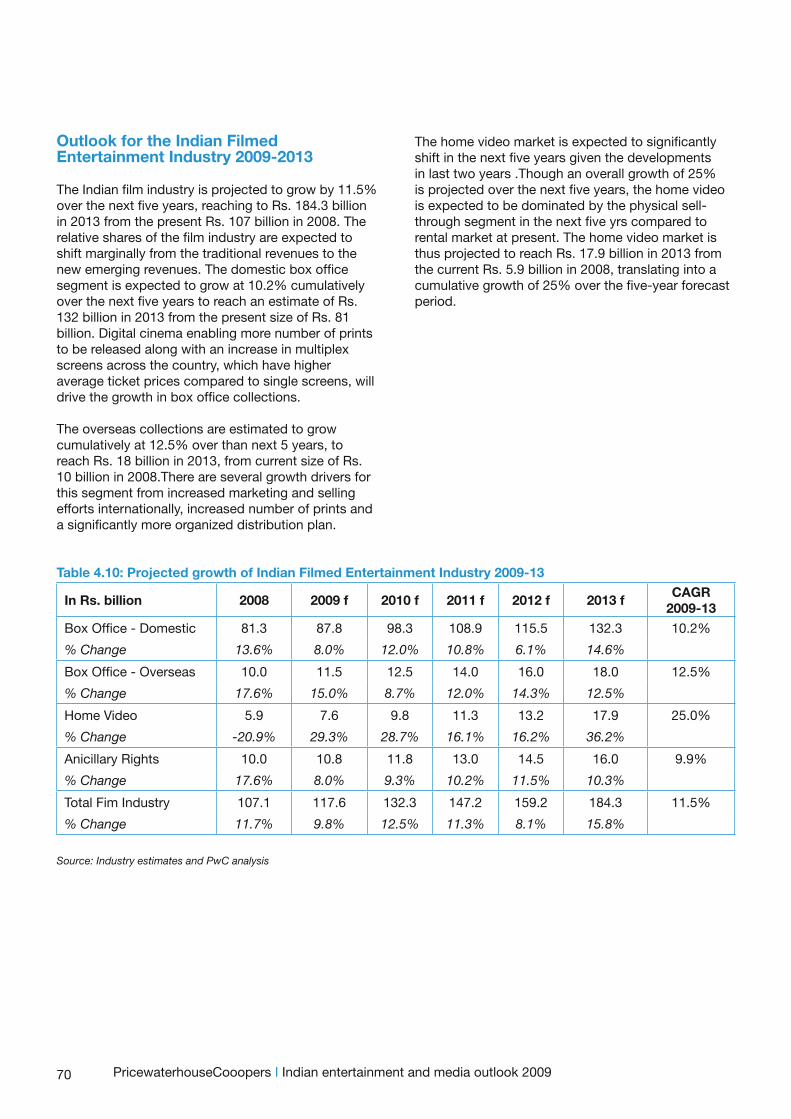
70
Outlook for the Indian Filmed Entertainment Industry 2009-2013
The Indian film industry is projected to grow by 11.5% over the next five years, reaching to Rs. 184.3 billion in 2013 from the present Rs. 107 billion in 2008. The relative shares of the film industry are expected to shift marginally from the traditional revenues to the new emerging revenues. The domestic box office segment is expected to grow at 10.2% cumulatively over the next five years to reach an estimate of Rs. 132 billion in 2013 from the present size of Rs. 81 billion. Digital cinema enabling more number of prints to be released along with an increase in multiplex screens across the country, which have higher average ticket prices compared to single screens, will drive the growth in box office collections.
The overseas collections are estimated to grow cumulatively at 12.5% over than next 5 years, to reach Rs. 18 billion in 2013, from current size of Rs. 10 billion in 2008.There are several growth drivers for this segment from increased marketing and selling efforts internationally, increased number of prints and a significantly more organized distribution plan.
PricewaterhouseCooopers I Indian entertainment and media outlook 2009
Table 4.10: Projected growth of Indian Filmed Entertainment Industry 2009-13
In Rs. billion 2008 2009 f 2010 f 2011 f 2012 f 2013 fCAGR
2009-13
Box Office - Domestic 81.3 87.8 98.3 108.9 115.5 132.3 10.2%
% Change 13.6% 8.0% 12.0% 10.8% 6.1% 14.6%
Box Office - Overseas 10.0 11.5 12.5 14.0 16.0 18.0 12.5%
% Change 17.6% 15.0% 8.7% 12.0% 14.3% 12.5%
Home Video 5.9 7.6 9.8 11.3 13.2 17.9 25.0%
% Change -20.9% 29.3% 28.7% 16.1% 16.2% 36.2%
Anicillary Rights 10.0 10.8 11.8 13.0 14.5 16.0 9.9%
% Change 17.6% 8.0% 9.3% 10.2% 11.5% 10.3%
Total Fim Industry 107.1 117.6 132.3 147.2 159.2 184.3 11.5%
% Change 11.7% 9.8% 12.5% 11.3% 8.1% 15.8%
Source: Industry estimates and PwC analysis
The home video market is expected to significantly shift in the next five years given the developments in last two years .Though an overall growth of 25% is projected over the next five years, the home video is expected to be dominated by the physical sell-through segment in the next five yrs compared to rental market at present. The home video market is thus projected to reach Rs. 17.9 billion in 2013 from the current Rs. 5.9 billion in 2008, translating into a cumulative growth of 25% over the five-year forecast period.
Indian Radio Industry
Performance of the Indian Radio Industry in 2008
Impact of the global economic downturn on the Indian Radio Industry
Key developments in the Indian Radio Industry in 2008
Key International Trends in the Radio Industry in 2008
Outlook for the Indian Radio Industry 2009-2013
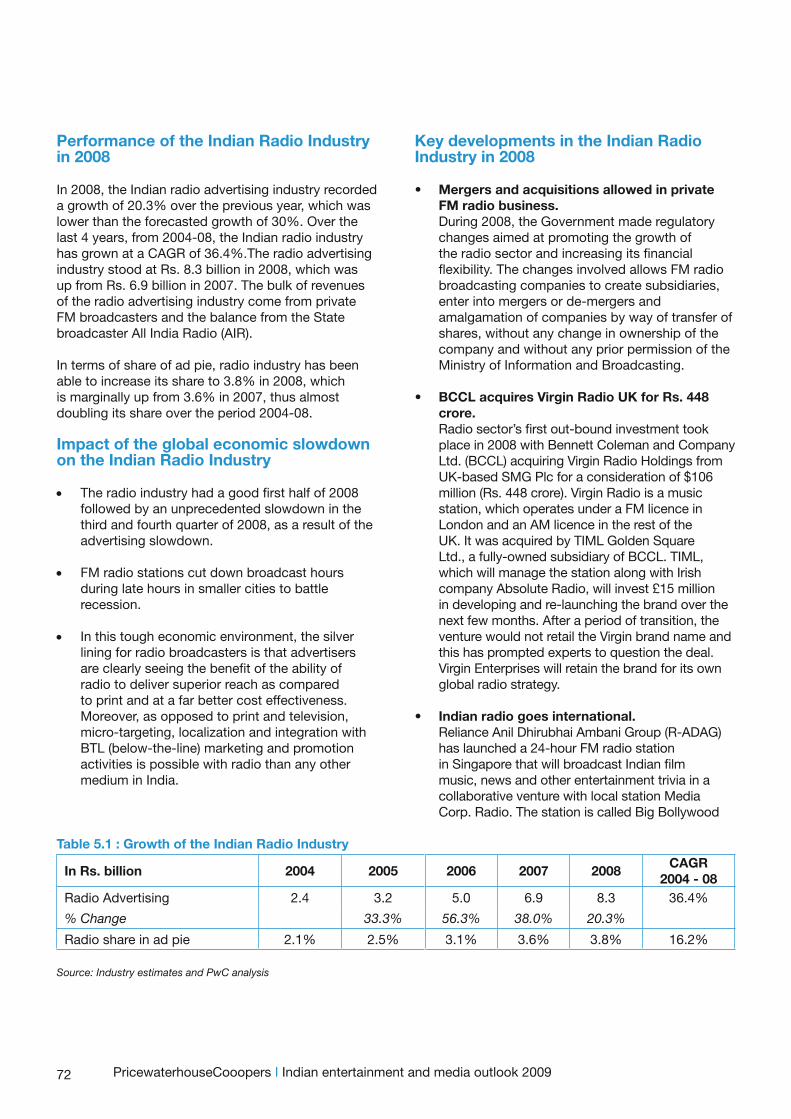
72
Performance of the Indian Radio Industry in 2008
In 2008, the Indian radio advertising industry recorded a growth of 20.3% over the previous year, which was lower than the forecasted growth of 30%. Over the last 4 years, from 2004-08, the Indian radio industry has grown at a CAGR of 36.4%.The radio advertising industry stood at Rs. 8.3 billion in 2008, which was up from Rs. 6.9 billion in 2007. The bulk of revenues of the radio advertising industry come from private FM broadcasters and the balance from the State broadcaster All India Radio (AIR).
In terms of share of ad pie, radio industry has been able to increase its share to 3.8% in 2008, which is marginally up from 3.6% in 2007, thus almost doubling its share over the period 2004-08.
Impact of the global economic slowdown on the Indian Radio Industry
• The radio industry had a good first half of 2008 followed by an unprecedented slowdown in the third and fourth quarter of 2008, as a result of the advertising slowdown.
• FM radio stations cut down broadcast hours during late hours in smaller cities to battle recession.
• In this tough economic environment, the silver lining for radio broadcasters is that advertisers are clearly seeing the benefit of the ability of radio to deliver superior reach as compared to print and at a far better cost effectiveness. Moreover, as opposed to print and television, micro-targeting, localization and integration with BTL (below-the-line) marketing and promotion activities is possible with radio than any other medium in India.
Key developments in the Indian Radio Industry in 2008
• Mergers and acquisitions allowed in private FM radio business.During 2008, the Government made regulatory changes aimed at promoting the growth of the radio sector and increasing its financial flexibility. The changes involved allows FM radio broadcasting companies to create subsidiaries, enter into mergers or de-mergers and amalgamation of companies by way of transfer of shares, without any change in ownership of the company and without any prior permission of the Ministry of Information and Broadcasting.
• BCCL acquires Virgin Radio UK for Rs. 448 crore.Radio sector’s first out-bound investment took place in 2008 with Bennett Coleman and Company Ltd. (BCCL) acquiring Virgin Radio Holdings from UK-based SMG Plc for a consideration of $106 million (Rs. 448 crore). Virgin Radio is a music station, which operates under a FM licence in London and an AM licence in the rest of the UK. It was acquired by TIML Golden Square Ltd., a fully-owned subsidiary of BCCL. TIML, which will manage the station along with Irish company Absolute Radio, will invest £15 million in developing and re-launching the brand over the next few months. After a period of transition, the venture would not retail the Virgin brand name and this has prompted experts to question the deal. Virgin Enterprises will retain the brand for its own global radio strategy.
• Indian radio goes international.Reliance Anil Dhirubhai Ambani Group (R-ADAG) has launched a 24-hour FM radio station in Singapore that will broadcast Indian film music, news and other entertainment trivia in a collaborative venture with local station Media Corp. Radio. The station is called Big Bollywood
PricewaterhouseCooopers I Indian entertainment and media outlook 2009
Table 5.1 : Growth of the Indian Radio Industry
In Rs. billion 2004 2005 2006 2007 2008CAGR
2004 - 08Radio Advertising 2.4 3.2 5.0 6.9 8.3 36.4%
% Change 33.3% 56.3% 38.0% 20.3%
Radio share in ad pie 2.1% 2.5% 3.1% 3.6% 3.8% 16.2%
Source: Industry estimates and PwC analysis
73
96.3 FM. This is the first time an Indian FM station is going offshore. The channel will play celebrity interviews, songs and gossip.
• Radio Netherlands inks content deal with Radio Chaska.Radio Netherlands Worldwide (RNW) has signed a syndication deal with Gwalior-based Radio Chaska. RNW will offer to Radio Chaska shows that include Euro Hit 40. RNW has also struck similar syndication deals with other broadcasters in Siliguri and Kolkata. The Netherlands-based RNW is also in talks with Indian FM broadcasters to co-produce shows for them.
• RAM data beginning to get acceptance by radio stations and advertisers.Following the growing acceptance of radio audience measurement (RAM) data, FM radio operators raised their advertising rates in 2008. Radio stations such as Radio Mirchi (Times of India Group) and Red FM (Sun TV Group) increased their rates during 2008 by between 15% and 25%. The RAM data has set a benchmark for radio broadcasters who, following the acceptance of the data by advertisers, are now able to justify higher rates.
• Music royalty issue delays Phase III FM bidding.The music royalty issue is snowballing into a serious situation, which is enough to bring about a delay in the Phase III of bidding for FM licences. The Information and Broadcasting Ministry is hesitant to announce Phase III of bidding, given the current financial situation of the radio industry, due to high royalty charges in smaller cities. The demand for royalty in smaller cities exceeds 100 per cent of the revenue of such radio stations. Therefore, the Government agencies i.e. Ministry of Information and Broadcasting and Ministry of HRD are examining this issue seriously.
• Phase III FM expansion. The Phase II of FM licensing has been both exciting and challenging for the radio industry. The Phase II expansion saw the Government issuing 245 licenses, and it is believed the Ministry of Information and Broadcasting is likely to roll out in excess of 600 licenses (in over 250 additional towns) in Phase III. The industry is also hopeful of TRAI recommendations being given the go-ahead.
Some of these include allowing sports and current affairs news, increase in FDI from 20% to 26% i.e. same as print and allowing multiple frequencies in radio per city. On the matter of allowing news on radio, TRAI in its recommendations has suggested that radio broadcasters should be allowed to broadcast news provided that they use content only from All India Radio, Doordarshan, authorized television news channels, United News of India, Press Trust of India and any other authorized news agency.
There is also a debate that if the FM radio industry is not allowed to broadcast news in the air waves, the same should not be allowed on Satellite radio as well. Presently, there seems to be an anomaly that Satellite radio, with an allowance of 100% FDI, is allowed to broadcast news whereas FM radio, with an allowance of 20% FDI, is not allowed to broadcast news.
• Number of radio-listeners increases.As per IRS 2008/2009 radio listenership has increased. Total listening has increased in some cities to as high as 22 hours per week. Average time spent on radio as per the IRS has increased from 70.4 minutes to 81.1 minutes for radio in 2007-08.Source IRS
• Political advertisements allowed on radio. As a run up to the General Elections, political advertisements were allowed on radio via Government notification. This helped radio broadcasters emerge as a strong media ally for most political parties in their campaigns. As per press reports, approximately Rs. 50 crores was spent on radio alone by political parties in these elections.
• IPL on radio. Radio was also the beneficiary from IPL with respect to advertising revenues. Most radio stations tied up with IPL teams from their respective states for launching various contests that enticed listeners with tickets to South Africa in addition to other goodies. Most radio stations also provided regular updates on the score and this too resulted in more listeners tuning into radio to listen, as well as participate in contests. Radio stations were also able to earn additional revenues from SMSs from listeners participating in these contests.
Indian Radio Industry
74
• Satellite Radio.FM radio broadcasters have always complained on the level-playing field as compared to satellite radio, especially in the case of FDI. While satellite radio currently enjoys 100% FDI, FM radio is allowed only 20%. This has always drawn the ire of FM radio broadcasters and in 2008, TRAI brought out its recommendations on satellite radio, where it has suggested bringing down the FDI cap of 100% for satellite radio to 74%. Further, it has also recommended satellite radio companies to pay 4% revenue share to the Government and a one time entry fee of Rs. 2.5 crore.
Currently, World Space is the only player in India to offer satellite radio services. In its recommendations, TRAI has also recommended to the Government to remove caps on the number of licences to be issued in consultation with the Wireless Planning & Coordination Wing of DoT and the Indian Space Research Organization (ISRO) so as to promote this service.
Community Radio (CR) is radio broadcasting with the objective of serving the cause of the community in the service area by involving members of the community in the broadcast of their programmes. It affords a unique advantage of receiving transmission through low cost, battery operated portable receiving sets. The Ministry encourages setting up the CR, as it promises to provide an opportunity to the local communities to express themselves, share their views and particularly empower the women, youth and the marginalised groups to take part in local self governance and overall socio-economic and cultural development of the area. It will also inform the society about the developmental initiatives of Government and promote transparency in the implementation of the scheme.
Programs permissible on Community Radio should be of immediate relevance to the community and focus on issues relating to education, health, environment, and agriculture and rural and community development. At least 50% of content shall be generated with the participation of the local community, for which the station has been set up. Transmission of sponsored programmes shall not be permitted except programmes sponsored by Central and State Governments and other organizations to broadcast public interest
information. Such station cannot broadcast any programmes, which relate to news and current affairs and are otherwise political in nature.
Location for CR is to be located within the campus in case of educational institutes. NGOs and others have to locate their transmitter, antenna within the centre of geographical area of the community they seek to serve.
Some of the recently opened CR stations are:Ahmednagar - The Ministry of Information & Broadcasting has signed a Grant of Permission Agreement for establishing, maintaining and operating community radio stations at Krishi Vigyan Kendra, Babhaleshwar in Ahmednagar district in Maharashtra.
Himachal Pradesh has got its first wireless community radio station in Solan district. The community radio station to be established at Krishi Vigyan Kendra, Babhaleshwar is intended to further take the programmes and activities of the Kendra to a wider farming community and replicate the success stories so that the benefit of information services increases the livelihood opportunities for the target community. The Krishi Vigyan Kendra station would serve a population of over 8.15 lakh. This community radio service is the first to be launched in the state.
Haryana - The Ministry of Information & Broadcasting has signed a Grant of Permission Agreement for establishing, maintaining and operating a Community Radio Station (CRS) at Tagore Bhawan, Chaudhary Devilal University. The proposed CRS would primarily serve the university community residing in and around the University Campus by inculcating more cohesiveness among its members through their active involvement in its programming. The rural community living in the coverage area of the proposed CRS would be another major group to be served by it. 82.6% of the population, who come under the radius of this Community Radio Station, is rural. Only 5.8% belongs to the urban area.
PricewaterhouseCooopers I Indian entertainment and media outlook 2009
75
Key International Trends in the Radio Industry in 2008
Global Outlook
• Globally, the radio market will decline by 0.7% compounded annually to $47.1 billion in 2013 from $48.7 billion in 2008.
• Global radio advertising was the largest component in 2008, at $32.5 billion, but will be the only segment expected to show a decline over the forecast period, with a projected compound annual decrease of 2.9% to $28.1 billion in 2013.
• Public radio licence fees will rise at a 1.6 percent compound annual rate to $14 billion from $12.9 billion in 2008.
• Satellite radio subscriptions will be the fastest-growing component, averaging 9.4% compounded annually to $5.1 billion from $3.3 billion in 2008.
Key drivers
• Weak economic conditions worldwide will lower spending significantly in 2009 and less so in 2010. Improved economic conditions in 2011 will bring a return to growth.
• Radio advertising will face growing competition from the Internet, but satellite radio will boost spending in North America.
• Modest increases in public radio license fees will help stabilize the radio markets in EMEA and Asia Pacific.
Outlook for the Indian Radio Industry 2009-2013 Spending on radio advertising is growing rapidly, and now accounts for around 4% of total media spend. If the industry continues to grow at the same rate, it has the potential to reach at least 5% in the next 5 years and outpace the growth of other sectors of the advertising industry over the same period. This will boost the radio industry as a whole and help it to be regarded as having the greatest potential after television and print.
The Indian radio advertising industry is projected to grow by 18% over the next five years, reaching to Rs. 19 billion in 2013 from the present Rs. 8.3 billion in 2008, which is more than double its current size.
In terms of share of ad pie, it is projected that the radio advertising industry will be able to increase its share from 3.8% in 2008 to 5.2 % in 2013.
Indian Radio Industry
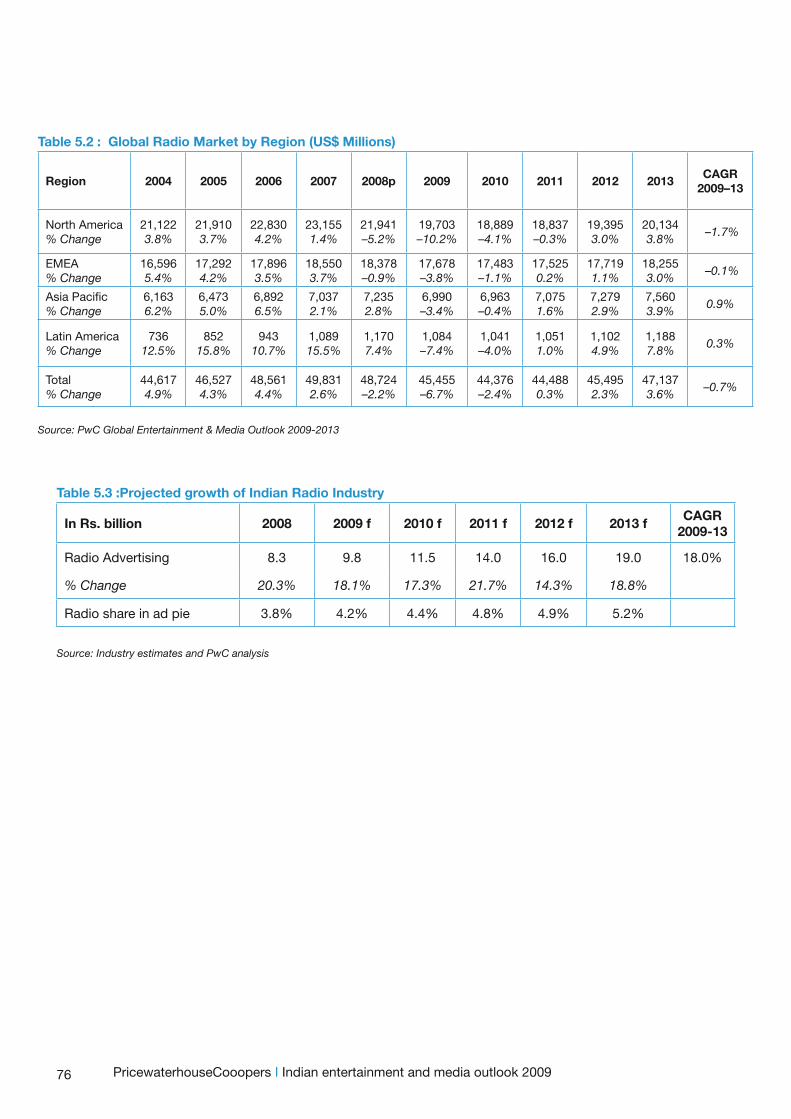
76 PricewaterhouseCooopers I Indian entertainment and media outlook 2009
Table 5.2 : Global Radio Market by Region (US$ Millions)
Region 2004 2005 2006 2007 2008p 2009 2010 2011 2012 2013CAGR
2009–13
North America% Change
21,1223.8%
21,9103.7%
22,8304.2%
23,1551.4%
21,941–5.2%
19,703–10.2%
18,889–4.1%
18,837–0.3%
19,3953.0%
20,1343.8%
–1.7%
EMEA% Change
16,5965.4%
17,2924.2%
17,8963.5%
18,5503.7%
18,378–0.9%
17,678–3.8%
17,483–1.1%
17,5250.2%
17,7191.1%
18,2553.0%
–0.1%
Asia Pacific% Change
6,1636.2%
6,4735.0%
6,8926.5%
7,0372.1%
7,2352.8%
6,990–3.4%
6,963–0.4%
7,0751.6%
7,2792.9%
7,5603.9%
0.9%
Latin America% Change
73612.5%
85215.8%
94310.7%
1,08915.5%
1,1707.4%
1,084–7.4%
1,041–4.0%
1,0511.0%
1,1024.9%
1,1887.8%
0.3%
Total% Change
44,6174.9%
46,5274.3%
48,5614.4%
49,8312.6%
48,724–2.2%
45,455–6.7%
44,376–2.4%
44,4880.3%
45,4952.3%
47,1373.6%
–0.7%
Source: PwC Global Entertainment & Media Outlook 2009-2013
Table 5.3 :Projected growth of Indian Radio Industry
In Rs. billion 2008 2009 f 2010 f 2011 f 2012 f 2013 fCAGR
2009-13
Radio Advertising 8.3 9.8 11.5 14.0 16.0 19.0 18.0%
% Change 20.3% 18.1% 17.3% 21.7% 14.3% 18.8%
Radio share in ad pie 3.8% 4.2% 4.4% 4.8% 4.9% 5.2%
Source: Industry estimates and PwC analysis
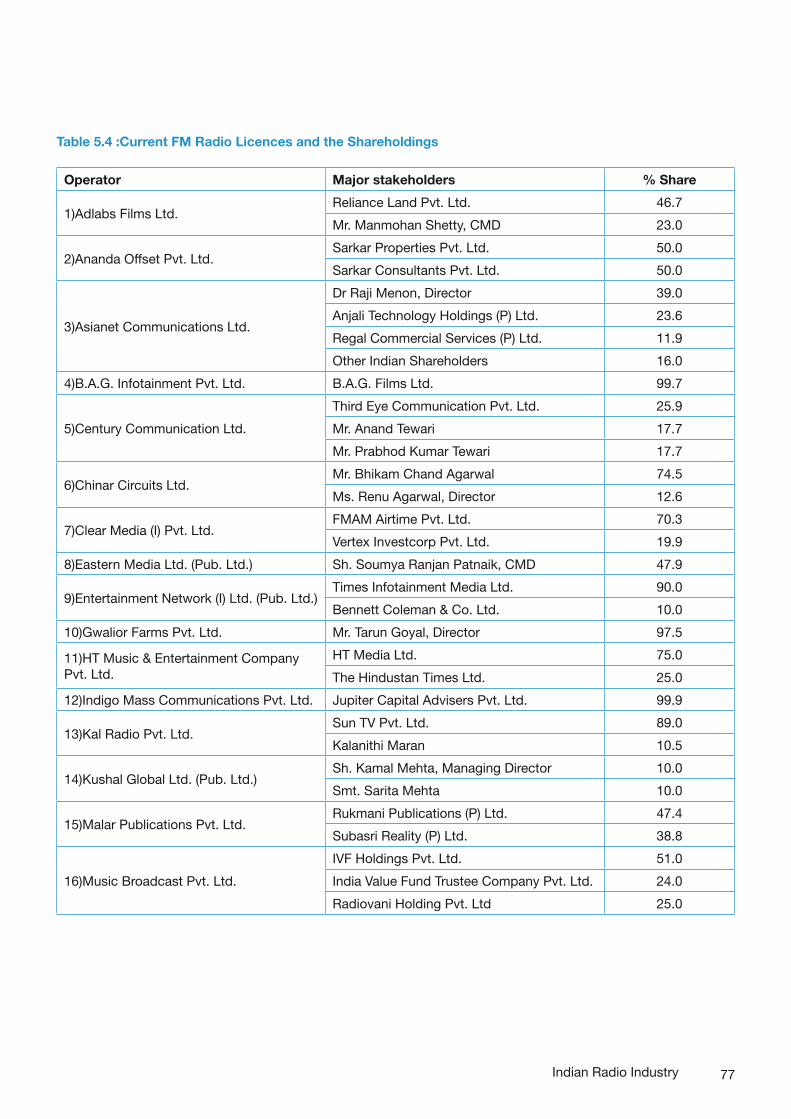
77Indian Radio Industry
Table 5.4 :Current FM Radio Licences and the Shareholdings
Operator Major stakeholders % Share
1)Adlabs Films Ltd. Reliance Land Pvt. Ltd. 46.7
Mr. Manmohan Shetty, CMD 23.0
2)Ananda Offset Pvt. Ltd. Sarkar Properties Pvt. Ltd. 50.0
Sarkar Consultants Pvt. Ltd. 50.0
3)Asianet Communications Ltd.
Dr Raji Menon, Director 39.0
Anjali Technology Holdings (P) Ltd. 23.6
Regal Commercial Services (P) Ltd. 11.9
Other Indian Shareholders 16.0
4)B.A.G. Infotainment Pvt. Ltd. B.A.G. Films Ltd. 99.7
5)Century Communication Ltd.
Third Eye Communication Pvt. Ltd. 25.9
Mr. Anand Tewari 17.7
Mr. Prabhod Kumar Tewari 17.7
6)Chinar Circuits Ltd. Mr. Bhikam Chand Agarwal 74.5
Ms. Renu Agarwal, Director 12.6
7)Clear Media (I) Pvt. Ltd. FMAM Airtime Pvt. Ltd. 70.3
Vertex Investcorp Pvt. Ltd. 19.9
8)Eastern Media Ltd. (Pub. Ltd.) Sh. Soumya Ranjan Patnaik, CMD 47.9
9)Entertainment Network (I) Ltd. (Pub. Ltd.) Times Infotainment Media Ltd. 90.0
Bennett Coleman & Co. Ltd. 10.0
10)Gwalior Farms Pvt. Ltd. Mr. Tarun Goyal, Director 97.5
11)HT Music & Entertainment Company Pvt. Ltd.
HT Media Ltd. 75.0
The Hindustan Times Ltd. 25.0
12)Indigo Mass Communications Pvt. Ltd. Jupiter Capital Advisers Pvt. Ltd. 99.9
13)Kal Radio Pvt. Ltd. Sun TV Pvt. Ltd. 89.0
Kalanithi Maran 10.5
14)Kushal Global Ltd. (Pub. Ltd.) Sh. Kamal Mehta, Managing Director 10.0
Smt. Sarita Mehta 10.0
15)Malar Publications Pvt. Ltd. Rukmani Publications (P) Ltd. 47.4
Subasri Reality (P) Ltd. 38.8
16)Music Broadcast Pvt. Ltd.
IVF Holdings Pvt. Ltd. 51.0
India Value Fund Trustee Company Pvt. Ltd. 24.0
Radiovani Holding Pvt. Ltd 25.0
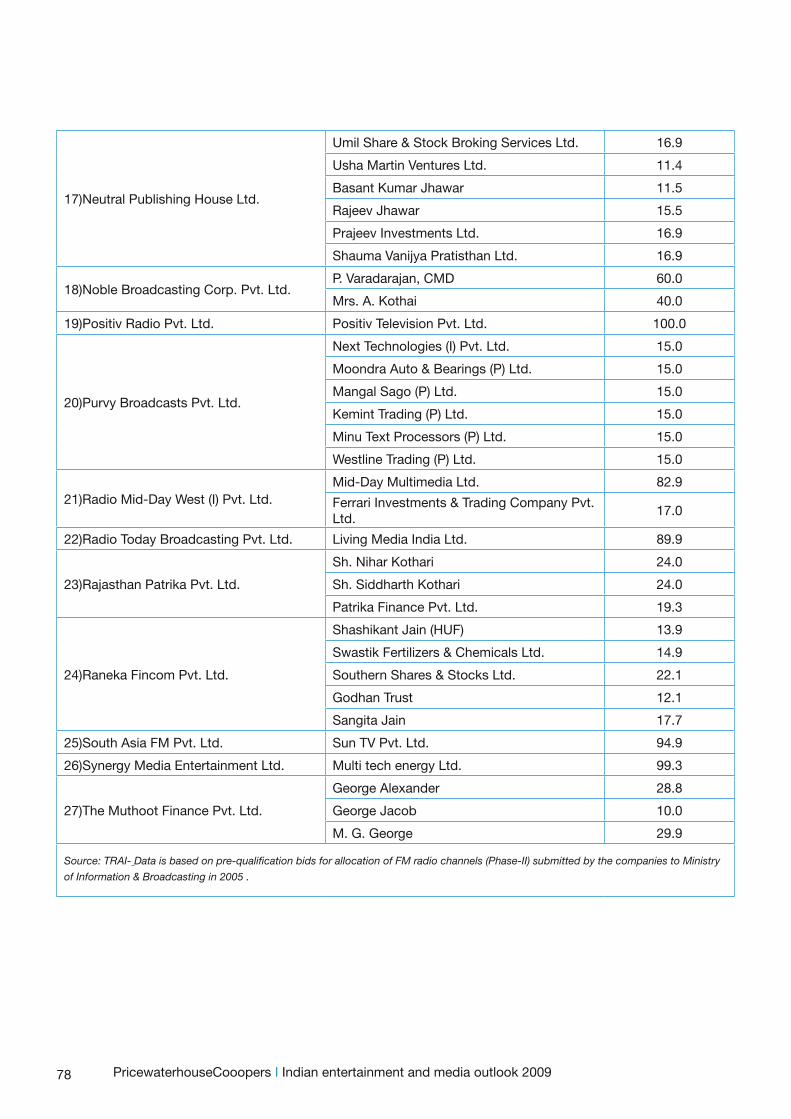
78 PricewaterhouseCooopers I Indian entertainment and media outlook 2009
17)Neutral Publishing House Ltd.
Umil Share & Stock Broking Services Ltd. 16.9
Usha Martin Ventures Ltd. 11.4
Basant Kumar Jhawar 11.5
Rajeev Jhawar 15.5
Prajeev Investments Ltd. 16.9
Shauma Vanijya Pratisthan Ltd. 16.9
18)Noble Broadcasting Corp. Pvt. Ltd. P. Varadarajan, CMD 60.0
Mrs. A. Kothai 40.0
19)Positiv Radio Pvt. Ltd. Positiv Television Pvt. Ltd. 100.0
20)Purvy Broadcasts Pvt. Ltd.
Next Technologies (I) Pvt. Ltd. 15.0
Moondra Auto & Bearings (P) Ltd. 15.0
Mangal Sago (P) Ltd. 15.0
Kemint Trading (P) Ltd. 15.0
Minu Text Processors (P) Ltd. 15.0
Westline Trading (P) Ltd. 15.0
21)Radio Mid-Day West (I) Pvt. Ltd. Mid-Day Multimedia Ltd. 82.9
Ferrari Investments & Trading Company Pvt. Ltd.
17.0
22)Radio Today Broadcasting Pvt. Ltd. Living Media India Ltd. 89.9
23)Rajasthan Patrika Pvt. Ltd.
Sh. Nihar Kothari 24.0
Sh. Siddharth Kothari 24.0
Patrika Finance Pvt. Ltd. 19.3
24)Raneka Fincom Pvt. Ltd.
Shashikant Jain (HUF) 13.9
Swastik Fertilizers & Chemicals Ltd. 14.9
Southern Shares & Stocks Ltd. 22.1
Godhan Trust 12.1
Sangita Jain 17.7
25)South Asia FM Pvt. Ltd. Sun TV Pvt. Ltd. 94.9
26)Synergy Media Entertainment Ltd. Multi tech energy Ltd. 99.3
27)The Muthoot Finance Pvt. Ltd.
George Alexander 28.8
George Jacob 10.0
M. G. George 29.9
Source: TRAI- Data is based on pre-qualification bids for allocation of FM radio channels (Phase-II) submitted by the companies to Ministry
of Information & Broadcasting in 2005 .

Emerging Segments
Music
Internet Advertising
Out-Of-Home Advertising
Animation, Gaming and VFX Industry
Sports Entertainment
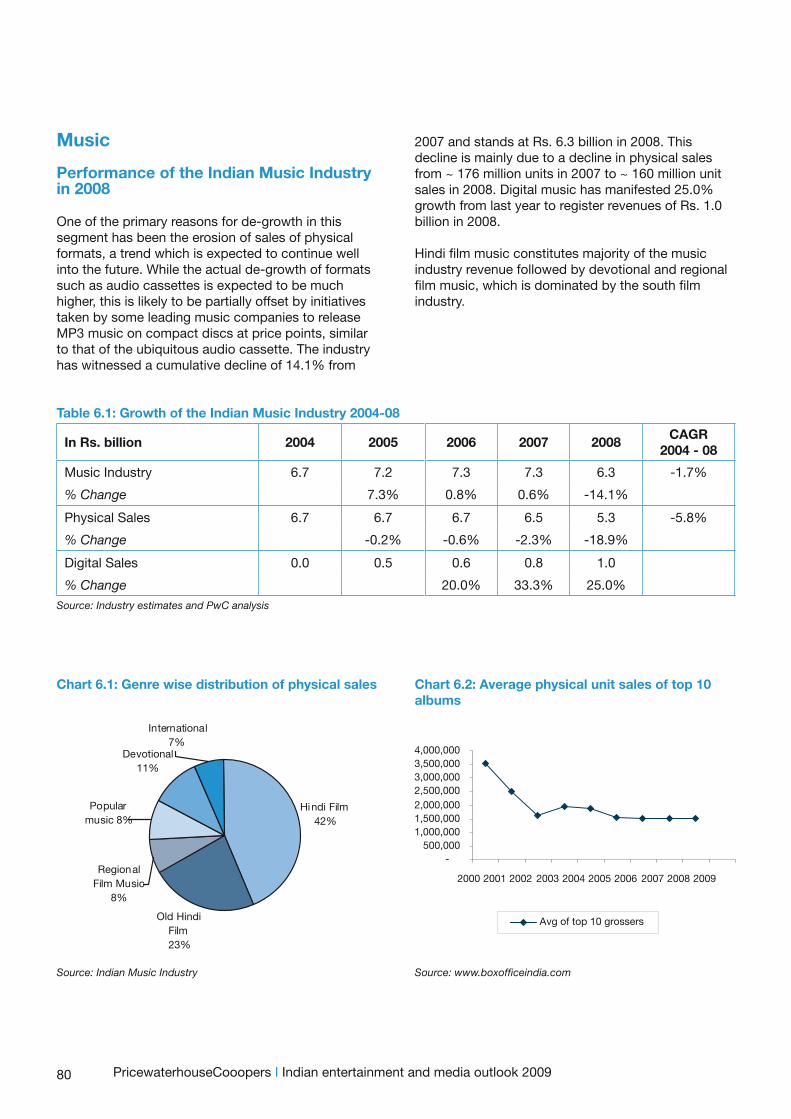
80
Music
Performance of the Indian Music Industry in 2008
One of the primary reasons for de-growth in this segment has been the erosion of sales of physical formats, a trend which is expected to continue well into the future. While the actual de-growth of formats such as audio cassettes is expected to be much higher, this is likely to be partially offset by initiatives taken by some leading music companies to release MP3 music on compact discs at price points, similar to that of the ubiquitous audio cassette. The industry has witnessed a cumulative decline of 14.1% from
2007 and stands at Rs. 6.3 billion in 2008. This decline is mainly due to a decline in physical sales from ~ 176 million units in 2007 to ~ 160 million unit sales in 2008. Digital music has manifested 25.0% growth from last year to register revenues of Rs. 1.0 billion in 2008.
Hindi film music constitutes majority of the music industry revenue followed by devotional and regional film music, which is dominated by the south film industry.
Chart 6.1: Genre wise distribution of physical sales
Source: Indian Music Industry Source: www.boxofficeindia.com
Chart 6.2: Average physical unit sales of top 10 albums
PricewaterhouseCooopers I Indian entertainment and media outlook 2009
Table 6.1: Growth of the Indian Music Industry 2004-08
In Rs. billion 2004 2005 2006 2007 2008CAGR
2004 - 08
Music Industry 6.7 7.2 7.3 7.3 6.3 -1.7%
% Change 7.3% 0.8% 0.6% -14.1%
Physical Sales 6.7 6.7 6.7 6.5 5.3 -5.8%
% Change -0.2% -0.6% -2.3% -18.9%
Digital Sales 0.0 0.5 0.6 0.8 1.0
% Change 20.0% 33.3% 25.0%
Source: Industry estimates and PwC analysis
Hindi Film42%
Old Hindi Film23%
Devotional11%
International7%
Popular music 8%
Regional Film Music
8%
-500,000
1,000,0001,500,0002,000,0002,500,0003,000,0003,500,0004,000,000
2000 2001 2002 2003 2004 2005 2006 2007 2008 2009
Avg of top 10 grossers
81
Impact of the global economic downturn in the Indian Music Industry
• The economic slowdown has further accentuated the deceleration in physical sales for the music industry. The drop in consumer spending has led to inventory built up for the distributors and retailers, who have been returning the physical stock of cassettes and CDs back to the music companies to optimize their shelf space. Most music companies struggled to maintain adequate margins due to the sales returns in the third and fourth quarter of 2008-2009.
• The soaring music acquisition rights have witnessed some corrections with music companies acquiring rights by bundling movies.
Key developments in the Indian Music Industry in 2008
Initiatives to create new platforms to maximise the potential of music on internet
• Internet is increasingly being used as a medium by the gen-next musicians, producers and managers to promote their music. Motherjane, a Bangalore based band web-cast its entire album titled Maktub and received accolades for their innovative concept with 30,000 viewers tuning-in on their official website to watch the web-cast. Indian bands like Pentagram and Themclones have also used the on-line platform to connect with bands and fans.
• UTV New Media Ltd., the digital arm of UTV, announced plans to launch an exclusive music video channel on mobile TV. It is proposed to be named and branded as UTV@play and will provide the Indian music lovers with a mobile channel, where they can access their favourite videos along with music videos from different languages. It will also have a collection of international songs.
• Rediff.com has gone live with its third-party applications on its video and music platform Rediff iShare. Rediff iShare has become a platform that can support any application that is compatible with the Facebook mark-up language. Users can share songs in audio or video format that they find on the Rediff iShare platform.
• In 2008, MSN India entered into a partnership for the launch of Noddy, an English musical based on the children’s character created by British author, Enid Blyton. MSN India provided an on-line live musical performance.
• Jalebee Cartel streamed an entire live performance as part of promoting their album Onepointnothing. As per press reports, they were able to collectively get ~3,000 people across the world to log on to their live performance on the website www.in.com.
• OML (Only much louder), an artist management production house and an event management company are working on a module with Delhi based band Themclones. As per reports, of the 17 tracks the band has composed, only 12 will be released on the physical format. Initially, all 17 tracks will be streamed on social networking websites like Face book, My-space and the bands official website. Of these 17 tracks, 12 tracks will be selected, depending on the listeners’ vote across the various websites.
Increase in number of radio stations leading to increased revenues for music industry
While there is an ongoing dispute on the music royalties paid by radio stations to music labels, however, the sheer number of radio stations in India and that over 90% of the music played on their radio stations are film songs, has increased revenues for music labels substantially in 2008. 2008 was the first year with most radio stations operating for the full year after being awarded licenses in Phase II in 2006/2007. Music labels that are affiliated to PPL (Phonographic Performance Ltd.) receive 85% of music royalty paid by radio broadcasters; balance 15% being retained by PPL for administrative expenses. While the music royalty rates are under dispute, on an average, radio stations pay ~Rs. 600 per needle hour of music played to PPL.
Music rights
While music rights used to be an important revenue source for film producers, owing to piracy and decline in physical music, the value of such music rights had dropped substantially. With the growth potential witnessed in the last few years for digital music, especially mobile music, music rights are back to their original levels and in some cases, even higher.
Emerging Segments
82
As per press reports, UTV inked a deal with T-series for music rights for 16 films for a reported sum of Rs. 30 crores. The first half of 2008 saw music acquisition rights touching the roof-top with movies like Singh is King’s music rights being sold for a reported Rs 13.5 crores.
M&A/Investments in Music Industry in 2008
• As per press reports, R-ADAG’s Big Music acquired Kolkata-based Prime Music, which is owned by singer Indranil Sen. BIG Music has plans to market and distribute the entire music catalogue of the company. Prime Music currently holds approximately 15 percent market share in Bengali music. The company excels mostly in non-film artist based music. It specializes in Tagore Sangeet, Nazrul Sangeet and Adhunik Sangeet.
• JMD Telefilms Industries acquired two Rajasthan based music companies - Arti Music and Tarun Music - for Rs. 1.5 million. The acquisition includes all existing music rights in the name of Arti Music and Tarun Music, as well as the use of the brand names of the company in the future. Additionally, JMD Telefilms will pay 25 percent as compensation after deducting all its expenses attributed on the said rights on an annual basis out of the profit from sale of the brands.
Key International Trends in the Music Industry in 2008
Global Outlook
• Global spending on recorded music will decrease from $29.6 billion in 2008 to $26.1 billion in 2013, a 2.5% compound annual decline. Asia Pacific will be the only region, where overall recorded music spending will be higher in 2013 than in 2008.
• Spending on physical formats will fall by 49% during the next five years○a CAGR of 12.5%○to $11.3 billion in 2013 from $22 billion in 2008.
• The digital market is dominated by Internet distribution in North America and EMEA and by mobile distribution in Asia Pacific and Latin America. Digital distribution will increase from $7.6 billion in 2008 to $14.8 billion in 2013, a CAGR of 14.2 percent.
• Internet distribution will be the faster-growing component of the digital market, rising at a
21.2% compound annual rate to $8.8 billion in 2013 from $3.4 billion in 2008.
• Mobile phone distribution will increase by 7.1% compounded annually from $4.3 billion in 2008 to $6 billion in 2013. In North America and EMEA, the mobile phone market will be lower in 2013 than in 2008.
• Globally, digital distribution of recorded music will overtake physical distribution in 2012 the first segment of E&M where this watershed will occur.
Regional growth
• EMEA will remain the largest region for recorded music throughout the forecast period, despite suffering a 3.6% decrease compounded annually to $9.2 billion in 2013.
• North America○whose recorded music market is being overtaken by Asia Pacific in 2009○will decline by 4.4% compounded annually to $7.2 billion in 2013 from $9 billion in 2008.
• Asia Pacific will firmly establish itself as the second-largest region, rising to $8.7 billion in 2013, a 0.4% compound annual increase from $8.6 billion in 2008.
• Latin America will decline at a 0.4% compound annual rate to $938 million in 2013 from $957 million in 2008.
• In North America and Asia Pacific, digital will surpass physical in 2011, while in EMEA and Latin America, physical will remain the largest component through 2013.
• In each region, gains in digital will ultimately offset continued decline in physical formats. Asia Pacific will be the first region to experience this turnaround, with spending beginning to increase in 2011, followed by Latin America in 2012 and North America in 2013. In EMEA, spending will stabilize in 2013.
Key drivers
• Physical distribution will decline in each region because of competition from legitimate digital services and piracy.
• The digital market is dominated by Internet distribution in North America and EMEA and by mobile distribution in Asia Pacific and Latin America. The availability of music without copyright protection software and a growing broadband universe will boost Internet distribution.
• The adoption of graduated-response systems,
PricewaterhouseCooopers I Indian entertainment and media outlook 2009
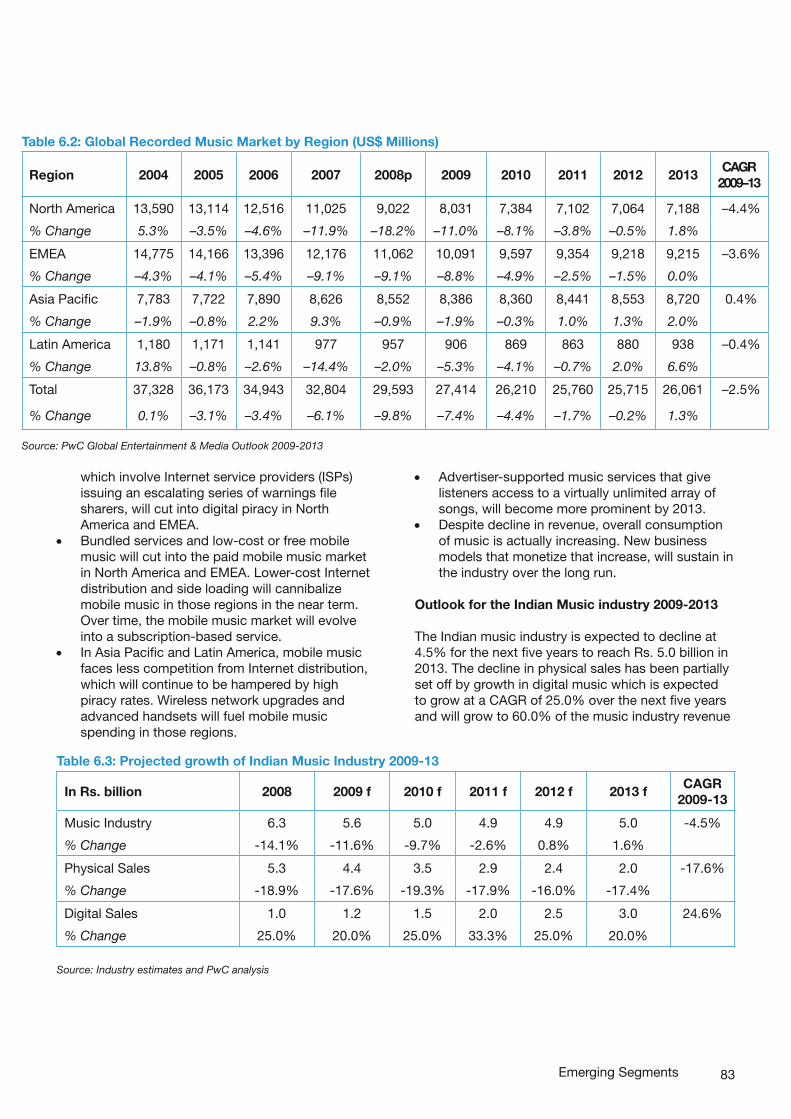
83
Table 6.2: Global Recorded Music Market by Region (US$ Millions)
Region 2004 2005 2006 2007 2008p 2009 2010 2011 2012 2013CAGR
2009–13
North America 13,590 13,114 12,516 11,025 9,022 8,031 7,384 7,102 7,064 7,188 –4.4%
% Change 5.3% –3.5% –4.6% –11.9% –18.2% –11.0% –8.1% –3.8% –0.5% 1.8%
EMEA 14,775 14,166 13,396 12,176 11,062 10,091 9,597 9,354 9,218 9,215 –3.6%
% Change –4.3% –4.1% –5.4% –9.1% –9.1% –8.8% –4.9% –2.5% –1.5% 0.0%
Asia Pacific 7,783 7,722 7,890 8,626 8,552 8,386 8,360 8,441 8,553 8,720 0.4%
% Change –1.9% –0.8% 2.2% 9.3% –0.9% –1.9% –0.3% 1.0% 1.3% 2.0%
Latin America 1,180 1,171 1,141 977 957 906 869 863 880 938 –0.4%
% Change 13.8% –0.8% –2.6% –14.4% –2.0% –5.3% –4.1% –0.7% 2.0% 6.6%
Total 37,328 36,173 34,943 32,804 29,593 27,414 26,210 25,760 25,715 26,061 –2.5%
% Change 0.1% –3.1% –3.4% –6.1% –9.8% –7.4% –4.4% –1.7% –0.2% 1.3%
Source: PwC Global Entertainment & Media Outlook 2009-2013
which involve Internet service providers (ISPs) issuing an escalating series of warnings file sharers, will cut into digital piracy in North America and EMEA.
• Bundled services and low-cost or free mobile music will cut into the paid mobile music market in North America and EMEA. Lower-cost Internet distribution and side loading will cannibalize mobile music in those regions in the near term. Over time, the mobile music market will evolve into a subscription-based service.
• In Asia Pacific and Latin America, mobile music faces less competition from Internet distribution, which will continue to be hampered by high piracy rates. Wireless network upgrades and advanced handsets will fuel mobile music spending in those regions.
• Advertiser-supported music services that give listeners access to a virtually unlimited array of songs, will become more prominent by 2013.
• Despite decline in revenue, overall consumption of music is actually increasing. New business models that monetize that increase, will sustain in the industry over the long run.
Outlook for the Indian Music industry 2009-2013
The Indian music industry is expected to decline at 4.5% for the next five years to reach Rs. 5.0 billion in 2013. The decline in physical sales has been partially set off by growth in digital music which is expected to grow at a CAGR of 25.0% over the next five years and will grow to 60.0% of the music industry revenue
Emerging Segments
Table 6.3: Projected growth of Indian Music Industry 2009-13
In Rs. billion 2008 2009 f 2010 f 2011 f 2012 f 2013 fCAGR
2009-13
Music Industry 6.3 5.6 5.0 4.9 4.9 5.0 -4.5%
% Change -14.1% -11.6% -9.7% -2.6% 0.8% 1.6%
Physical Sales 5.3 4.4 3.5 2.9 2.4 2.0 -17.6%
% Change -18.9% -17.6% -19.3% -17.9% -16.0% -17.4%
Digital Sales 1.0 1.2 1.5 2.0 2.5 3.0 24.6%
% Change 25.0% 20.0% 25.0% 33.3% 25.0% 20.0%
Source: Industry estimates and PwC analysis
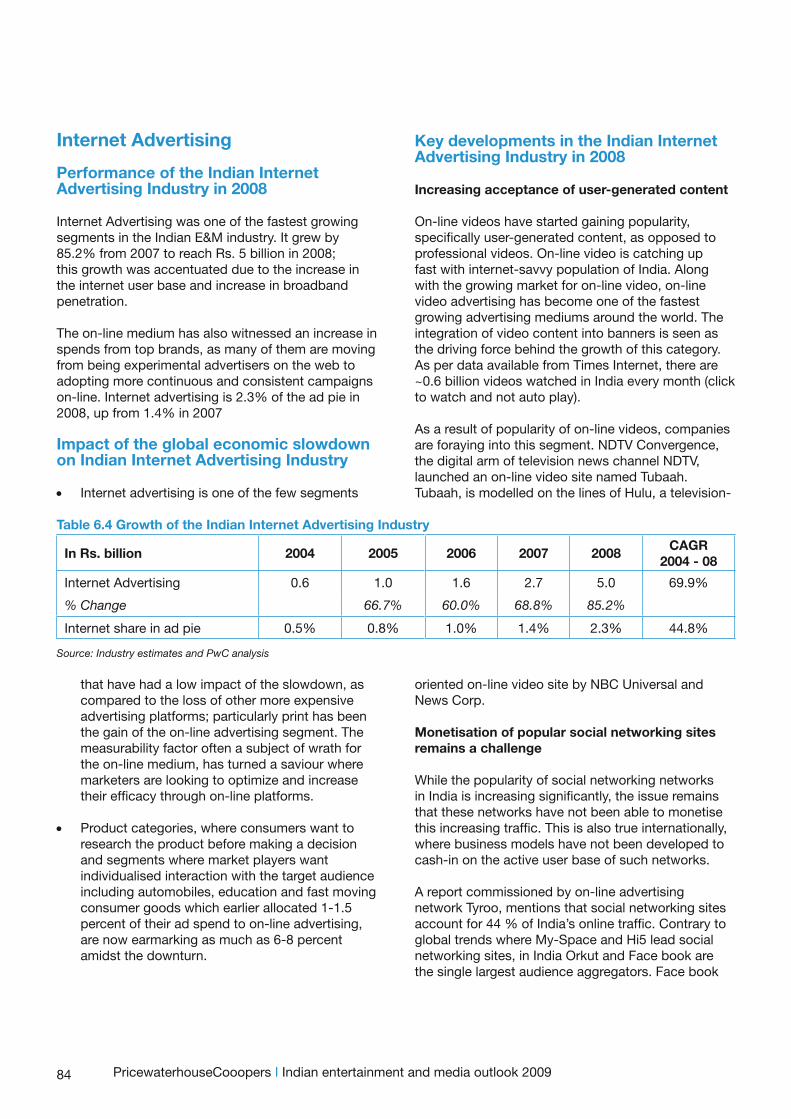
84
Internet Advertising
Performance of the Indian Internet Advertising Industry in 2008
Internet Advertising was one of the fastest growing segments in the Indian E&M industry. It grew by 85.2% from 2007 to reach Rs. 5 billion in 2008; this growth was accentuated due to the increase in the internet user base and increase in broadband penetration.
The on-line medium has also witnessed an increase in spends from top brands, as many of them are moving from being experimental advertisers on the web to adopting more continuous and consistent campaigns on-line. Internet advertising is 2.3% of the ad pie in 2008, up from 1.4% in 2007
Impact of the global economic slowdown on Indian Internet Advertising Industry
• Internet advertising is one of the few segments
Key developments in the Indian Internet Advertising Industry in 2008
Increasing acceptance of user-generated content
On-line videos have started gaining popularity, specifically user-generated content, as opposed to professional videos. On-line video is catching up fast with internet-savvy population of India. Along with the growing market for on-line video, on-line video advertising has become one of the fastest growing advertising mediums around the world. The integration of video content into banners is seen as the driving force behind the growth of this category. As per data available from Times Internet, there are ~0.6 billion videos watched in India every month (click to watch and not auto play).
As a result of popularity of on-line videos, companies are foraying into this segment. NDTV Convergence, the digital arm of television news channel NDTV, launched an on-line video site named Tubaah. Tubaah, is modelled on the lines of Hulu, a television-
that have had a low impact of the slowdown, as compared to the loss of other more expensive advertising platforms; particularly print has been the gain of the on-line advertising segment. The measurability factor often a subject of wrath for the on-line medium, has turned a saviour where marketers are looking to optimize and increase their efficacy through on-line platforms.
• Product categories, where consumers want to research the product before making a decision and segments where market players want individualised interaction with the target audience including automobiles, education and fast moving consumer goods which earlier allocated 1-1.5 percent of their ad spend to on-line advertising, are now earmarking as much as 6-8 percent amidst the downturn.
oriented on-line video site by NBC Universal and News Corp.
Monetisation of popular social networking sites remains a challenge
While the popularity of social networking networks in India is increasing significantly, the issue remains that these networks have not been able to monetise this increasing traffic. This is also true internationally, where business models have not been developed to cash-in on the active user base of such networks.
A report commissioned by on-line advertising network Tyroo, mentions that social networking sites account for 44 % of India’s online traffic. Contrary to global trends where My-Space and Hi5 lead social networking sites, in India Orkut and Face book are the single largest audience aggregators. Face book
PricewaterhouseCooopers I Indian entertainment and media outlook 2009
Table 6.4 Growth of the Indian Internet Advertising Industry
In Rs. billion 2004 2005 2006 2007 2008CAGR
2004 - 08
Internet Advertising 0.6 1.0 1.6 2.7 5.0 69.9%
% Change 66.7% 60.0% 68.8% 85.2%
Internet share in ad pie 0.5% 0.8% 1.0% 1.4% 2.3% 44.8%
Source: Industry estimates and PwC analysis
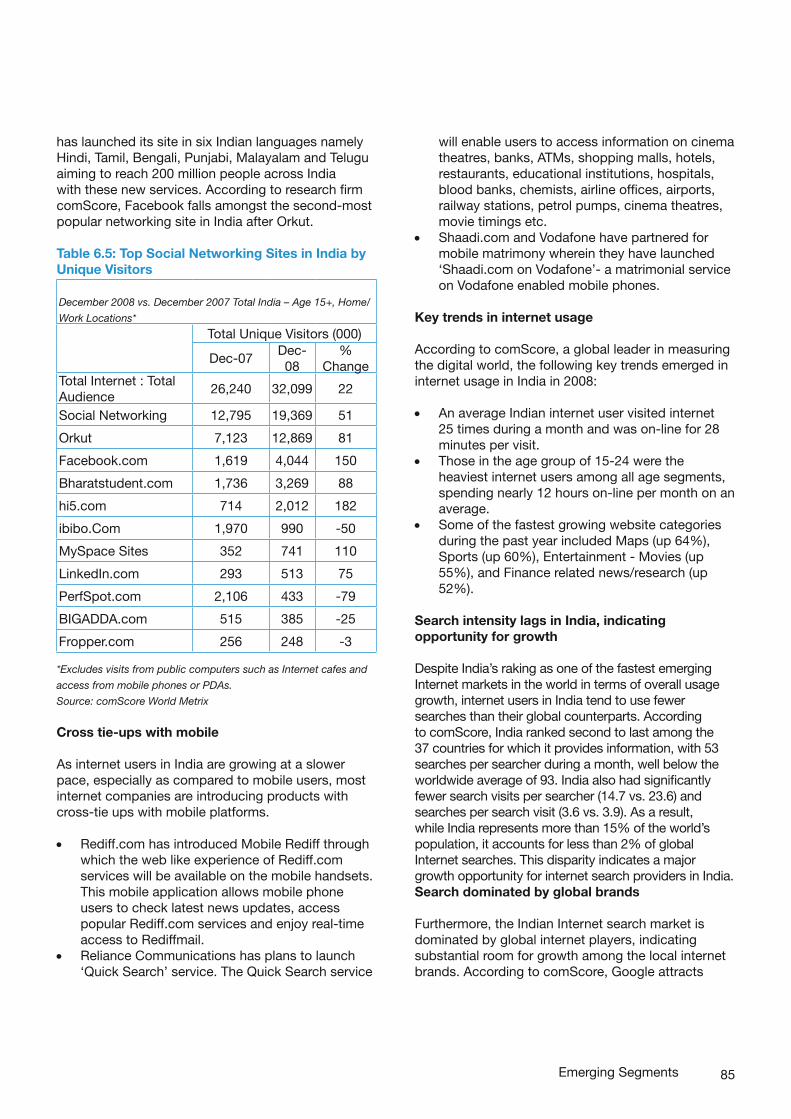
85
has launched its site in six Indian languages namely Hindi, Tamil, Bengali, Punjabi, Malayalam and Telugu aiming to reach 200 million people across India with these new services. According to research firm comScore, Facebook falls amongst the second-most popular networking site in India after Orkut.
Table 6.5: Top Social Networking Sites in India by Unique Visitors
December 2008 vs. December 2007 Total India – Age 15+, Home/
Work Locations*
Total Unique Visitors (000)
Dec-07 Dec-08
% Change
Total Internet : Total Audience
26,240 32,099 22
Social Networking 12,795 19,369 51
Orkut 7,123 12,869 81
Facebook.com 1,619 4,044 150
Bharatstudent.com 1,736 3,269 88
hi5.com 714 2,012 182
ibibo.Com 1,970 990 -50
MySpace Sites 352 741 110
LinkedIn.com 293 513 75
PerfSpot.com 2,106 433 -79
BIGADDA.com 515 385 -25
Fropper.com 256 248 -3
*Excludes visits from public computers such as Internet cafes and
access from mobile phones or PDAs.
Source: comScore World Metrix
Cross tie-ups with mobile
As internet users in India are growing at a slower pace, especially as compared to mobile users, most internet companies are introducing products with cross-tie ups with mobile platforms.
• Rediff.com has introduced Mobile Rediff through which the web like experience of Rediff.com services will be available on the mobile handsets. This mobile application allows mobile phone users to check latest news updates, access popular Rediff.com services and enjoy real-time access to Rediffmail.
• Reliance Communications has plans to launch ‘Quick Search’ service. The Quick Search service
will enable users to access information on cinema theatres, banks, ATMs, shopping malls, hotels, restaurants, educational institutions, hospitals, blood banks, chemists, airline offices, airports, railway stations, petrol pumps, cinema theatres, movie timings etc.
• Shaadi.com and Vodafone have partnered for mobile matrimony wherein they have launched ‘Shaadi.com on Vodafone’- a matrimonial service on Vodafone enabled mobile phones.
Key trends in internet usage
According to comScore, a global leader in measuring the digital world, the following key trends emerged in internet usage in India in 2008:
• An average Indian internet user visited internet 25 times during a month and was on-line for 28 minutes per visit.
• Those in the age group of 15-24 were the heaviest internet users among all age segments, spending nearly 12 hours on-line per month on an average.
• Some of the fastest growing website categories during the past year included Maps (up 64%), Sports (up 60%), Entertainment - Movies (up 55%), and Finance related news/research (up 52%).
Search intensity lags in India, indicating opportunity for growth
Despite India’s raking as one of the fastest emerging Internet markets in the world in terms of overall usage growth, internet users in India tend to use fewer searches than their global counterparts. According to comScore, India ranked second to last among the 37 countries for which it provides information, with 53 searches per searcher during a month, well below the worldwide average of 93. India also had significantly fewer search visits per searcher (14.7 vs. 23.6) and searches per search visit (3.6 vs. 3.9). As a result, while India represents more than 15% of the world’s population, it accounts for less than 2% of global Internet searches. This disparity indicates a major growth opportunity for internet search providers in India. Search dominated by global brands
Furthermore, the Indian Internet search market is dominated by global internet players, indicating substantial room for growth among the local internet brands. According to comScore, Google attracts
Emerging Segments
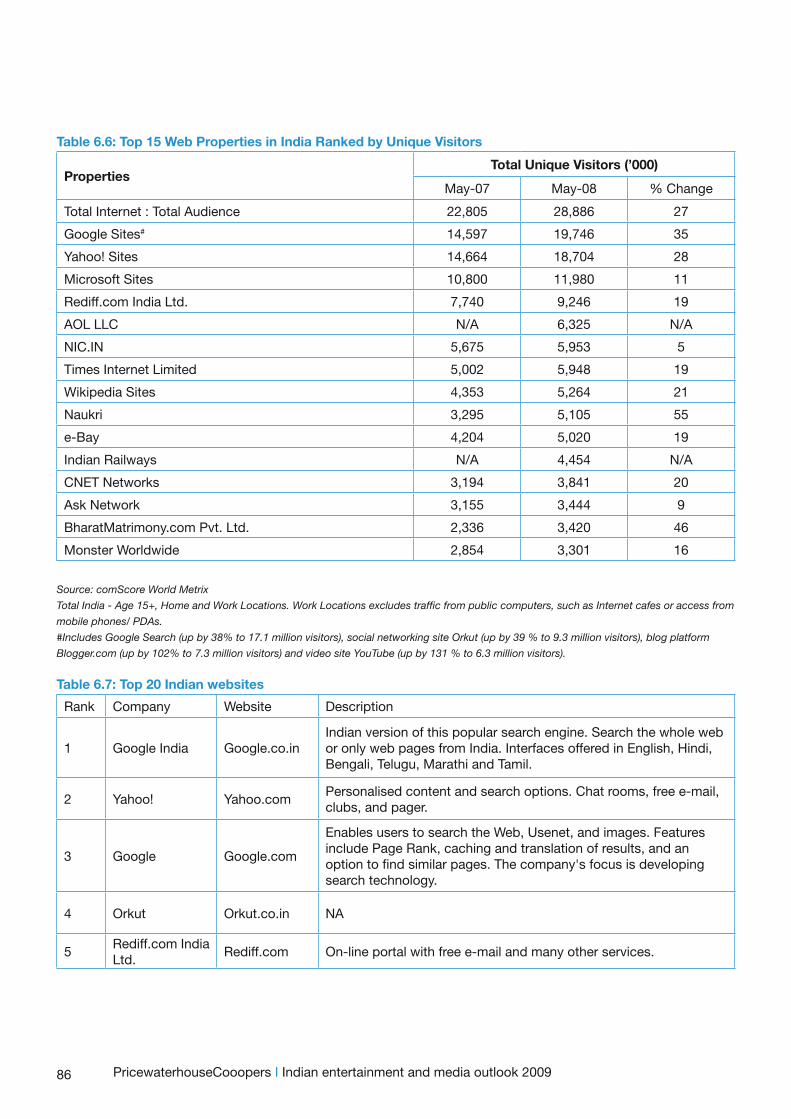
86
Table 6.6: Top 15 Web Properties in India Ranked by Unique Visitors
PropertiesTotal Unique Visitors (’000)
May-07 May-08 % Change
Total Internet : Total Audience 22,805 28,886 27
Google Sites# 14,597 19,746 35
Yahoo! Sites 14,664 18,704 28
Microsoft Sites 10,800 11,980 11
Rediff.com India Ltd. 7,740 9,246 19
AOL LLC N/A 6,325 N/A
NIC.IN 5,675 5,953 5
Times Internet Limited 5,002 5,948 19
Wikipedia Sites 4,353 5,264 21
Naukri 3,295 5,105 55
e-Bay 4,204 5,020 19
Indian Railways N/A 4,454 N/A
CNET Networks 3,194 3,841 20
Ask Network 3,155 3,444 9
BharatMatrimony.com Pvt. Ltd. 2,336 3,420 46
Monster Worldwide 2,854 3,301 16
Source: comScore World Metrix
Total India - Age 15+, Home and Work Locations. Work Locations excludes traffic from public computers, such as Internet cafes or access from
mobile phones/ PDAs.
#Includes Google Search (up by 38% to 17.1 million visitors), social networking site Orkut (up by 39 % to 9.3 million visitors), blog platform
Blogger.com (up by 102% to 7.3 million visitors) and video site YouTube (up by 131 % to 6.3 million visitors).
Table 6.7: Top 20 Indian websites
Rank Company Website Description
1 Google India Google.co.inIndian version of this popular search engine. Search the whole web or only web pages from India. Interfaces offered in English, Hindi, Bengali, Telugu, Marathi and Tamil.
2 Yahoo! Yahoo.comPersonalised content and search options. Chat rooms, free e-mail, clubs, and pager.
3 Google Google.com
Enables users to search the Web, Usenet, and images. Features include Page Rank, caching and translation of results, and an option to find similar pages. The company's focus is developing search technology.
4 Orkut Orkut.co.in NA
5Rediff.com India Ltd.
Rediff.com On-line portal with free e-mail and many other services.
PricewaterhouseCooopers I Indian entertainment and media outlook 2009
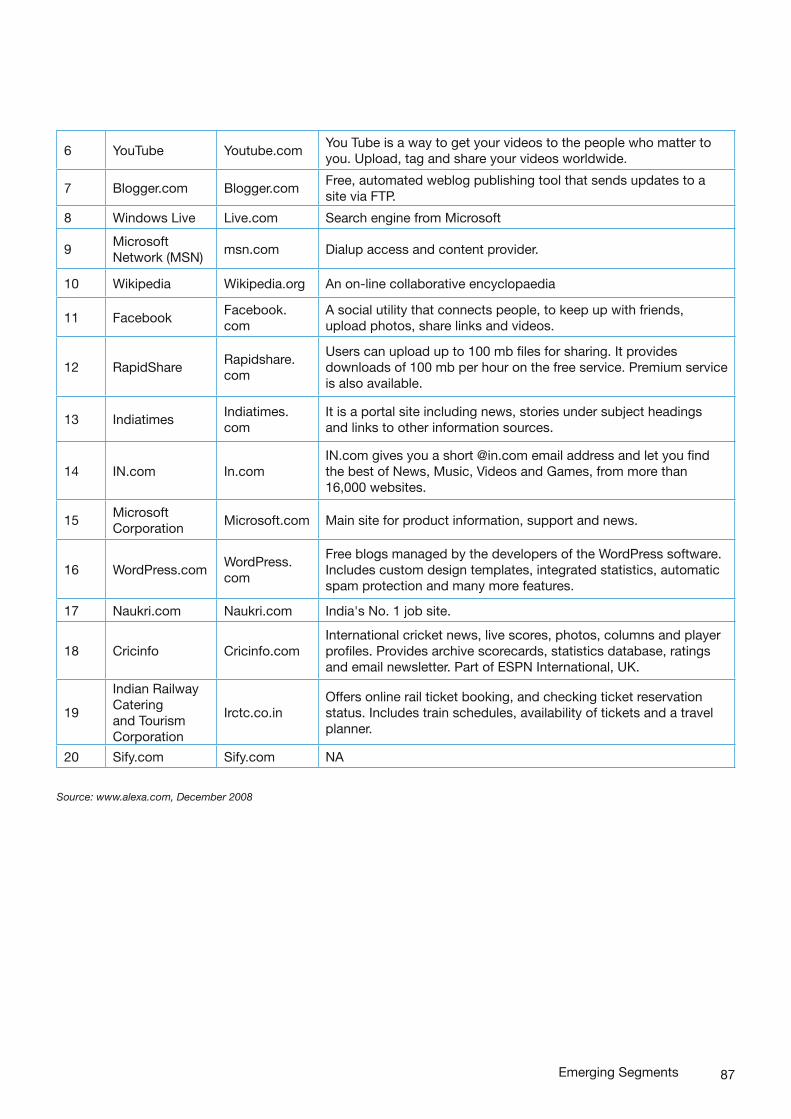
87
6 YouTube Youtube.comYou Tube is a way to get your videos to the people who matter to you. Upload, tag and share your videos worldwide.
7 Blogger.com Blogger.comFree, automated weblog publishing tool that sends updates to a site via FTP.
8 Windows Live Live.com Search engine from Microsoft
9Microsoft Network (MSN)
msn.com Dialup access and content provider.
10 Wikipedia Wikipedia.org An on-line collaborative encyclopaedia
11 FacebookFacebook.com
A social utility that connects people, to keep up with friends, upload photos, share links and videos.
12 RapidShareRapidshare.com
Users can upload up to 100 mb files for sharing. It provides downloads of 100 mb per hour on the free service. Premium service is also available.
13 IndiatimesIndiatimes.com
It is a portal site including news, stories under subject headings and links to other information sources.
14 IN.com In.comIN.com gives you a short @in.com email address and let you find the best of News, Music, Videos and Games, from more than 16,000 websites.
15Microsoft Corporation
Microsoft.com Main site for product information, support and news.
16 WordPress.comWordPress.com
Free blogs managed by the developers of the WordPress software. Includes custom design templates, integrated statistics, automatic spam protection and many more features.
17 Naukri.com Naukri.com India's No. 1 job site.
18 Cricinfo Cricinfo.comInternational cricket news, live scores, photos, columns and player profiles. Provides archive scorecards, statistics database, ratings and email newsletter. Part of ESPN International, UK.
19
Indian Railway Catering and Tourism Corporation
Irctc.co.inOffers online rail ticket booking, and checking ticket reservation status. Includes train schedules, availability of tickets and a travel planner.
20 Sify.com Sify.com NA
Source: www.alexa.com, December 2008
Emerging Segments
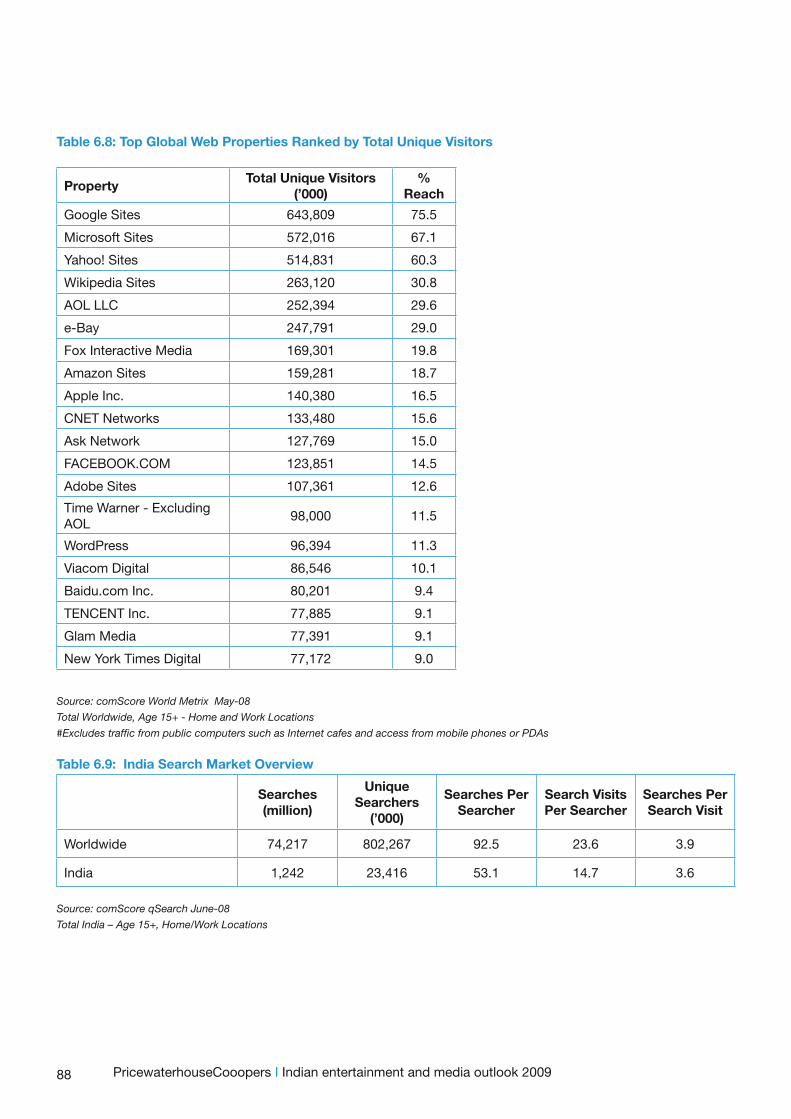
88
Table 6.8: Top Global Web Properties Ranked by Total Unique Visitors
Property Total Unique Visitors
(’000)%
Reach
Google Sites 643,809 75.5
Microsoft Sites 572,016 67.1
Yahoo! Sites 514,831 60.3
Wikipedia Sites 263,120 30.8
AOL LLC 252,394 29.6
e-Bay 247,791 29.0
Fox Interactive Media 169,301 19.8
Amazon Sites 159,281 18.7
Apple Inc. 140,380 16.5
CNET Networks 133,480 15.6
Ask Network 127,769 15.0
FACEBOOK.COM 123,851 14.5
Adobe Sites 107,361 12.6
Time Warner - Excluding AOL
98,000 11.5
WordPress 96,394 11.3
Viacom Digital 86,546 10.1
Baidu.com Inc. 80,201 9.4
TENCENT Inc. 77,885 9.1
Glam Media 77,391 9.1
New York Times Digital 77,172 9.0
Source: comScore World Metrix May-08
Total Worldwide, Age 15+ - Home and Work Locations
#Excludes traffic from public computers such as Internet cafes and access from mobile phones or PDAs
Table 6.9: India Search Market Overview
Searches (million)
Unique Searchers
(’000)
Searches Per Searcher
Search Visits Per Searcher
Searches Per Search Visit
Worldwide 74,217 802,267 92.5 23.6 3.9
India 1,242 23,416 53.1 14.7 3.6
Source: comScore qSearch June-08
Total India – Age 15+, Home/Work Locations
PricewaterhouseCooopers I Indian entertainment and media outlook 2009
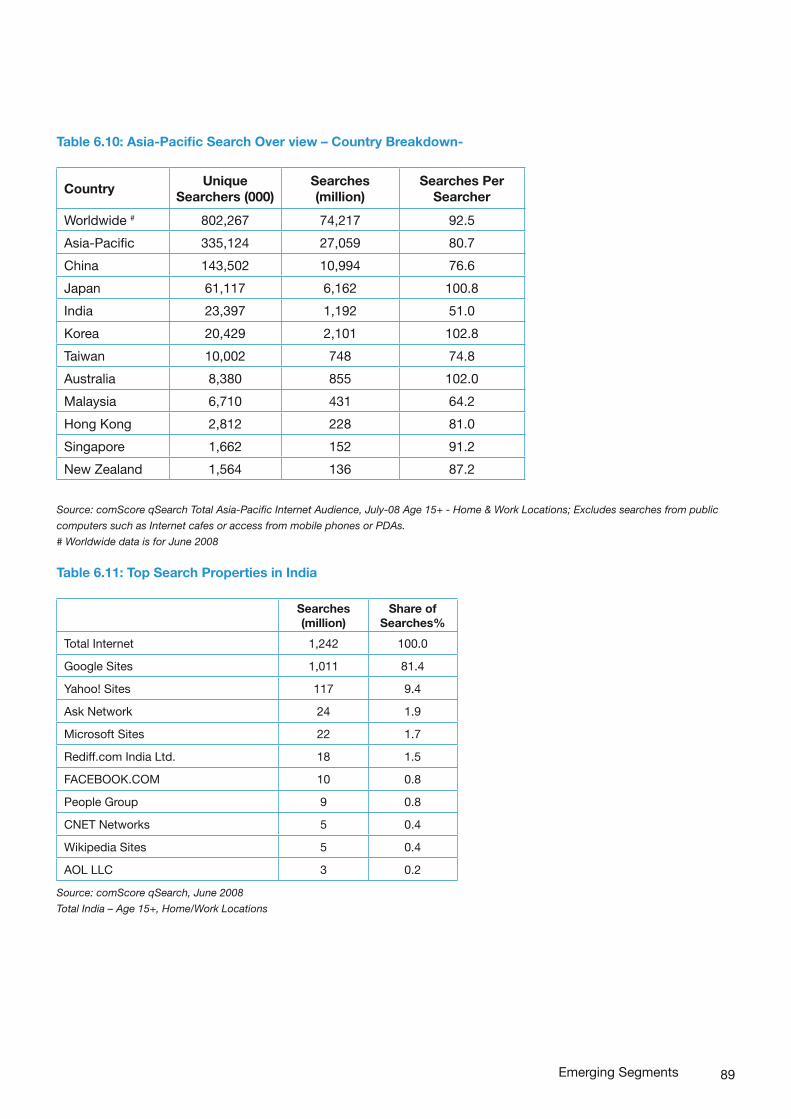
89
Table 6.10: Asia-Pacific Search Over view – Country Breakdown-
CountryUnique
Searchers (000)Searches (million)
Searches Per Searcher
Worldwide # 802,267 74,217 92.5
Asia-Pacific 335,124 27,059 80.7
China 143,502 10,994 76.6
Japan 61,117 6,162 100.8
India 23,397 1,192 51.0
Korea 20,429 2,101 102.8
Taiwan 10,002 748 74.8
Australia 8,380 855 102.0
Malaysia 6,710 431 64.2
Hong Kong 2,812 228 81.0
Singapore 1,662 152 91.2
New Zealand 1,564 136 87.2
Source: comScore qSearch Total Asia-Pacific Internet Audience, July-08 Age 15+ - Home & Work Locations; Excludes searches from public
computers such as Internet cafes or access from mobile phones or PDAs.
# Worldwide data is for June 2008
Table 6.11: Top Search Properties in India
Searches (million)
Share of Searches%
Total Internet 1,242 100.0
Google Sites 1,011 81.4
Yahoo! Sites 117 9.4
Ask Network 24 1.9
Microsoft Sites 22 1.7
Rediff.com India Ltd. 18 1.5
FACEBOOK.COM 10 0.8
People Group 9 0.8
CNET Networks 5 0.4
Wikipedia Sites 5 0.4
AOL LLC 3 0.2
Source: comScore qSearch, June 2008
Total India – Age 15+, Home/Work Locations
Emerging Segments
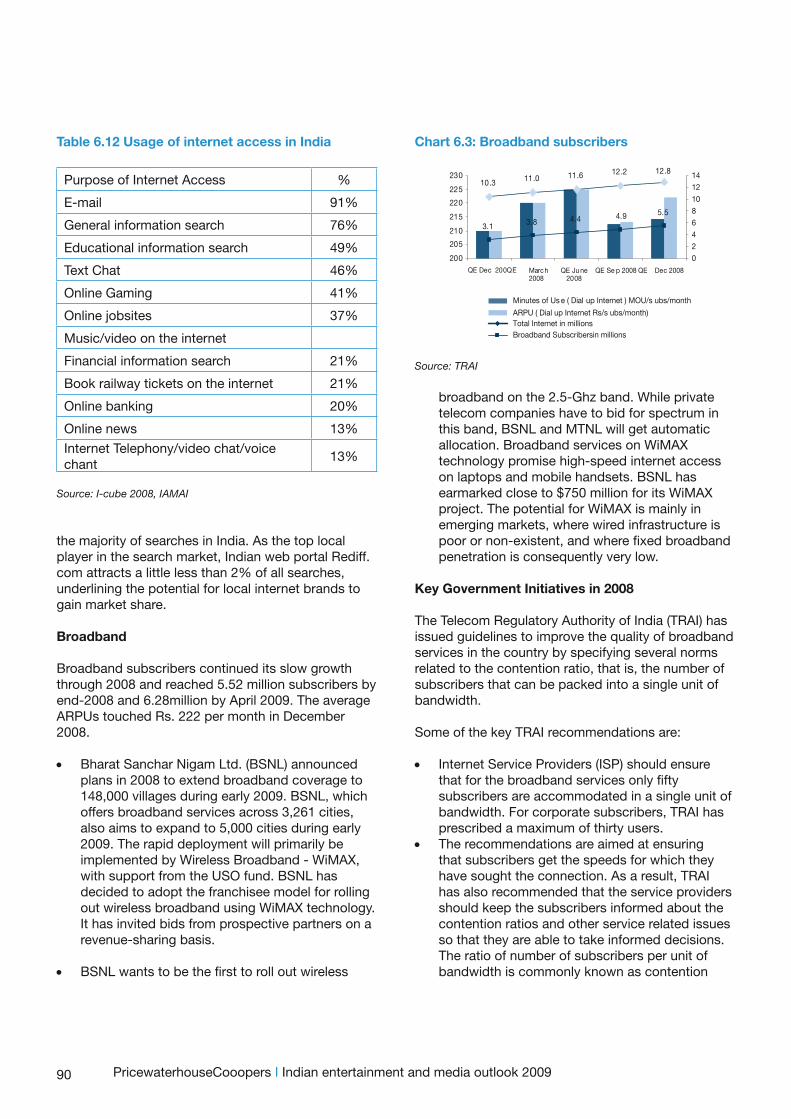
90
the majority of searches in India. As the top local player in the search market, Indian web portal Rediff.com attracts a little less than 2% of all searches, underlining the potential for local internet brands to gain market share.
Broadband
Broadband subscribers continued its slow growth through 2008 and reached 5.52 million subscribers by end-2008 and 6.28million by April 2009. The average ARPUs touched Rs. 222 per month in December 2008.
• Bharat Sanchar Nigam Ltd. (BSNL) announced plans in 2008 to extend broadband coverage to 148,000 villages during early 2009. BSNL, which offers broadband services across 3,261 cities, also aims to expand to 5,000 cities during early 2009. The rapid deployment will primarily be implemented by Wireless Broadband - WiMAX, with support from the USO fund. BSNL has decided to adopt the franchisee model for rolling out wireless broadband using WiMAX technology. It has invited bids from prospective partners on a revenue-sharing basis.
• BSNL wants to be the first to roll out wireless
Table 6.12 Usage of internet access in India
Purpose of Internet Access %
E-mail 91%
General information search 76%
Educational information search 49%
Text Chat 46%
Online Gaming 41%
Online jobsites 37%
Music/video on the internet
Financial information search 21%
Book railway tickets on the internet 21%
Online banking 20%
Online news 13%
Internet Telephony/video chat/voice chant
13%
Source: I-cube 2008, IAMAI
broadband on the 2.5-Ghz band. While private telecom companies have to bid for spectrum in this band, BSNL and MTNL will get automatic allocation. Broadband services on WiMAX technology promise high-speed internet access on laptops and mobile handsets. BSNL has earmarked close to $750 million for its WiMAX project. The potential for WiMAX is mainly in emerging markets, where wired infrastructure is poor or non-existent, and where fixed broadband penetration is consequently very low.
Key Government Initiatives in 2008
The Telecom Regulatory Authority of India (TRAI) has issued guidelines to improve the quality of broadband services in the country by specifying several norms related to the contention ratio, that is, the number of subscribers that can be packed into a single unit of bandwidth.
Some of the key TRAI recommendations are:
• Internet Service Providers (ISP) should ensure that for the broadband services only fifty subscribers are accommodated in a single unit of bandwidth. For corporate subscribers, TRAI has prescribed a maximum of thirty users.
• The recommendations are aimed at ensuring that subscribers get the speeds for which they have sought the connection. As a result, TRAI has also recommended that the service providers should keep the subscribers informed about the contention ratios and other service related issues so that they are able to take informed decisions. The ratio of number of subscribers per unit of bandwidth is commonly known as contention
Chart 6.3: Broadband subscribers
Source: TRAI
PricewaterhouseCooopers I Indian entertainment and media outlook 2009
10.3 11.0 11.6 12.2 12.8
3.1 3.8 4.4 4.9 5.5
200
205
210
215
220
225
230
March2008
QE Se p 2008 QE Dec 2008
024
6810
1214
Minutes of Us e ( Dial up Internet ) MOU/s ubs/month
ARPU ( Dial up Internet Rs/s ubs/month)Total Internet in millionsBroadband Subscribersin millions
QE Dec 200QE QE Ju ne2008
91
ratio and it may vary depending on the quality of service the ISP is planning to offer. The higher the ratio, the more will be the congestion levels.
M&A/Investments in Indian Internet Advertising Industry in 2008
• Publishing firm Infomedia 18 Ltd has acquired local reviews website Burmp! for an undisclosed amount. Burrp! is one of the first few local information websites launched in the Indian market in the last three years.
• IDG Ventures India, a $150 million early-stage technology venture capital fund, announced its investment in on-line advertising network Ozone Media. As part of the investment, Manik Arora and Ritesh Banglani from IDG Ventures India would join the company’s Board of Directors.
• Rediff picked up a 26% stake in the US based educational testing services provider, Examville.com. Examville.com provides testing services for SAT and other examinations. The portal is a global educational community that allows users to connect and interact with other students and teachers from around the world. Rediff had also announced investments of undisclosed sum in Vakow.com, an SMS content sharing social community started by IIT Bombay alumni Rahul Gupta and Amit Upadhyay.
• On-line advertising firm Komli has received $7 million venture financing from Nexus India Capital, along with co-investors Draper Fisher Jurvetson and Helion Ventures. Komli has two Indian ad networks – Komli Performance Network and Komli Premium Network. Besides these, there is PubMatic, which helps publishers’ optimise the value of their on-line advertising. In addition, the company recently launched two first-of-its-kind services for Indian advertisers – Search RePlay, a solution that combines search and display advertising to allow advertisers to more effectively target customers.
• Myntra.com, the on-demand personalisation company, has received $5 million from NEA-Indo US Ventures (NEA-IUV) and IDG Ventures to fund its expansion into new geographies and product segments.
• Times Internet Limited (TIL), a part of India’s largest media house (Times Group), has made a strategic investment, equivalent to 50% stake, in Webnotions Books India Private Ltd. As part of this investment, the Times Group will create value for A1Books by providing brand to expand
its growing market. A1Books shall make available over a million book titles on TIL’s indiatimes.com and will in turn capitalise on the latter’s huge user base in India. A1Books bring in its book-focused technology platform, where Indian book publishers, distributors, importers and retailers can register and sell their inventory.
Key International Trends in the Internet Advertising Industry in 2008
Global Outlook
• Overall global spending on internet advertising both wired and mobile will rise to $87 billion in 2013, growing at a 7.7 percent compound annual rate from $60 billion in 2008.
• Global spending will be hit by the advertising recession, declining by 1.9 percent in 2009.
• However, this fall will be wholly due to wired internet advertising, which will decline by 2.5 percent in 2009 before resuming growth in 2010. In contrast, mobile advertising will continue to grow in 2009, albeit at a much slower pace than in 2008.
• Over the five-year forecast period, mobile advertising will grow significantly faster than wired one from a relatively low base, rising to $9.2 billion in 2013 from $3.8 billion in 2008, a CAGR of 19.7 percent.
• Growth in wired internet advertising will accelerate in 2011-13, taking it to $77.5 billion in 2013 from $56.1 billion in 2008, a CAGR of 6.7 percent over the five-year period.
• Despite the stronger growth from mobile advertising, wired internet advertising will still account for 89 percent of the overall market in 2013.
Emerging Segments
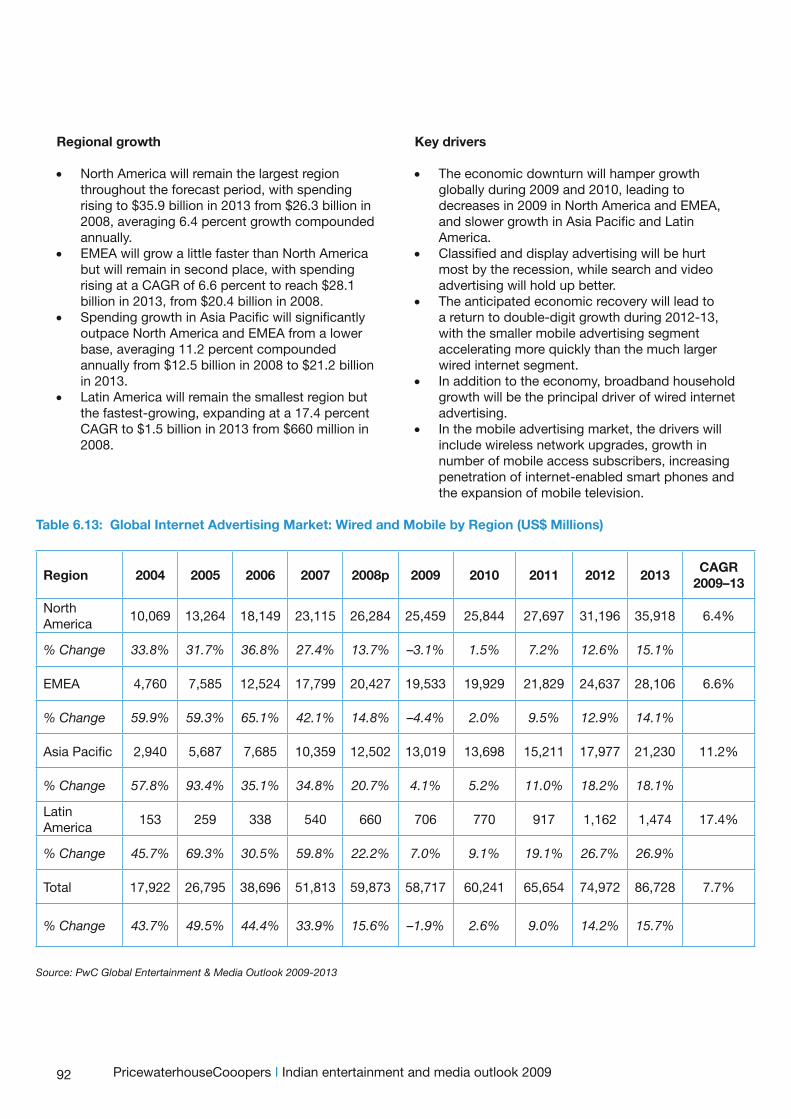
92
Regional growth
• North America will remain the largest region throughout the forecast period, with spending rising to $35.9 billion in 2013 from $26.3 billion in 2008, averaging 6.4 percent growth compounded annually.
• EMEA will grow a little faster than North America but will remain in second place, with spending rising at a CAGR of 6.6 percent to reach $28.1 billion in 2013, from $20.4 billion in 2008.
• Spending growth in Asia Pacific will significantly outpace North America and EMEA from a lower base, averaging 11.2 percent compounded annually from $12.5 billion in 2008 to $21.2 billion in 2013.
• Latin America will remain the smallest region but the fastest-growing, expanding at a 17.4 percent CAGR to $1.5 billion in 2013 from $660 million in 2008.
Key drivers
• The economic downturn will hamper growth globally during 2009 and 2010, leading to decreases in 2009 in North America and EMEA, and slower growth in Asia Pacific and Latin America.
• Classified and display advertising will be hurt most by the recession, while search and video advertising will hold up better.
• The anticipated economic recovery will lead to a return to double-digit growth during 2012-13, with the smaller mobile advertising segment accelerating more quickly than the much larger wired internet segment.
• In addition to the economy, broadband household growth will be the principal driver of wired internet advertising.
• In the mobile advertising market, the drivers will include wireless network upgrades, growth in number of mobile access subscribers, increasing penetration of internet-enabled smart phones and the expansion of mobile television.
Table 6.13: Global Internet Advertising Market: Wired and Mobile by Region (US$ Millions)
Region 2004 2005 2006 2007 2008p 2009 2010 2011 2012 2013CAGR
2009–13
North America
10,069 13,264 18,149 23,115 26,284 25,459 25,844 27,697 31,196 35,918 6.4%
% Change 33.8% 31.7% 36.8% 27.4% 13.7% –3.1% 1.5% 7.2% 12.6% 15.1%
EMEA 4,760 7,585 12,524 17,799 20,427 19,533 19,929 21,829 24,637 28,106 6.6%
% Change 59.9% 59.3% 65.1% 42.1% 14.8% –4.4% 2.0% 9.5% 12.9% 14.1%
Asia Pacific 2,940 5,687 7,685 10,359 12,502 13,019 13,698 15,211 17,977 21,230 11.2%
% Change 57.8% 93.4% 35.1% 34.8% 20.7% 4.1% 5.2% 11.0% 18.2% 18.1%
Latin America
153 259 338 540 660 706 770 917 1,162 1,474 17.4%
% Change 45.7% 69.3% 30.5% 59.8% 22.2% 7.0% 9.1% 19.1% 26.7% 26.9%
Total 17,922 26,795 38,696 51,813 59,873 58,717 60,241 65,654 74,972 86,728 7.7%
% Change 43.7% 49.5% 44.4% 33.9% 15.6% –1.9% 2.6% 9.0% 14.2% 15.7%
Source: PwC Global Entertainment & Media Outlook 2009-2013
PricewaterhouseCooopers I Indian entertainment and media outlook 2009
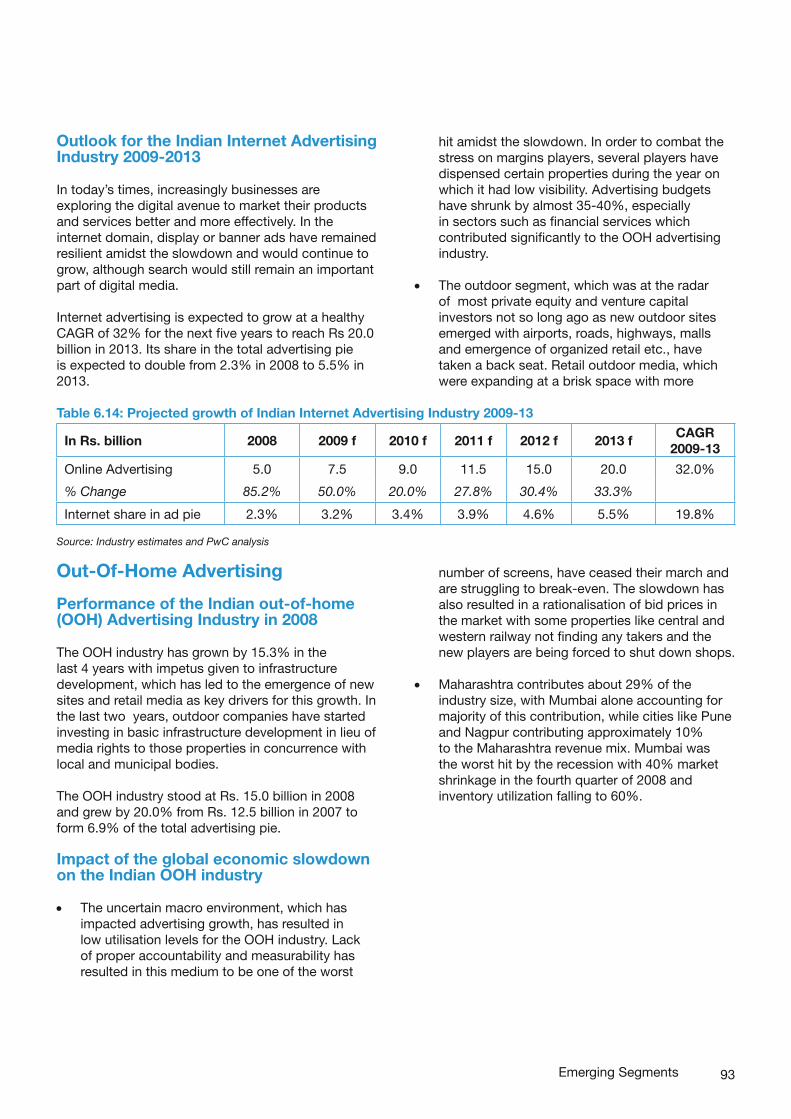
93
Outlook for the Indian Internet Advertising Industry 2009-2013
In today’s times, increasingly businesses are exploring the digital avenue to market their products and services better and more effectively. In the internet domain, display or banner ads have remained resilient amidst the slowdown and would continue to grow, although search would still remain an important part of digital media.
Internet advertising is expected to grow at a healthy CAGR of 32% for the next five years to reach Rs 20.0 billion in 2013. Its share in the total advertising pie is expected to double from 2.3% in 2008 to 5.5% in 2013.
Emerging Segments
Table 6.14: Projected growth of Indian Internet Advertising Industry 2009-13
In Rs. billion 2008 2009 f 2010 f 2011 f 2012 f 2013 fCAGR
2009-13
Online Advertising 5.0 7.5 9.0 11.5 15.0 20.0 32.0%
% Change 85.2% 50.0% 20.0% 27.8% 30.4% 33.3%
Internet share in ad pie 2.3% 3.2% 3.4% 3.9% 4.6% 5.5% 19.8%
Source: Industry estimates and PwC analysis
Out-Of-Home Advertising
Performance of the Indian out-of-home (OOH) Advertising Industry in 2008
The OOH industry has grown by 15.3% in the last 4 years with impetus given to infrastructure development, which has led to the emergence of new sites and retail media as key drivers for this growth. In the last two years, outdoor companies have started investing in basic infrastructure development in lieu of media rights to those properties in concurrence with local and municipal bodies.
The OOH industry stood at Rs. 15.0 billion in 2008 and grew by 20.0% from Rs. 12.5 billion in 2007 to form 6.9% of the total advertising pie.
Impact of the global economic slowdown on the Indian OOH industry
• The uncertain macro environment, which has impacted advertising growth, has resulted in low utilisation levels for the OOH industry. Lack of proper accountability and measurability has resulted in this medium to be one of the worst
hit amidst the slowdown. In order to combat the stress on margins players, several players have dispensed certain properties during the year on which it had low visibility. Advertising budgets have shrunk by almost 35-40%, especially in sectors such as financial services which contributed significantly to the OOH advertising industry.
• The outdoor segment, which was at the radar of most private equity and venture capital investors not so long ago as new outdoor sites emerged with airports, roads, highways, malls and emergence of organized retail etc., have taken a back seat. Retail outdoor media, which were expanding at a brisk space with more
number of screens, have ceased their march and are struggling to break-even. The slowdown has also resulted in a rationalisation of bid prices in the market with some properties like central and western railway not finding any takers and the new players are being forced to shut down shops.
• Maharashtra contributes about 29% of the industry size, with Mumbai alone accounting for majority of this contribution, while cities like Pune and Nagpur contributing approximately 10% to the Maharashtra revenue mix. Mumbai was the worst hit by the recession with 40% market shrinkage in the fourth quarter of 2008 and inventory utilization falling to 60%.
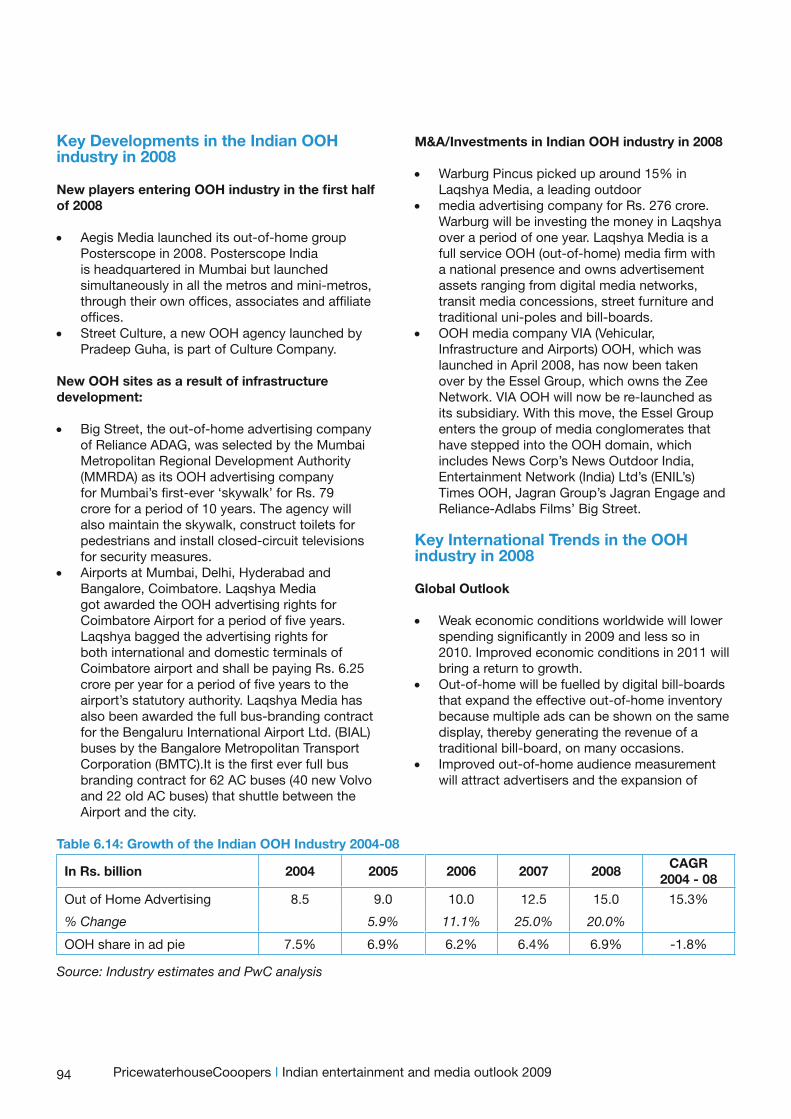
94
Key Developments in the Indian OOH industry in 2008
New players entering OOH industry in the first half of 2008
• Aegis Media launched its out-of-home group Posterscope in 2008. Posterscope India is headquartered in Mumbai but launched simultaneously in all the metros and mini-metros, through their own offices, associates and affiliate offices.
• Street Culture, a new OOH agency launched by Pradeep Guha, is part of Culture Company.
New OOH sites as a result of infrastructure development:
• Big Street, the out-of-home advertising company of Reliance ADAG, was selected by the Mumbai Metropolitan Regional Development Authority (MMRDA) as its OOH advertising company for Mumbai’s first-ever ‘skywalk’ for Rs. 79 crore for a period of 10 years. The agency will also maintain the skywalk, construct toilets for pedestrians and install closed-circuit televisions for security measures.
• Airports at Mumbai, Delhi, Hyderabad and Bangalore, Coimbatore. Laqshya Media got awarded the OOH advertising rights for Coimbatore Airport for a period of five years. Laqshya bagged the advertising rights for both international and domestic terminals of Coimbatore airport and shall be paying Rs. 6.25 crore per year for a period of five years to the airport’s statutory authority. Laqshya Media has also been awarded the full bus-branding contract for the Bengaluru International Airport Ltd. (BIAL) buses by the Bangalore Metropolitan Transport Corporation (BMTC).It is the first ever full bus branding contract for 62 AC buses (40 new Volvo and 22 old AC buses) that shuttle between the Airport and the city.
M&A/Investments in Indian OOH industry in 2008
• Warburg Pincus picked up around 15% in Laqshya Media, a leading outdoor
• media advertising company for Rs. 276 crore. Warburg will be investing the money in Laqshya over a period of one year. Laqshya Media is a full service OOH (out-of-home) media firm with a national presence and owns advertisement assets ranging from digital media networks, transit media concessions, street furniture and traditional uni-poles and bill-boards.
• OOH media company VIA (Vehicular, Infrastructure and Airports) OOH, which was launched in April 2008, has now been taken over by the Essel Group, which owns the Zee Network. VIA OOH will now be re-launched as its subsidiary. With this move, the Essel Group enters the group of media conglomerates that have stepped into the OOH domain, which includes News Corp’s News Outdoor India, Entertainment Network (India) Ltd’s (ENIL’s) Times OOH, Jagran Group’s Jagran Engage and Reliance-Adlabs Films’ Big Street.
Key International Trends in the OOH industry in 2008
Global Outlook
• Weak economic conditions worldwide will lower spending significantly in 2009 and less so in 2010. Improved economic conditions in 2011 will bring a return to growth.
• Out-of-home will be fuelled by digital bill-boards that expand the effective out-of-home inventory because multiple ads can be shown on the same display, thereby generating the revenue of a traditional bill-board, on many occasions.
• Improved out-of-home audience measurement will attract advertisers and the expansion of
PricewaterhouseCooopers I Indian entertainment and media outlook 2009
Table 6.14: Growth of the Indian OOH Industry 2004-08
In Rs. billion 2004 2005 2006 2007 2008CAGR
2004 - 08
Out of Home Advertising 8.5 9.0 10.0 12.5 15.0 15.3%
% Change 5.9% 11.1% 25.0% 20.0%
OOH share in ad pie 7.5% 6.9% 6.2% 6.4% 6.9% -1.8%
Source: Industry estimates and PwC analysis
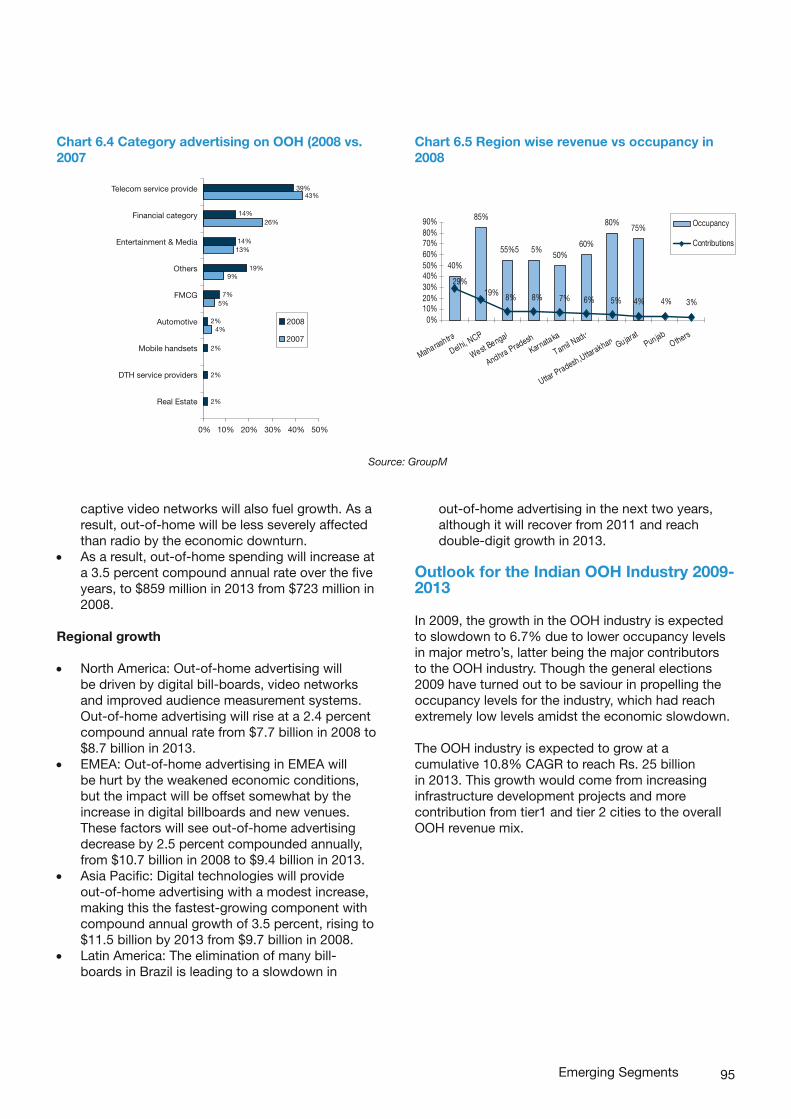
95
captive video networks will also fuel growth. As a result, out-of-home will be less severely affected than radio by the economic downturn.
• As a result, out-of-home spending will increase at a 3.5 percent compound annual rate over the five years, to $859 million in 2013 from $723 million in 2008.
Regional growth
• North America: Out-of-home advertising will be driven by digital bill-boards, video networks and improved audience measurement systems. Out-of-home advertising will rise at a 2.4 percent compound annual rate from $7.7 billion in 2008 to $8.7 billion in 2013.
• EMEA: Out-of-home advertising in EMEA will be hurt by the weakened economic conditions, but the impact will be offset somewhat by the increase in digital billboards and new venues. These factors will see out-of-home advertising decrease by 2.5 percent compounded annually, from $10.7 billion in 2008 to $9.4 billion in 2013.
• Asia Pacific: Digital technologies will provide out-of-home advertising with a modest increase, making this the fastest-growing component with compound annual growth of 3.5 percent, rising to $11.5 billion by 2013 from $9.7 billion in 2008.
• Latin America: The elimination of many bill-boards in Brazil is leading to a slowdown in
out-of-home advertising in the next two years, although it will recover from 2011 and reach double-digit growth in 2013.
Outlook for the Indian OOH Industry 2009-2013
In 2009, the growth in the OOH industry is expected to slowdown to 6.7% due to lower occupancy levels in major metro’s, latter being the major contributors to the OOH industry. Though the general elections 2009 have turned out to be saviour in propelling the occupancy levels for the industry, which had reach extremely low levels amidst the economic slowdown.
The OOH industry is expected to grow at a cumulative 10.8% CAGR to reach Rs. 25 billion in 2013. This growth would come from increasing infrastructure development projects and more contribution from tier1 and tier 2 cities to the overall OOH revenue mix.
Chart 6.4 Category advertising on OOH (2008 vs. 2007
Chart 6.5 Region wise revenue vs occupancy in 2008
Source: GroupM
Emerging Segments
40%
85%
55%5 5%50%
60%
80%75%
4% 4%5%6%7%8%8%19%29%
3%
0%10%20%30%40%50%60%70%80%90%
Maharashtra
Delhi, NCR
West Bengal
Andhra PradeshKarnataka
Tamil Nadu
Uttar Pradesh,UttarakhandGujarat
PunjabOthers
Occupancy
Contributions
2008
2007
0% 10% 20% 30% 40% 50%
39%43%
14%26%
14%13%
19%9%
7%5%
2%4%
2%
2%
2%
Telecom service provide
Financial category
Entertainment & Media
Others
FMCG
Automotive
Mobile handsets
DTH service providers
Real Estate
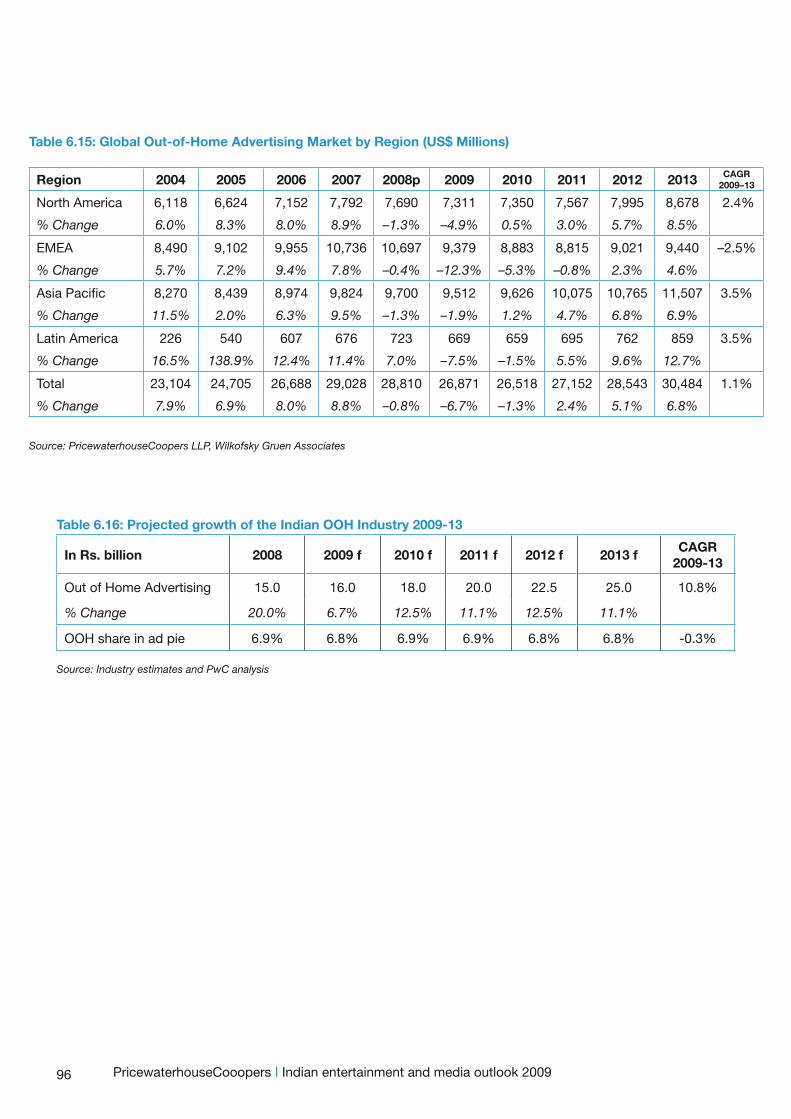
96
Table 6.15: Global Out-of-Home Advertising Market by Region (US$ Millions)
Region 2004 2005 2006 2007 2008p 2009 2010 2011 2012 2013 CAGR 2009–13
North America 6,118 6,624 7,152 7,792 7,690 7,311 7,350 7,567 7,995 8,678 2.4%
% Change 6.0% 8.3% 8.0% 8.9% –1.3% –4.9% 0.5% 3.0% 5.7% 8.5%
EMEA 8,490 9,102 9,955 10,736 10,697 9,379 8,883 8,815 9,021 9,440 –2.5%
% Change 5.7% 7.2% 9.4% 7.8% –0.4% –12.3% –5.3% –0.8% 2.3% 4.6%
Asia Pacific 8,270 8,439 8,974 9,824 9,700 9,512 9,626 10,075 10,765 11,507 3.5%
% Change 11.5% 2.0% 6.3% 9.5% –1.3% –1.9% 1.2% 4.7% 6.8% 6.9%
Latin America 226 540 607 676 723 669 659 695 762 859 3.5%
% Change 16.5% 138.9% 12.4% 11.4% 7.0% –7.5% –1.5% 5.5% 9.6% 12.7%
Total 23,104 24,705 26,688 29,028 28,810 26,871 26,518 27,152 28,543 30,484 1.1%
% Change 7.9% 6.9% 8.0% 8.8% –0.8% –6.7% –1.3% 2.4% 5.1% 6.8%
Source: PricewaterhouseCoopers LLP, Wilkofsky Gruen Associates
PricewaterhouseCooopers I Indian entertainment and media outlook 2009
Table 6.16: Projected growth of the Indian OOH Industry 2009-13
In Rs. billion 2008 2009 f 2010 f 2011 f 2012 f 2013 fCAGR
2009-13
Out of Home Advertising 15.0 16.0 18.0 20.0 22.5 25.0 10.8%
% Change 20.0% 6.7% 12.5% 11.1% 12.5% 11.1%
OOH share in ad pie 6.9% 6.8% 6.9% 6.9% 6.8% 6.8% -0.3%
Source: Industry estimates and PwC analysis
97
Animation, Gaming And VFX Industry
Performance of the Indian Animation, Gaming and VFX Industry in 2008
The Indian animation, gaming and VFX industries have been the fastest growing industries for the Indian E&M sector for the last few years. The animation segment has witnessed significant growth on the back of high end outsourced work from international studios and also the increased demand of animated content in the film and television industries. The animation industry grew at 20.0% in 2008 to reach Rs. 15.6 billion from Rs. 13.0 billion in 2007. On the other hand, the Indian gaming industry grew at 47.0% from 2007 to reach Rs. 4.0 billion in 2008, mainly due to the growth in the mobile gaming sub-segment.
Impact of global economic slowdown on the Indian Animation, Gaming and VFX Industry
The first half of 2008, witnessed many animation films making announcements and going on floor but with many major films like Jumbo, Roadside Romeo and VFX films – Love Story 2050 etc. delivering a disappointing performance and the global downturn affecting confidence, studios have been less willing to back visual effects in films. Producers are looking closely at the story and script before sanctioning financial investment. More positively, it is clear that producers are using animation and visual effects to reduce costs, through techniques such as pre-visualisation and set-extension effects. Although the economic slowdown has led to a cautious approach towards Indian-centric animation films; however, it lays emphasis on developing a robust business model for better returns on animation films in India.
Key Developments
Animation
Animation movies released in 2008
Percept Picture Company released its 3D animated film Jumbo in the end of 2008. Using a business model that is novel to the Indian animation industry, Percept bought the film, originally titled Khan Kluay, from Bangkok-based Kantana Animation and tweaked it for the Indian audience by adding star
Emerging Segments
voice-overs and songs. The 90-minute film has been co-produced by Eagle Home Entertainment, which also holds the home video rights. The film was made with a total budget, including marketing expenses, of Rs. 20 crore. In September 2008 (before the release in India), the film was also dubbed and released on DVD in the US as The Blue Elephant. Percept also tied up with Neo Sports during the India-England series, where Yuvraj Singh was awarded ‘Jumbo of the series’. On the licensing and merchandising front, special merchandise was launched in association with Future Group’s retail chain Big Bazaar.
• India Tales announced that it will release its maiden animation venture Manikantan in 2009. The company intends to release the film in US, UK, Malaysia and UAE markets, in six languages including Hindi and English. The production of the 90-minute film has been given to three leading studios in India and is being managed by the creative team of IndiaTales. The film has eight different animation styles including 2D, 3D and clay animation. According to the company, the movie is budgeted at approximately US$10 million.
• Celluloid Dreams’ live action/CG animation film budget Friends Forever is planned for release in 2009. The 110-minute film is made at a budget of Rs. 7.5 crore, is directed by Soumitra Ranade of Jajantaram Mamantaram fame. Celluloid Dreams is currently working on two other live action/animation projects: Raju-the Joker and Mermaid - a love story, and is doing pre production for Eternal Love, a co-production between Compact Disc India and UK-based Intandem Films. The company is also working on two full-length, live-action Punjabi features, Ek Onkar and Truck Driver.
• Chennai-based Mayabimbham Media, which produced the first Tamil 3D animated feature Inimey Naangathaan V4, announced its next 3D animated Tamil film Puratchi Thalaivan, based on former actor and Tamil Nadu Chief Minister MG Ramachandran. The film is currently under production and is slated for a late 2009 release. The 100-minute film is directed by Venky Baboo and produced by Sridevi Rao, and has a team of around 25 animators working on it.
• Classic Animation Studio plans to release its 90-minute 2D feature Buji in 2009. The film is
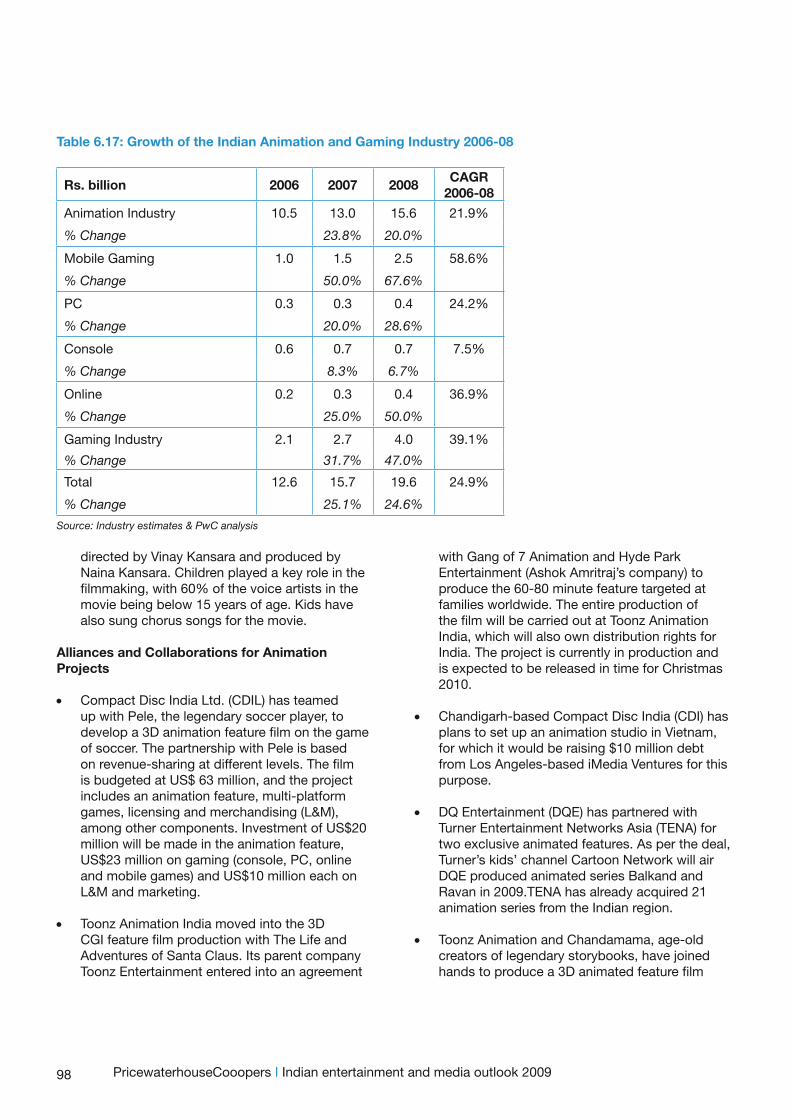
98
directed by Vinay Kansara and produced by Naina Kansara. Children played a key role in the filmmaking, with 60% of the voice artists in the movie being below 15 years of age. Kids have also sung chorus songs for the movie.
Alliances and Collaborations for Animation Projects
• Compact Disc India Ltd. (CDIL) has teamed up with Pele, the legendary soccer player, to develop a 3D animation feature film on the game of soccer. The partnership with Pele is based on revenue-sharing at different levels. The film is budgeted at US$ 63 million, and the project includes an animation feature, multi-platform games, licensing and merchandising (L&M), among other components. Investment of US$20 million will be made in the animation feature, US$23 million on gaming (console, PC, online and mobile games) and US$10 million each on L&M and marketing.
• Toonz Animation India moved into the 3D CGI feature film production with The Life and Adventures of Santa Claus. Its parent company Toonz Entertainment entered into an agreement
with Gang of 7 Animation and Hyde Park Entertainment (Ashok Amritraj’s company) to produce the 60-80 minute feature targeted at families worldwide. The entire production of the film will be carried out at Toonz Animation India, which will also own distribution rights for India. The project is currently in production and is expected to be released in time for Christmas 2010.
• Chandigarh-based Compact Disc India (CDI) has plans to set up an animation studio in Vietnam, for which it would be raising $10 million debt from Los Angeles-based iMedia Ventures for this purpose.
• DQ Entertainment (DQE) has partnered with Turner Entertainment Networks Asia (TENA) for two exclusive animated features. As per the deal, Turner’s kids’ channel Cartoon Network will air DQE produced animated series Balkand and Ravan in 2009.TENA has already acquired 21 animation series from the Indian region.
• Toonz Animation and Chandamama, age-old creators of legendary storybooks, have joined hands to produce a 3D animated feature film
Table 6.17: Growth of the Indian Animation and Gaming Industry 2006-08
Rs. billion 2006 2007 2008CAGR
2006-08
Animation Industry 10.5 13.0 15.6 21.9%
% Change 23.8% 20.0%
Mobile Gaming 1.0 1.5 2.5 58.6%
% Change 50.0% 67.6%
PC 0.3 0.3 0.4 24.2%
% Change 20.0% 28.6%
Console 0.6 0.7 0.7 7.5%
% Change 8.3% 6.7%
Online 0.2 0.3 0.4 36.9%
% Change 25.0% 50.0%
Gaming Industry 2.1 2.7 4.0 39.1%
% Change 31.7% 47.0%
Total 12.6 15.7 19.6 24.9%
% Change 25.1% 24.6%
Source: Industry estimates & PwC analysis
PricewaterhouseCooopers I Indian entertainment and media outlook 2009
99
based on the stories of Chandamama. Toonz will finance the project, currently pegged at around Rs.20 crore, and will also undertake the entire production at its facility in Technopark, Trivandrum.
• Chennai-based software firm Sanraa Media Limited (earlier known as Sanra Software) has signed a co-production deal with leading global production company Endemol for the production of a 3D animated series (26X22‘). Titled The 99, the series is based on illustrated comics by the same name, owned and published by the Teshkeel Media Group, Kuwait.
Increasing emphasis on Licensing and Merchandising
• Disney Consumer Products (DCP) launched special Roadside Romeo merchandise as part of its marketing campaign. The Roadside Romeo apparel collection included T-shirts, skirts and jeans. DCP tied up with Catmoss, Bodycare and Lakhani for apparel, innerwear and footwear respectively. In another tie-up, Popley launched the Roadside Romeo fine jewellery range, including diamond studded Romeo and Laila pendants. The merchandise also includes school products, stationery, personal utility, toys, story books and home products. A collector’s book, The Art of Romeo, charts the making of the film, while The Junior Novel, published and distributed by Excel, was an illustrated version of the movie for kids. The Disney merchandising arm also launched two comic series through a tie-up with Junior Diamond, a division of publisher Diamond Comics. The eponymous comic series is a graphic novel version of the movie, while the second series, The Adventures of Romeo and Friends revolves around the lives of Romeo and his canine friends. Approximately 125,000 copies have been published in eight languages, catering to readers all over India. Diamond Comics has distributed the comic series through newspaper stalls and retail bookstores.
• King Features Syndicate, a merchandise licensing firm of US-based Hearst Corporation, has entered India. The firm owns the characters including Flash Gordon, Popeye and Betty Poop and is in talks with Indian corporates for licensing deals in food and beverages, kids’ apparel, footwear, stationery and toys, home décor and furnishings
and the wireless/mobile sectors. The Popeye character alone generates sales of US$2 billion annually, underlining the potential of the licensing business.
• Dubai-based SpaceToon Media’s Kids Media India has launched its licensing and merchandising business in India and SAARC countries. Kids Media has been appointed as the agent of the Hong Kong registered Animation International Limited, which is the licensor for Doraemon and other well-known media properties, and licensing partner of World Wrestling Entertainment for its consumer products.
Initiatives in developing animation talent
• Classic Animation Studio announced its “Animation in Village project”, which involves setting up a 50,000 square feet state-of-the-art animation studio in Roha, around 120 kilometres south of Mumbai. Classic Animation aims to use the venture to find hidden talents among rural school children and make them ready for the animation industry. The company plans to hold workshops every day for two to three hours to educate the children in animation, with deserving students then being directed into production. The main idea is to make the studio self-reliant in production talent.
• Animation education provider Maya Academy of Advanced Cinematics (MAAC) has launched its second training centre in Ahmedabad. MAAC presently operates in more than 60 centres and has an association with The University of Cambridge International Examination, London to validate its diploma courses.
• Toonz Academy opened its second Kerala centre in Kozhikode (Calicut) in 2008. Since launching its first centre in Trivandrum in 2003, Toonz Academy has opened centres in Mumbai, Nagpur, Indore, Hyderabad, Delhi and Ahmedabad. The Academy also organises a series of sessions focusing on concept development in animation in five cities across India. Toonz Academy is the training division of animation studio Toonz Animation.
• BIG Animation launched its education wing BIG AIMS (BIG Animation Infotainment and Media School) .BIG AIMS will serve both as a finishing
Emerging Segments
100
school for advanced learning in animation and offer specialized courses as well.
• Delhi based Picasso Animation which has a tie up with Centennial College Canada for curriculum, has plans to expand into Mumbai and Bangalore.
• Graphiti Multimedia has plans of launching Graphiti School of Animation to cater to the professional skills required by the animation industry in India.
New Players
Post-production studio Avitel Post Studioz has forayed into animation with orders worth Rs. 1.5 billion (Rs. 150 crores) .The companies have bagged their maiden project The Final Goal, from UK-based film production company Purple Passion Productions. Avitel Post Studioz will work on the film’s creative duties right from scripting to delivery.
Gaming
Tie-ups and collaborations in gaming
• Zapak Digital Entertainment launched the Zapak Gameplex Premiere League, which had gamers playing Counter Strike, FIFA 08 and Crazy Kart across 35 Zapak Gameplexes across the country. The tournament was a league-based format, where gamers in four metros and 20 other cities played with each other for cash prizes of up to Rs. 5 lakh.
• Zapak.com partnered with Pringoo for customised merchandise for its portal www.shopping.zapak.com. People visiting the site could choose from various options of merchandise, specially designed for gaming fans with their favourite gaming characters printed on them. Users could also personalise or customise existing designs of the product and then buy it. Zapak.com is producing an expanding range of merchandise built around its games, with products including T-shirts, mugs and soft toys. Zapak is looking to merchandising revenues to support its growth and is expecting 25 percent of its turnover to come from this new segment.
• Indian game development company 7Seas Technologies tied up with Greystripe, a San Francisco-based ad-supported mobile games
and applications distributor, to distribute free, ad-supported mobile games to players worldwide. This partnership will enable a selection of 7Seas mobile games to be delivered through all 100+ of Greystripe’s catalogue platform partners in addition to their own gamejump.com site. The deal brings 7Seas wider distribution, revenue and brand awareness.
Entering international markets
Zapak Digital Entertainment Ltd. has forayed into the international market with the launch of Zapakworld.com at “Casual Connect” in Ukraine. The company claims that over 50 international developers have already signed on with Zapakworld.com to provide games.
VFX
International players entering the market
• Geon Studios has set up its office in Mumbai. The studio is a joint venture between Sahara and Barrie Osborne, (producer of The Lord of the Rings trilogy, The Water Horse and Face Off), Michael Peyser, (producer of Speed2, Hackers and Matilda), Jon Labrie (VFX stalwart and former CTO, Weta Digital) and N. Madhusudhanan (Indian VFX stalwart and evangelist).
• Fox Star Studios, a pan-Asian joint venture between Twentieth Century Fox and Star, has signed a multiple-film deal with producer Vipul Amrutlal Shah. The deal includes the development and production of a visual effects-driven fantasy action movie. The VFX film will be supported by a team of top VFX directors from Hollywood and will be supervised by Fox’s multiple award-winning in-house VFX team.
Growing domestic projects
• Red Chillies carried out the special effects for Drona. In recent times, Chandni Chowk to China (CC2C) is one of the most VFX and CG laden Indian films with over 1000 VFX shots. The movie is co-produced by Warner Brothers and Ramesh Sippy. The VFX for the movie was done by Prime Focus across India
• Dharma Production‘s Dostana had also carried VFX mainly supported by redchillies.vfx. In a first of its kind VFX task in Indian cinema, a
PricewaterhouseCooopers I Indian entertainment and media outlook 2009
101
dedicated team of 80 artists worked on over 300 shots, including a very complex basketball game sequence and a host of other amazingly executed sequences.
Key International Trends in the Gaming Industry in 2008
Global Outlook
• Globally, the video game market will grow from $51.4 billion in 2008 to $73.5 billion in 2013, a 7.4 percent compound annual rate.
• Global console games, the largest category of the market at $30.4 billion in 2008, will expand at a 5.5 percent compound annual rate to $39.7 billion in 2013, accounting for 54 percent of overall spending.
• Personal Computer games will continue to decline, falling at a 1.2 percent rate compounded annually to $4.1 billion from $4.3 billion in 2008.
• On-line and wireless games will be the fastest-growing end-user categories, with compound annual increases of 10.6 percent and 13.8 percent, respectively.
• This faster growth means wireless games will almost catch up with on-line games. On-line games will total $13.7 billion in 2013 and wireless games $13.4 billion.
• There is an emerging video game advertising market, which totalled $1.4 billion in 2008 and will almost double to $2.6 billion in 2013, growing at a 13.8 percent compound annual rate.
Regional growth
• EMEA, the largest region at $18.1 billion in 2008, is projected to grow by 6.9% compounded annually through 2013, to reach $25.3 billion.
• North America, the second-largest region in 2008, with $16.2 billion, will grow by 5.8% compounded annually to $21.6 billion.
• Asia Pacific will be the fastest-growing region during the next five years, expanding at 9.4 percent compounded annually from $15.7 billion in 2008 to $24.7 billion in 2013 and overtaking North America in 2010 to become the second-largest region.
• Latin America is projected to grow to $2.0 billion in 2013 from $1.3 billion in 2008, a 9.2 percent compound annual gain.
Key drivers
• The current generation of consoles—which includes the Wii, the Xbox 360 and PlayStation 3—will drive the market for the next few years. The continued success of the latest handheld devices—the Nintendo DS and PlayStation Portable (PSP)—is also supporting the market.
• The online market is being driven by the rising penetration of broadband households as well as the current generation of consoles that include on-line capabilities as a primary focus.
• By 2012, the next generation of consoles will have begun to be introduced, which will spur renewed growth in console games.
• The increasing popularity of massive • multiplayer on-line games (MMOGs) is also
aiding the growth of the market. Casual games are a further important component of the on-line market, helping expand the demographic base and stimulate spending.
• New mobile phone handsets that are capable of downloading games and that provide larger screens and better graphics will drive demand for wireless games and the growth of third-generation (3G) networks will enable wireless games to approach the quality of console games.
• Although the market for Personal Computer games will continue to deteriorate, the purchase of a Personal Computer game is often the requirement for entry into the world of MMOGs.
• Video game advertising is emerging as an additional revenue stream and the growth of the on-line game market will fuel growth in dynamic in-game advertising.
Outlook for the Indian Animation, Gaming and VFX industry 2009-2013
The animation industry is projected to grow at a CAGR of 22.2% to reach Rs. 42.5 billion in 2013. The entertainment segment comprising of movies, television, gaming etc. is expected to remain the main contributor to the revenue mix for the animation industry over the next five years. The gaming industry is expected to register the highest growth among all entertainment and media segments in the next five years. Gaming is projected to reach Rs. 16.4 billion in 2013 at a cumulative CAGR of 32.8%.Mobile gaming is estimated to contribute close to 74% to the gaming revenue mix by 2013, a growth of 10% from the current contribution of 63%.
Emerging Segments
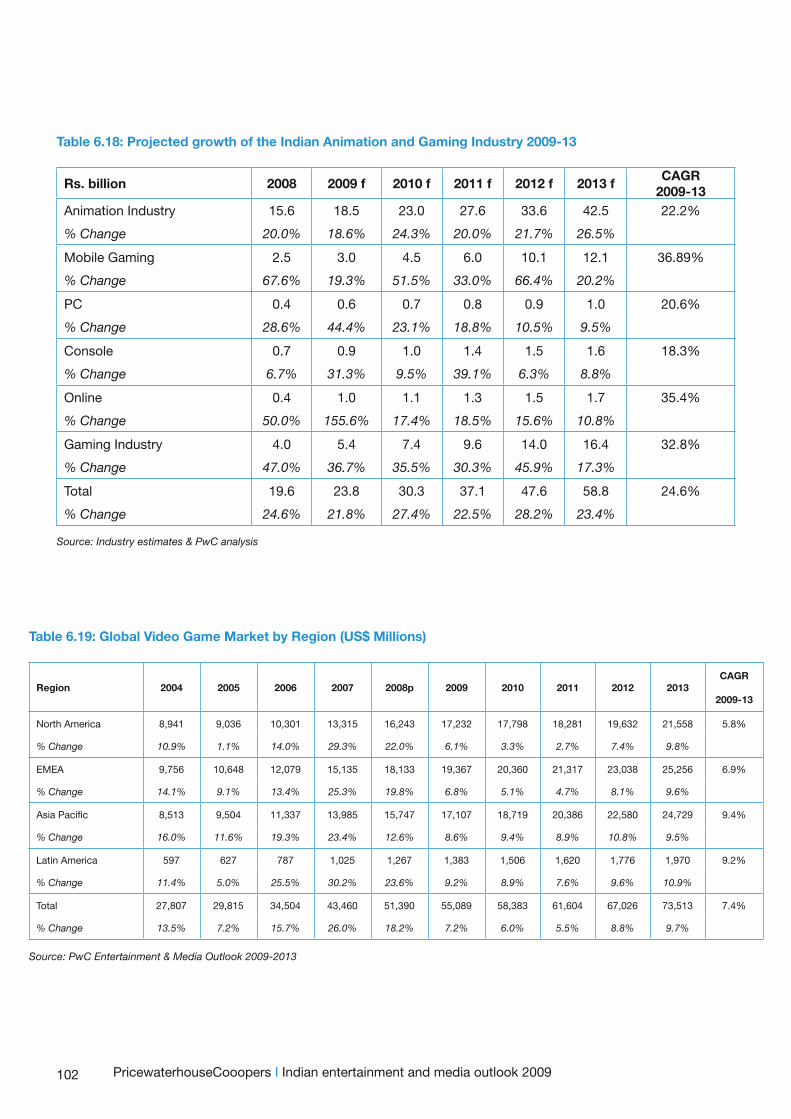
102
Table 6.19: Global Video Game Market by Region (US$ Millions)
Region 2004 2005 2006 2007 2008p 2009 2010 2011 2012 2013CAGR
2009-13
North America 8,941 9,036 10,301 13,315 16,243 17,232 17,798 18,281 19,632 21,558 5.8%
% Change 10.9% 1.1% 14.0% 29.3% 22.0% 6.1% 3.3% 2.7% 7.4% 9.8%
EMEA 9,756 10,648 12,079 15,135 18,133 19,367 20,360 21,317 23,038 25,256 6.9%
% Change 14.1% 9.1% 13.4% 25.3% 19.8% 6.8% 5.1% 4.7% 8.1% 9.6%
Asia Pacific 8,513 9,504 11,337 13,985 15,747 17,107 18,719 20,386 22,580 24,729 9.4%
% Change 16.0% 11.6% 19.3% 23.4% 12.6% 8.6% 9.4% 8.9% 10.8% 9.5%
Latin America 597 627 787 1,025 1,267 1,383 1,506 1,620 1,776 1,970 9.2%
% Change 11.4% 5.0% 25.5% 30.2% 23.6% 9.2% 8.9% 7.6% 9.6% 10.9%
Total 27,807 29,815 34,504 43,460 51,390 55,089 58,383 61,604 67,026 73,513 7.4%
% Change 13.5% 7.2% 15.7% 26.0% 18.2% 7.2% 6.0% 5.5% 8.8% 9.7%
Source: PwC Entertainment & Media Outlook 2009-2013
Table 6.18: Projected growth of the Indian Animation and Gaming Industry 2009-13
Rs. billion 2008 2009 f 2010 f 2011 f 2012 f 2013 fCAGR
2009-13Animation Industry 15.6 18.5 23.0 27.6 33.6 42.5 22.2%
% Change 20.0% 18.6% 24.3% 20.0% 21.7% 26.5%
Mobile Gaming 2.5 3.0 4.5 6.0 10.1 12.1 36.89%
% Change 67.6% 19.3% 51.5% 33.0% 66.4% 20.2%
PC 0.4 0.6 0.7 0.8 0.9 1.0 20.6%
% Change 28.6% 44.4% 23.1% 18.8% 10.5% 9.5%
Console 0.7 0.9 1.0 1.4 1.5 1.6 18.3%
% Change 6.7% 31.3% 9.5% 39.1% 6.3% 8.8%
Online 0.4 1.0 1.1 1.3 1.5 1.7 35.4%
% Change 50.0% 155.6% 17.4% 18.5% 15.6% 10.8%
Gaming Industry 4.0 5.4 7.4 9.6 14.0 16.4 32.8%
% Change 47.0% 36.7% 35.5% 30.3% 45.9% 17.3%
Total 19.6 23.8 30.3 37.1 47.6 58.8 24.6%
% Change 24.6% 21.8% 27.4% 22.5% 28.2% 23.4%
Source: Industry estimates & PwC analysis
PricewaterhouseCooopers I Indian entertainment and media outlook 2009
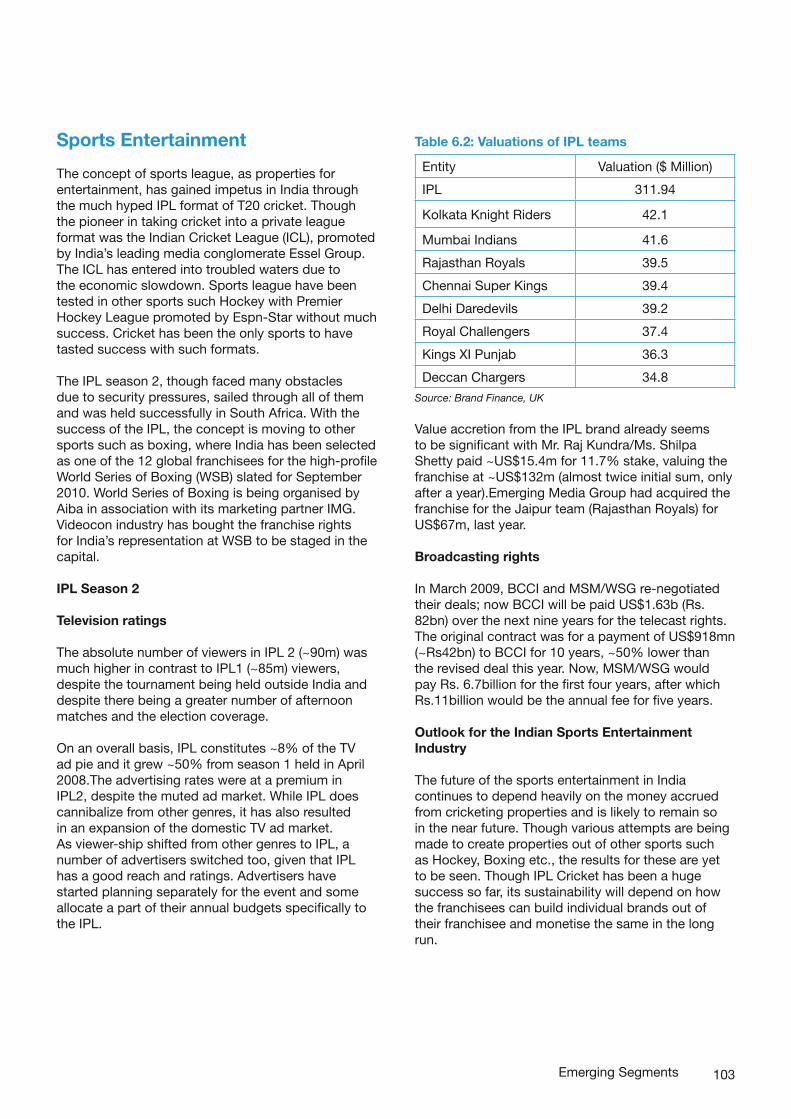
103
Entity Valuation ($ Million)
IPL 311.94
Kolkata Knight Riders 42.1
Mumbai Indians 41.6
Rajasthan Royals 39.5
Chennai Super Kings 39.4
Delhi Daredevils 39.2
Royal Challengers 37.4
Kings XI Punjab 36.3
Deccan Chargers 34.8
Source: Brand Finance, UK
Value accretion from the IPL brand already seems to be significant with Mr. Raj Kundra/Ms. Shilpa Shetty paid ~US$15.4m for 11.7% stake, valuing the franchise at ~US$132m (almost twice initial sum, only after a year).Emerging Media Group had acquired the franchise for the Jaipur team (Rajasthan Royals) for US$67m, last year.
Broadcasting rights
In March 2009, BCCI and MSM/WSG re-negotiated their deals; now BCCI will be paid US$1.63b (Rs. 82bn) over the next nine years for the telecast rights. The original contract was for a payment of US$918mn (~Rs42bn) to BCCI for 10 years, ~50% lower than the revised deal this year. Now, MSM/WSG would pay Rs. 6.7billion for the first four years, after which Rs.11billion would be the annual fee for five years.
Outlook for the Indian Sports Entertainment Industry
The future of the sports entertainment in India continues to depend heavily on the money accrued from cricketing properties and is likely to remain so in the near future. Though various attempts are being made to create properties out of other sports such as Hockey, Boxing etc., the results for these are yet to be seen. Though IPL Cricket has been a huge success so far, its sustainability will depend on how the franchisees can build individual brands out of their franchisee and monetise the same in the long run.
Emerging Segments
Table 6.2: Valuations of IPL teamsSports Entertainment
The concept of sports league, as properties for entertainment, has gained impetus in India through the much hyped IPL format of T20 cricket. Though the pioneer in taking cricket into a private league format was the Indian Cricket League (ICL), promoted by India’s leading media conglomerate Essel Group. The ICL has entered into troubled waters due to the economic slowdown. Sports league have been tested in other sports such Hockey with Premier Hockey League promoted by Espn-Star without much success. Cricket has been the only sports to have tasted success with such formats.
The IPL season 2, though faced many obstacles due to security pressures, sailed through all of them and was held successfully in South Africa. With the success of the IPL, the concept is moving to other sports such as boxing, where India has been selected as one of the 12 global franchisees for the high-profile World Series of Boxing (WSB) slated for September 2010. World Series of Boxing is being organised by Aiba in association with its marketing partner IMG. Videocon industry has bought the franchise rights for India’s representation at WSB to be staged in the capital.
IPL Season 2
Television ratings
The absolute number of viewers in IPL 2 (~90m) was much higher in contrast to IPL1 (~85m) viewers, despite the tournament being held outside India and despite there being a greater number of afternoon matches and the election coverage.
On an overall basis, IPL constitutes ~8% of the TV ad pie and it grew ~50% from season 1 held in April 2008.The advertising rates were at a premium in IPL2, despite the muted ad market. While IPL does cannibalize from other genres, it has also resulted in an expansion of the domestic TV ad market. As viewer-ship shifted from other genres to IPL, a number of advertisers switched too, given that IPL has a good reach and ratings. Advertisers have started planning separately for the event and some allocate a part of their annual budgets specifically to the IPL.
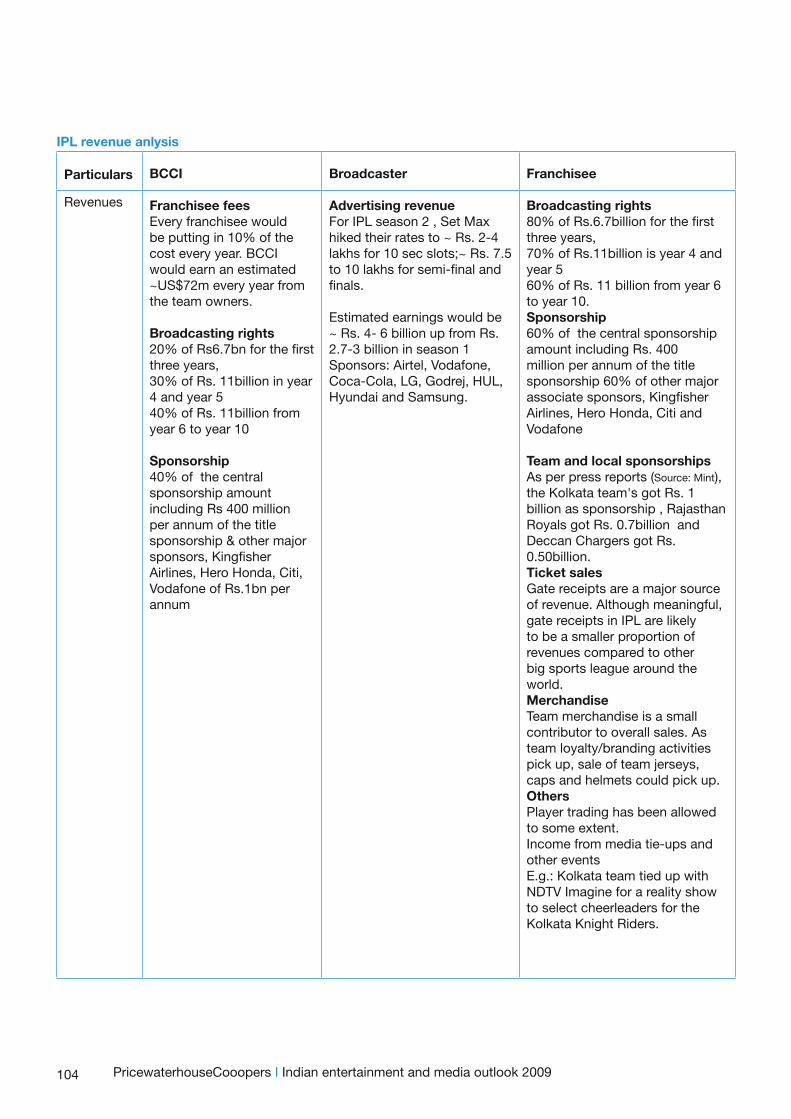
104
IPL revenue anlysis
Particulars BCCI Broadcaster Franchisee
Revenues Franchisee feesEvery franchisee would be putting in 10% of the cost every year. BCCI would earn an estimated ~US$72m every year from the team owners.
Broadcasting rights20% of Rs6.7bn for the first three years, 30% of Rs. 11billion in year 4 and year 540% of Rs. 11billion from year 6 to year 10
Sponsorship 40% of the central sponsorship amount including Rs 400 million per annum of the title sponsorship & other major sponsors, Kingfisher Airlines, Hero Honda, Citi, Vodafone of Rs.1bn per annum
Advertising revenueFor IPL season 2 , Set Max hiked their rates to ~ Rs. 2-4 lakhs for 10 sec slots;~ Rs. 7.5 to 10 lakhs for semi-final and finals.
Estimated earnings would be ~ Rs. 4- 6 billion up from Rs. 2.7-3 billion in season 1Sponsors: Airtel, Vodafone, Coca-Cola, LG, Godrej, HUL, Hyundai and Samsung.
Broadcasting rights80% of Rs.6.7billion for the first three years, 70% of Rs.11billion is year 4 and year 560% of Rs. 11 billion from year 6 to year 10. Sponsorship 60% of the central sponsorship amount including Rs. 400 million per annum of the title sponsorship 60% of other major associate sponsors, Kingfisher Airlines, Hero Honda, Citi and Vodafone
Team and local sponsorshipsAs per press reports (Source: Mint), the Kolkata team's got Rs. 1 billion as sponsorship , Rajasthan Royals got Rs. 0.7billion and Deccan Chargers got Rs. 0.50billion. Ticket salesGate receipts are a major source of revenue. Although meaningful, gate receipts in IPL are likely to be a smaller proportion of revenues compared to otherbig sports league around the world.MerchandiseTeam merchandise is a small contributor to overall sales. As team loyalty/branding activities pick up, sale of team jerseys, caps and helmets could pick up.OthersPlayer trading has been allowed to some extent.Income from media tie-ups and other eventsE.g.: Kolkata team tied up with NDTV Imagine for a reality show to select cheerleaders for the Kolkata Knight Riders.
PricewaterhouseCooopers I Indian entertainment and media outlook 2009
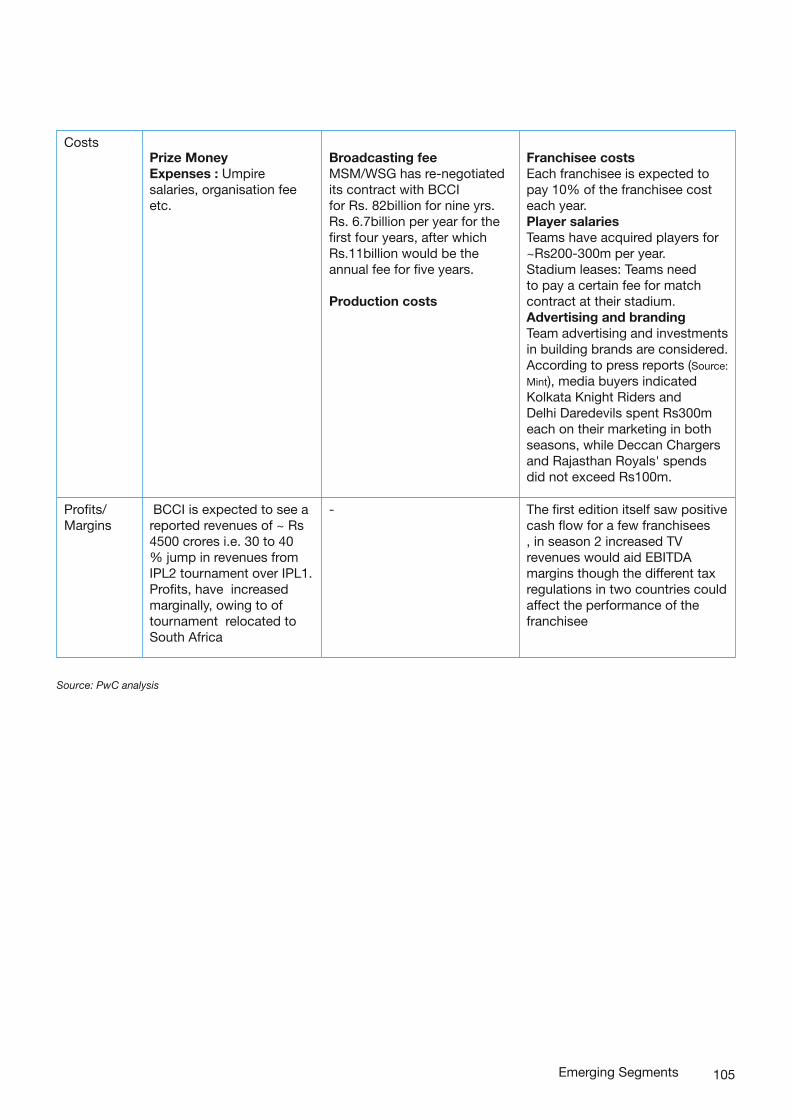
105Emerging Segments
CostsPrize MoneyExpenses : Umpire salaries, organisation fee etc.
Broadcasting feeMSM/WSG has re-negotiated its contract with BCCIfor Rs. 82billion for nine yrs. Rs. 6.7billion per year for the first four years, after which Rs.11billion would be the annual fee for five years.
Production costs
Franchisee costsEach franchisee is expected to pay 10% of the franchisee cost each year.Player salariesTeams have acquired players for ~Rs200-300m per year.Stadium leases: Teams need to pay a certain fee for match contract at their stadium.Advertising and brandingTeam advertising and investments in building brands are considered.According to press reports (Source:
Mint), media buyers indicated Kolkata Knight Riders and Delhi Daredevils spent Rs300m each on their marketing in both seasons, while Deccan Chargers and Rajasthan Royals' spends did not exceed Rs100m.
Profits/Margins
BCCI is expected to see a reported revenues of ~ Rs 4500 crores i.e. 30 to 40 % jump in revenues from IPL2 tournament over IPL1. Profits, have increased marginally, owing to of tournament relocated to South Africa
- The first edition itself saw positive cash flow for a few franchisees , in season 2 increased TV revenues would aid EBITDA margins though the different tax regulations in two countries could affect the performance of the franchisee
Source: PwC analysis
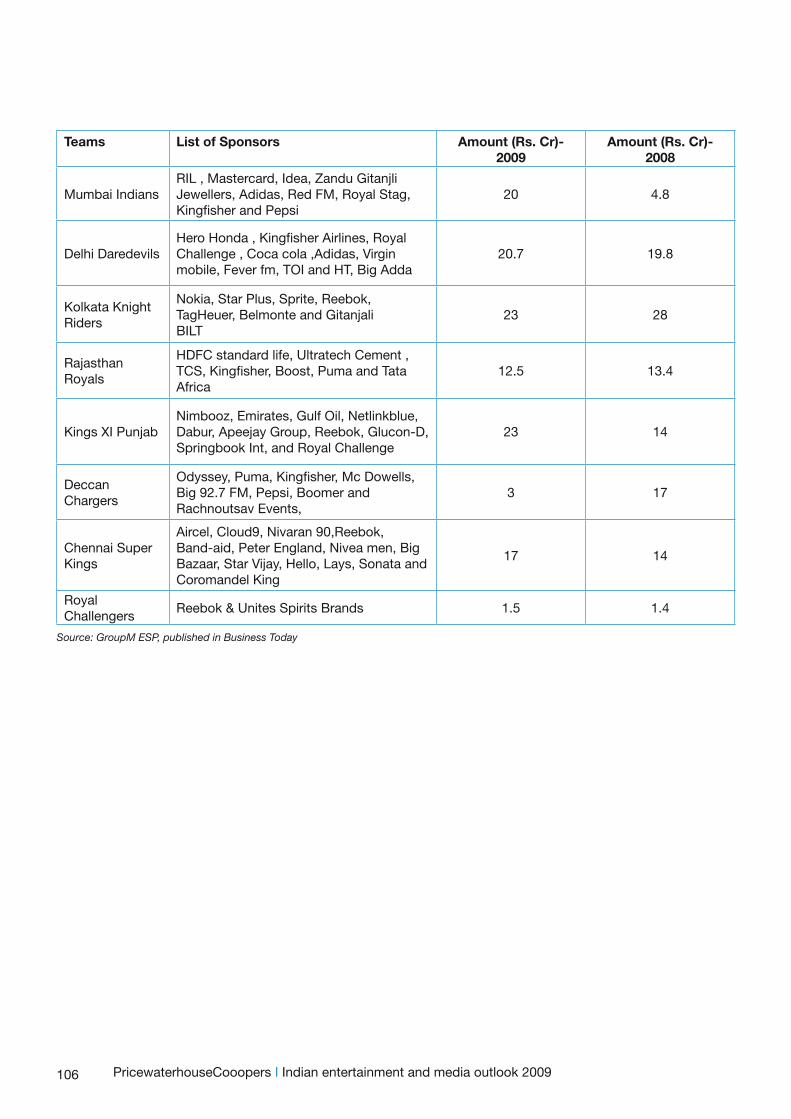
106
Teams List of Sponsors Amount (Rs. Cr)- 2009
Amount (Rs. Cr)- 2008
Mumbai IndiansRIL , Mastercard, Idea, Zandu Gitanjli Jewellers, Adidas, Red FM, Royal Stag, Kingfisher and Pepsi
20 4.8
Delhi DaredevilsHero Honda , Kingfisher Airlines, Royal Challenge , Coca cola ,Adidas, Virgin mobile, Fever fm, TOI and HT, Big Adda
20.7 19.8
Kolkata Knight Riders
Nokia, Star Plus, Sprite, Reebok, TagHeuer, Belmonte and GitanjaliBILT
23 28
Rajasthan Royals
HDFC standard life, Ultratech Cement , TCS, Kingfisher, Boost, Puma and Tata Africa
12.5 13.4
Kings XI PunjabNimbooz, Emirates, Gulf Oil, Netlinkblue, Dabur, Apeejay Group, Reebok, Glucon-D, Springbook Int, and Royal Challenge
23 14
Deccan Chargers
Odyssey, Puma, Kingfisher, Mc Dowells, Big 92.7 FM, Pepsi, Boomer and Rachnoutsav Events,
3 17
Chennai Super Kings
Aircel, Cloud9, Nivaran 90,Reebok, Band-aid, Peter England, Nivea men, Big Bazaar, Star Vijay, Hello, Lays, Sonata and Coromandel King
17 14
Royal Challengers
Reebok & Unites Spirits Brands 1.5 1.4
Source: GroupM ESP, published in Business Today
PricewaterhouseCooopers I Indian entertainment and media outlook 2009


Tax and Regulatory Issues Impacting the Indian E&M Industry
Television Industry
Print Media Industry
Film Industry
Radio Industry
Music Industry
Gaming Industry
Budget 2009 snapshot
110
Television Industry
Direct Tax Issues
Taxability of income of telecasting companies
Advertisement revenues
The advertisement revenues earned by Indian telecasting companies are liable to tax on net income basis (as their worldwide income is taxable in India) at the prevailing rates.
Foreign telecasting companies (‘FTCs’) are liable to tax in India, only if they have a permanent establishment (‘PE’)/business connection in India. The taxability in such case is only on the income, which is attributable to such PE/operations carried out in India. When and in what circumstances do the FTC constitute a PE/business connection in India and the determination of income attributable to such PE/operations carried out in India, continues to be a contentious issues between the FTCs and the Indian Tax Authorities.
FTCs generally appoint an agent in India for marketing of advertisement airtime slots. The agent also facilitates collection of advertisement revenues from the advertisers and its remittance abroad.
The Tax Authorities have been contending that, the agent of FTC, who concludes contracts on behalf of FTC or secures orders wholly or almost wholly for FTC in India, constitutes its PE in India. Further, in the case of one of the FTCs, the Income Tax Appellate Tribunal (‘the Tribunal’) has held that the beaming channels of FTC in India and earning advertisement revenues from India has a business connection with the latter and is liable to tax in India.
Once a PE/business connection of FTC is constituted in India, income attributable to such PE/ operations carried out in India is taxable in the hands of FTCs in India. In cases where India specific accounts are not maintained by the FTCs, the Tax Authorities are empowered to determine the income attributable to the PE/operations carried out in India on the basis of certain methods (viz. percentage of turnover or applying ratio of Indian receipts and total receipts to the total profits of FTCs or any other method as the Tax Authorities may deem fit) prescribed under the IT Rules.
However, the FTCs have been contending that even if the Indian agent constitutes its PE, the payment of arm’s length remuneration to the Indian agent would extinguish its tax liability in India. Recently, the Bombay High Court has, in one of the landmark rulings, accepted this proposition. This judgement is likely to bring lot of respite to the FTCs.
Subscription revenues
The FTCs generally grant distribution rights for the channels to an Indian company, which in turn sub-licences these rights to the MSOs, cable operators, etc.
The FTCs have been taking a stand that the payment for grant of distribution rights is not for any ‘copyright’ and hence, is not in the nature of Royalty (taxable on gross basis at a specified rate). The payment is in the nature of business income and would not be taxable in India in absence of any PE/operations carried out in India for earning such income. As against this, the Indian Tax Authorities have not been consistent in their approach on this issue. In some cases, they have been contending that payment by the Indian company to the FTC for grant of distribution rights is in the nature of business income and is taxable on similar lines as the advertisement revenues. Whilst, in other cases, they have been contending that the payment is for grant of copyright and accordingly liable to tax in India as Royalty on gross income basis at a specified rate. The issue is pending adjudication at various appellate levels.
Deductibility of expenditure incurred for acquiring telecasting rights in films/programmes
Generally, telecasting rights in films/programmes are acquired by the telecasting companies either on an outright basis or for a limited number of airings over a period of time. Where the rights are acquired on an outright basis or for limited airings that may span over different financial years, the issue is whether the cost of acquiring such rights can be claimed as deduction in the year of acquisition, or would the cost have to be claimed over the licence period. In case of television programmes, one view is that significant value of the programmes is derived at the time of first airing itself, after which there is hardly any residual value of the programme. Accordingly, the entire expenditure on acquisition of rights relating to such programme should be allowed as deduction in the year of first airing itself. In case of movie rights
PricewaterhouseCooopers I Indian entertainment and media outlook 2009
111
acquired for limited period or limited airings, the view is that the expenditure should be allowed over the period of time/number of airings.
The contrary view is that the expenditure on acquisition of rights should be treated as incurred on acquisition of capital asset, i.e. for acquiring of ‘copyright’/‘licence’ specifically covered as intangible asset eligible for depreciation at a specified rate. This issue continues to be a bone of contention between the telecasting companies and the Tax Authorities.
Withholding tax obligations in respect of payments to non-residents
The withholding tax regime in India requires the payer to withhold tax from specified payments to non-residents that are chargeable to tax in India, viz. Royalty, Fees for Technical Services, interest, etc. The issues, relating to the withholding tax obligations on certain key payments being made by the telecasting companies, are discussed below:
Payment for lease of transponders
Characterisation of the payment for lease of transponders has been a subject matter of extensive debate and there have been a catena of judicial decision on the issue, without any finality. The Tax Authorities have been contending that the payment is in the nature of Royalty, or is in the nature of Fees for Technical Services and therefore liable to withholding tax. There are conflicting decisions at the appellate level on the subject. In one of the cases, the Tax Tribunal has held that, the payment is in the nature of Royalty under the Act. However, in another case, it was held that, in terms of the relevant tax treaty, the payment is neither in the nature of Royalty nor Fees for Technical Services and accordingly, such payment is not liable to tax in India. Recently, the Authority for Advance Rulings has held that the payment for lease of navigation transponder is not in the nature of Royalty. Being aware of the above conflicting decision, Special Bench of Tax Tribunal has been constituted in Delhi to adjudicate on the issue.
Payment by FTCs to foreign companies for acquiring content
The telecasting companies generally acquire the television content either on licence basis or on outright basis. In such a scenario, the FTCs have been arguing that the payment for acquiring content
from foreign companies is not subject to withholding tax in India as the transaction is between two non-residents outside India. However, in certain cases, the Tax Authorities have been contending that where the FTCs acquire licence in the content for telecasting in India, the payment would be subject to withholding tax in India. Thus, the issue has been a matter of dispute between the tax payers and the Tax Authorities.
Indirect Tax Issues
Television networks are used as means for advertisement, display of programs etc. Typically, the television broadcasters earn revenue from advertisements and subscription charges collected from Multi System Operators (MSOs) and cable operators. Other source of revenue includes content syndication/sub-licensing of content.
A broadcaster is liable to service tax for the subscription charges recovered from MSO and cable operators for providing the signals along with selling of times slots on television for advertising purposes. Content syndication business (i.e. acquisition and selling/transfer of content rights) undertaken by the broadcaster also attracts indirect taxes.
The broadcasting agency or organisation may have office in India or outside India. In case the head office is situated outside India, such organization may operate in India through Indian branch or through subsidiary or through an agent. Thus for a foreign broadcaster, it is the Indian subsidiary or agent, who acts on behalf of such foreign broadcasting agency or organisation, is liable to pay service tax on the revenues earned by foreign principals.
Some of the key issues faced by broadcasting agency/subsidiary or agent of foreign broadcasting agency or organisation are as follows:
Customs Duty issues
Under the Indian law, any content (i.e. television programme, movies, etc.) that has to be aired/broadcasted needs to have a certification from the appropriate authority such as Central Board of Film Certification (‘CBFC’). The channel companies, whose broadcasting stations are located outside India, need to get a print of the content, which is to be aired/broadcasted, for certification purposes in India. After the certification, the same is exported back.
Tax and Regulatory Issues Impacting the Indian E&M Industry
112
Typically, at the time of import there is always rift between the importer and customs officers with regard to valuation of the content being imported. While the valuation aspect of the content can be discussed and debated at length, especially given the nature of present transaction, there is a dire need for the government to issue a clarification or notification to smoothen and expedite the clearance process.
As a suggestion, instead of leaving the practices up to the discretion of customs houses, government may grant an outright exemption for such imports subject to importer undertaking to re-export the goods in a given time frame and till then securing government revenue by way of a bond or bank guarantee.
Value Added Tax (‘VAT’) issues
VAT liability on sale of advertisement slots
A broadcaster is liable to service tax for sale of time slots for advertisement. Given that it is a service, at conceptual level, VAT should not be levied. However, in some jurisdictions, the revenue authorities have been disputing this position and levy VAT on sale of time slots for advertisement. The revenue authorities have contended that the sale of time slots is a sale of an intangible right and accordingly such sale should be treated as sale of goods. Revenue authorities in some states have also issued clarifications suggesting that this transaction could be liable to VAT.
In view of the settled position in law in BSNL and other cases, any transaction can either be subjected to goods tax or service tax. Based on the nature of this transaction, there don not appear to be any goods involved in this transaction. Hence, it may at the earliest be clarified that VAT should not be imposed on such transactions.
Grant of copyright liable to VAT
In case the channel company grants/sells the copyright in the content to some other channel or distributors in India, the same is subject to VAT under the respective state’s VAT legislations. Normally, the VAT charged by the channel company is available as Input Tax Credit (‘ITC’) to the purchasing channel company or distributors without any restriction. However, in the state of Maharashtra, (which is the hub of Indian entertainment industry) there is a restriction that only if the acquired copyright is re-sold within a particular period (i.e. 12 months), then only
ITC would be available to the purchaser.
Typically, the acquirer of the content exploits the content himself and may not necessarily re-sell it within 12 months. In such a situation, VAT paid at the time of content acquisition becomes ineligible for ITC.
The provisions in all other state VAT legislations do not have such restriction on availing ITC of the VAT paid. It is therefore suggested that the Maharashtra government may amend the VAT legislation to allow ITC on content acquisition without any restriction to be competitive with other states and also as a measure of relief to the industry in India.
Regulatory issues
• In the telecom sector, FDI up to 49% is permitted under the automatic route, while prior FIPB approval is required for any foreign investment in the broadcasting sector. There are telecom companies with plans for terrestrial broadcast through IPTV, etc. Thus, there appears to be a need for clarity on FDI guidelines on such activities by telecom companies.
• As per the existing exchange control regulations, any drawing of foreign exchange towards hiring charges of transponders by TV Channels and internet service providers requires prior approval of the MIB irrespective of the amount involved. These restrictions are, however, not applicable to remittance out of Resident Foreign Currency Account (RFC) and Exchange Earner’s Foreign Currency Account (EEFC). Continuing the trend over the last few years of liberalising exchange control restrictions, the Government may consider putting an appropriate limit under the automatic route for such payments even in cases, where remitter does not have RFC/EEFC account.
• Telecom companies providing IPTV services are required to pay a licence fee based on their Adjusted Gross Revenues. However, there seems to be no such payment obligation on cable operators offering IPTV services. Thus, appropriate policy measures may be taken in order to bring telecom companies on par with the cable operators.
• MIB had issued guidelines in 2005 for constitution of State/District Level Monitoring Committees to enforce the Cable TV Act. The scope of the Committee is:
PricewaterhouseCooopers I Indian entertainment and media outlook 2009
113
○ To provide a forum where the public may lodge complaint regarding content aired over cable TV
○ To bring to the notice of state government if any programme is affecting public order or wide spread resentment in any community
○ To keep a watch on the content carried by the cable TV channels at local level
○ To monitor the availability of free to air channels and channels notified for mandatory carriage on the cable network
However, as mentioned in the MIB Order issued in February 2008, the ground reality seems to be that there is a lack of clear understanding of the role to be played by the Committees as well as lack of awareness among the people about existence of such committees. Thus, in the aforesaid Order, MIB has reiterated the relevant provisions of the Cable TV Act and has further defined role of such committees for effective implementation thereof.
Print Media Industry
Direct Tax Issues
Taxability of advertisement revenues earned by foreign publishers from India
The business of publishing magazines is generally carried out from outside India by the foreign publishers. They appoint agents in India as their advertisement ‘concessionaire’. The agent is entitled to commission on the value of invoice directly raised by the publishers on the advertisers. Generally, the agent acts as an advertisement concessionaire for several principals. The issue that arises is whether the advertisement revenues earned by the foreign publishers are taxable in India.
In several cases, the Tax Authorities have generally been contending that the agent in India constitutes PE of the foreign publisher in India and hence, income attributable to such PE is liable to tax in India. However, the Authority for Advance Rulings has, in the case of one of the advertisement concessionaires of a foreign publisher, held that in a scenario where an agent derives less than 90% of the revenues from a single principal, it cannot be construed as a dependent agent of that principal and consequently cannot construe to be a PE of the latter. Consequently, the advertisement revenues earned by the foreign publisher ought not to be liable to tax
in India. In the light of the above, one hopes that the controversy surrounding the issue stands resolved.
Withholding tax on discounts given to advertising agencies
Generally, the advertising agencies buy space/slots in bulk from the print media companies (i.e. newspapers and magazines) for which discounts are provided to the advertising agents.
The Central Board of Direct Taxes (‘CBDT’) is of the view that such discount is in the nature of commission or brokerage paid by newspapers to the advertising agencies and accordingly, is liable to withholding tax under Section 194H of the IT Act. However, the tax payers are of the view that the newspapers provide discount on bulk purchase of space by the advertising agencies and hence, the question of payment by newspapers to advertising agencies does not arise at all. Accordingly, there would be no scope of withholding tax from such non-existent payments. Further, the relationship between the newspapers and the advertising agents is on principal-to-principal basis and not that of a principal-agent. Accordingly, it would not fall within the purview of Section 194H of the IT Act. In view of the above, the CBDT revisit its stand on the matter.
Regulatory issues
MIB has issued guidelines for publication of ‘Indian editions of foreign magazines dealing with news and current affairs’. The guidelines permit the Indian publisher to add local content and advertisements in the magazine. Further, the foreign investment limit in publishing Indian edition of foreign magazines in the Indian entity is restricted to 26% with prior approval of the Government.
The Government has permitted FDI up to 100% in Indian company with prior approval of the former in publication of ‘facsimile edition of foreign newspapers’ provided the FDI is by the owner of the original foreign newspaper whose facsimile edition is proposed to be brought out in India. The publication of facsimile edition of foreign newspaper would also be subject to the relevant MIB guidelines.
Tax and Regulatory Issues Impacting the Indian E&M Industry
114
Film Industry
Direct Tax Issues
Deduction of expenditure on film production/\acquisition of distribution rights
Rule 9A/9B of the IT Rules provides for the manner of claiming deduction in respect of the expenditure incurred in connection with the production of a film/acquisition of distribution rights. These expenses are allowed as deduction based on release of film or when the distribution rights to the films are exploited. Based on the facts of the case, the expenditure is allowed as deduction either in first year or over a period of two years.
One of the principles of jurisprudence is that ‘rules’ under the ‘Statute’ cannot over-ride the ‘Statute’ itself. Accordingly, the debate is whether Rule 9A/9B over-rides all other provisions of the IT Act (for e.g. capital expenditure vs. revenue expenditure, cash system of accounting vs. accrual system of accounting, disallowance of statutory payments not made within the due date of filing of tax return, etc.) or the income needs to be computed based on the provisions of IT Act (without re-course to the Rule 9A/9B). The issue has generated significant debate, but the jury is still out on the subject.
Joint production of films by Indian and foreign producer
In cases where the venture of producing film is undertaken jointly by an Indian and the foreign producer, care should be taken to ensure that the arrangement does not result into constitution of an Association of Persons (‘AOP’), which is taxed as a separate independent legal entity apart from its members. If the venture is assessed as an AOP, complexity could arise for e.g. availability of credit for taxes withheld eligibility to claim the tax treaty benefits, etc.
Taxability of Hollywood companies in India
Hollywood companies produce films outside India and distribute them throughout the world, including India. These companies generally import the prints of the movies into India, through their branch in India, and grant exhibition/distribution rights for lump sum consideration or Royalty based on ticket sales.
Determination of taxable income of the Hollywood companies has been a matter of interim controversy in view of the practical difficulties faced in computing net profit attributable to the Indian operations. In the past, the Motion Pictures Association of America (MPA), of which the Hollywood companies are members, had entered into an Agreement with the CBDT, whereby it was decided that the income of such companies would be determined at a presumptive rate of 25% of the gross film receipts earned out of the operations in India. While, the Agreement was effective only up to March 31, 1987, various Hollywood companies have continued to discharge their tax obligations on the aforesaid presumptive basis. However, the Tax Authorities have been taking a stand that since the Agreement was effective only up to March 31, 1987, it is no more valid and the taxable income for subsequent years should be computed as per the normal provisions of the IT Act. In one of the cases, the Tribunal has held that, in absence of any better method of assessment of the Hollywood companies, the principles laid down in the Agreement for determination of taxability cannot be overlooked.
In view of the above controversy, the CBDT may consider issuing appropriate clarification vis-à-vis taxability of Hollywood companies in India.
Indirect tax issues
Customs Duty issues
Import of master tapes for reproduction/replication/distribution purposes. The entertainment industry is witnessing a sea-change in quality standards and creativity with overall advancement in technology. Further, on account of globalization and removal of linguistic barriers, foreign contents such as movies and foreign language channels are penetrated in the Indian household.
Typically in the home entertainment segment, content rights in the cinematographic films are purchased for reproduction/replication/distribution purposes from overseas production houses for a specific period. The content owner gives a master tape containing the content (tangible) along with the right to use of content (intangible). At the time of import of such content rights in India, issue arises on determination of the value of such master tape for levying customs duty.
PricewaterhouseCooopers I Indian entertainment and media outlook 2009
115
As per the customs law, the value at the time of import of goods in India is transaction value which inter-alias includes the value of the material (i.e. master tapes) and certain other charges (such as royalty, licence fee, etc.). However, the customs law also specifies that customs duty should not be levied on the charges paid/payable by the importer to the seller for reproduction, replication and distribution. The value of the master tapes containing the content is always disputed by the customs authorities and at the clearance stage, customs authorities always insist on inclusion of royalty/licence fee paid/payable by the importer in the transaction value even if such royalty/licence fee is for reproduction, replication or distribution purposes. It is important to note that earlier when the magnetic storage devices (such as master tapes) were not available commercially or were not cost effective, the import of cinematographic films used to take place in reel form. At that time, the government had granted a specific exemption by restricting the levy of customs duty only on the material value of the reels imported. However, such exemption is still awaited for the import of cinematographic films in master tape formats.
The legislation of any country should always keep pace with the change in the technology. Therefore, the government may clarify this ambiguity by issuing a clarification/notification extending the benefit available to import of cinematographic films in reel form to import of cinematographic films in master tape formats also.
Differential rate of VAT on sale of recorded DVDs/CDs in different states
With the advancement of technology and availability of low cost DVDs /CDs in India, the home entertainment segment of the cinematographic film is growing at a staggering pace. The only path breaker in this growth is piracy i.e. unauthorized versions of the original DVDs/CDs floating in the market.
Typically in home entertainment segment, the content rights in the cinematographic films are exploited by way of recording the content in DVDs/CDs and selling them in retail market. The VAT rate applicable on sale of recorded DVDs/CDs in majority of states in India is 4%. However, in certain states such as Gujarat, Uttar Pradesh, Rajasthan, Madhya Pradesh and Assam, the rate of VAT on sale of recorded DVDs/CDs is 12.50%.
There is direct nexus between the prices of recorded DVDs/CDs with the piracy in India. The increased cost of recorded DVDs/CDs (on account of increased rate of VAT i.e. 12.50%) results in non-affordability of the legitimate copy of the DVDs/CDs to the consumers. In such a scenario, the demand of the non-legitimate versions of the recorded DVDs/CDs increases and helps the piracy to flourish in the market.
Such piracy results in loss to the state government’s VAT revenue, as the sale of such pirated/non-legitimate versions of DVDs/CDs go without levy of VAT. Moreover, since the central government provides specific exemption from levy of excise duty on manufacture of recorded DVDs/CDs, it is prudent on the state government part to either reduce the rate of VAT on sale of recorded DVDs/CDs to 4% or exempt the same from levy of VAT.
Regulatory Issues
• The State Governments are empowered to levy tax on ‘entertainment’ under the Constitution of India. While entertainment is one of the basic needs of life, especially in today’s taxing times, the entertainment tax levied on release of films in cinema halls is highly uneven across various States and is in excess of 30% – 40% in certain States. The Central Government should act as a coordinator in bringing parity in entertainment tax rates across India. Further, the industry has been demanding to lower the rate of entertainment tax.
• Currently, India has co-production treaties for films with Italy, Brazil, UK and Germany. India may consider entering into more co-production treaties with other countries. This should help to increase the export potential of the local film industry as such films would get the status of national production in both countries. It will also smoothen the process of importing equipment needed for films and lead to sharing of technologies and talent.
Radio Industry
Debate over Licence fee taxability
Radio broadcasters’ licence terms require them to pay licence fees to the Government, which is made up of a one-time entry fee and recurring annual fees on a revenue share. There is a debate about whether these fees should be categorised as capital
Tax and Regulatory Issues Impacting the Indian E&M Industry
116
or revenue expenditure. One view is that, since the annual licence fee is payable for each year of operation, the expenditure is a period cost necessary for the conduct of business and should therefore be allowed as revenue expenditure. Further, the one-time entry fee should be allowable as a deduction over the period of the licence. Another opposing view is that, the payment could be treated as incurred on a capital asset, i.e. for acquiring the ‘licence’ specifically covered as an intangible asset and hence, eligible for depreciation at 25%.
Direct Tax Issues
Deduction of licence fees
The radio broadcasters are required to pay licence fees, viz. one time entry fee and recurring annual fees, to the Government as per the terms of the licence. The issue that arises is whether such fees are in the nature of revenue expenditure to be claimed as deduction in the year in which it is incurred or is in the nature of capital expenditure entitled to depreciation at specified rate. One view is that, since the annual licence fee is payable for each year of operation, the expenditure is a period cost necessary for conduct of business and hence should be allowed as revenue expenditure. Further, the one time entry fee should be allowable as deduction over the period of licence. However, another view is that the payment could be treated as incurred on capital asset, i.e. for acquiring of ‘licence’ specifically covered as intangible asset eligible for depreciation at specified rates. Characterisation of expenditure as revenue or capital expenditure has always been a matter of intense controversy between the tax payers and Tax Authorities and is expected to be resolved only at higher appellate level.
Regulatory issues
• Currently, an annual licence fee of 4% of Gross Revenues is payable by the entity having FM radio licence. A clarification may be provided by the Government to the effect that the license fee would apply only to revenues from ‘radio operations’. Further, boost may be granted to the radio sector by charging licence fee on the basis of ‘net income’, as this would ensure collection of annual licence fee only from those companies which are profit making and would provide much required relief to radio players making losses.
• The FM radio licence is not renewable automatically at the end of initial 10 years of the licence period, which however, is provided in the telecom space. There could be a provision for automatic renewal of licence after the initial period of 10 years, although a financial sum of money may be charged for extension.
• There is a 5 year lock-in condition for changing the ownership pattern of the FM radio company through transfer of shares of the major shareholders to any new shareholders. Such condition may be relaxed to enable easy exits for promoters incurring losses and facilitating introduction of investors with big pockets.
• Foreign investment limit (FDI and FII) in radio continues to be at 20%, the lowest compared to print and television media. The view that FM radio is a sensitive sector and hence, there should be greater restrictions on foreign investment needs re-consideration to ensure faster growth of the FM radio industry.
• The existing limit of maximum 15% of total FM Radio channels in the country for a licence holder seems to be far-stretched, especially considering the additional restriction of one channel-per-city for such licence holder.
Music Industry
Direct Tax Issues
Taxability of Royalty income
The major sources of revenue for a music company are sales from recorded music, i.e. cassettes and CDs and royalties from licensing of rights to other music companies.
While the taxability of revenues arising from sale of cassettes and CDs is fairly simple, issues could evolve vis-à-vis taxability of income from licensing of rights. Income from licensing of rights could be either in the form of lump sum Royalty or Royalty based on turnover of the licensee or combination of both. Royalty based on turnover of the licensee is generally taxable in the respective years of turnover. However, as regard to lump sum Royalty, issues could arise as to whether such Royalty is taxable in the first year, i.e. on grant of licence or is taxable over the period of licence or is taxable only on completion of the
PricewaterhouseCooopers I Indian entertainment and media outlook 2009
117
transaction. Based on the judicial pronouncements, a view could be taken that such Royalty is taxable over the period of licence. Nonetheless, the Tax Authorities are of a different view and take the matter up to appellate levels, at which one may see an end to the controversy.
Deductibility of expenditure for acquisition of music rights
Cost of acquisition of licence/copyright in music forms a significant part of a music company’s cost. The issue that arises is whether such cost would be entitled to depreciation at a specified rate or is in the nature of revenue expenditure deductible in the first year or is to be treated as amortisable over the period of licence. The Tax Authorities have been following different approaches in different cases. This has lead to considerable uncertainty and litigation in the matter. A consistent approach from the Tax Authorities will provide some clarity to the tax payers.
Gaming Industry
Indirect Tax Issues
For gaming consoles imported in India, the customs duty rate is significantly higher as compared to the customs duty rates for similar products like computers, laptops, software and other entertainment products such as PDA mobile phones, MP3 players etc., which are also used to playing games. With the advancement in technology and developing market for gaming consoles in India, the government may reduce the rate of customs duty (equivalent to other forms of gaming devices) on gaming consoles imported in India by issuing clarification/notification.
Sports Entertainment Industry
Direct Tax Issues
Payments for acquiring broadcasting rights of live events
The issue that arises is whether the payment made to foreign company for acquiring right to telecast live feed of an event is taxable in India. The broadcasters are of the view that there is no ‘Copyright’ in the live feed. Accordingly, such payments should not be regarded as ‘Royalties’ and should not attract any withholding tax in India. However, in certain cases, the Tax Authorities have not accepted this position
and the matter is pending before the Appellate Authorities.
Taxability of clubs/governing bodies conducting league events
The league events could give rise to the tax issues for the clubs/governing bodies, especially in light of the amendments made by the Finance Act 2008 to the definition of the term ‘charitable purpose’. The Budget has amended the definition of ‘charitable purpose’ by excluding exemption in respect of the activities or services in the nature of trade, commerce or business. In light of the above amendment, the exemption claimed by the clubs/governing bodies, if any, needs to be re-looked if the league event is considered as a commercial activity.
Tax and Regulatory Issues Impacting the Indian E&M Industry
118
Budget 2009 Snapshot - Specific proposals for Entertainment & Media sector
Budget Wish list Budget - Proposed Amendments
Income Tax:Tax holiday on export of content by Indianproduction houses should be revived.
Clarification regarding taxability of ForeignTelecasting companies and Hollywood studios
Clarification on taxability (i.e. nature of income and the year of taxability) of lumpsum payments received for allowing use of copyrights and also the tax deductibility of such payments in the hands of payers.
Clarification regarding characterization oftransponder hire charges earned by foreign satellite companies.
Expenditure incurred outside India by filmproduction companies should be exempt from FBT.
Income Tax – Industry Specific Provisions:Withholding tax on advertising contracts increased from 1% to 2% (excluding surcharge and cess)
Income Tax – Other Important Provisions:New direct tax code to be released for publiccomments in 45 days
No change in Corporate tax rate
Exemption limit for individuals enhanced byRs.10,000 / Rs.15,000. Surcharge on personal tax waived
FBT abolished. Fringe benefits/perquisites nowtaxable in employees' hands
CBDT empowered to formulate 'safe harbour' rules*
Alternative dispute resolution mechanismintroduced for foreign companies and for Transfer Pricing adjustment
Effective rate of MAT increased from 11.33% to17%; carry forward of MAT credit enhanced from 7 to 10 years
Introduction of tax regime for LLPs. Income taxable in LLP's hands; exempt in the hands of Partners
Withholding tax on use of equipment reduced from 10% to 2% and on use of land & building from 20%/ 15% to 10% (excluding surcharge & cess)
Wealth tax exemption limit doubled to Rs. 30 lakhs
PricewaterhouseCooopers I Indian entertainment and media outlook 2009
119
Indirect Tax:
Rationalization of multifarious taxes / levies into a unified levy and reduction if the overall rate of such taxes / levies
Clarity / relaxation on customs duty valuation when content is imported into India
Clarity on Cenvat credit availability on servicesconsumed by foreign broadcasting companies when service tax on their revenues is paid by their Indian agent
Parity in customs duty on import of gamingconsoles vis-à-vis similar products such ascomputers, laptops, PDA, etc.
Sale of advertisement time slots to be exempted from Service Tax
Indirect Tax – Industry Specific Provisions:
Basic Custom Duty (‘BCD’) of 5% levied on set top boxes
BCD on LCD panels reduced from 10% to 5%
Excise duty on Mp3 and Mp4 increased from 4% to 8%
Indirect Tax – Other Important Provisions:
Median rate of BCD and excise duty maintained at 10% and 8.24% with some exceptions
Median rate of service tax maintained at 10.30%
Aggregate rate of customs duty remainedunchanged at 24.42%
Service providers providing taxable and exempt services, now have the option to pay at reduced rate of 6 percent of the value of exempt service (earlier it was 8%)
Others:
Liberalization of restrictions on cross-mediaownership
FDI in satellite radio should be permitted
Existing limit on royalty payment for use of foreign brand and trademark at 1% for domestic and 2% for export sales should be enhanced
* Safe harbour rule means circumstances in which Tax Authorities shall accept transfer prices declared by the taxpayer
Tax and Regulatory Issues Impacting the Indian E&M Industry
120
Cross Media ownership
There have been concerns raised on the issue of cross media ownership in the recent past. Having regard thereto, TRAI had issued a consultation paper in September 2008 and sought the comments of the industry players on the matter. After taking into consideration the issues arising from the consultation paper and comments from industry players, TRAI has issued its recommendations on Media ownership on February 25, 2009. It is felt that broadly the cross media ownership issues could arise in terms of: a) cross media ownership across different segments of media such as print/ television/ radio (horizontal integration); (b) cross holding restrictions to prevent consolidation including ‘vertical integration’ within a media segment such as television or radio; (c) market share in a geographical area within each media segment; and (d) cross control/ownership across telecom and media segments.
The recommendations of TRAI on these issues are as under:
1. In respect of ‘Horizontal Integration’, no specific recommendations have been given by TRAI. However, it has been suggested that a market study may be carried out by MIB for identifying safeguards and necessary safeguards should be put in place.
2. Vertical Integration
• At present, there are guidelines that DTH operator cannot hold more than 20% of total paid up equity in a broadcasting company and/or cable network company and vice versa. However, there are no ownership restrictions between broadcasting companies and cable network companies. Considering similar inconsistencies in the regulatory regime, it has been recommended that a Broadcaster should not have ‘control’ in the distribution segment (which would include cable operators) and vice-versa, wherein control is defined as holding more than 20% equity.
•• TRAI has suggested changing from ‘company’ based restrictions to ‘entity’ based restrictions. This is a
kind of ‘Anti-abuse’ rule to ensure that a particular business entity should not be allowed to use different ‘companies’ for taking control over broadcasting activity as well as distribution platforms.
•• Existing entities violating these norms to be given time of 3 years to restructure their businesses.
3. TRAI has recommended that no additional restrictions are required to be imposed on holding of number of licenses by a single entity.
4. It has suggested that, after working out the required safeguards for horizontal and vertical integration, the Government should issue merger & acquisition guidelines to prevent concentration of control and ownership.
5. The Authority has also recommended that no restrictions are required on convergence of telecom and media companies and that this issue could be reviewed after 2 years.
New FDI policy
Under the erstwhile FDI policy, there was a prescribed methodology for computing effective direct and indirect investment in few sectors (such as telecom) which required the non-resident investor to comply with the applicable sectoral limits. However, there was no uniform policy across sectors.
Now, under the new guidelines (issued in February 2009), foreign investments routed through Indian companies in which a majority ownership and control is held by Indian citizens would be treated as 100% domestic investment and hence the FDI to this extent will not be taken into account for the purposes of the sectoral caps.
PricewaterhouseCooopers I Indian entertainment and media outlook 2009
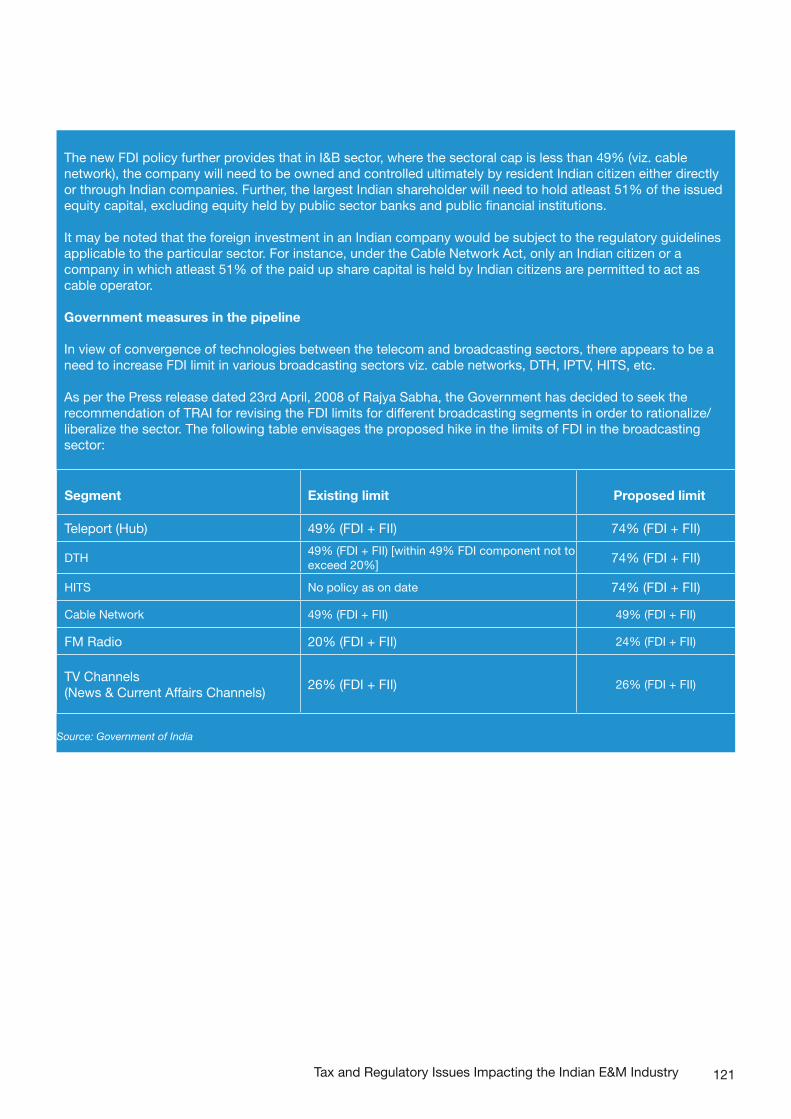
121
The new FDI policy further provides that in I&B sector, where the sectoral cap is less than 49% (viz. cable network), the company will need to be owned and controlled ultimately by resident Indian citizen either directly or through Indian companies. Further, the largest Indian shareholder will need to hold atleast 51% of the issued equity capital, excluding equity held by public sector banks and public financial institutions.
It may be noted that the foreign investment in an Indian company would be subject to the regulatory guidelines applicable to the particular sector. For instance, under the Cable Network Act, only an Indian citizen or a company in which atleast 51% of the paid up share capital is held by Indian citizens are permitted to act as cable operator.
Government measures in the pipeline
In view of convergence of technologies between the telecom and broadcasting sectors, there appears to be a need to increase FDI limit in various broadcasting sectors viz. cable networks, DTH, IPTV, HITS, etc.
As per the Press release dated 23rd April, 2008 of Rajya Sabha, the Government has decided to seek the recommendation of TRAI for revising the FDI limits for different broadcasting segments in order to rationalize/ liberalize the sector. The following table envisages the proposed hike in the limits of FDI in the broadcasting sector:
Segment Existing limit Proposed limit
Teleport (Hub) 49% (FDI + FII) 74% (FDI + FII)
DTH49% (FDI + FII) [within 49% FDI component not to exceed 20%] 74% (FDI + FII)
HITS No policy as on date 74% (FDI + FII)
Cable Network 49% (FDI + FII) 49% (FDI + FII)
FM Radio 20% (FDI + FII) 24% (FDI + FII)
TV Channels (News & Current Affairs Channels)
26% (FDI + FII) 26% (FDI + FII)
Source: Government of India
Tax and Regulatory Issues Impacting the Indian E&M Industry
122 PricewaterhouseCooopers I Indian entertainment and media outlook 2009
PricewaterhouseCoopers Entertainment and Media Practice
Every day, around the world, PricewaterhouseCoopers (PwC) plays a strong supporting role in entertainment and media businesses – a role that doesn’t end when the curtains go down. We’re here to share the insight, knowledge and practical skills we’ve acquired in our 150 year history to help you navigate difficult times. With a global outlook and local knowledge of culture, laws and business needs, PwC has been able to help clients in India make the most of the changing market scenario.
The entertainment and media (E&M) practice of PricewaterhouseCoopers has depth and breadth ofexperience across sectors. We understand how changes in the broader E&M industry are affecting our clients and work with them as a trusted advisor providing solutions to help improve organisationaleffectiveness and long term success.
We offer insights gained from years of experience working with a broad range of industry clients, atightly woven global network, and an extraordinary breadth of advisory , tax and regulatory services.
Our industry professionals offer industry-tailored performance improvement and transactional servicesas well as crisis support. Our combination of top-flight qualifications and industry expertise, global reach, thought leadership and ability to deliver comprehensive, industry focused services make PricewaterhouseCoopers one of the leading advisers to the entertainment and media industry. We are proud to have been recognised by industry experts as a leader in our field:
Kennedy Information identified PwC as a “Vanguard” firm in the Global Media Consulting Marketplace – an elite, top tier ranking commemorating leadership in depth, breadth and momentum of consulting service capabilities.1
Among the Big 4 firms, PwC was recognised by Kennedy Information as the strongest provider to the Global Media Marketplace.1
Key Contacts
Timmy S KandhariEmail: [email protected] : + 91 22 6669 1580
Smita Jha Email : [email protected] : + 91 124 4620 111
Jay SampatEmail: [email protected] : + 91 22 6669 1730
1 Commnucations and Media Consulting Marketplace 2008-2011: Key Trends, Profiles and Forecasts, Kennedy Information, 2008

123
Office Locations
AhmedabadPresident Plaza, 1st FloorOpp. Muktidham DerasarS G Highway, ThaltejAhmedabad 380 054Tel: + 91 79 3091 7000Fax: + 91 79 2909 0007
Hyderabad# 8-2-293/82/A/113ARoad No.36, Jubilee HillsHyderabad 500 034Tel: + 91 40 6624 6600Fax: + 91 40 6624 6200
Bangalore7th Floor, Tower “D”The Millenia1 & 2 Murphy Road, UlsoorBangalore 560 008Tel: + 91 80 4079 7000Fax: + 91 80 4079 7222
KolkataPlot No.56 & 57, Block DNSector V, Salt Lake, Electronics ComplexBidhannagarKolkata 700 091Tel: + 91 33 2341 4234Fax: + 91 2357 3395
BhubanseshwarIDOCL HouseBlock 3, Ground Floor, Unit 2Bhubaneshwar 751 009Tel: + 91 674 253 2279Fax: + 91 674 253 1381
Mumbai252, Veer Savarkar MargShivaji Park, DadarMumbai 400 028Tel: + 91 22 6669 1000Fax: + 91 22 6654 7807
ChennaiPwC Centre #32Khader Nawaz Khan RoadNungambakkamChennai 600 006Tel: + 91 44 4228 5000Fax: + 91 44 4228 5100
MumbaiPwC House , , Plot 18/A,Gurunanak Road (Station Road),Bandra (west), Mumbai - 400050, India Tel: + 91 22 6689 1000Fax: + 91 22 66891888
GurgaonBuilding 8, 7th & 8th Floors, Tower BDLF Cyber CityGurgaon 122 002Tel: + 91 124 462 0000Fax: + 91 124 462 0620
PuneMutha Towers5th Floor, Suite No.8Airport Road, YerwadaPune 411 006Tel: + 91 20 4100 4444Fax: + 91 20 2616 1131
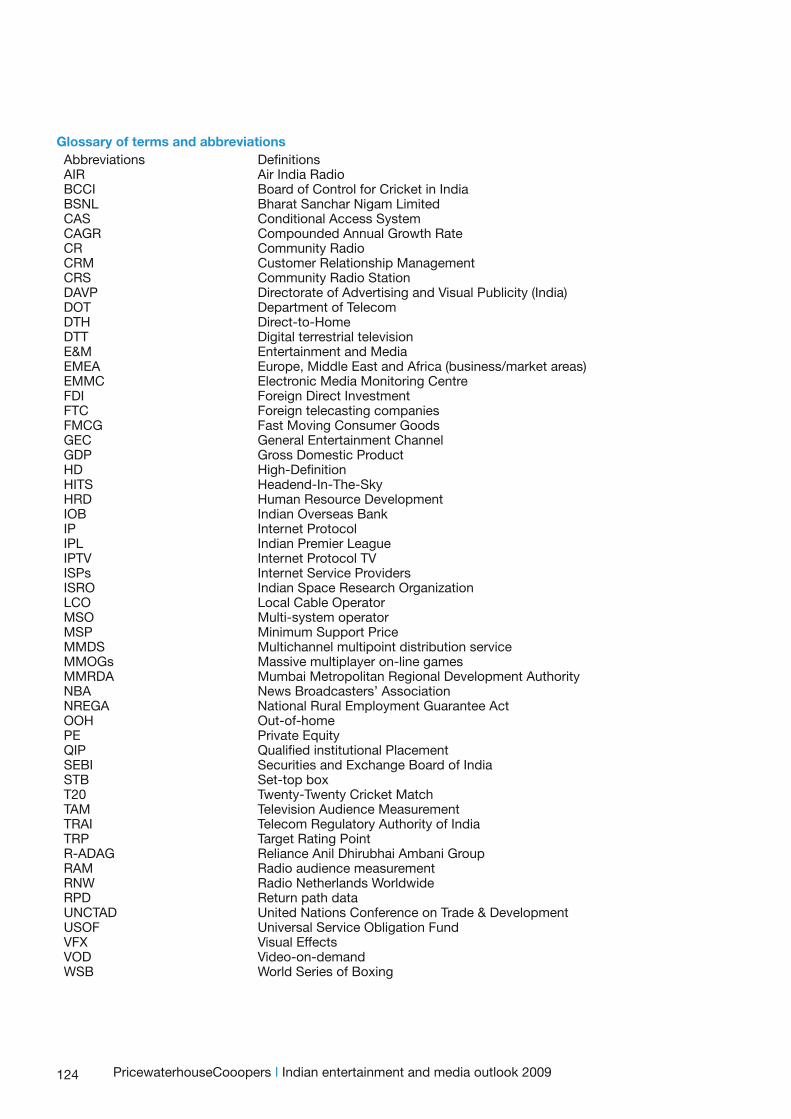
124 PricewaterhouseCooopers I Indian entertainment and media outlook 2009
Glossary of terms and abbreviationsAbbreviations DefinitionsAIR Air India RadioBCCI Board of Control for Cricket in IndiaBSNL Bharat Sanchar Nigam LimitedCAS Conditional Access SystemCAGR Compounded Annual Growth RateCR Community RadioCRM Customer Relationship ManagementCRS Community Radio StationDAVP Directorate of Advertising and Visual Publicity (India)DOT Department of TelecomDTH Direct-to-HomeDTT Digital terrestrial televisionE&M Entertainment and Media EMEA Europe, Middle East and Africa (business/market areas)EMMC Electronic Media Monitoring CentreFDI Foreign Direct InvestmentFTC Foreign telecasting companiesFMCG Fast Moving Consumer GoodsGEC General Entertainment ChannelGDP Gross Domestic ProductHD High-DefinitionHITS Headend-In-The-SkyHRD Human Resource DevelopmentIOB Indian Overseas BankIP Internet Protocol IPL Indian Premier LeagueIPTV Internet Protocol TVISPs Internet Service ProvidersISRO Indian Space Research OrganizationLCO Local Cable OperatorMSO Multi-system operatorMSP Minimum Support PriceMMDS Multichannel multipoint distribution serviceMMOGs Massive multiplayer on-line gamesMMRDA Mumbai Metropolitan Regional Development AuthorityNBA News Broadcasters’ AssociationNREGA National Rural Employment Guarantee ActOOH Out-of-homePE Private EquityQIP Qualified institutional PlacementSEBI Securities and Exchange Board of IndiaSTB Set-top boxT20 Twenty-Twenty Cricket MatchTAM Television Audience MeasurementTRAI Telecom Regulatory Authority of India TRP Target Rating PointR-ADAG Reliance Anil Dhirubhai Ambani GroupRAM Radio audience measurementRNW Radio Netherlands WorldwideRPD Return path dataUNCTAD United Nations Conference on Trade & DevelopmentUSOF Universal Service Obligation FundVFX Visual EffectsVOD Video-on-demandWSB World Series of Boxing
125
Glossary of tables and charts Page No.
Chart 1.1: Global GDP Outlook ...................................................................................................................................................... 6Chart 1.2: Nominal GDP & India E&M spending ............................................................................................................................. 6Chart 1.3: Global E&M will leapfrog GDP with recovery ............................................................................................................... 22Chart 1.4: Global E&M Outlook 2009-2013 ...................................................................................................................................22Chart 1.5: 2013 global ad spend still trails 2007 levels .................................................................................................................22Chart 2.1: GRPs of GEC channels ................................................................................................................................................ 32Chart 2.2: GRP trends of GEC channels .......................................................................................................................................33Chart 3.1: Top 10 English dailies ...................................................................................................................................................53Chart 3.2: Top 10 Hindi dailies ...................................................................................................................................................... 53Chart 3.3: Top 10 Magazines .........................................................................................................................................................53Chart 4.1: Occupancy levels of multiplex chains ..........................................................................................................................63Chart 6.1: Genre wise distribution of physical sales .................................................................................................................... .80Chart 6.2: Average physical unit sales of top 10 albums ..............................................................................................................80Chart 6.3: Broadband subscribers ............................................................................................................................................. ...90Chart 6.4 Category wise advertising on OOH (2008 vs. 2007 .................................................................................................... ..95Chart 6.5 Region wise revenue vs occupancy in 2008 ................................................................................................................ .95Table 1 : Growth of Indian Entertainment and Media industry 2004-2008 ................................................................................... 16Table 1.1: Growth of the Indian Advertising Industry 2004-2008 ..................................................................................................16Table 1.2: Select Foreign Investment in 2008 ............................................................................................................................... 20Table 1.3: Select Private Equity Deals in 2008 .............................................................................................................................. 20Table 1.4: Select FDI Inflows in the E&M Sector in 2008 ............................................................................................................ ..21Table 1.5: Proposal for increasing FDI limits in the Indian E&M Industry .................................................................................... ..21Table 1.6 : Global Entertainment and Media Market by Segment (US$ Millions) ..........................................................................23Table 1.7: Global Entertainment and Media Market by Region (US$ Millions) ..............................................................................24Table 1.8 : Global Advertising ........................................................................................................................................................24Table 1.9: BRIC Nations E&M outlook 2009 ..................................................................................................................................25Table 1.10: Outlook for the Indian Entertainment and Media industry 2009-2013 ........................................................................27Table 1.11: Outlook for Indian Advertising Industry 2009-2013 ....................................................................................................27Table 2.1: Growth of Indian Television Industry 2004-2008 ......................................................................................................... .30Table 2.2: Growth of Indian Television Industry 2004-2008 ......................................................................................................... .31Table 2.3 - Select Domestic Television Deals in 2008 ...................................................................................................................34Table 2.4 Select Cross Border Television Deals- Outbound in 2008 .............................................................................................35Table 2. 5 Select Cross Border Television Deals- Inbound in 2008 ...............................................................................................35Table 2.6 Select Private Equity Television Deals in 2008 .............................................................................................................. 35Table 2.7 Key Players in the Regional Television Markets .............................................................................................................36Table 2.8: Global Television Advertising Market by Region (US$ Millions) ....................................................................................45Table 2.9: Global TV Subscription and License Fee Market by Region (US$ Millions) ................................................................ .45Table2.10: Projected growth of Indian Television Industry 2009-2013 ..........................................................................................47Table2.11: Projected growth of Indian Television Industry 2009-2013 ..........................................................................................47Table 3.1: Growth of Indian Print Media Industry 2004-2008 ........................................................................................................50Table 3.2: Growth of Indian Print Media Industry 2004-2008 ...................................................................................................... .50 Table 3.3 : Global Newspaper Publishing Market by Region (US$ Millions)..................................................................................58Table 3.4: Global Consumer Magazine Publishing Market by Region (US$ Millions) ................................................................. ..58Table 3.5: Projected growth of Indian Print Media Industry 2009-2013.........................................................................................59Table 3.6: Projected growth of Indian Print Media Industry 2009-2013 ........................................................................................59Table 4.1: Growth of the Indian Film Industry 2004-2008............................................................................................................ ..62Table 4.2: Expansion plans of multiplex chains .............................................................................................................................63Table 4.3: Revenue share between producer and distributor ...................................................................................................... .63Table 4.4: Box Office collections (low budget movies) ..................................................................................................................65
126
Glossary of tables and charts Page No.
Table 4.5: Top performing Hindi films in 2008 ........................................................................................................................... ....65Table 4.6: Top performing Hindi films in 2009 (January-March 2009) ...........................................................................................66Table 4.7: Top performing Hollywood films in 2008 ................................................................................................................... ...66Table 4.8: Top performing Hollywood films in 2009 (January-March 2009) ............................................................................... ...67Table 4.9: Global Filmed Entertainment Market by Region (US$ Millions) ...................................................................................69Table 4.10: Projected growth of Indian Film Industry 2009-13 ......................................................................................................70Table 5.1: Growth of the Indian Radio Industry 2004-2008 ...........................................................................................................72Table 5.2 : Global Radio Market by Region (US$ Millions) ...........................................................................................................76Table 5.3: Projected growth of the Indian Radio Industry 2009-13 ...............................................................................................76Table 6.1: Growth of the Indian Music Industry 2004-08 ............................................................................................................ ..80Table 6.2: Global Recorded Music Market by Region (US$ Millions) ............................................................................................83Table 6.3: Projected growth of Indian Music Industry 2009-13 .....................................................................................................83Table 6.4 Growth of the Indian Internet Advertising Industry .................................................................................................... ..84Table 6.5: Top Social Networking sites in India .............................................................................................................................85Table 6.6: Top 15 were properties in India ranked by unique visitors .......................................................................................... .86Table 6.7: Top 20 Indian websites .................................................................................................................................................86Table 6.8 Top Global Web Properties Ranked by Total Unique Visitors (000)# May 2008 .............................................................88Table 6.9 India Search Market Overview – June 2008 ................................................................................................................. .88Table 6.10 Asia-Pacific Search Over view – Country Breakdown- July 2008 ...............................................................................89Table 6.11: Top search properties in India .................................................................................................................................... 89Table 6.12: Usage of internet access in India.............................................................................................................................. ..90Table 6.13: Global Internet Advertising Market: Wired and Mobile by Region (US$ Millions)...................................................... .92Table 6.14: Projected growth of Indian Internet Advertising Industry 2009-13 .............................................................................93Table 6.15: Global Out-of-Home Advertising Market by Region ...................................................................................................96Table 6.16: Projected growth of the Indian OOH Industry 2009-13 ..............................................................................................96Table 6.17: Growth of the Indian Animation and Gaming Industry 2004-08 .................................................................................98Table 6.18: Projected growth of the Indian Animation and Gaming Industry 2009-13 ............................................................. ..102Table 6.19: Global Video Game Market by Region .................................................................................................................... .102Table 6.20: Valuations of IPL teams ........................................................................................................................................... .103
PricewaterhouseCooopers I Indian entertainment and media outlook 2009

127
Contributors
Pooja Teckchandani Parimal Sinha
Acknowledgements
Himanshu ParekhKanwal GuptaMadhurima DasVishal Gada
Sarah KoshieNitu SinghNaveli GuptaJasmin Lakdawala
128
Use of Outlook data
This document is provided by PricewaterhouseCoopers for general guidance only and does not constitute the provision of legal advice, accounting services, investment advice, or professional consulting of any kind. The information provided herein should not be used as a substitute consultation with professional tax, accounting, legal, or other competent advisers. Before making any decision or taking any action, you should consult a professional adviser who has been provided with all pertinent facts relevant to your particular situation.
The information is provided as is, with no assurance or guarantee of completeness, accuracy, or timeliness of the information and without warranty of any kind, express or implied, including but not limited to warranties of performance, merchantability, and fitness for a particular purpose.
Permission to citeNo part of this publication may be excerpted, reproduced, stored in a retrieval system, or distributed or transmitted in any form or by any means— including electronic, mechanical, photocopying, recording, or scanning— without the prior written permission of the Entertainment and Media practice of PricewaterhouseCoopers India.
Requests should be submitted in writing outlining the excerpts you wish to use along with a draft copy of the full report that the excerpts will appear in. Provision of this information is necessary for every citation request to enable PricewaterhouseCoopers to assess the context in which the excerpts are being presented.
Without limiting the foregoing, you may not use excerpts from the publication in financial prospectus documents, public offerings, private placement memoranda, filings with any securities and exchange commission (including SEBI and Securities and Exchange Commission) , annual reports, or similar financial, investment, or regulatory documents.
DisclaimerThis document is prepared on the basis of information obtained from key industry players, trade associations, government agencies, trade publications, and various industry sources specifically mentioned in the report. While due care has been taken to ensure accuracy of the information contained in the report, no warranty, express or implied, is being made, or will be made, by PricewaterhouseCoopers as regards the accuracy and adequacy of the information contained in the report.
PricewaterhouseCooopers I Indian entertainment and media outlook 2009

Indian entertainment and media outlook 2009Ind
ian entertainment and
med
ia outlook 2009
pwc.com/india
© 2009 PricewaterhouseCoopers. All rights reserved. “PricewaterhouseCoopers”, a registered trademark, refers to PricewaterhouseCoopers Private Limited (a limited company in India) or, as the context requires, other member firms of PricewaterhouseCoopers International Limited, each of which is a separate and independent legal entity.