Embed Size (px)
Citation preview
Energy Systems Research Laboratory, FIU
PV Energy Utilization
Professor Osama A. Mohammed
Department of Electrical and Computer Engineering
EEL5285 & EEL 4930All Sections (Spring 2017)
Professor O. A. Mohammed, EEL5285 Lecture Notes, Spring 2017
Energy Systems Research Laboratory, FIU
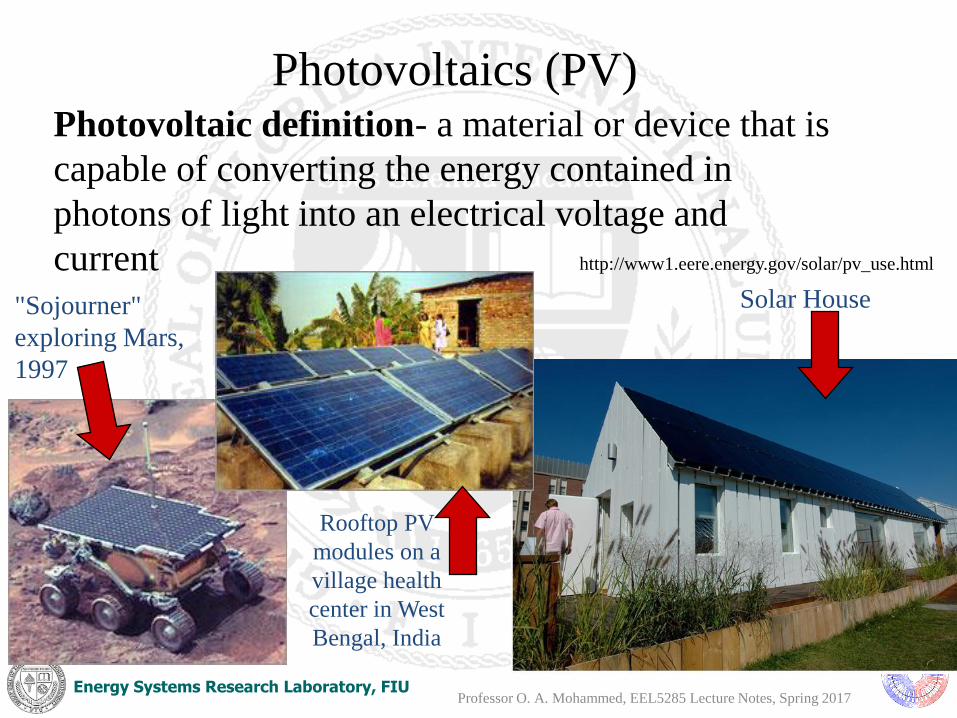
Photovoltaics (PV)Photovoltaic definition- a material or device that is
capable of converting the energy contained in
photons of light into an electrical voltage and
current
Rooftop PV
modules on a
village health
center in West
Bengal, India
http://www1.eere.energy.gov/solar/pv_use.html
"Sojourner"
exploring Mars,
1997
Solar House
Professor O. A. Mohammed, EEL5285 Lecture Notes, Spring 2017

Energy Systems Research Laboratory, FIUProfessor O. A. Mohammed, EEL5285 Lecture Notes, Spring 2017
Energy Systems Research Laboratory, FIU Professor O. A. Mohammed, EEL5285 Lecture Notes, Spring 2017

Energy Systems Research Laboratory, FIU
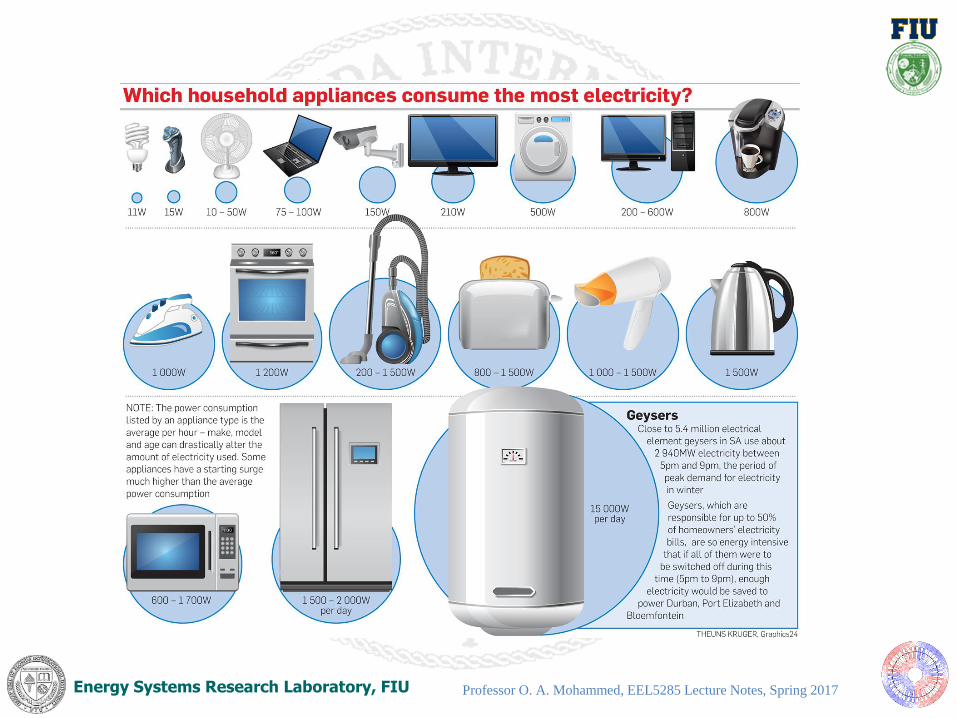
Loads- Household Consumption
Source: EIA 2008
Annual Energy
Review
Professor O. A. Mohammed, EEL5285 Lecture Notes, Spring 2017

Energy Systems Research Laboratory, FIU
Example: Daily Variation
for CA
Professor O. A. Mohammed, EEL5285 Lecture Notes, Spring 2017

Energy Systems Research Laboratory, FIU
Example: Weekly Variation
Professor O. A. Mohammed, EEL5285 Lecture Notes, Spring 2017

Energy Systems Research Laboratory, FIU
Example: Annual System
Load
0
5000
10000
15000
20000
250001
518
1035
1552
2069
2586
3103
3620
4137
4654
5171
5688
6205
6722
7239
7756
8273
Hour of Year
MW
Lo
ad
Professor O. A. Mohammed, EEL5285 Lecture Notes, Spring 2017

Energy Systems Research Laboratory, FIU
Load Duration CurveA very common way of representing the annual load is to sort the one hour
values, from highest to lowest. This representation is known as a “load
duration curve.”
6000
5000
4000
3000
2000
1000
0DE
MA
ND
(M
W)
0 1000 HRS 7000 8760
Load duration curve tells how much generation is needed
Professor O. A. Mohammed, EEL5285 Lecture Notes, Spring 2017

Energy Systems Research Laboratory, FIU
Ball park Energy Costs
Source: http://www.oe.energy.gov/DocumentsandMedia/adequacy_report_01-09-09.pdf
Professor O. A. Mohammed, EEL5285 Lecture Notes, Spring 2017

Energy Systems Research Laboratory, FIU
Support for Renewable Energy
• The White House issued report about how the
stimulus is going. Renewable energy projects
were very much included. For example the
largest solar PV installation in US, 579 MW
Solo Star Site in California.
• Cost of residential solar is projected to decrease
from $0.21 per kWh in 2009 to $0.10 in 2015
and $0.06 by 2030; wholesale parity is $0.05.
http://www.whitehouse.gov/sites/default/files/uploads/Recovery_Act_Innovation.pdf
Professor O. A. Mohammed, EEL5285 Lecture Notes, Spring 2017

Energy Systems Research Laboratory, FIU Professor O. A. Mohammed, EEL5285 Lecture Notes, Spring 2017
Solar Star (I and II) United States 34°49′50″N
118°23′53″W
579 2015
Topaz Solar Farm United States35°23′N 120°4′W
550 2017
Desert Sunlight Solar
FarmUnited States 33°49′33″N
115°24′08″W
550 2015
Copper Mountain
Solar FacilityUnited States
35°47′N 114°59′W458 2015
Largest Solar Plants in the US

Energy Systems Research Laboratory, FIU
Efficiency and Home Energy Use
• Whole-house energy efficiency approach – find out
which parts consume the most energy
http://www1.eere.energy.gov/consumer/tips/home_energy.html
Professor O. A. Mohammed, EEL5285 Lecture Notes, Spring 2017

Energy Systems Research Laboratory, FIU
PV History
• Edmund Becquerel (1839)
• Adams and Day (1876)
• Albert Einstein (1904)
• Czochralski (1940s)
• Vanguard I satellite (1958)
• Today…
http://www.nrel.gov/pv/pv_manufacturing/cost_capacity.html
Cost/Capacity Analysis(Wp is peak Watt)
Professor O. A. Mohammed, EEL5285 Lecture Notes, Spring 2017

Energy Systems Research Laboratory, FIU
PV System Overview
Shadows• Solar cell is a diode
• Photopower converted to DC
• Shadows & defects convert
generating areas to loads
• DC is converted to AC by an
inverter
• Loads are unpredictable
• Storage helps match
generation to load
Professor O. A. Mohammed, EEL5285 Lecture Notes, Spring 2017

Energy Systems Research Laboratory, FIU
Some General Issues in PV• The device
• Efficiency, cost, manufacturability
automation, testing
• Encapsulation
• Cost, weight, strength,
yellowing, etc.
• Accelerated lifetime testing
• 30 year outdoor test is difficult
• Damp heat, light soak, etc.
• Inverter & system design
• Micro-inverters, blocking diodes, reliability
Professor O. A. Mohammed, EEL5285 Lecture Notes, Spring 2017

Energy Systems Research Laboratory, FIU
What are Solar Cells?
Cu
rre
nt
Voltage
Open-
circuit
voltage
Short-circuit
current
Maximum
Power
Point
n-t
ype
p-t
ype
-+
Load
• Solar cells are diodes
• Light (photons) generate
free carriers (electrons and
holes) which are collected
by the electric field of the
diode junction
• The output current is a
fraction of this
photocurrent
• The output voltage is a
fraction of the diode built-
in voltage
Professor O. A. Mohammed, EEL5285 Lecture Notes, Spring 2017

Energy Systems Research Laboratory, FIU
Standard Equivalent Circuit Model
Photo
curr
ent
sourc
e
Dio
de
Shunt
resis
tance
Load
Series resistance
Where does the power go?
(minimize)
(maxim
ize)
Professor O. A. Mohammed, EEL5285 Lecture Notes, Spring 2017

Energy Systems Research Laboratory, FIU
Photons
• Photons are characterized by their wavelength
(frequency) and their energy
(8.1)c v
(8.2)hc
E hvv
Quantity Si GaAs CdTe InP
Band gap (eV) 1.12 1.42 1.5 1.35
Cut-off wavelength (μm) 1.11 0.87 0.83 0.92
Table 8.2 Band Gap and Cut-off Wavelength Above Which Electron
Excitation Doesn’t Occur
Professor O. A. Mohammed, EEL5285 Lecture Notes, Spring 2017

Energy Systems Research Laboratory, FIU
Energy-band Diagrams
• Conduction band – top band, here electrons contribute to current
flow, empty at absolute zero for semiconductors
• An electron must acquire the band gap energy to jump across to
the conduction band, measured in electron-volts eV
• Electrons create holes when they jump to the conduction band
• Photons with enough energy create hole-electron pairs in a
semiconductor
http://upload.wikimedia.org/wikipedia/co
mmons/c/c7/Isolator-metal.svg
Silicon band gap
energy is 1.12 eV
Professor O. A. Mohammed, EEL5285 Lecture Notes, Spring 2017

Energy Systems Research Laboratory, FIU
Silicon Solar Cell Max Efficiency
• Upper bound on the efficiency of a silicon solar cell:
• Band gap: 1.12 eV, Wavelength: 1.11 μm
• This means that photons with wavelengths longer
than 1.11 μm cannot send an electron to the
conduction band.
• Photons with a shorter wavelength but more energy
than 1.12 eV dissipate the extra energy as heat
Professor O. A. Mohammed, EEL5285 Lecture Notes, Spring 2017

Energy Systems Research Laboratory, FIU
Silicon Solar Cell Max Efficiency
• For an Air Mass
Ratio of 1.5,
49.6% is the
maximum
possible fraction
of the sun’s
energy that can
be collected with
a silicon solar
cell
Professor O. A. Mohammed, EEL5285 Lecture Notes, Spring 2017

Energy Systems Research Laboratory, FIU
Review of Diodes
• Two regions: “n-type” which donate
electrons and “p-type” which accept
electrons
• p-n junction- diffusion of electrons
and holes, current will flow readily in
one direction (forward biased) but not
in the other (reverse biased), this is
the diode
http://en.wikipedia.org/wiki/File:Pn-junction-equilibrium.png
Professor O. A. Mohammed, EEL5285 Lecture Notes, Spring 2017
Energy Systems Research Laboratory, FIU
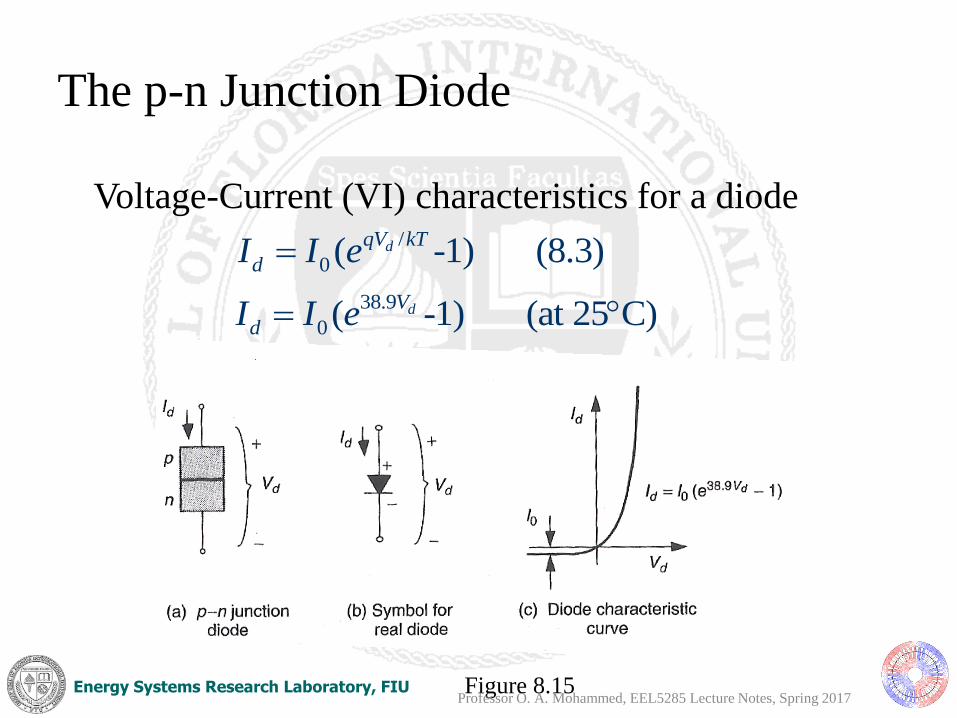
The p-n Junction Diode
Voltage-Current (VI) characteristics for a diode/
0( -1) (8.3)dqV kT
dI I e
38.9
0( -1) (at 25 C)dV
dI I e
Figure 8.15Professor O. A. Mohammed, EEL5285 Lecture Notes, Spring 2017

Energy Systems Research Laboratory, FIU
Circuit Model
• The current going to the load is the short-circuit
current minus diode current
• Setting I to zero, the open circuit voltage is
/
0( -1) (8.8)qV kT
SCI I I e
0
ln 1 (8.9)SCOC
IkTV
q I
ISC
Id
I
VLoad
+
-
I
VLoad
+
-
+
-PV
Professor O. A. Mohammed, EEL5285 Lecture Notes, Spring 2017

Energy Systems Research Laboratory, FIU
PV Equivalent Circuit
• Add impact of parallel leakage resistance RP (want
RP to be high)
• Add impact of series resistance RS (want RS to be
small) due to contact between cell and wires and
some from resistance of semiconductor
( ) (8.12)SC d
P
VI I I
R
(8.14)d SV V I R
Figure 8.22. PV Cell with parallel resistance
Vd
Professor O. A. Mohammed, EEL5285 Lecture Notes, Spring 2017

Energy Systems Research Laboratory, FIU
Series and Shunt Resistance Effects:
Considering both Rs and Rp:
Series resistance drops
some voltage (reduces
output voltage)
Shunt resistance drops
some current (reduces
output current)
Voltage & Current are coupled
Ph
oto
cu
rre
nt
so
urc
e
Dio
de
RP
Load
Rs
(minimize)
(ma
xim
ize
)
Equivalent Circuit
38.9( )
0
1e 1 - @ 25 C (8.18)sV IR
SC S
P
I I I V I RR
Id
I
ISC
Professor O. A. Mohammed, EEL5285 Lecture Notes, Spring 2017
Energy Systems Research Laboratory, FIU
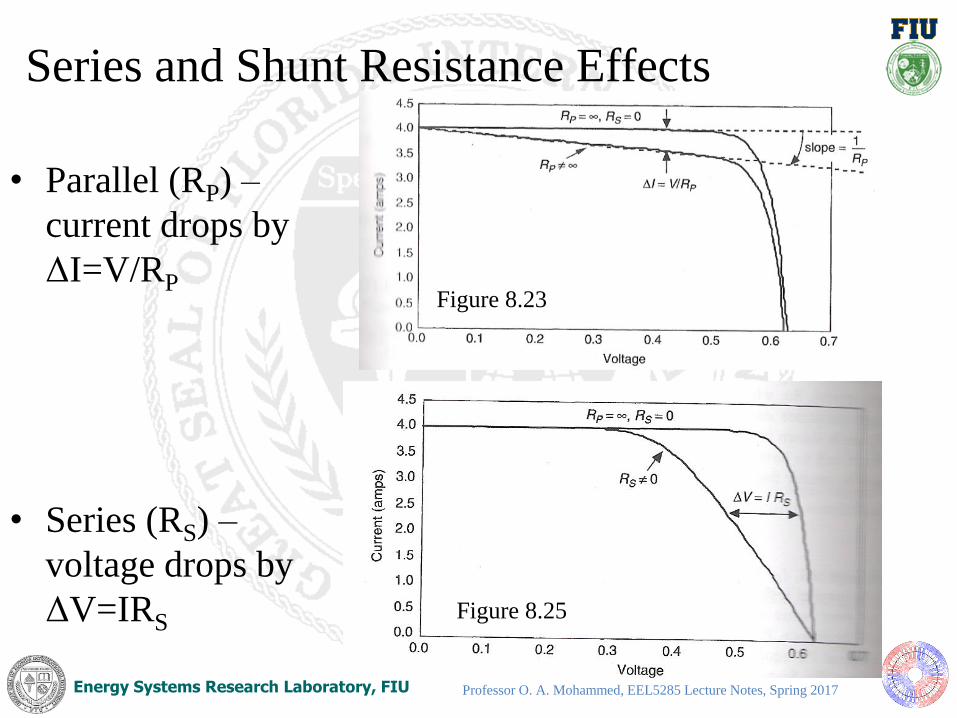
Series and Shunt Resistance Effects
• Parallel (RP) –
current drops by
ΔI=V/RP
• Series (RS) –
voltage drops by
ΔV=IRS
Figure 8.23
Figure 8.25
Professor O. A. Mohammed, EEL5285 Lecture Notes, Spring 2017

Energy Systems Research Laboratory, FIU
Fill Factor and Cell
Efficiency
Fill Factor (FF)
=
VRIR
Isc•Voc
Cell Efficiency
(h) =
Isc•Voc•FF
Incident
Power
Imax•Vmax
Incident
Power
=
“AM 1.5” Incident Solar
Power ~100 mW/cm2
JSC
Professor O. A. Mohammed, EEL5285 Lecture Notes, Spring 2017
Energy Systems Research Laboratory, FIU
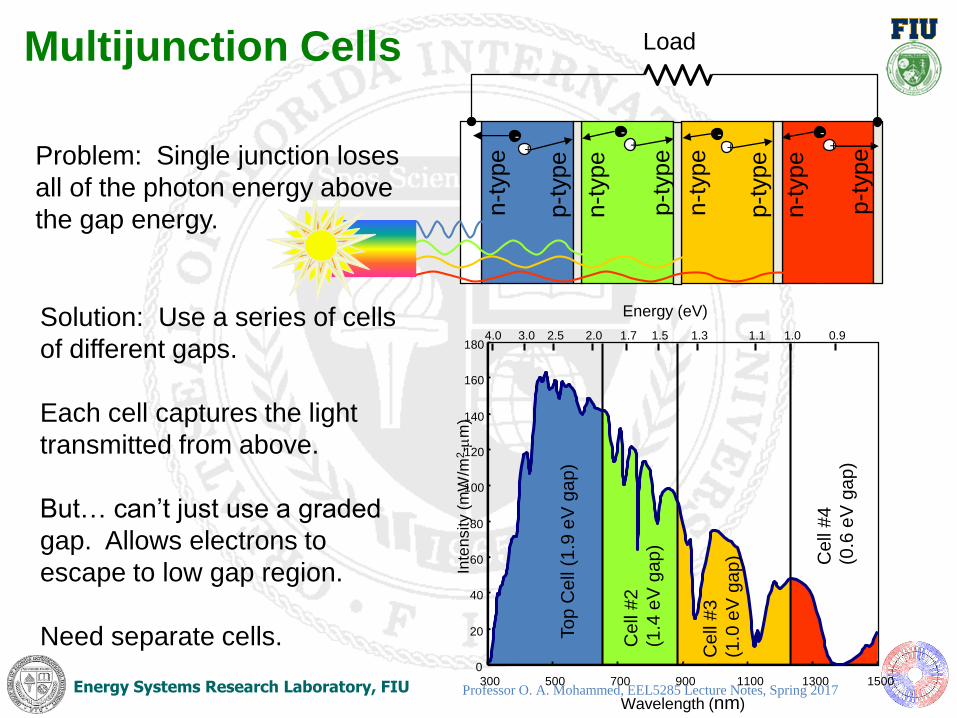
Multijunction Cells
Problem: Single junction loses
all of the photon energy above
the gap energy.
Energy (eV)
0
20
40
60
80
100
120
140
160
180
300 500 700 900 1100 1300 1500
4.0 3.0 2.5 2.0 1.7 1.5 1.3 1.1 1.0 0.9
Inte
nsity (
mW
/m2-m
m)
Wavelength (nm)
To
p C
ell
(1.9
eV
ga
p)
Ce
ll #
2
(1.4
eV
ga
p)
Ce
ll #
3
(1.0
eV
ga
p) Ce
ll #
4
(0.6
eV
gap)
Solution: Use a series of cells
of different gaps.
Each cell captures the light
transmitted from above.
But… can’t just use a graded
gap. Allows electrons to
escape to low gap region.
Need separate cells.
n-t
ype
p-t
ype
n-t
ype
p-t
ype
n-t
ype
p-t
ype
n-t
ype
p-t
ype
-+
-+
-+
-+
Load
Professor O. A. Mohammed, EEL5285 Lecture Notes, Spring 2017

Energy Systems Research Laboratory, FIU
Record laboratory thin film
cell efficiencies
Professor O. A. Mohammed, EEL5285 Lecture Notes, Spring 2017
Energy Systems Research Laboratory, FIU
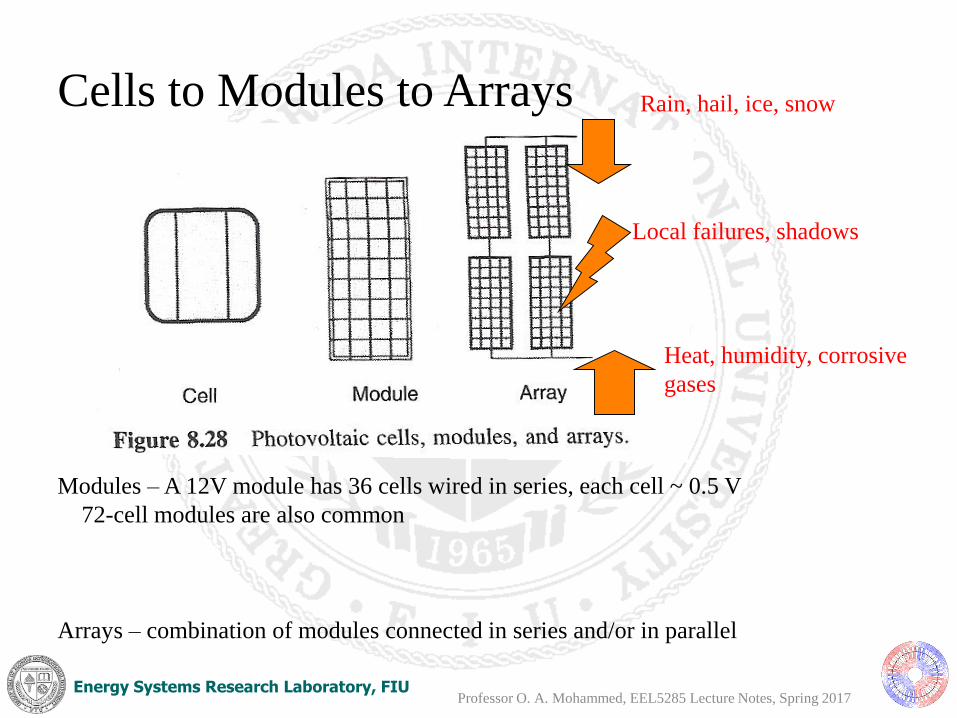
Cells to Modules to Arrays
Modules – A 12V module has 36 cells wired in series, each cell ~ 0.5 V
72-cell modules are also common
Arrays – combination of modules connected in series and/or in parallel
Heat, humidity, corrosive
gases
Rain, hail, ice, snow
Local failures, shadows
Professor O. A. Mohammed, EEL5285 Lecture Notes, Spring 2017

Energy Systems Research Laboratory, FIU
Interconnect SchemesSoldered (standard for Si cells)
Monolithic interconnects
Encapsulation
Professor O. A. Mohammed, EEL5285 Lecture Notes, Spring 2017
Energy Systems Research Laboratory, FIU
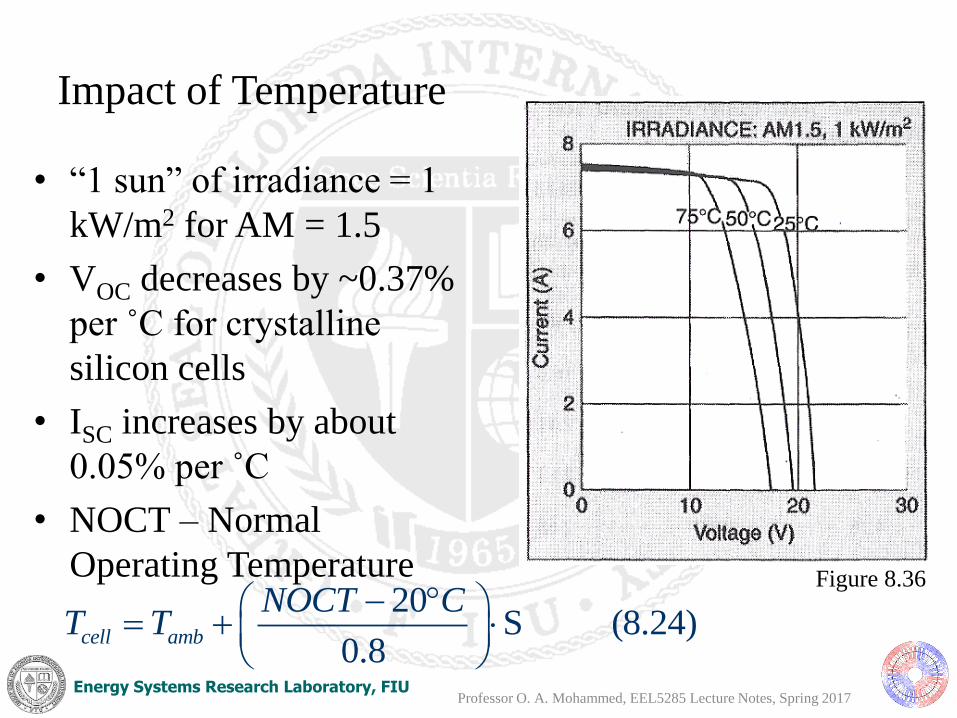
Impact of Temperature
• “1 sun” of irradiance = 1
kW/m2 for AM = 1.5
• VOC decreases by ~0.37%
per ˚C for crystalline
silicon cells
• ISC increases by about
0.05% per ˚C
• NOCT – Normal
Operating Temperature20
S (8.24)0.8
cell amb
NOCT CT T
Figure 8.36
Professor O. A. Mohammed, EEL5285 Lecture Notes, Spring 2017

Energy Systems Research Laboratory, FIU
Impact of Shading
• Shading causes PV to act as a resistor instead of a
current source, can reduce output power by > 50%
Figure 8.38
Figure 8.37
Professor O. A. Mohammed, EEL5285 Lecture Notes, Spring 2017

Energy Systems Research Laboratory, FIU
Blocking Diodes -- protection from low voltage strings
Cell arrays including a weak
cell; the array performs at
the level of the worst cell.
Cell 1 Cell 2
Back contact
Front contact
Monolithically-interconnected Cell Array
Two good cells
One good cell, one weak cell
Diodes can be used to
prevent current from strong
arrays flowing through weak
array segments. However,
they reduce output voltage. For a full discussion, see H.S. Rauschenbach, Solar Cell Array Design
Handbook (Van Nostrand Reinhold, New York, 1980)
Professor O. A. Mohammed, EEL5285 Lecture Notes, Spring 2017

Energy Systems Research Laboratory, FIU
Bypass Diodes -- protection from low current strings
• Bypass diodes are used in modules to route current around
shadowed or defective strings (series connected strings must
maintain constant current throughout)
• Used typically every 15-20 cells
Professor O. A. Mohammed, EEL5285 Lecture Notes, Spring 2017

Energy Systems Research Laboratory, FIU
Silicon Solar Modules
• Crystalline silicon
– Single crystals
– Cast polycrystals
• Well understood
• Cost analysis easy
• Source material is expensive
• Material sensitive to impurities & defects
• The major limitation to Si technology is the availability of electronic-grade Si… most manufactured technology
Professor O. A. Mohammed, EEL5285 Lecture Notes, Spring 2017

Energy Systems Research Laboratory, FIU
Silicon Solar Modules
• Steps to make a Si module:
• Growth of the Si bulk crystal (ingot)
• Cutting of the wafers from the grown ingot
• Diffusion of dopants to form the junction
• Interconnection
• Packaging
Figure courtesy R. Birkmire, Univ. of Delaware Professor O. A. Mohammed, EEL5285 Lecture Notes, Spring 2017

Energy Systems Research Laboratory, FIU
• Bulk single crystal boules grown by this method.
Czochralsky Si
Growth rate
0.5-3 mm/min
Photographs courtesy MEMC Electronic Materials Inc, St. Peters MO.
Some issues:
• Low throughput
• High energy use
• Requires skilled
operator
Typical PV boule
diameter:
100-150 mm
length:
40-150 cm
Professor O. A. Mohammed, EEL5285 Lecture Notes, Spring 2017

Energy Systems Research Laboratory, FIU
Cast Monocrystalline Silicon
Seed crystal
Figures Courtesy:
Professor O. A. Mohammed, EEL5285 Lecture Notes, Spring 2017
Energy Systems Research Laboratory, FIU
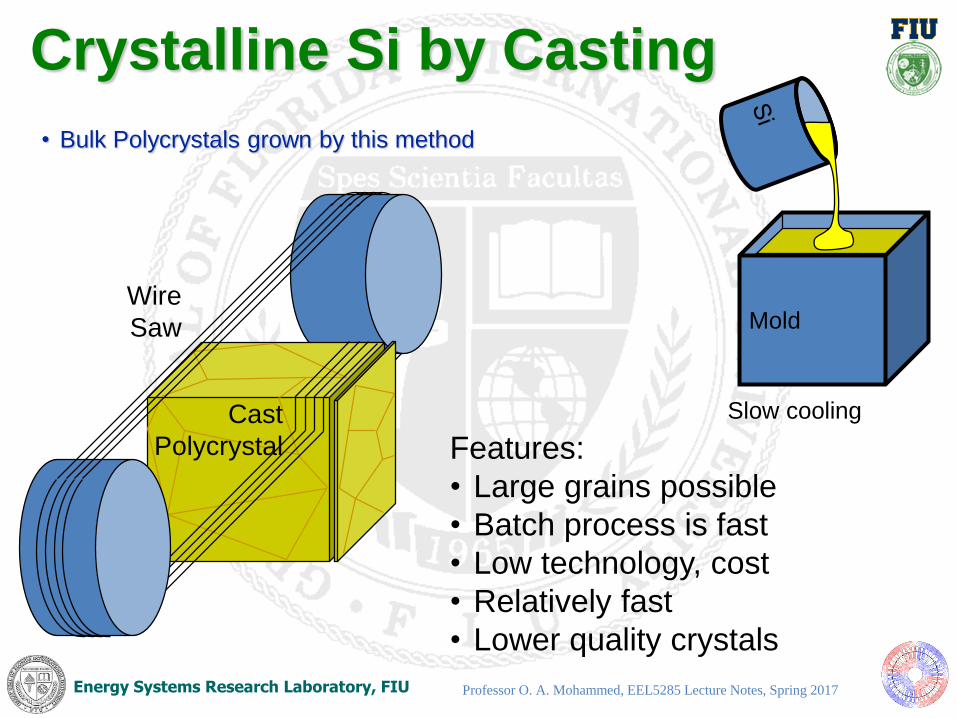
• Bulk Polycrystals grown by this method
Crystalline Si by Casting
Mold
Cast
Polycrystal
Wire
Saw
Slow cooling
Features:
• Large grains possible
• Batch process is fast
• Low technology, cost
• Relatively fast
• Lower quality crystals
Professor O. A. Mohammed, EEL5285 Lecture Notes, Spring 2017

Energy Systems Research Laboratory, FIU
PV Systems – Four configurations
1. Grid-connected systems
Professor O. A. Mohammed, EEL5285 Lecture Notes, Spring 2017
Energy Systems Research Laboratory, FIU
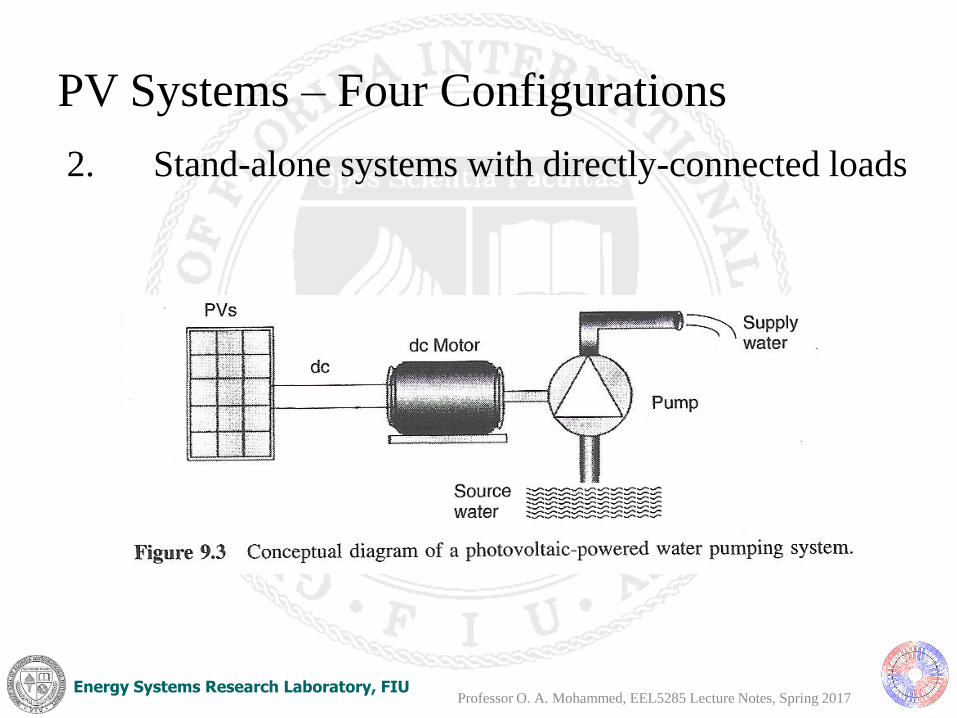
PV Systems – Four Configurations
2. Stand-alone systems with directly-connected loads
Professor O. A. Mohammed, EEL5285 Lecture Notes, Spring 2017

Energy Systems Research Laboratory, FIU
PV Powered Water Pumping
http://www.rajkuntwar.com/html/Solar.html
http://www.oksolar.com/pumps/
http://solar-investment.us/solar-pv-surface-and-bore-water-pumping/
Professor O. A. Mohammed, EEL5285 Lecture Notes, Spring
2017
Energy Systems Research Laboratory, FIU
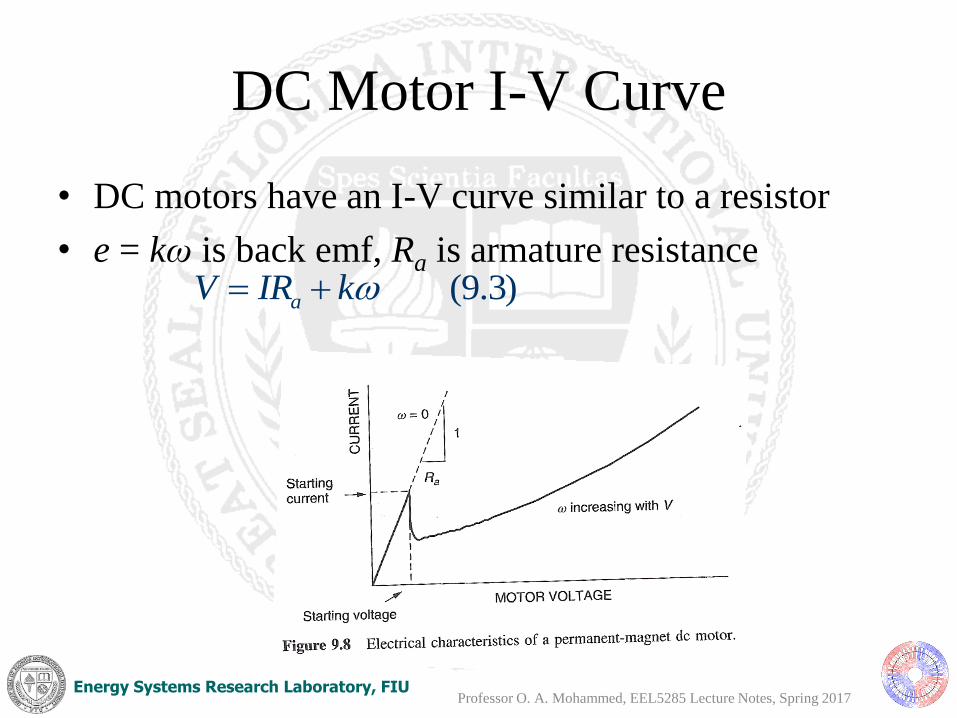
DC Motor I-V Curve
• DC motors have an I-V curve similar to a resistor
• e = kω is back emf, Ra is armature resistance(9.3)aV IR k
Professor O. A. Mohammed, EEL5285 Lecture Notes, Spring 2017

Energy Systems Research Laboratory, FIU
DC Motor I-V Curve
Linear Current
Booster (LCB) helps
the motor be able to
start in low sunlight
Figure 9.9
Figure 9.10
Professor O. A. Mohammed, EEL5285 Lecture Notes, Spring 2017

Energy Systems Research Laboratory, FIU
PV Systems – Four Configurations
3. Stand-alone systems which charge batteries
Professor O. A. Mohammed, EEL5285 Lecture Notes, Spring 2017

Energy Systems Research Laboratory, FIU
PV Systems – Four Configurations
• A small electric grid with several generation sources
– The microgrid can be configured to operate either connected to
the main grid or standalone
• The military is a key proponent of microgrids, since they would
like the ability to operate bases independent of any grid system for
long periods of time
• Renewable generation by be quite attractive because it decreases
the need to store large amounts of fossil fuel
– Time magazine reported in Nov 2009 that average US solider in
Afghanistan requires 22 gallons of fuel per day at an average
costs of $45 per gallon
4. Microgrids
Professor O. A. Mohammed, EEL5285 Lecture Notes, Spring 2017

Energy Systems Research Laboratory, FIU
1- Practical PV System component
• Grid-connected PV systems without battery
storage
• Grid-connected PV systems with battery
storage
• Grid-connected PV systems with battery
storage
2- Modeling the PV Array
• PV equivalent Circuit
• PV Simulink Model
• Impact of changing irradiance on Voc & load
current
3- Simulation of PV VI & VP characteristics
• Modeling Variable Load
• Study the VI & VP characteristics of the PV
panel
4- Maximum Power Point Tracking
• Modeling MPPT algorithm
• Modeling DC-DC boost converter
• Case study for MPPT performance
PV Implementation, Examples and Assignments
5- Modeling Grid Connected PV systems
• Model Description
• Voltage source Inverter (VSC) Model
• Voltage source inverter (VSC) control
• Case Study
Professor O. A. Mohammed, EEL5285 Lecture Notes, Spring 2017

Energy Systems Research Laboratory, FIU
Practical PV System component
DC
DC
VSI
To filter the ripple on the output
voltage of the PV arrays
PV Array
DC
AC
G
Boost Converter
TL
TransformerGrid
Cable
Maximum Power Point
Tracking is implemented here
• To convert the voltage from DC to
AC
• The AC voltage has to be
synchronized with the grid
voltage
• Reactive power compensation is
needed to connect to the grid
• PV supplies active power
Professor O. A. Mohammed, EEL5285 Lecture Notes, Spring 2017
Irradiance W/m^2

Energy Systems Research Laboratory, FIU
Why we need Power Conditioning in
PV Systems?
1. The output voltage of PV systems is DC,
while most of the loads are AC
2. The characteristics of PV arrays are non-
linear hence power conditioning units are
needed to track their maximum power point
Professor O. A. Mohammed, EEL5285 Lecture Notes, Spring 2017
Energy Systems Research Laboratory, FIU
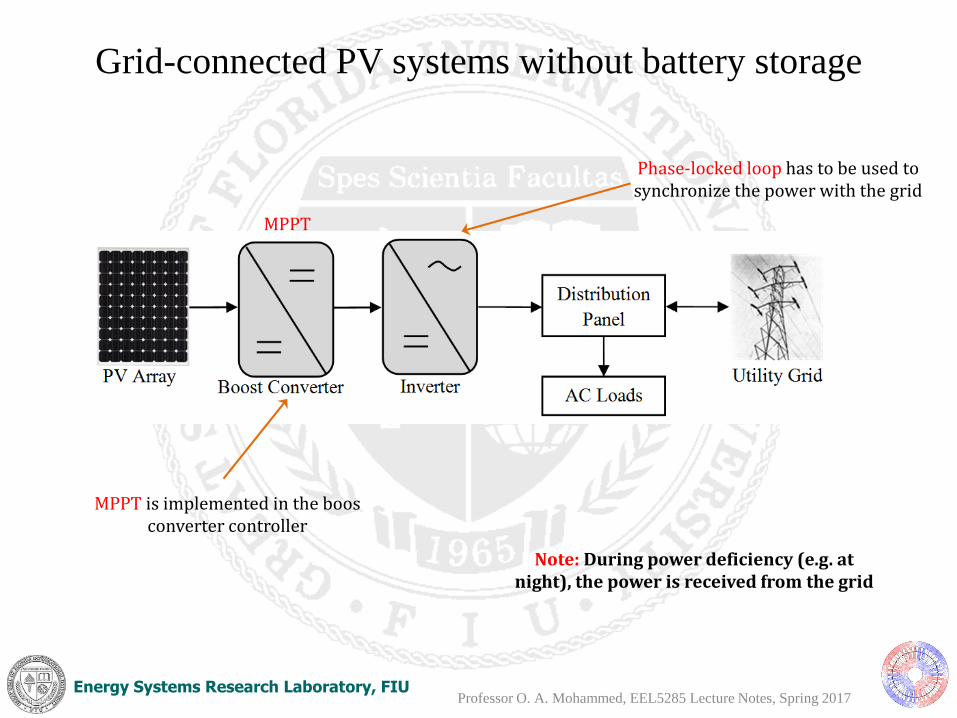
Grid-connected PV systems without battery storage
Phase-locked loop has to be used to synchronize the power with the grid
MPPT is implemented in the boos converter controller
MPPT
Note: During power deficiency (e.g. at night), the power is received from the grid
Professor O. A. Mohammed, EEL5285 Lecture Notes, Spring 2017

Energy Systems Research Laboratory, FIU
Grid-connected PV systems with
battery storage
Inverter
Distribution
Panel
AC Loads Utility Grid
PV Array
Battery
Charger
Battery
• In this system, there are two options for covering power deficiencies: the grid and the battery.
• This can be used for energy management.
MPPT
Professor O. A. Mohammed, EEL5285 Lecture Notes, Spring 2017
Energy Systems Research Laboratory, FIU
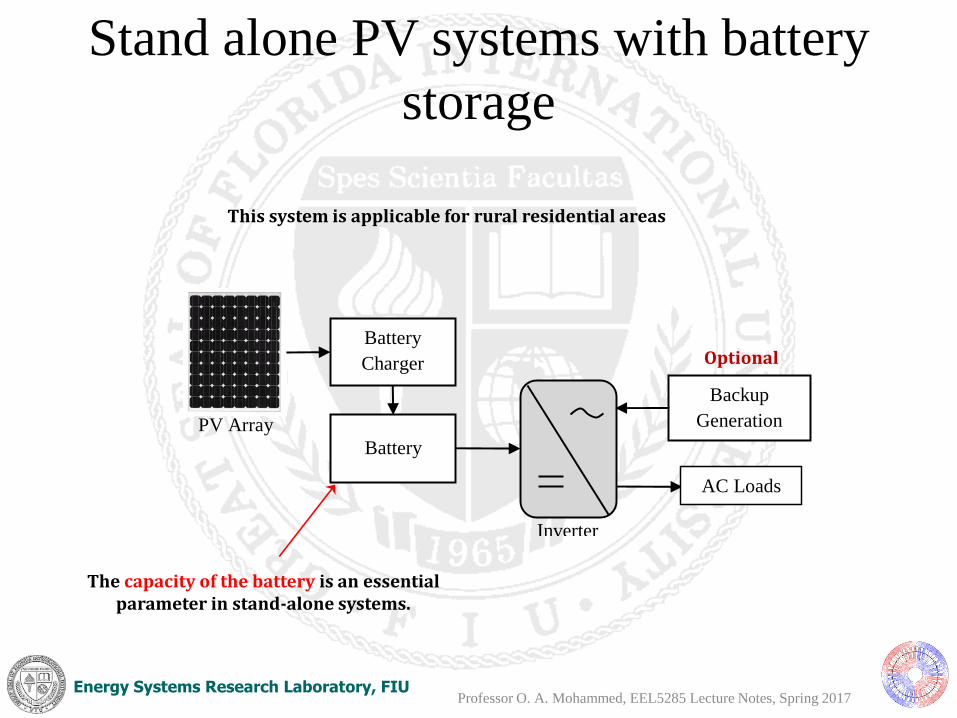
Stand alone PV systems with battery
storage
PV Array
Backup
Generation
Inverter
Battery
Charger
Battery
AC Loads
Optional
The capacity of the battery is an essential parameter in stand-alone systems.
This system is applicable for rural residential areas
Professor O. A. Mohammed, EEL5285 Lecture Notes, Spring 2017

Energy Systems Research Laboratory, FIU
Modeling the PV Array
• Objective
1. Building simulation model that represent the relation between the PV output( voltage, current) and environmental parameters.
2. Utilizing the simulation model to study the impact of changing irradiance on the PV output voltage and current.
3. Simulating the performance of different PV modules consisting of series and parallel connected cells.
Professor O. A. Mohammed, EEL5285 Lecture Notes, Spring 2017

Energy Systems Research Laboratory, FIU
Modeling the PV Array
• Objective
Building mathematical models for PV array to
represent the PV voltage and current output as a
function of irradiance input.
Modeling a PV array is achieved by implementing
the equations relating the PV output voltage and
power the its parameters: photo-generated current
IL, diode saturation current ID, parallel resistance
RSH and series resistance Rs
Professor O. A. Mohammed, EEL5285 Lecture Notes, Spring 2017

Energy Systems Research Laboratory, FIU
PV equivalent Circuit
Professor O. A. Mohammed, EEL5285 Lecture Notes, Spring 2017

Energy Systems Research Laboratory, FIU
PV Simulink Model
Irradiance Pattern
Isc
Vt
Irradiance
Irradiance /Voc
Characteristic
Professor O. A. Mohammed, EEL5285 Lecture Notes, Spring 2017

Energy Systems Research Laboratory, FIU
Model Setting
Professor O. A. Mohammed, EEL5285 Lecture Notes, Spring 2017

Energy Systems Research Laboratory, FIU
Impact of changing irradiance on Voc
Ou
tpu
tV
olt
ag
eIr
rad
ian
ceD
iod
e cu
rren
tO
utp
ut
curr
ent
Irradiance
Ou
tpu
tV
olt
ag
e
Professor O. A. Mohammed, EEL5285 Lecture Notes, Spring 2017

Energy Systems Research Laboratory, FIU
Simulation Example Assignment #1
• Modify the Irradiance pattern in the Simulink Model “EX_IR_CHAR” to represent actual summer and winter Day In Miami Area.
• Change the number of series Module to two modules and observe the effect of the irradiance change.
• Change the number of Parallel Module to two modules and observe the effect of the irradiance change.
Professor O. A. Mohammed, EEL5285 Lecture Notes, Spring 2017

Energy Systems Research Laboratory, FIU
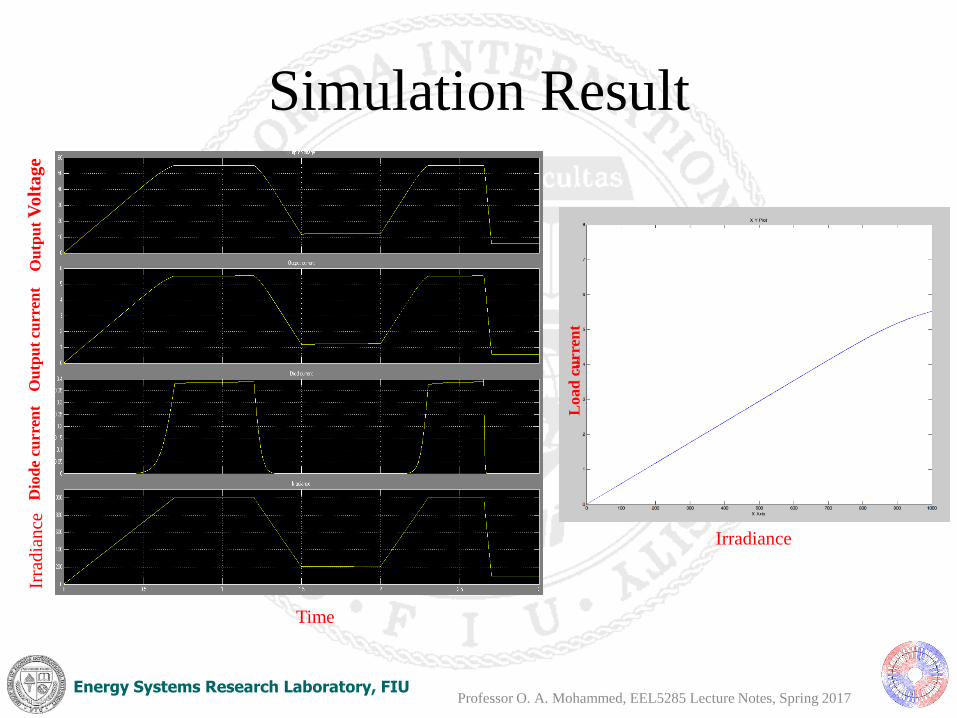
Impact of changing irradiance on Load
current• Connect 20 Ohm resistive
Load to the PV Model.
• Apply variable Irradiance
pattern from 0 to 1000
W/m2
• Observe the effect of the
Irradiance change at the
load current
Professor O. A. Mohammed, EEL5285 Lecture Notes, Spring 2017
Energy Systems Research Laboratory, FIU
Simulation Result
Ou
tpu
tV
olt
ag
eIr
rad
ian
ceD
iod
e cu
rren
tO
utp
ut
curr
ent
Time
Irradiance
Load
cu
rren
t
Professor O. A. Mohammed, EEL5285 Lecture Notes, Spring 2017

Energy Systems Research Laboratory, FIU
Homework Assignment #2
• Modify the Irradiance pattern in the Simulink Model “EX_IR_I_CHAR” to represent actual summer and winter Day In Miami Area.
• Modify the model to calculate the output power and efficacy
• Change the number of series Module to two modules and observe the change in the load current .
• Change the number of Parallel Module to two the change in the load current .
Professor O. A. Mohammed, EEL5285 Lecture Notes, Spring 2017

Energy Systems Research Laboratory, FIU
Load I-V Curves
• PV panels have I-V curves and so do loads
• Use a combination of the two curves to tell where the
system is actually operating
• Operating point – the intersection point at which the
PV and the load I-V curves are satisfied
Professor O. A. Mohammed, EEL5285 Lecture Notes, Spring 2017

Energy Systems Research Laboratory, FIU
Resistive Load I-V Curve
• Straight line with slope 1/R
• As R increases, operating point moves to the right
V IR1
(9.1)I VR
• Can use a potentiometer to
plot the PV module’s IV
curve
• Resistance value that results
in maximum power
(9.2)mm
m
VR
I
Figure 9.5
Professor O. A. Mohammed, EEL5285 Lecture Notes, Spring 2017

Energy Systems Research Laboratory, FIU
Maximum power transfer
• Maximum
power point
(MPP) should
occur when the
load resistance
R = VR/IR under
1-sun 25˚C, AM
1.5 conditions
• A MPP tracker maintains PV system’s highest efficiency as the
amount of insolation changes.
Professor O. A. Mohammed, EEL5285 Lecture Notes, Spring 2017

Energy Systems Research Laboratory, FIU
Maximum Power Point Trackers
• Maximum Power Point Trackers (MPPTs) are often a
standard part of PV systems, especially grid-
connected
• Idea is to keep the operating point near the knee of
the PV system’s I-V curve
• Buck-boost converter – DC to DC converter, can
either “buck” (lower) or “boost” (raise) the voltage
• Varying the duty cycle of a buck-boost converter can
be done such that the PV system will deliver the
maximum power to the load
Professor O. A. Mohammed, EEL5285 Lecture Notes, Spring 2017

Energy Systems Research Laboratory, FIU
Hourly I-V Curves
• Current at any
voltage is
proportional to
insolation
• VOC drops as
insolation
decreases
• Can just adjust
the 1-sun I-V
curve by shifting
it up or down
Professor O. A. Mohammed, EEL5285 Lecture Notes, Spring 2017

Energy Systems Research Laboratory, FIU
Grid-Connected Systems
• Can have a combiner box and a single inverter or
small inverters for each panel
• Individual inverters make the system modular
• Inverter sends AC power to utility service panel
• Power conditioning unit (PCU) may include
– MPPT
– Ground-fault circuit interrupter (GFCI)
– Circuitry to disconnect from grid if utility loses power
– Battery bank to provide back-up power
Professor O. A. Mohammed, EEL5285 Lecture Notes, Spring 2017
Energy Systems Research Laboratory, FIU
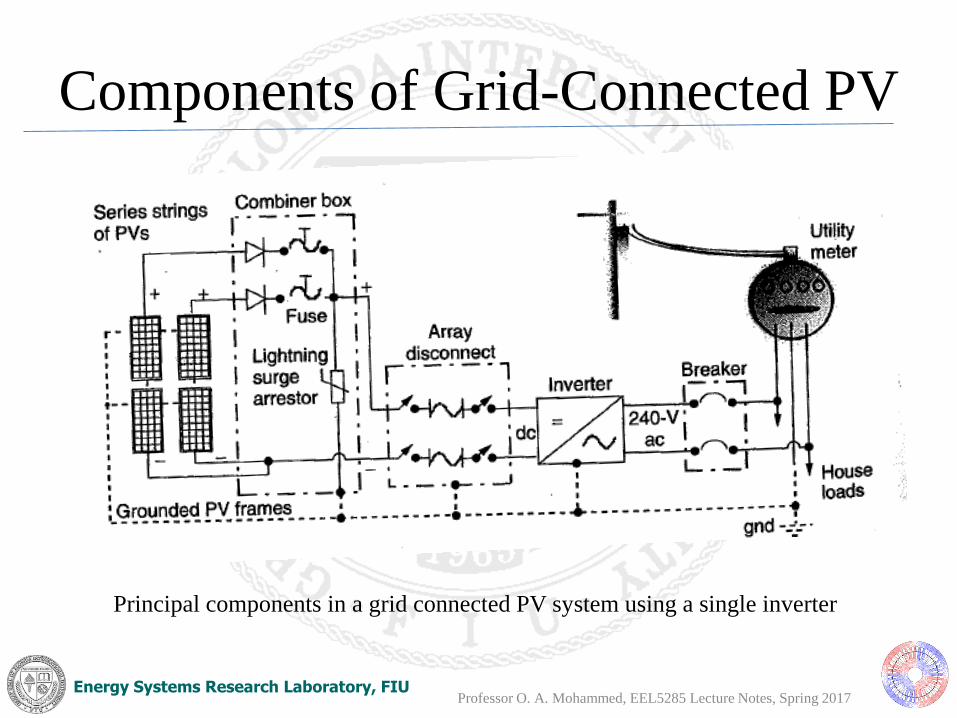
Components of Grid-Connected PV
Professor O. A. Mohammed, EEL5285 Lecture Notes, Spring 2017
Principal components in a grid connected PV system using a single inverter

Energy Systems Research Laboratory, FIU
Individual Inverter Concept
• Easily allow expansion
• Connections to house distribution panel are
simple
• Less need for expensive DC cabling
Professor O. A. Mohammed, EEL5285 Lecture Notes, Spring 2017

Energy Systems Research Laboratory, FIU
Interfacing with the Utility
• Net metering – customer only pays for the amount of
energy that the PV system is unable to supply
• In the event of an outage, the PV system must quickly
and automatically disconnect from the grid
• A battery backup system can
help provide power to the
system’s owners during an
outage
• Good grid-connect inverters
have efficiencies above 90%
http://www.pasolar.ncat.org/lesson05.php
Professor O. A. Mohammed, EEL5285 Lecture Notes, Spring 2017

Energy Systems Research Laboratory, FIU
Losses from Mismatched Modules
• Illustrates the impact of slight variations in module I-V curves
• Only 330 W is possible instead of 360 W
Professor O. A. Mohammed, EEL5285 Lecture Notes, Spring 2017

Energy Systems Research Laboratory, FIU
“Peak-Hours” Approach• 1-sun is 1 kW/m2
• We can say that 5.6 kWh/(m2-day) is 5.6 hours of “peak sun”
• PVUSA test conditions (PTC) – 1-sun, 20˚C ambient
temperature, wind-speed of 1 m/s
• Pac(PTC) = AC output of an array under PTC
• If we know Pac, computed for 1-sun, just multiply by hours
of peak sun to get kWh
• If we assume the average PV system efficiency over a day is
the same as the efficiency at 1-sun, then
Energy (kWh/day) kW h/day of "peak sun" (9.14)acP
Professor O. A. Mohammed, EEL5285 Lecture Notes, Spring 2017

Energy Systems Research Laboratory, FIU
Capacity Factor of PV
Energy kWh/yr kW CF 8760 h/yr (9.15)acP
h/day of "peak sun"CF (9.16)
24 h/day
Figure 9.28
PV Capacity
Factors for
US cities
Professor O. A. Mohammed, EEL5285 Lecture Notes, Spring 2017
Energy Systems Research Laboratory, FIU
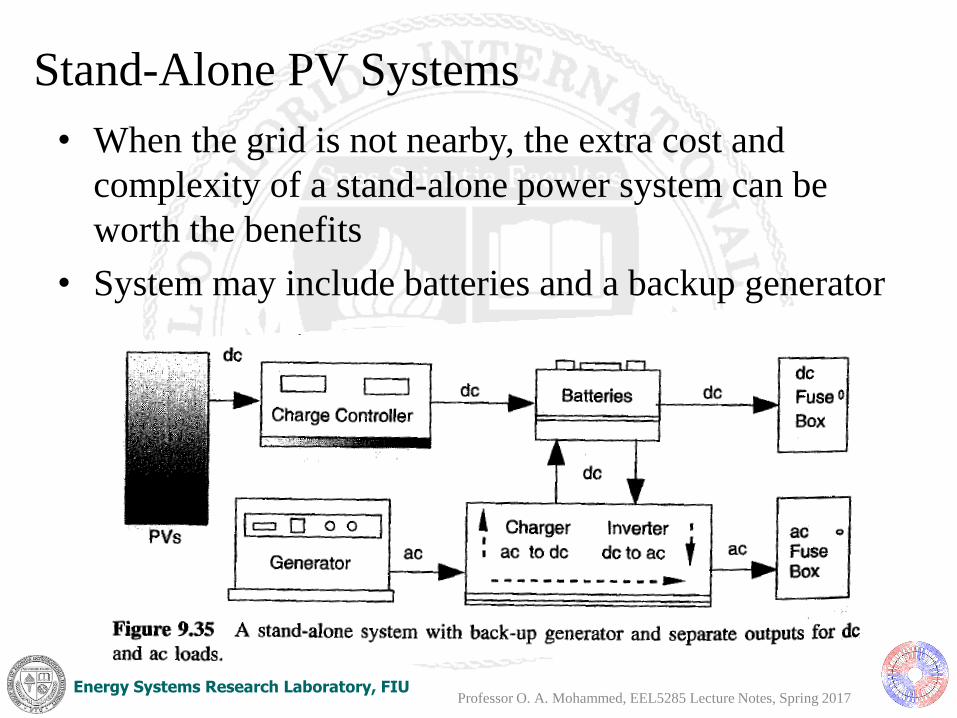
Stand-Alone PV Systems
• When the grid is not nearby, the extra cost and
complexity of a stand-alone power system can be
worth the benefits
• System may include batteries and a backup generator
Professor O. A. Mohammed, EEL5285 Lecture Notes, Spring 2017

Energy Systems Research Laboratory, FIU
Stand-Alone PV - Considerations
• PV System design begins with an estimate of the loads
that need to be served by the PV system
• Tradeoffs between more expensive, efficient
appliances and size of PVs and battery system needed
• Should you use more DC loads to avoid inverter
inefficiencies or use more AC loads for convenience?
• What fraction of the full load should the backup
generator supply?
• Power consumed while devices are off
• Inrush current used to start major appliances
Professor O. A. Mohammed, EEL5285 Lecture Notes, Spring 2017

Energy Systems Research Laboratory, FIU
Batteries and PV Systems• Batteries in PV systems provide storage, help meet
surge current requirements, and provide a constant
output voltage.
• Lots of interest in battery research, primarily driven by
the potential of pluggable hybrid electric vehicles
– $2.4 billion awarded in August 2009
• There are many different types of batteries, and which
one is best is very much dependent on the situation
– Cost, weight, number and depth of discharges, efficiency,
temperature performance, discharge rate, recharging rates
Professor O. A. Mohammed, EEL5285 Lecture Notes, Spring 2017

Energy Systems Research Laboratory, FIU
Battery I-V Curves
• Energy is stored in batteries for most off-grid
applications
• An ideal battery is a voltage source VB
• A real battery has internal resistance Ri
(9.4)B iV V R I
Professor O. A. Mohammed, EEL5285 Lecture Notes, Spring 2017

Energy Systems Research Laboratory, FIU
Battery I-V Curves
• Charging– I-V line tilts right with a slope of 1/Ri, applied
voltage must be greater than VB
• Discharging battery- I-V line tilts to the left with slope
1/Ri, terminal voltage is less than VB
Figure 9.12
Professor O. A. Mohammed, EEL5285 Lecture Notes, Spring 2017

Energy Systems Research Laboratory, FIU
Lead Acid Batteries• Most common battery for larger-scale storage
applications
• Invented in 1859
• There are three main types: 1) SLI (Starting, Lighting
and Ignition) : optimized for starting cars in which
they are practically always close to fully charged, 2)
golf cart : used for running golf carts with fuller
discharge, and 3) deep-cycle, allow much more
repeated charge/discharge such as in a solar
application
Professor O. A. Mohammed, EEL5285 Lecture Notes, Spring 2017

Energy Systems Research Laboratory, FIU
Basics of Lead-Acid Batteries
+ 2
2 4 4 2Positive Plate: PbO + 4H + SO + 2 PbSO 2H O (9.21)e
2
2 4 4Negative Plate: PbO + SO PbSO 2e (9.22)
Professor O. A. Mohammed, EEL5285 Lecture Notes, Spring 2017

Energy Systems Research Laboratory, FIU
Basics of Lead-Acid Batteries
• During discharge, voltage drops and specific gravity drop
• Sulfate adheres to the plates during discharge and comes back off
when charging, but some of it becomes permanently attached
Professor O. A. Mohammed, EEL5285 Lecture Notes, Spring 2017

Energy Systems Research Laboratory, FIU
Battery Storage• Battery capacity has tended to be specified in amp-
hours (Ah) as opposed to an energy value; multiply by
average voltage to get watt-hours
– Value tells how many amps battery can deliver over a
specified period of time.
– Amount of Ah a battery can delivery depends on its discharge
rate; slower is better
Figure shows
how capacity
degrades with
temperature
and rate
Professor O. A. Mohammed, EEL5285 Lecture Notes, Spring 2017
Energy Systems Research Laboratory, FIU
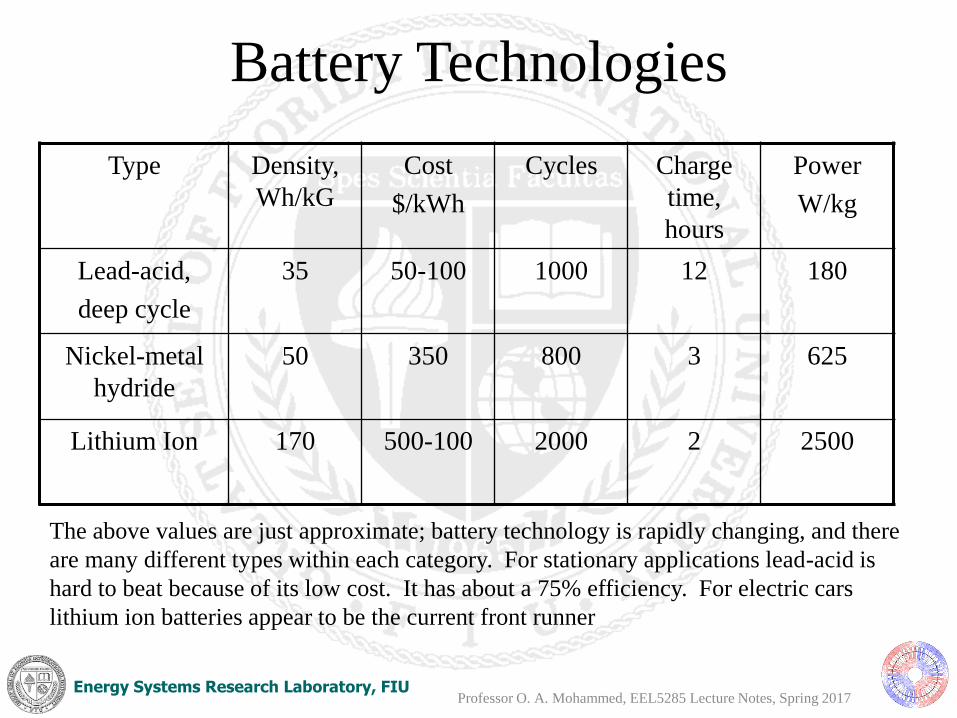
Battery Technologies
Type Density,
Wh/kG
Cost
$/kWh
Cycles Charge
time,
hours
Power
W/kg
Lead-acid,
deep cycle
35 50-100 1000 12 180
Nickel-metal
hydride
50 350 800 3 625
Lithium Ion 170 500-100 2000 2 2500
The above values are just approximate; battery technology is rapidly changing, and there
are many different types within each category. For stationary applications lead-acid is
hard to beat because of its low cost. It has about a 75% efficiency. For electric cars
lithium ion batteries appear to be the current front runner
Professor O. A. Mohammed, EEL5285 Lecture Notes, Spring 2017

Energy Systems Research Laboratory, FIU
Estimating Storage Needs
Professor O. A. Mohammed, EEL5285 Lecture Notes, Spring 2017

Energy Systems Research Laboratory, FIU
Stand-Alone PV Systems – Design Summary
• Battery Sizing – How many days of storage needed?
• Generator Sizing
• System Costs
http://www.ecosolarenergy.com.au/How_a_Standalone_System_Works-28.htm
Professor O. A. Mohammed, EEL5285 Lecture Notes, Spring 2017