Embed Size (px)
Citation preview

Puyallup Avenue Corridor Conceptual Design -Status Update-
Tacoma Transportation Commission August 16, 2017

About the Project
■ Concept design for improvements to Puyallup Avenue, S. C Street to Portland Avenue
■ Design will be used for future grant applications
2

Project Goals
3
Support multimodal uses and embrace complete street
concepts
Enhance the experience for
everyone, including pedestrians, cyclists, drivers, transit riders, and freight operators
Make Puyallup Avenue an inviting place
where people want to visit

Project Outreach
■ October ‘16 – Stakeholder Focus Groups (2) – In-Person Surveys (90 completed)
■ November ’16 – Online Survey & Mapping Tool (212 responses) – Stakeholder Design Charrette/Site Walk – Public Design Charrette
■ June ‘17 – Public Open House ■ June/July ‘17 – Collected online feedback on alternatives ■ Technical Advisory Meetings
– September ‘16 – November ‘16 – May ‘17
4

Project Outreach - Notifications
■ Tacoma News Tribune – Online and print ads (for Nov. & June events, each ran twice)
■ Banner on City Webpage (~10 days prior to each event) ■ City of Tacoma News Release (one prior to each event) ■ Promoted on ‘What’s Going On’ City webpage and ‘Tacoma Report’
news program ■ Email Blasts ■ Social Media – Issued 22 posts Oct. ’16 & July ’17
– Focused on Nov. 9 / June 5 events & June/July comment period – Facebook
• 14,153 total feeds (post for June 5th Open House – 2,500 feeds, event viewed/clicked-on 754 times, 54 RSVP’d interested in attending)
– Twitter • 27,055 total feeds • 441 liked/shared • 163 clicked on link
– Website – 1,476 unique/1,842 total views; Avg. time on page = 3min 13sec
5

Stakeholders/Businesses/Property Owners Puyallup Avenue ■ Diamond Parking ■ Rick/Jori Adkins (5
Properties/Businesses) ■ Alfred’s Café ■ 304 Puyallup Avenue ■ Wingman’s Brewers ■ Bulls Eye Indoor Range ■ Summit Olympus School ■ The Storage Box ■ Seasons Travel/Tacoma
Commercial Brokers ■ Architectural Woods ■ Industrial Tire ■ Tacoma Dome Neighborhood
Business District Members ■ BNSF Tacoma Dome Area ■ Western Builders Supply ■ Freighthouse Square ■ PJ Hummel and Company ■ SuperValu
■ Dome District Property Developers ■ Celebrity Cakes Trucking Community ■ Nichols Trucking ■ Caraustar Industrial ■ Life Express LLC ■ Truck Rail Handling ■ Tacoma Transload Trucking Agencies/Other ■ UWT ■ Puyallup Watershed Initiative ■ Foss Waterway Development
Authority ■ Port of Tacoma ■ Metro Parks ■ Tacoma Wheelman ■ Pierce Transit ■ Sound Transit ■ Downtown On The Go ■ FWDA ■ WSDOT Rail ■ Amtrak
6

What We Heard: Public Feedback
In terms of transportation, what would make Puyallup Avenue more attractive to you?
7

What We Heard: Stakeholder Feedback
■ Want Subarea Plan efforts to come to fruition
■ Need access to TDS ■ Parking is increasingly an issue ■ Must be be safer and more
comfortable for pedestrians, especially students
■ Doesn’t currently feel like a safe street to bike
■ Preserve the unique historic and industrial character
■ Acts as a gateway for people arriving in Tacoma by transit or for events
■ Make it feel like a place 8
Corridor Alternatives
Sampling of Applicable Plans (See Ch. 2, Tech Memo #1) • One Tacoma Comprehensive Plan / Transportation Master Plan • South Downtown Subarea Plan • Tahoma to Tacoma Trail Network Report • Mixed Use Centers Complete Street Guidelines • Right-of-Way Design Manual • Regional Transit Long-Range Plan, Sound Transit • Sounder Station Access Study
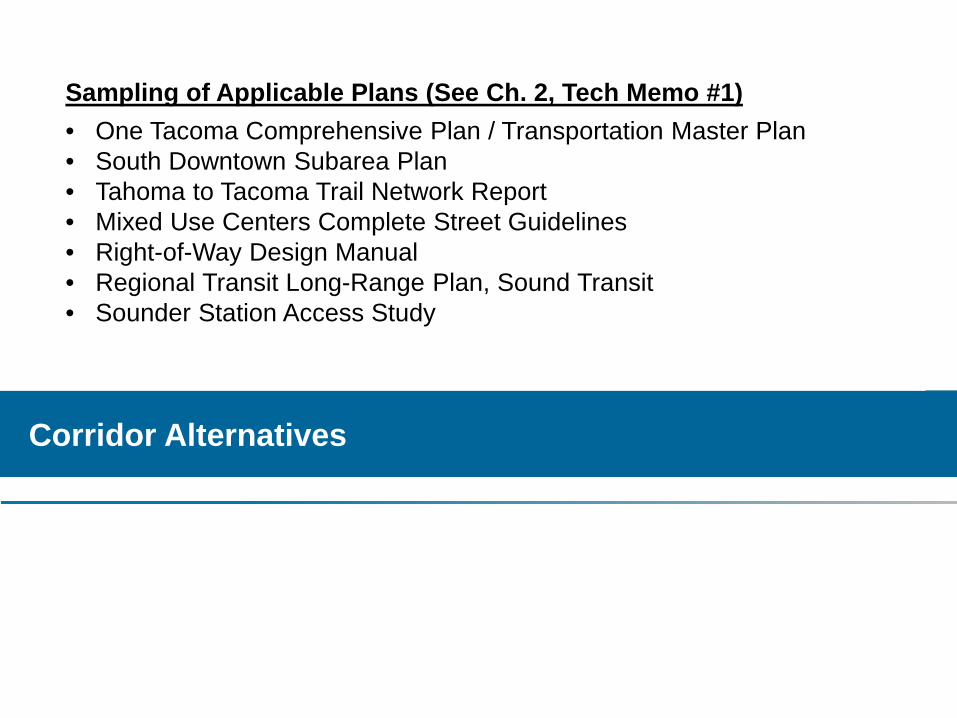
Alternative 1: Bike Path, Transit/HOV Lane, 2 General Purpose Lanes + Center Turn Lane
10
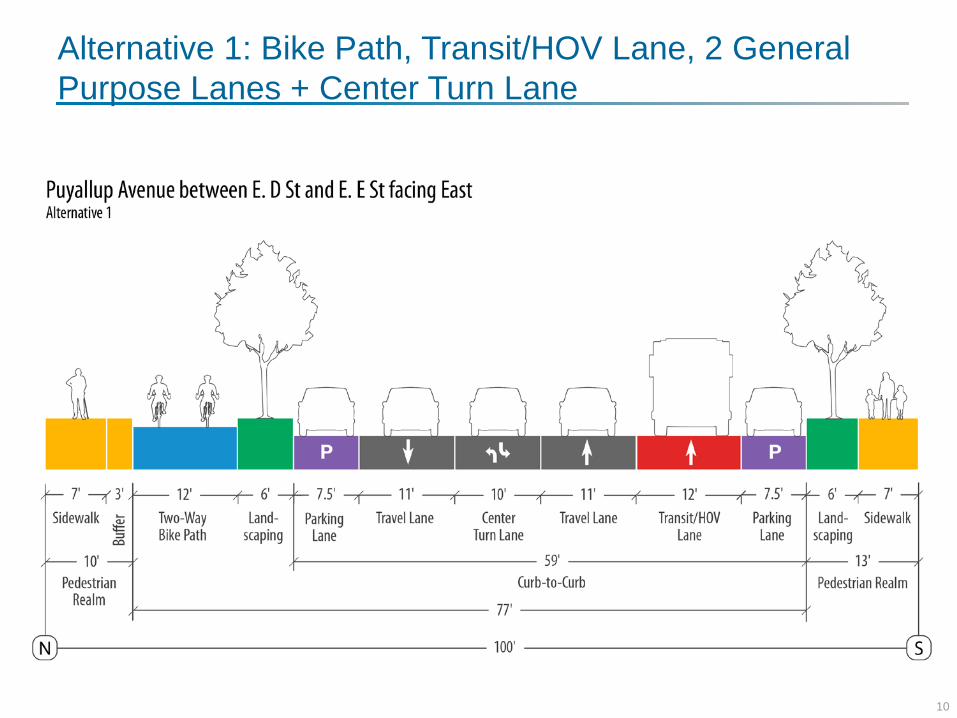
Alternative 1: Bike Path, Transit/HOV Lane, 2 General Purpose Lanes + Center Turn Lane
Plan View at L Street
11
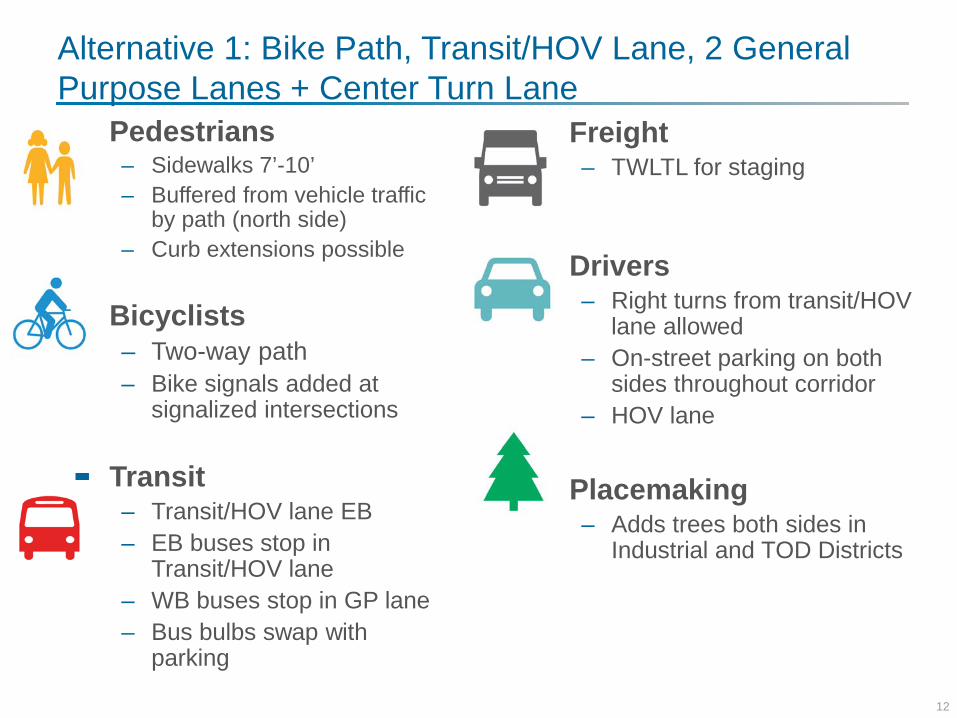
Alternative 1: Bike Path, Transit/HOV Lane, 2 General Purpose Lanes + Center Turn Lane ■ Pedestrians
– Sidewalks 7’-10’ – Buffered from vehicle traffic
by path (north side) – Curb extensions possible
■ Bicyclists
– Two-way path – Bike signals added at
signalized intersections
■ Transit – Transit/HOV lane EB – EB buses stop in
Transit/HOV lane – WB buses stop in GP lane – Bus bulbs swap with
parking
■ Freight – TWLTL for staging
■ Drivers – Right turns from transit/HOV
lane allowed – On-street parking on both
sides throughout corridor – HOV lane
■ Placemaking
– Adds trees both sides in Industrial and TOD Districts
12
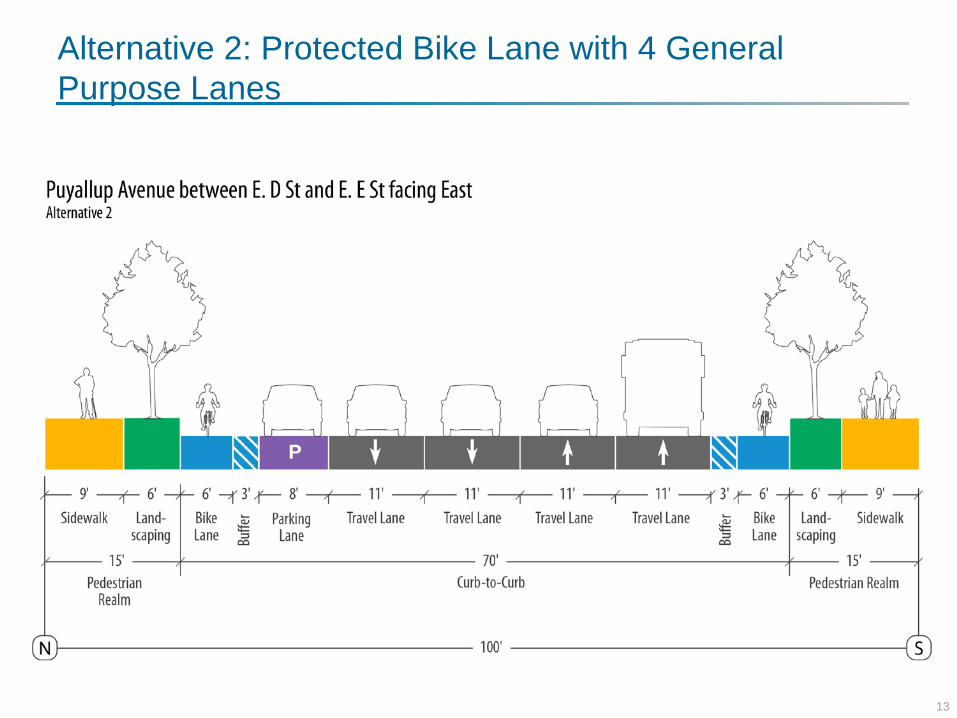
Alternative 2: Protected Bike Lane with 4 General Purpose Lanes
13

Alternative 2: Protected Bike Lane with 4 General Purpose Lanes
Plan View at E. D Street
14

Alternative 2: Protected Bike Lane with 4 General Purpose Lanes
■ Pedestrians – Sidewalks 6’-10’
■ Bicyclists
– Protected bicycle lane against curb
■ Transit
– Buses stop in GP lane (drivers go around)
– Bus stops swap for parking
– At D Street, bikes route through 6’ landscaping area to get around bus stop
■ Freight – No TWLTL – Fewer left turn pockets
■ Drivers
– 4 travel lanes – No TWLTL – Fewer left-turn pockets – Parking on both sides,
except in TOD District
■ Placemaking – Trees added in TOD District,
both sides
15

Alternative 3: Buffered Bike Lanes with Two General Purpose Lanes + Center Turn Lane
16

Alternative 3: Buffered Bike Lanes with Two General Purpose Lanes + Center Turn Lane
Plan View at E. E Street
17

Alternative 3: Buffered Bike Lanes with Two General Purpose Lanes + Center Turn Lane
■ Pedestrians – Sidewalks 9’-10’ – Buffered from vehicle
traffic by trees in Industrial and TOD Districts
■ Bicyclists
– Buffered bike lanes next to parking
■ Transit
– Buses stop in GP lane – Bus bulbs swap for bike
lane – Bikes routed through
parking lane
■ Freight – TWLTL provided
■ Drivers – One lane per direction – On-street parking both sides
for entire corridor
■ Placemaking – Trees added on both sides
of street in Industrial and TOD Districts
18

■ Ease of Crossing/Access to transit ■ Bicycle Accommodation ■ Pedestrian Comfort ■ Freight Access ■ Transit Reliability ■ Travel Speeds ■ Neighborhood Development Support ■ Placemaking and Landscaping
Opportunities
Alternative Evaluation - Measures of Effectiveness
19

Next Steps
Current ■ Complete Alternative Evaluation ■ Compile Open House Public Comment ■ Develop Hybrid Alternative ■ Issue Final Tech Memo Future ■ Apply for Design Grants ■ Review Hybrid Alternative with Public ■ PE: Design/ROW/Permitting
20

NELSON\NYGAARD CONSULTING ASSOCIATES © 2017
Mark D’Andrea (253) 591-5518
Jennifer Wieland (206) 576-3938
Thank You!

Tacoma Mall Neighborhood Subarea Plan & EIS Transportation Commission August 16, 2017
1

Meeting objectives • Invite comments from the Commission • Review key transportation actions • Next steps
• Public outreach – August/September • Planning Comm. recommendation – October • Council action – November/December
2

Project Area
3

Vision 2040

Showing our work
PUBLIC ENGAGEMENT: • Public kickoff meeting • EIS scoping meetings • TPCHD focus groups • Stakeholder interviews • Tours • Design workshop • Public scoping meetings • Stakeholder working group • Business community engagement • Informational briefings • Planning Commission • City Council
5
TECHNICAL DOCUMENTS: • Neighborhood Livability Needs
Assessment • EIS Determination of Significance • EIS Scoping Summary • Existing Conditions Analysis • Design Workshop Summary Report • Infiltration Study • Traffic analysis • Multifamily and Mixed-Use
Development Feasibility Analysis • Commercial Actions Case Study

Establishing the vision
7
PROPOSED VISION:
By 2040 the Tacoma Mall Neighborhood will be a thriving center of regional significance and a distinctive, connected, livable and healthy place with a wide range of opportunities for all people to live, work, invest and fulfill their potential.

Moving toward the vision
8
Medium-term Vision Long-term Vision

Transportation Issues
9

10
11
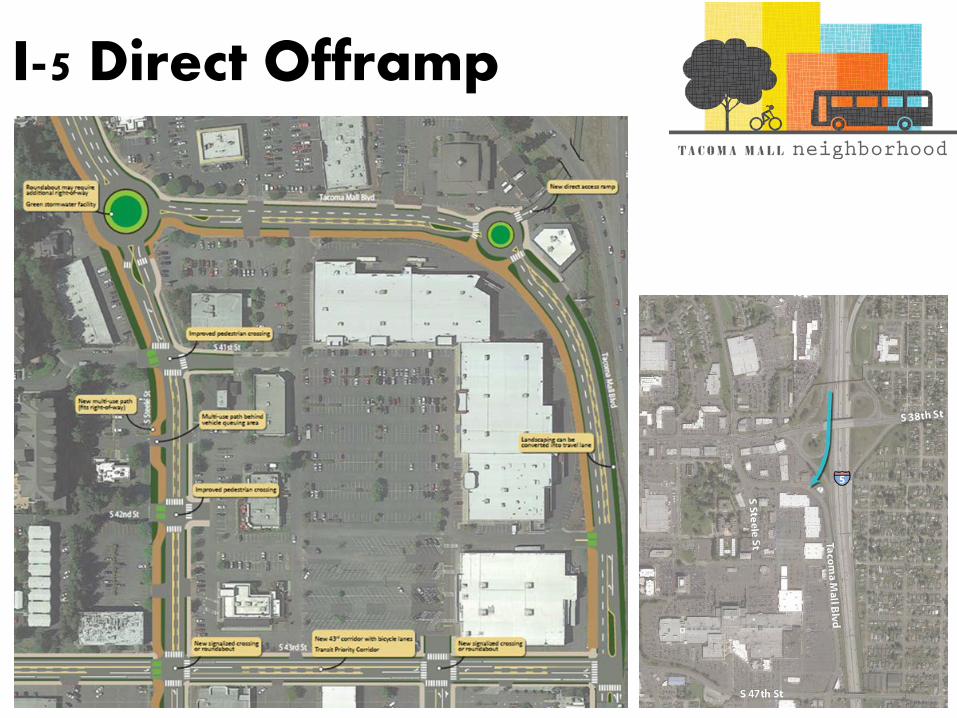
I-5 Direct Offramp
12

Transit
13
• Plan for high capacity transit • Connect to City & region • Consolidated transit hub • Improve service • Transit-oriented development

Bikes and Pedestrians
• Complete Streets • Loop Road • Water Flume Trail • Bike Priority Network • Pedestrian Links
14

• Green Streets will provide multiple benefits
Green Stormwater Strategies
15

Loop Road
16
• Internal pedestrian connector
• Supports mode shift • Connects parks and
open spaces

Proposed Transportation Projects
17 0-5 Years 5-15 Years 15+ Years All Projects

Existing Streets
• Large blocks • Traffic channeled to
arterials • Auto-oriented
development
18

Street Network & Connectivity • Connectivity principles:
– New connections with major redevelopment
• Street network tiers • Regulatory approach • City leadership
19

Market study
• How will proposals affect property value?
• Case study approach • Assess subarea plan proposals
– Permit streamlining – Near, mid and long-term transportation
projects – Connectivity requirement – New funding sources
20

Implementation
21
• Integrating Subarea Plan with TMP • Funding recommendations • Pursue priority projects • Partnership opportunities

How to provide input
• Input to the Planning Commission
• Meetings Aug 28th BPTAG Aug 30th Informational Meeting Sept 6th Public Hearing Sept 13th Council IPS Committee tour ADDITIONAL MEETINGS BEING SCHEDULED
22

PERFORMANCE MEASUREMENT & PROJECT PRIORITIZATION As described in the goals and policies section, the system completeness LOS standard enforces the build out of Tacoma’s transportation system concurrent with development; however, prioritizing which projects to include in the city’s 25-year project list will require a careful balance of many considerations, including: • Multimodal System: safe and welcoming travel by all modes • Equity: an equitablemultimodal system both geographically and in its treatment of modes, with special attention that prioritizes given to areas historically underserved communitiesimprovements in low-income communities with the highest need • Safety: safe travel • Health/Environment: physical health of users and environmental protection • System Preservation: preserving existing transportation assets • Financial Stewardship: effective leveraging and expenditure of funds • Congestion: managing congestion on critical corridors
Evaluating projects according to their contributions to each of these seven city priorities should guide project prioritization and regular transportation system performance monitoring. Each city goal has specific measures that help quantify priorities and track progress over time. The City of Tacoma currently tracks some of these performance measures while others will require initial benchmarking and repeated data collection in the future. The table Targets and Actions on the next page presents the components of Tacoma’s biannual transportation report card. Some of these measures may fluctuate over time rather than changing steadily so the City will have to track overall trends as it collects more data points over multiple bienniums.

TARGETS Multimodal System (Mode Split and Investment per Mode) MS1: Decrease single occupancy vehicle trips citywide by 22% of 2015 levels (American Community Survey).
MS2: Decrease single occupancy vehicle trips in Downtown Tacoma Regional Growth Center by 35% of 2015 levels (Puget Sound Regional Council).
MS3: Increase the number of employers participating in the Commute Trip Reduction program by 25% of 2015 levels.
MS4: Upgrade status from League of American Bicyclists to Gold status by 2040.
MS5: Attain Silver status from Walk Friendly Communities by 2040.
Equity (Investment per Community and Investment per Mode) E1: Complete 50% of Transportation Master Plan Tier 1 projects in areas with 25% or greater minority, according to WSDOT Application for Local Planning and Community Accessibility (ALPACA) survey by 2040.
E2: Complete 50% of Transportation Master Plan Tier 1 projects in areas with 25% or greater poverty, according to WSDOT Application for Local Planning and Community Accessibility (ALPACA) survey by 2040.
E3: Complete 100% of Transportation Master Plan Tier 1 projects by 2040.
2015
2030
2015
2030
2015
2040
2015
2040
2017
2040
2015
2040
2015
2040
2015
2040
2016: 84%
: 55%
: 77%
: 25
: 31
: Bronze
: Gold
: 0
: TBD
2016: 26
2016: Bronze
2016: TBD
2016: TBD : 77%
: 42%
: 0
:TBD
2016: TBD
: New
: Silver
2016: New
: 0
:100%
2016: TBD

Safe Travel for All People/Modes (Crash Reduction) ST1: Reduce bicycle & pedestrian fatalities by 100%.
ST2: Reduce bicycle and pedestrian youth (18 years of age and under) collisions by 100% of 2015 collisions.
Health/Environment (Physical Activity and Air Quality) HE1: Increase miles of bicycle infrastructure by 65% of 2015 miles.
HE2: Increase miles of missing link sidewalks installed by 15% of 2015 levels.
HE3: Decrease transportation fossil fuel use by 30% of 2014 levels.
System Preservation (Pavement Quality and Streetlights) SP1: Increase Tacoma’s Overall Pavement Condition Index (PCI) from 59 (Marginal) to 70 (Good) by 2040.
SP2: Increase percentage of replaced and maintained reported streetlight infrastructure each year.
2015: 6 fatalities
2040: 0 fatalities
2015: 28 collisions
2040: 0 collisions
2015
2040
2015
2040
2014
2040
2015
2040
2015
2040
2016: PCI 59 : PCI 59
: PCI 70
: 84% per year
: 90% per year
: 1.67 mil galTBD
: 1.9 mil galTBD 2016: 8 fatalities
2016: TBD
2016: 1.99 mil l
2016: 70% per year
: 61 miles
: 105 miles
: 382 miles
: 440 miles
2016: 62.1 miles
2016: TBD

Financial Stewardship (Maintenance Funding and Leveraging of Funds) FS1: Increase non-Public Works dollars leveraged for capital project delivery.
FS2: Complete residential maintenance of 5,614 blocks as identified in the Streets Initiative Report.
Congestion (Vehicle Delay) C1: Increase signal timing optimization performance by evaluating and implementing field improvements by 100%for all signals of 2015 levelsby 2040.
2015
2040
2015
2026
2015
2040
: 2%
: 100%
: TBD
: TBD
2016: TBD
2016: TBD
: 0 blocks
: 5,614 blocks
2016: 295 blocks

ACTIONS
ACTION PROGRESS
RATING (1-5)
2016 STATUS
TMP1 Advocate for dollars spent on active transportation projects.
2 The Transportation Commission oversees the Tacoma Streets Initiative capital funds to ensure projects meet the goals of the TMP, specifically for active transportation.
TMP2 Establish dedicated and stable funding for active transportation education, encouragement, safety programs, and infrastructure improvements.
3 Through the Tacoma Streets Initiative, $2.5 million/year is dedicated to active transportation.
TMP3
Synchronize and recalibrate the timing of traffic signals on all Tacoma arterials. Repair, improve, or upgrade infrastructure as needed to maximize signal efficiency.
2 Acquired grant funding to synchronize ~10% of the City's traffic signals. Have acquired no dedicated funding for infrastructure specific to traffic signal efficiency upgrades.
TMP4
Become a Bicycle Friendly Silver Community by implementing the next 5 prioritized Mobility Master Plan roadway projects and next 32 trail projects.
2 Grant funding received to implement several Mobility Master Plan projects in 2018.
TMP5
Identify infrastructure needs at school via community meetings and/or walking audits.
1 The Safe Routes to School (SRTS) Implementation Plan will be finalized in August 2017. Lister ES and First Creek MS will conduct walking audits in Fall 2018 as part of the SRTS grants received. Two additional schools will be reviewed as part of the $500k allocation in the 2017-2018 Biennial Budget.
TMP6 Develop and implement a project-based curriculum for teachers to integrate active transportation into lessons
1 The City was not awarded a Washington Traffic Safety Commission grant to work with elementary and middle school teachers on developing a curriculum.
TMP7
Develop sidewalk, curb ramp and crosswalk inventories to prioritize future investments, as part of a Pedestrian Mobility Strategy.
2 Draft sidewalk inventory data completed June 2017. Public Works partnered with UWT to develop an app allowing City inspectors to inventory and provide conditions on curb ramps. Over 20 locations were inventoried in the pilot program.
TMP8 Develop Subarea Plans for all Mixed-Use zones and ensure that 20-Minute neighborhoods, bicycle access and transit access are priorities.
TBD The Tacoma Mall Subarea Plan is currently being developed and adoption is anticipated by the end of 2017.
TMP9 Support fulfillment of pothole requests submitted through
TBD TBD

Tacoma311 within seven business days.
TMP10 Track completion of projects in the Transportation Master Plan Project Detail List.
TBD Capital projects pursuing grant funding are vetted against the Transportation Master Plan Project Detail List and the Transportation Master Plan’s goals for compliance.
TMP11 Track miles of vehicular and bicycle lanes restriped.
3 The City restriped half of arterial lanes in Tacoma. Actual number of lanes to be determined.
1: None 2: Little Progress 3: Some Progress 4: Good Progress 5: Completed

DRAFT PERFORMANCE MEASURES STATUS
Page 1 of 3
IDBig Picture Topical
AreasPERFORMANCE
MEASURESMEASURES OF SUCCESS DATA SOURCE ACTIONS RECOMMENDATION
1 Multimodal System
Mode split Decrease in SOV mode share PSRC: RGCs andMICs Work TripMode Shares
Monitor PSRC dataevery five yearsor as updates areavailable
Convert to TARGET MS2 and make consistent with Page 123 Existing and Recommended Commute Trip Mode Splits.
2 AmericanCommunity Survey:Citywide CommuteMode Shares
Monitor ACS dataevery five years ormore frequently ifdesired
Convert to TARGET MS1 and make consistent with Page 123 Existing and Recommended Commute Trip Mode Splits.
3 PSRC HouseholdTravel Survey: AllTrips
Monitor PSRC dataevery 7-8 yearsor as updates areavailable
Remove Action - Measurement is consistentwith new TARGET MS1 and MS2.
4 VMT Decrease in VMT per capita WSDOT HighwayPerformanceMonitoring System(HPMS) or establishcity survey
Monitor WSDOTdata every twoyears
Remove - VMT data is reliant on traffic model update and maintenance, which is not programmed at this time.
5 CTR / TMAParticipation
Participation Growth in number of participants
WSDOT, PierceTrips, Downtown:On the Go!, otherTMAs
Monitor everytwo years
Convert to TARGET MS3, which is consistent with Environmental Action Plan (EAP)
6 Bicycle FriendlyCommunity Status
Upgrade in status fromLeague of American Bicyclists
League ofAmerican Bicyclists
Monitor everytwo years
Convert to TARGET MS4, which is consistent with Environmental Action Plan (EAP)
7 Equity Investment percommunity
Percent of need met within1/4 mile of disadvantagedcommunities, such as thosewith low income or manyzero-car households
City / Census data Monitor everytwo years
Convert to TARGET E1 and modify to track increase in the number of projects complete in areas with 25% or greater poverty or minority (as designated in WSDOT ALPACA)
8 Percent of need met perNeighborhood Council District
City Monitor everytwo years
Remove - The focus of equity in the City has shifted to income and race, not geographical. The introductory statement describing equity will need to be amended.
9 Investment permode
Dollars spent per mode peryear
City Monitor everytwo years
Convert to Action TMP1. Staff is proposing to track dollars spent on active transportation projects in areas with 25% of greater poverty as tracked through WSDOT's Application for Local Planning and Community Accessibility (ALPACA) tool.
10 Percent of modal prioritynetwork built
City Monitor everytwo years
Conver to TARGET E2 and modify to focus on the number of projects built in areas of 25% or greater poverty and minority (as designated in WSDOT ALPACA)
11 Miles of facilities built per year City Monitor everytwo years
Convert to TARGET HE1 and HE2 for miles of sidewalk and miles of bicycle facilities built.
DRAFT PERFORMANCE MEASURES STATUS
Page 2 of 3
IDBig Picture Topical
AreasPERFORMANCE
MEASURESMEASURES OF SUCCESS DATA SOURCE ACTIONS RECOMMENDATION
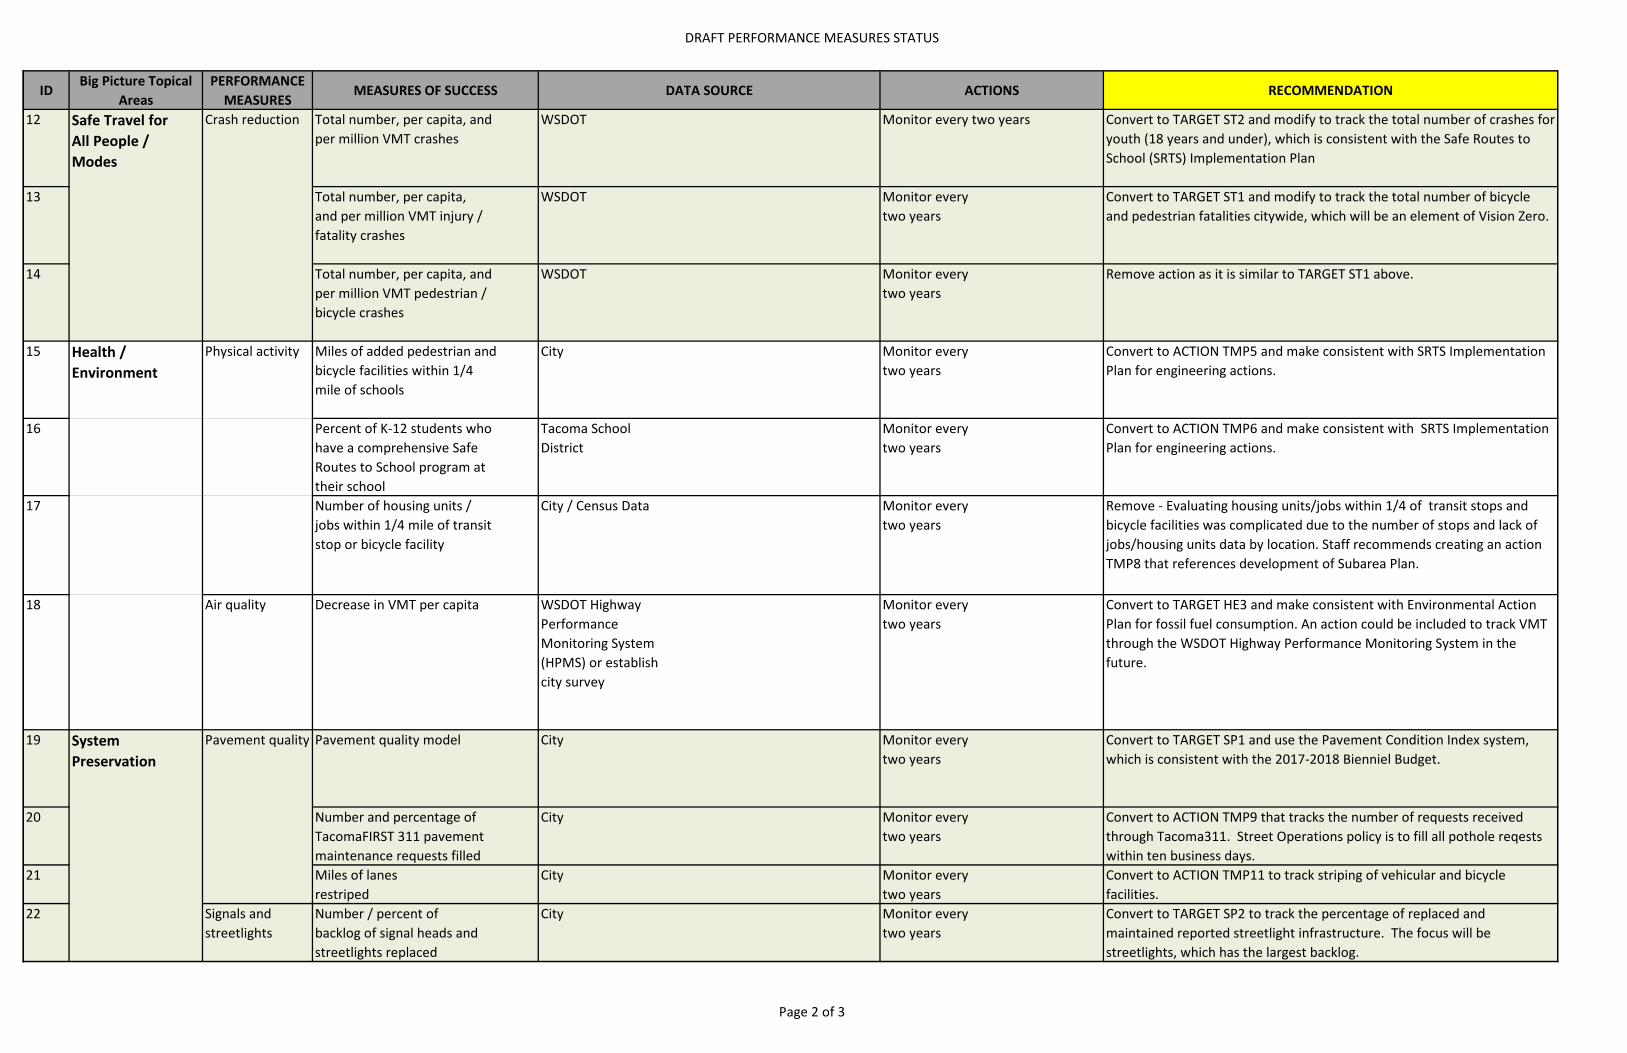
12 Safe Travel forAll People /Modes
Crash reduction Total number, per capita, andper million VMT crashes
WSDOT Monitor every two years Convert to TARGET ST2 and modify to track the total number of crashes for youth (18 years and under), which is consistent with the Safe Routes to School (SRTS) Implementation Plan
13 Total number, per capita,and per million VMT injury /fatality crashes
WSDOT Monitor everytwo years
Convert to TARGET ST1 and modify to track the total number of bicycle and pedestrian fatalities citywide, which will be an element of Vision Zero.
14 Total number, per capita, andper million VMT pedestrian /bicycle crashes
WSDOT Monitor everytwo years
Remove action as it is similar to TARGET ST1 above.
15 Health /Environment
Physical activity Miles of added pedestrian andbicycle facilities within 1/4mile of schools
City Monitor everytwo years
Convert to ACTION TMP5 and make consistent with SRTS Implementation Plan for engineering actions.
16 Percent of K-12 students whohave a comprehensive SafeRoutes to School program attheir school
Tacoma SchoolDistrict
Monitor everytwo years
Convert to ACTION TMP6 and make consistent with SRTS Implementation Plan for engineering actions.
17 Number of housing units /jobs within 1/4 mile of transitstop or bicycle facility
City / Census Data Monitor everytwo years
Remove - Evaluating housing units/jobs within 1/4 of transit stops and bicycle facilities was complicated due to the number of stops and lack of jobs/housing units data by location. Staff recommends creating an action TMP8 that references development of Subarea Plan.
18 Air quality Decrease in VMT per capita WSDOT HighwayPerformanceMonitoring System(HPMS) or establishcity survey
Monitor everytwo years
Convert to TARGET HE3 and make consistent with Environmental Action Plan for fossil fuel consumption. An action could be included to track VMT through the WSDOT Highway Performance Monitoring System in the future.
19 SystemPreservation
Pavement quality Pavement quality model City Monitor everytwo years
Convert to TARGET SP1 and use the Pavement Condition Index system, which is consistent with the 2017-2018 Bienniel Budget.
20 Number and percentage ofTacomaFIRST 311 pavementmaintenance requests filled
City Monitor everytwo years
Convert to ACTION TMP9 that tracks the number of requests received through Tacoma311. Street Operations policy is to fill all pothole reqests within ten business days.
21 Miles of lanes restriped
City Monitor everytwo years
Convert to ACTION TMP11 to track striping of vehicular and bicycle facilities.
22 Signals andstreetlights
Number / percent ofbacklog of signal heads andstreetlights replaced
City Monitor everytwo years
Convert to TARGET SP2 to track the percentage of replaced and maintained reported streetlight infrastructure. The focus will be streetlights, which has the largest backlog.

DRAFT PERFORMANCE MEASURES STATUS
Page 3 of 3
IDBig Picture Topical
AreasPERFORMANCE
MEASURESMEASURES OF SUCCESS DATA SOURCE ACTIONS RECOMMENDATION
23 FinancialStewardship
Maintenancefunding
Percent of investments /dollars spent on maintenanceprojects
City Monitor everytwo years
Remove action - TARGETS and ACTIONS TMP9, SP1, and SP2 are measures of maintenance operations.
24 Reduction in maintenancebacklog
City Monitor everytwo years
Convert to TARGET FS2 to track progress of Street Iniative funds and ensure consistency with proposition intent/information.
25 Leveragingadditional funds
Non-city dollars leveraged forproject delivery
City Monitor everytwo years
Convert to TARGET FS1.
26 Number of constructedprojects that were on otherCapital Facilities Plan lists
City Monitor everytwo years
Convert to ACTION TMP10 and modify to completion of projects in the TMP Project List.
27 Congestion Vehicle delay Limited increase in congestionon key routes for vehicularmobility
City Monitor everytwo years
Convert to TARGET C1 and modify to track signal timing optimization to reduce delay time and improve corridor efficiency.
28 Move people andgoods
Increase in number of peopleand / or volume of goodsmoving through arterials
City Monitor everytwo years
Remove action as it conflicts with multimodal targets. TARGET C1 appears to meet the intent of reducing delays.