Embed Size (px)
Citation preview

Putting CO2 to Use
September 2019
Creating value from emissions

Putting CO2 to Use: Creating Value from Emissions Abstract
PAGE | 1
IEA
. All
right
s re
serv
ed.
Abstract
New opportunities to use carbon dioxide (CO2) in the development of products and services are capturing the attention of governments, industry and the investment community. Climate change mitigation is the primary driver for this increased interest, but other factors include technology leadership and supporting a circular economy. This analysis considers the near-term market potential for five key categories of CO2-derived products and services: fuels, chemicals, building materials from minerals, building materials from waste, and CO2 use to enhance the yields of biological processes.
While some technologies are still at an early stage of development, all five categories could individually be scaled-up to a market size of at least 10 MtCO2/yr – almost as much as the current CO2 demand for food and beverages – but most face commercial and regulatory barriers. CO2 use can support climate goals where the application is scalable, uses low-carbon energy and displaces a product with higher life-cycle emissions. Some CO2-derived products also involve permanent carbon retention, in particular building materials. A better understanding and improved methodology to quantify the life-cycle climate benefits of CO2 use applications are needed.
The market for CO2 use is expected to remain relatively small in the short term, but early opportunities could be developed, especially those related to building materials. Public procurement of low-carbon products can help to create an early market for CO2-derived products and assist in the development of technical standards. In the long term, CO2 sourced from biomass or the air could play a key role in a net-zero CO2 emission economy, including as a carbon source for aviation fuels and chemicals.

Putting CO2 to Use: Creating Value from Emissions Highlights
PAGE | 2
IEA
. All
right
s re
serv
ed.
Highlights
• New pathways to use CO2 in the production of fuels, chemicals and building materials aregenerating global interest. This interest is reflected in increasing support from governments,industry and investors, with global private funding for CO2 use start-ups reaching nearlyUSD 1 billion over the last decade.
• The market for CO2 use will likely remain relatively small in the short term, but earlyopportunities can be cultivated. The use of CO2 in building materials is one such opportunity,but may require further trials and updating of standards for some products. Public procurementof low-carbon products could help to create early markets for CO2-derived products withverifiable climate benefits.
• CO2 use has potential to support climate goals, but robust life-cycle assessment is essential.CO2 use applications can deliver climate benefits where the application is scalable, uses low-carbon energy and displaces a product with higher life-cycle emissions. Quantification of thesebenefits can be challenging and improved methodologies are needed to inform future policyand investment decisions.
• CO2 could be an important raw material for products that require carbon. Some chemicalsrequire carbon to provide their structure and properties while carbon-based fuels may continueto be needed where direct use of electricity or hydrogen is challenging (for example, in aviation).In the transition to a net-zero CO2 emission economy, the CO2 would increasingly have to besourced from biomass or the air.

Putting CO2 to Use: Creating Value from Emissions Executive summary
PAGE | 3
IEA
. All
right
s re
serv
ed.
Executive summary
CO2 is a valuable commodity Globally, some 230 million tonnes (Mt) of carbon dioxide (CO2) are used every year. The largest consumer is the fertiliser industry, where 130 Mt CO2 is used in urea manufacturing, followed by oil and gas, with a consumption of 70 to 80 Mt CO2 for enhanced oil recovery. Other commercial applications include food and beverage production, metal fabrication, cooling, fire suppression and stimulating plant growth in greenhouses. Most commercial applications today involve direct use of CO2.
New pathways involve transforming CO2 into fuels, chemicals and building materials. These chemical and biological conversion processes are attracting increasing interest from governments, industry and investors, but most are still in their infancy and face commercial and regulatory challenges.
The production of CO2-based fuels and chemicals is energy-intensive and requires large amounts of hydrogen. The carbon in CO2 enables the conversion of hydrogen into a fuel that is easier to handle and use, for example as an aviation fuel. CO2 can also replace fossil fuels as a raw material in chemicals and polymers. Less energy-intensive pathways include reacting CO2 with minerals or waste streams, such as iron slag, to form carbonates for building materials.
Early markets are emerging but the future scale of CO2 use is uncertain
The future market potential for CO2-derived products and services is difficult to assess. The early stage of technology development and anticipated reliance on policy frameworks for most applications makes estimating the future market very challenging. Theoretically, some CO2 use applications, such as fuels and chemicals, could grow to scales of multiple billions of tonnes of CO2 use per year, but in practice would compete with direct use of low-carbon hydrogen or electricity, which would be more cost effective in most applications.
The barriers to near-term scale up of CO2 use are commercial and regulatory rather than technological. This analysis considers the near-term potential for increasing the market to at least 10 Mt CO2 use per year for each of the five categories of CO2-derived products and services: fuels, chemicals, building materials from minerals, building materials from waste and CO2 use to promote plant growth. This level of CO2 use would be almost as much as the current CO2 demand for food and beverages.
For CO2-based fuels and chemicals, production costs are currently several times higher than for their conventionally-produced counterparts. This is mainly due to the costs associated with hydrogen production. Commercial production is possible in markets where both cheap renewable energy and CO2 are available, such as in Chile or Iceland. CO2-derived polymers could be produced at lower cost than their fossil counterparts, but the market is relatively small.
Building materials produced from CO2 and minerals or waste can be competitive today. Early markets for CO2 use in concrete manufacturing are emerging, with CO2-cured concrete delivering lower costs and improved performance compared to conventionally-produced concrete. The production of building materials from waste and CO2 can also be competitive

Putting CO2 to Use: Creating Value from Emissions Executive summary
PAGE | 4
IEA
. All
right
s re
serv
ed.
as it avoids the cost associated with conventional waste disposal. The CO2 used in building materials is permanently stored in the product, with additional climate benefits derived from lower cement input in the case of CO2-cured concrete. For some concrete products, trials and updating of product standards may be required to support broader deployment.
Using CO2 can support climate goals, but with caveats CO2 used is not the same as CO2 avoided. CO2 use does not necessarily reduce emissions and quantifying climate benefits is complex, requiring a comprehensive life-cycle assessment as well as understanding of market dynamics. CO2 use can provide climate benefits where the application is scalable, uses low-carbon energy, and displaces a product with higher life-cycle emissions. Longer term, in a net-zero CO2 emission energy system, the CO2 would have to be sourced from biomass or the air to achieve climate benefits. CO2-derived products that involve permanent carbon retention, such as building materials, can offer larger emissions reductions than products that ultimately release CO2 to the atmosphere, such as fuels and chemicals.
Improved understanding and quantification of CO2 use applications and their emission reduction potential is required. To inform future policy and investment decisions, there is a need for robust life-cycle analyses based on clear methodological guidelines and transparent datasets. In recent years, several expert groups have started to develop such guidelines; however, it remains challenging due to the early stage of development of many CO2 use technologies.
CO2 use is a complement, not an alternative, to CO2 storage for large-scale emissions reductions. CO2 use is not expected to deliver emissions reductions on the same scale as carbon capture and storage (CCS), but can play a role in meeting climate goals as part of an “all technologies” approach. In International Energy Agency (IEA) scenario analysis with limited deployment of CO2 storage, CO2 use within the energy system increases (including for the production of methanol and synthetic hydrocarbon fuels) but delivers less than 13% of the emissions reductions that would otherwise be provided from CO2 storage. The potential for negative emissions from CO2 use is also very limited.
Cultivating early opportunities while planning for the long term The future prospects for CO2 use will largely be determined by policy support. Many CO2 use technologies will only be competitive with conventional processes where their mitigation potential is recognised in climate policy frameworks or where incentives for lower-carbon products are available. Public procurement can be an effective strategy to create an early market for CO2-derived products with verifiable climate benefits, and can assist in the development of technical standards.
The market for CO2 use is expected to be relatively small in the short term, but early opportunities can be developed. These early opportunities include building materials, but in some cases also polymers and industrial CO2 use in greenhouses. Industrial areas where low-cost raw materials, low-carbon energy and consumers are located together, and where existing CO2 pipelines can be used to advantage, can provide early deployment opportunities.
Further research, development and demonstration (RD&D) is needed. This is particularly for applications that can contribute to a future net-zero CO2 emission economy, including chemicals and aviation fuels derived from biogenic or atmospheric CO2. This should be in conjunction with RD&D for low-carbon hydrogen production.

Putting CO2 to Use: Creating Value from Emissions Findings and recommendations
PAGE | 5
IEA
. All
right
s re
serv
ed.
Findings and recommendations
Policy recommendations • Ensure policy and investment decisions for CO2 use applications are informed by robust life-
cycle analysis that provides improved understanding and quantification of climate benefits.
• Identify and enable early market opportunities for CO2 use that are scalable, commercially-feasible and can deliver emissions reductions. The use of CO2 in building materials is one such opportunity.
• Introduce public procurement guidelines for low-carbon products. This can create an early market for CO2-derived products with verifiable CO2 emissions reductions, and promote innovation and investment.
• Establish performance-based standards for products such as building materials, fuels and chemicals to facilitate the uptake of CO2-derived alternatives.
• Support research, development and demonstration for future applications of CO2 use that could play a role in a net-zero CO2 emission economy, including as a carbon source for aviation fuels and chemicals.
Millions of tonnes of CO2 are being used today While most of the focus on CO2 is on its contribution to climate change, it can also be a commercial input to a range of products and services. Today, around 230 million tonnes (Mt) of CO2 are used each year (IHS Markit, 2018). The largest consumer is the fertiliser industry, where around 130 MtCO2 per year is used in urea manufacturing, followed by the oil sector, with a consumption of 70 to 80 MtCO2 for enhanced oil recovery (EOR) (IEA, 2019a). CO2 is also widely used in food and beverage production, the fabrication of metal, cooling, fire suppression and in greenhouses to stimulate plant growth.
More than two-thirds of current global demand for CO2 comes from North America (33%), the People’s Republic of China (“China”) (21%) and Europe (16%), with the demand for existing uses expected to grow steadily year-on-year (Figure 1). This analysis does not consider these mature CO2 use pathways, including EOR, but focuses on its emerging and novel applications.

Putting CO2 to Use: Creating Value from Emissions Findings and recommendations
PAGE | 6
IEA
. All
right
s re
serv
ed.
Growth in global demand of CO2 over the years (left); breakdown of demand in 2015 Figure 1.(right)
Note: Projections for future global CO2 demand are based on an average year-on-year growth rate of 1.7%. Sources: Analysis based on ETC (2018), Carbon Capture in a Zero-Carbon Economy; IHS Markit (2018), Chemical Economics Handbook – Carbon Dioxide; US EPA (2018), Inventory of U.S. Greenhouse Gas Emissions and Sinks 1990-2016.
Global consumption of CO2 is estimated to be 230 Mt/yr and expected to grow steadily over the coming years; consumption is mainly driven by EOR and on-site demand for urea production.
New pathways for CO2 are generating global interest
The range of potential CO2 use applications is very large and includes direct use, by which CO2 is not chemically altered (non-conversion) and the use of CO2 by transformation (via multiple chemical and biological processes) to fuels, chemicals and building materials (conversion) (Figure 2).
Although most conversion pathways are highly energy-intensive and still in their infancy, they are attracting growing interest and support from governments, industry and investors. Companies such as CarbonCure and Solidia, which use CO2 to manufacture concrete, have recently attracted investment from Breakthrough Energy Ventures and OGCI Climate Investments, respectively. In North America, the NRG COSIA Carbon XPrize is supporting the development of novel CO2 use opportunities with a USD 20 million global competition (XPRIZE, 2019). Governments in Canada, Japan, the United Kingdom and the United States as well as the European Commission are also providing significant RD&D support for CO2 use.
The emerging interest in opportunities for the use of CO2 is driven by several concerns. Key among these is its potential to contribute to climate goals. Other factors include technology leadership, energy security, the anticipated availability of cheap and abundant renewable energy (which could make CO2 conversion routes more economical), and the potential for the use of CO2 to be either a stepping stone or a smaller-scale alternative to carbon capture and storage (CCS).
In select cases, such as building materials, the use of CO2 can be based on purely commercial drivers as it delivers a product with superior performance and lower cost than conventionally produced building materials. CO2 could be an important raw material for products that will
150
230250
272
0
50
100
150
200
250
300
2000 2015 2020 2025
MtC
O2/
yr
EOR (34%)
Urea (57%)Beverages (3%)
Food (3%)
Fab. metal (2%)
Other (4%)

Putting CO2 to Use: Creating Value from Emissions Findings and recommendations
PAGE | 7
IEA
. All
right
s re
serv
ed.
continue to require carbon, either because it provides their structure and properties (carbon-containing chemicals) or because the use of carbon-free energy carriers, such as electricity or hydrogen, is challenging (for example, aviation fuels). CO2 is one of few alternatives to fossil fuel as a source of carbon.
Simple classification of pathways for CO2 use Figure 2.
IEA 2019. All rights reserved.
CO2 can be used in a broad range of applications involving direct use of CO2 or use through conversion into other products.
CO2 use can contribute to climate goals, but with caveats
Using CO2 in products or services does not necessarily reduce emissions. Quantifying the potential climate benefits is complex and challenging, requiring a life cycle approach. The climate benefits associated with CO2 use primarily arise from displacing a product or service with one that has higher life-cycle CO2 emissions, such as fossil-based fuels, chemicals or conventional building materials.
There are five key considerations in assessing the climate benefits of CO2 use:
1. the source of CO2 (from natural deposits, fossil fuels, biomass or the air)
2. the product or service the CO2-based product or service is displacing
3. how much and what form of energy is used to convert the CO2
4. how long the carbon is retained in the product
5. the scale of the opportunity for CO2 use.

Putting CO2 to Use: Creating Value from Emissions Findings and recommendations
PAGE | 8
IEA
. All
right
s re
serv
ed.
Over time, and as fossil fuel use declines, the climate benefits associated with displacement will be reduced and the CO2 used must increasingly be sourced from biomass or through direct air capture (DAC). These CO2 sources can support a carbon-neutral life cycle for some CO2 use applications and could deliver negative emissions in applications where the carbon is permanently stored, such as in building materials (Figure 3). However, these negative emission opportunities are likely very limited and must be considered in the context of the product’s entire life cycle.
The carbon retention time for CO2 use applications can vary per product, ranging from less than one year for fuels, up to ten years for most chemical intermediates, to hundreds of years for polymers, while storage in building materials could last for millions of years. Critically, the potential of CO2 use to contribute to climate goals will depend on how far, and how fast, these opportunities can be scaled-up.
CO2 flows for CO2 use applications Figure 3.
IEA 2019. All rights reserved.
The climate benefits associated with CO2 use will depend on several factors, including the source of CO2, the product being displaced, and the retention of CO2 in the final product.
The future scale of CO2 use is highly uncertain The future market for CO2-derived products and services is very difficult to assess, reflecting the early stage of technology development for many applications and the reliance on supporting policy frameworks. Global estimates range from less than 1 GtCO2 per year to 7 GtCO2 per year by 2030, depending on the assumptions applied. These higher estimates are considered extremely optimistic.
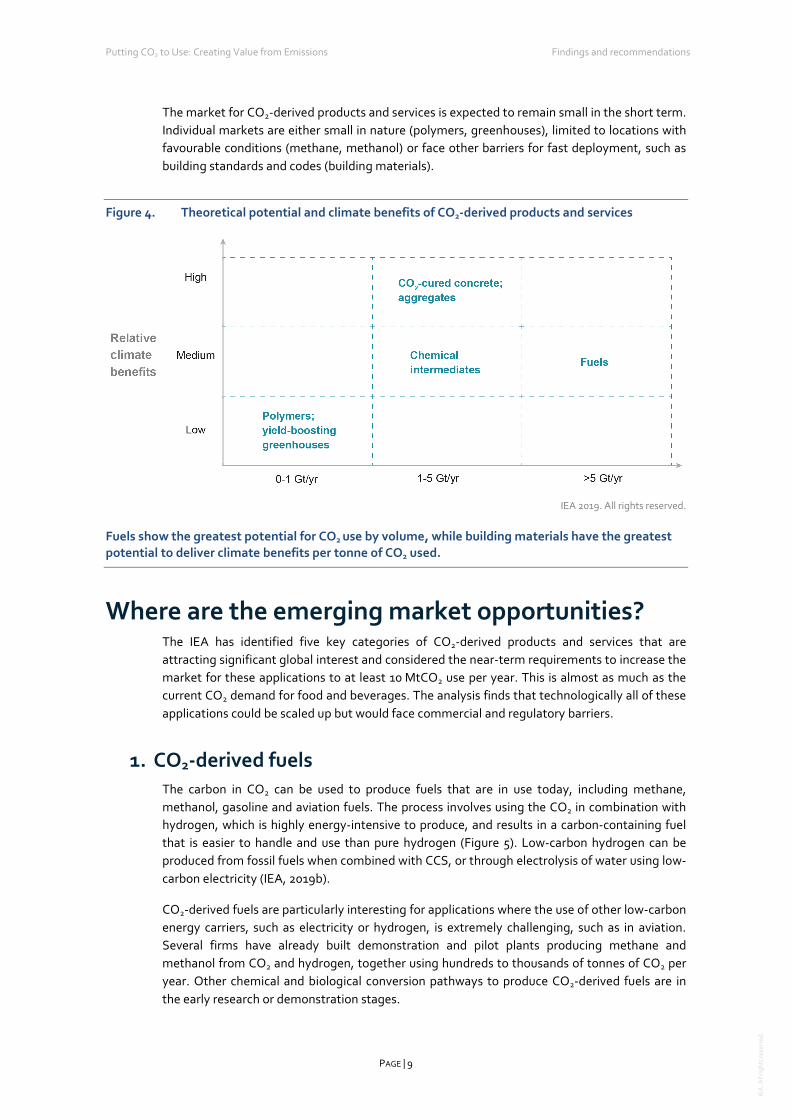
A high-level screening of the theoretical potential for CO2 use and the likely climate benefits (Figure 4) shows that fuels have the largest potential due to their vast market size, while building materials show the greatest climate change mitigation potential mainly because of the low energy requirements and the permanent retention of carbon in the product.
Putting CO2 to Use: Creating Value from Emissions Findings and recommendations
PAGE | 9
IEA
. All
right
s re
serv
ed.
The market for CO2-derived products and services is expected to remain small in the short term. Individual markets are either small in nature (polymers, greenhouses), limited to locations with favourable conditions (methane, methanol) or face other barriers for fast deployment, such as building standards and codes (building materials).
Theoretical potential and climate benefits of CO2-derived products and services Figure 4.
IEA 2019. All rights reserved.
Fuels show the greatest potential for CO2 use by volume, while building materials have the greatest potential to deliver climate benefits per tonne of CO2 used.
Where are the emerging market opportunities? The IEA has identified five key categories of CO2-derived products and services that are attracting significant global interest and considered the near-term requirements to increase the market for these applications to at least 10 MtCO2 use per year. This is almost as much as the current CO2 demand for food and beverages. The analysis finds that technologically all of these applications could be scaled up but would face commercial and regulatory barriers.
1. CO2-derived fuels The carbon in CO2 can be used to produce fuels that are in use today, including methane, methanol, gasoline and aviation fuels. The process involves using the CO2 in combination with hydrogen, which is highly energy-intensive to produce, and results in a carbon-containing fuel that is easier to handle and use than pure hydrogen (Figure 5). Low-carbon hydrogen can be produced from fossil fuels when combined with CCS, or through electrolysis of water using low-carbon electricity (IEA, 2019b).
CO2-derived fuels are particularly interesting for applications where the use of other low-carbon energy carriers, such as electricity or hydrogen, is extremely challenging, such as in aviation. Several firms have already built demonstration and pilot plants producing methane and methanol from CO2 and hydrogen, together using hundreds to thousands of tonnes of CO2 per year. Other chemical and biological conversion pathways to produce CO2-derived fuels are in the early research or demonstration stages.

Putting CO2 to Use: Creating Value from Emissions Findings and recommendations
PAGE | 10
IEA
. All
right
s re
serv
ed.
Mature conversion route for CO2-derived fuels and chemical intermediates Figure 5.
IEA 2019. All rights reserved.
CO2 can be used to produce fuels and chemical intermediates through several conversion routes but require significant energy input.
Estimated production costs of methanol and methane from CO2 in most regions of the world are currently 2 to 7 times higher than for their fossil counterparts. The chief cost factor is typically electricity, accounting for between 40-70% of the production costs, and hence very low average grid electricity prices are required for CO2-derived methanol and methane to be competitive. Even under these conditions, the direct use of low-carbon hydrogen and electricity as a fuel will be a more cost-effective option in most cases.
Commercial production of CO2-derived methanol and methane could be possible in markets where both low-cost renewable energy and CO2 are available, such as in North Africa, Chile or Iceland. A prime example is the George Olah facility in Iceland that converts around 5 600 tonnes of CO2 per year into methanol using hydrogen produced from renewable electricity (CRI, 2019).
Over time, production costs of CO2-derived fuels are expected to come down, mainly due to capital cost reductions and availability of low-cost renewable electricity and feedstock CO2. While CO2-derived methane and CO2-derived liquid fuels, such as diesel or aviation fuels, will continue to be uncompetitive in the absence of a stringent CO2 price regime, CO2-derived methanol may become competitive in more regions around the world, depending on local methanol market prices.
Both CO2-derived methane and methanol can provide climate benefits, but the use of low-carbon energy for their production is critical. Analysis of the relevant literature shows that, in a best case scenario, emissions can be reduced by 74% to 93% for methanol and 54% to 87% for methane as compared to conventional production routes (Artz et al., 2018). However, extensive testing is needed before these products can be recognised by existing product quality standards.

Putting CO2 to Use: Creating Value from Emissions Findings and recommendations
PAGE | 11
IEA
. All
right
s re
serv
ed.
2. CO2-derived chemicals The carbon (and oxygen) in CO2 can be used as an alternative to fossil fuels in the production of chemicals, including plastics, fibres and synthetic rubber. As with CO2-derived fuels, converting CO2 to methanol and methane is the most technologically mature pathway. The methanol can be subsequently converted into other carbon-containing high-value chemical intermediates such as olefins, which are used to manufacture plastics, and aromatics, which are used in a range of sectors including health and hygiene, food production and processing.
A special group of chemicals, polymers, are used in the production of plastics, foams and resins. The carbon in CO2 can be used in polymer production by replacing part of the fossil fuel-based raw material in the manufacturing process (Figure 6). Unlike the conversion of CO2 to fuels and chemical intermediates, polymer processing with CO2 requires little energy input, because CO2 is converted into a molecule with an even lower energy state (carbonate). A number of companies are currently operating polymer plants using CO2 as a raw material.
Mature conversion pathway for CO2-derived polymers Figure 6.
IEA 2019. All rights reserved.
CO2 can be converted into polymers that can be used in a wide variety of products.
Polymer processing with CO2 can be competitive in the market, due to the relatively low energy required for their production and their high market value. Some claim that certain polymers can be made at 15% to 30% lower cost than their fossil counterparts, provided the CO2 used is cheaper than the fossil fuels-based raw material it replaces (von der Assen, 2015). The Chimei Asai facility in Chinese Taipei, a joint venture of Asahi Kasei Chemicals and Chi Mei Corp, has been manufacturing around 150 000 tonnes of polycarbonates per year using CO2 as a starting material for more than a decade (Fukuoka et al. 2007). Although the potential market for polymers is relatively small, early opportunities for polymer processing with CO2 may be available in locations where existing polymer plants can be modified and where fossil fuel prices are high.
Potential climate benefits in polymer production depend on the amount of CO2 that can be absorbed in the material, which can be up to 50% of the polymer’s mass (Alberici et al., 2017). For example, a polymer containing 20% CO2 by weight shows life cycle CO2 emissions reductions of 15% relative to the conventional production process (von der Assen, 2015). Similarly to CO2-derived fuels and chemicals, further compliance testing is needed before polymers with high mass percentages of CO2 can enter the market.

Putting CO2 to Use: Creating Value from Emissions Findings and recommendations
PAGE | 12
IEA
. All
right
s re
serv
ed.
3. Building materials from minerals and CO2 CO2 can be used in the production of building materials to replace water in concrete, called CO2 curing, or as a raw material in its constituents (cement and construction aggregates). These applications involve the reaction of CO2 with calcium or magnesium to form low-energy carbonate molecules, the form of carbon that makes up concrete (Figure 7). CO2-cured concrete is one of the most mature and promising applications of CO2 use, while the integration of CO2 in the production of cement itself is at an earlier stage of development.
Mature conversion pathway for CO2-derived building materials Figure 7.
IEA 2019. All rights reserved.
CO2-derived building materials can be made from CO2 through a carbonation process.
CO2-cured concrete can have superior performance, lower manufacturing costs and a lower CO2
footprint than conventionally-produced concrete. The climate benefits come mainly from the lower input of cement, which is responsible for the bulk of the costs and life-cycle emissions of concrete. Two North American companies, CarbonCure and Solidia Technologies, are leading the development and marketing of CO2 curing technology (CarbonCure, 2019; Solidia, 2019).
Quantifying the potential of CO2-cured concrete to reduce emissions remains difficult. CarbonCure reports that the CO2 footprint of concrete can be reduced by around 80%, but these claims have not been verified independently (CarbonCure, 2019). A highly prospective opportunity for early application of these technologies is the market for pre-cast concrete products and ready-mixed concrete that is cured with CO2 and water at the plant before being transported for use in construction.
Existing regulations and product standards may stand in the way of early application in certain parts of the market. Updating existing product standards can take up to a decade; multi-year trials must demonstrate safe and environmentally friendly performance. A shift from prescriptive to performance-based standards could facilitate the uptake of novel CO2-derived building materials.
In the interim, non-structural applications of concrete for which high mechanical strength is not required (for example construction of roads, floors and ditches) could be a target for early deployment of these new products.

Putting CO2 to Use: Creating Value from Emissions Findings and recommendations
PAGE | 13
IEA
. All
right
s re
serv
ed.
4. Building materials from waste and CO2 Construction aggregates (small particulates used in building materials) can be produced by reacting CO2 with waste materials from power plants or industrial processes. Among these are iron slag and coal fly ash, which would otherwise be stockpiled or stored in landfill (Figure 7). Producing building materials from waste and CO2 can be competitive as it offsets the cost associated with conventional waste disposal.
Waste materials such as steel slag, bauxite residue and air pollution control (APC) residues are good candidates for conversion into building materials using CO2. Companies in different parts of the world are scaling up businesses using these waste materials; together they consume around 75 kilotonnes (kt) of CO2 annually. The British company Carbon8 uses around 5 kt/yr of CO2 to convert around 60 kt/yr of APC residues into lightweight aggregates as a component of building materials (Carbon8, 2019).
The climate benefits of these materials created from waste depend on the energy intensity of the production process and the transport of both the inputs and the carbonate products. Pre-treatment and separation steps can be particularly energy-intensive. The exact potential for reduction of emissions remains difficult to quantify and is case-specific. Carbon8 claims that more carbon is permanently stored during the process than emitted in its manufacture, resulting in a carbon-negative aggregate (Carbon8, 2019).
This process also requires multi-year trials demonstrating safe and environmental-friendly performance. Existing regulations, such as the European Union’s End of Waste Regulations, need to be revised to allow the use of certain waste materials. Similarly to using building materials made from minerals, targeting market segments that are more receptive to novel building materials may help build an early market.
5. Crop yield boosting with CO2 CO2 can be used to enhance yields of biological processes, such as algae production and crop cultivation in greenhouses. The application of CO2 with low-temperature heat in industrial greenhouses is the most mature yield-boosting application today, and can increase yields by 25% to 30%. The clear leader in the use of CO2 in greenhouses is the Netherlands, with an estimated annual consumption between 5 and 6.3 MtCO2. Of this amount, approximately 500 ktCO2 per year comes from external sources, mainly industrial plants, with the balance taken from on-site gas-fired boilers or co-generation systems (Alberici et al., 2017). The replacement of these on-site systems with other industrial CO2 sources or with CO2 captured directly from the atmosphere could deliver climate benefits.
CO2 use can complement CO2 storage, but is not an alternative
CO2 use has the potential to support the development of products and services with a lower CO2 footprint and to contribute to emissions reductions. It can also be a complement to the widespread deployment of CCS, which the IEA has consistently highlighted as a critical part of the portfolio of technologies needed to achieve climate goals. In particular, CO2 use can support investment in CO2 capture opportunities, technology refinement and (in limited cases) early development of CO2 transport infrastructure.

Putting CO2 to Use: Creating Value from Emissions Findings and recommendations
PAGE | 14
IEA
. All
right
s re
serv
ed.
However, CO2 use cannot replace CO2 storage in delivering the very significant emissions reductions needed to meet Paris Agreement ambitions. This reflects the expected smaller scale of many CO2 use opportunities, their very limited scope for negative emissions, and their early stage of technology and market development.
IEA scenario analysis highlights that CO2 use could become a more attractive mitigation option where availability of CO2 storage is limited, but it would not scale to similar levels of deployment. In the Clean Technology Scenario (CTS), which sets out a pathway consistent with the Paris Agreement climate goals, CO2 use in fuel transformation and industry would reach around 250 MtCO2 annually by 2060. In a variant of the CTS where the cumulative availability of CO2 storage is limited to only 10 GtCO2 (the Limited CO2 Storage [LCS] scenario variant), CO2 use would increase three-fold, to 878 MtCO2 in 2060 (Figure 8). The CO2 is used for the production of methanol, urea and CO2-derived fuels (kerosene, gasoline and diesel). Although this scenario analysis only considers the use of CO2 in energy and industrial applications, it highlights the difference in anticipated scale for CO2 use and CO2 storage.
CO2 use in a climate pathway with limited availability of CO2 storage Figure 8.
Notes: The CTS embodies a vision to reduce global energy-and process-related CO2 emissions by almost 75% in 2060, relative to today. The LCS assesses the energy-system wide implications of a possible failure or delay in making CO2 storage available to the energy sector, by limiting total cumulative CO2 storage to less than 10 GtCO2 in the model. Source: IEA (2019a), Exploring Clean Energy Pathways: The Role of CO2 Storage.
Limiting the availability of CO2 storage in the Clean Technology Scenario results in a 77% increase in CO2 used in the period to 2060.
References Alberici, S. et al. (2017), Assessing the Potential of CO2 Utilisation in the UK, Ecofys UK, Ltd,
https://assets.publishing.service.gov.uk/government/uploads/system/uploads/attachment_data/file/799293/SISUK17099AssessingCO2_utilisationUK_ReportFinal_260517v2__1_.pdf.
Artz, J. et al., (2018), Sustainable conversion of carbon dioxide: An integrated review of catalysis and life cycle assessment, Chemical Reviews, Vol. 118, pp. 434-504, http:// dx.doi.org/10.1021/acs.chemrev.7b00435.
Carbon8 (2019), Carbon8 (web page), www.c8s.co.uk (accessed 10 May 2019).
CarbonCure (2019), Carbon Sense Solutions, Inc., www.novascotia.ca/nse/cleantech/docs/CarbonSense.pdf (accessed 23 May 2019).
Geological storage Use
0
1
2
3
4
5
6
2030 2040 2050 2060
CTS
0
1
2
3
4
5
6
2030 2040 2050 2060
LCS

Putting CO2 to Use: Creating Value from Emissions Findings and recommendations
PAGE | 15
IEA
. All
right
s re
serv
ed.
CRI (Carbon Recycling International) (2019), The George Olah Renewable Methanol Plant (web page), www.carbonrecycling.is/george-olah/ (accessed February 2019).
ETC (Energy Transitions Commission) (2018), “Carbon capture in a zero-carbon economy” (consultation paper), Cross-Cutting Technologies (web page), www.energy-transitions.org/content/cross-cutting-technologies.
Fukuoka, S. et al. (2007), Green and sustainable chemistry in practice: Development and industrialization of a novel process for polycarbonate production from CO2 without using phosgene, Polymer Journal, Vol. 39(2), pp. 91-114, http:// dx.doi.org/DOI: http:// dx.doi.org/10.1295/polymj.PJ2006140.
IEA (International Energy Agency) (2019a), Exploring Clean Energy Pathways: The Role of CO2 Storage, IEA, Paris, www.iea.org/publications/reports/TheroleofCO2storage/.
IEA (2019b), The Future of Hydrogen: Seizing Today’s Opportunities, IEA, Paris.
IHS Markit (2018), “Introduction”, in Chemical Economics Handbook – Carbon Dioxide, https://ihsmarkit.com/products/carbon-dioxide-chemical-economics-handbook.html (accessed July 2018).
Solida (2019), Solidia (web portal), https://solidiatech.com/ (accessed 10 May 2019).
US EPA (United States Environmental Protection Agency) (2018), Inventory of U.S. Greenhouse Gas Emissions and Sinks 1990-2016 (as submitted to the UNFCCC), www.epa.gov/sites/production/files/2019-04/documents/us-ghg-inventory-2019-main-text.pdf.
von der Assen, N.V. (2015), From Life-Cycle Assessment towards Life-Cycle Design of Carbon Dioxide Capture and Utilization (Ph.D. thesis), University of Aachen, http://publications.rwth-aachen.de/record/570980/files/570980.pdf.
XPRIZE (2019), Transforming CO2 into Valuable Products (web page), NRG COSIA XPRIZE, http://carbon.xprize.org (accessed 10 May 2019).
Putting CO2 to Use: Creating Value from Emissions Technical analysis
PAGE | 16
IEA
. All
right
s re
serv
ed.
Technical analysis Introduction
Carbon dioxide (CO2) is a major contributor to climate change but it can also be a valuable input to a range of products and services. Governments and industry globally are developing new opportunities to use CO2 in a way that can support climate change objectives while also driving industrial innovation, enabling a circular economy and facilitating use of renewable electricity in the transport, heating and industrial sector.
This analysis explores the near-term potential for CO2 use in five key applications: fuels, chemicals, building materials from minerals, building materials from waste, and yields boosting (for example, in greenhouses). The focus is on emerging technologies and applications rather than existing uses of CO2, most of which involve direct use of CO2 (such as in food and beverage production) rather than its conversion to other molecules. Although the market for CO2 for these existing uses is growing incrementally, large-scale demand is mostly saturated, with the exception of CO2 used to enhance oil recovery (CO2-EOR). CO2-EOR has been considered in previous IEA reports (IEA, 2015) and is not included in this analysis.
The analysis is structured as follows. The first section describes the main CO2 use applications, the current market, the key drivers, and how CO2 use can provide climate benefits. In the second section, the analysis considers criteria to determine the future market for a CO2-derived product or service. It assesses the potential to grow the market for each of the five key categories of CO2-derived products and services to a scale of 10 million tonnes (Mt) of CO2 use per year. The third section discusses policy instruments to drive the uptake of CO2-derived products and services, and presents recommendations that emerge from the analysis.

Putting CO2 to Use: Creating Value from Emissions Technical analysis
PAGE | 17
IEA
. All
right
s re
serv
ed.
Setting the scene
What is CO2 use? For this study, CO2 use has been defined as the process of using CO2 as a raw material for products or services with a potential market value. The range of potential applications is very large and includes direct use, where the CO2 is not chemically altered (non-conversion), and the transformation of CO2 to a useful product (conversion) (Figure 9).
Most existing commercial applications involve direct use of CO2 (non-conversion), including the production of food and beverages, metals fabrication, cooling, dry cleaning, healthcare, water treatment, fire suppression, and the injection of CO2 in oil reservoirs to enhance oil recovery (CO2-EOR). CO2 is also increasingly used to enhance yields from industrial processes, such as methanol production and crop cultivation in greenhouses. Most applications make use of several unique properties of CO2, including its large heat absorption capacity, stable and non-reactive nature, and its ability to act as a solvent. A future use of CO2 is in supercritical power cycles, where CO2 would replace water as a working fluid, increasing the efficiency of electricity generation.
The conversion route has sparked most interest in recent years, including opportunities to develop CO2-derived fuels, chemicals and building materials. There are a large number of chemical and biological pathways for CO2 conversion, many of which are still in an early stage of development but may become technically and commercially available in the future.
Simple classification of CO2 use pathways Figure 9.
IEA 2019. All rights reserved.
CO2 can be used in a broad range of applications involving direct use of CO2 or use through conversion into other products.
Putting CO2 to Use: Creating Value from Emissions Technical analysis
PAGE | 18
IEA
. All
right
s re
serv
ed.
CO2-derived fuels CO2 can be used to produce many of the fuels available on the market today, such as methane, methanol, gasoline and aviation fuels.1 Most fuels have an application in the transportation sector, while some (e.g. methane) can also be used in industry, heating and power generation. CO2-derived fuels may notably be used in sectors for which few low-carbon alternatives exist, such as aviation.
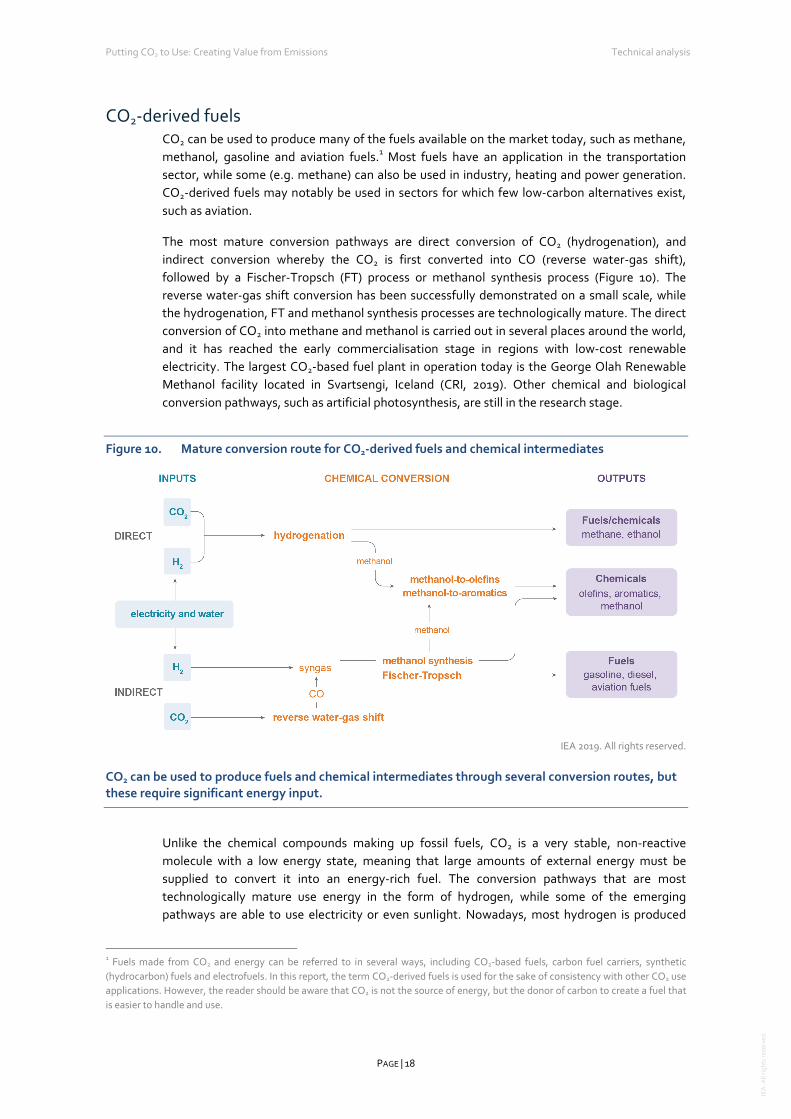
The most mature conversion pathways are direct conversion of CO2 (hydrogenation), and indirect conversion whereby the CO2 is first converted into CO (reverse water-gas shift), followed by a Fischer-Tropsch (FT) process or methanol synthesis process (Figure 10). The reverse water-gas shift conversion has been successfully demonstrated on a small scale, while the hydrogenation, FT and methanol synthesis processes are technologically mature. The direct conversion of CO2 into methane and methanol is carried out in several places around the world, and it has reached the early commercialisation stage in regions with low-cost renewable electricity. The largest CO2-based fuel plant in operation today is the George Olah Renewable Methanol facility located in Svartsengi, Iceland (CRI, 2019). Other chemical and biological conversion pathways, such as artificial photosynthesis, are still in the research stage.
Mature conversion route for CO2-derived fuels and chemical intermediates Figure 10.
IEA 2019. All rights reserved.
CO2 can be used to produce fuels and chemical intermediates through several conversion routes, but these require significant energy input.
Unlike the chemical compounds making up fossil fuels, CO2 is a very stable, non-reactive molecule with a low energy state, meaning that large amounts of external energy must be supplied to convert it into an energy-rich fuel. The conversion pathways that are most technologically mature use energy in the form of hydrogen, while some of the emerging pathways are able to use electricity or even sunlight. Nowadays, most hydrogen is produced
1 Fuels made from CO2 and energy can be referred to in several ways, including CO2-based fuels, carbon fuel carriers, synthetic (hydrocarbon) fuels and electrofuels. In this report, the term CO2-derived fuels is used for the sake of consistency with other CO2 use applications. However, the reader should be aware that CO2 is not the source of energy, but the donor of carbon to create a fuel that is easier to handle and use.
Putting CO2 to Use: Creating Value from Emissions Technical analysis
PAGE | 19
IEA
. All
right
s re
serv
ed.
from natural gas and other fossil fuels. This process can be decarbonised by applying CCS. Another production route is the electrolysis of water using low-carbon energy. This technology has attracted increasing interest in recent years, mainly due to spectacular cost reductions in solar PV and wind energy technologies, and the expectation that these technologies will be widely available in the future (IEA, 2019a).
CO2-derived chemicals CO2-derived chemicals include a wide range of organic substances, including plastics, fibres and synthetic rubber. A well-established application is in the fertiliser industry, where CO2 is used to manufacture urea. In addition to urea, CO2 can be converted into chemical intermediates, such as methanol, ethylene and propylene, which in turn can be used as a source for a myriad of more complex chemicals. As is the case for fuels, the conversion of CO2 to methanol and methane is the most technologically mature pathway, but requires considerable electricity input.
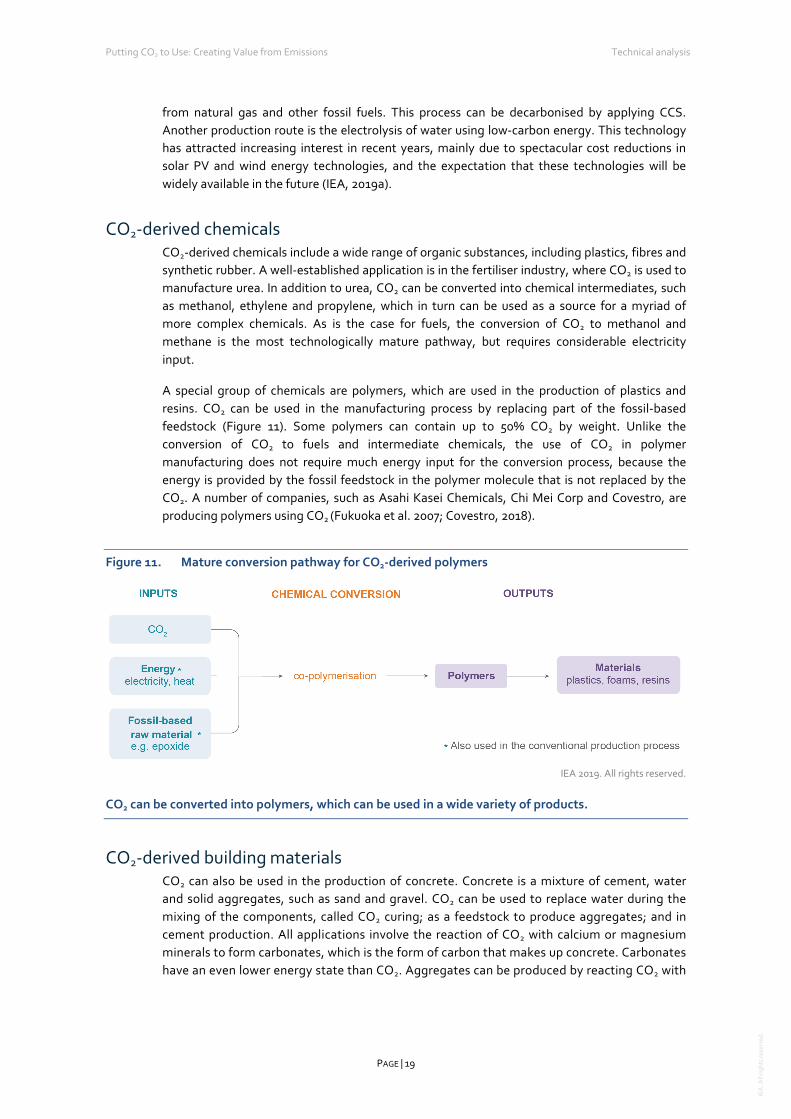
A special group of chemicals are polymers, which are used in the production of plastics and resins. CO2 can be used in the manufacturing process by replacing part of the fossil-based feedstock (Figure 11). Some polymers can contain up to 50% CO2 by weight. Unlike the conversion of CO2 to fuels and intermediate chemicals, the use of CO2 in polymer manufacturing does not require much energy input for the conversion process, because the energy is provided by the fossil feedstock in the polymer molecule that is not replaced by the CO2. A number of companies, such as Asahi Kasei Chemicals, Chi Mei Corp and Covestro, are producing polymers using CO2 (Fukuoka et al. 2007; Covestro, 2018).
Mature conversion pathway for CO2-derived polymers Figure 11.
IEA 2019. All rights reserved.
CO2 can be converted into polymers, which can be used in a wide variety of products.
CO2-derived building materials CO2 can also be used in the production of concrete. Concrete is a mixture of cement, water and solid aggregates, such as sand and gravel. CO2 can be used to replace water during the mixing of the components, called CO2 curing; as a feedstock to produce aggregates; and in cement production. All applications involve the reaction of CO2 with calcium or magnesium minerals to form carbonates, which is the form of carbon that makes up concrete. Carbonates have an even lower energy state than CO2. Aggregates can be produced by reacting CO2 with

Putting CO2 to Use: Creating Value from Emissions Technical analysis
PAGE | 20
IEA
. All
right
s re
serv
ed.
waste materials from power plants or industrial processes, such as iron slag and coal fly ash, which would otherwise be stockpiled or stored in landfill.2
As in the case of polymers, no external energy input is required for the actual conversion process, although some processes require considerable amounts of energy for the handling and preparation of the input materials, such as waste materials and minerals, or to speed up the CO2 conversion process to industrially acceptable rates. Carbonation reactions have much lower CO2 use rates than fuels and chemicals, but do provide for long-term retention of carbon in carbonate form. The most mature applications are CO2-cured concrete and aggregates production from either natural minerals or waste materials (Figure 12). Two North American companies, CarbonCure and Solidia Technologies are leading the development and commercialisation of the CO2-curing process, with CarbonCure now operating at 150 facilities in the United States (Edelstein, 2019; Solidia, 2019). The development stage of waste-based aggregates depends on the type of waste material, ranging from the research to early commercialisation stage, for example Carbon8, which is producing lightweight aggregates from municipal air pollution control (APC) residues in the United Kingdom (Carbon8, 2019).
Mature conversion pathway for CO2-derived building materials Figure 12.
IEA 2019. All rights reserved.
CO2-derived building materials can be made from CO2 through a carbonation process.
Where is CO2 being used today? The global demand for CO2 in 2015 was estimated to be approximately 230 million tonnes (Mt) of CO2 (IHS Markit, 2018) (Figure 13).3 Of this, by far the greatest consumer globally is the fertiliser industry, where around 130 MtCO2 per year is generated in ammonia production and used on-site to manufacture urea (IEA, 2019a). The largest user of externally sourced CO2 is the
2 Ground-granulated blast-furnace slag (iron slag) and coal fly ash can also be used as a binding material in concrete, thereby partly replacing cement. This is not a CO2 use application. 3 This number includes both internally and externally sourced CO2. Internally sourced CO2 refers to processes where CO2 is produced and captured in a chemical manufacturing process, and ultimately consumed in a later process step; the most important example is integrated ammonia-urea plants. Externally sourced CO2 refers to CO2 that is external to the process and needs to be captured.

Putting CO2 to Use: Creating Value from Emissions Technical analysis
PAGE | 21
IEA
. All
right
s re
serv
ed.
oil industry, with an annual consumption of around 70 to 80 MtCO2 for enhanced oil recovery (EOR), primarily in North America (Box 1). The remaining share represents a wide range of commercial applications, predominantly the food and beverage sector, but also in other industries such as metal working, chemicals manufacturing, water treatment and healthcare. The consumption of CO2 for the production of CO2-derived fuels, chemicals and building materials today is negligible compared to other applications. Today, around 33% of the global CO2 demand comes from North America, followed by China (21%) and Europe (16%). Global demand for established CO2 uses is growing steadily year-on-year, with an estimated average annual growth rate of 1.7% per year through to 2022 (IHS Markit, 2018). By extrapolating this trend, the annual consumption would reach approximately 270 MtCO2 in 2025.
The CO2 used today is predominantly sourced from industrial processes that produce high-purity CO2 as a by-product, such as ammonia production and biomass fermentation, or extracted from natural underground CO2 deposits (mainly for EOR purposes). Supply per industrial source may be in the order of 10 000 to 500 000+ tonnes of CO2 (tCO2) per year, with individual non-EOR customers typically requiring relatively small volumes (US EPA, 2018).
Growth in global CO2 demand over the years (left) and breakdown of demand in 2015 Figure 13.(right)
Notes: Projections for future global CO2 demand are based on an average year-on-year growth rate of 1.7%. Sources: Analysis based on ETC (2018), Carbon Capture in a Zero-Carbon Economy; IHS Markit (2018), Chemical Economics Handbook – Carbon Dioxide, US EPA (2018), Inventory of U.S. Greenhouse Gas Emissions and Sinks 1990-2016.
Global consumption of CO2 is estimated to be 230 Mt/yr and expected to grow steadily over the coming years; consumption is mainly driven by EOR and on-site demand for urea production.
The price of CO2 is usually determined through negotiations between suppliers and consumers and tends to differ considerably per region and industry. CO2 from ammonia producers can yield a price ranging from USD 3 to USD 15 tCO2 under long-term contracts, while prices for niche markets with small volumes and a high degree of purity can be USD 400/tCO2 or even much higher (GCCSI, 2011; CarbonCure, 2018). One of the main issues for the industry is balancing supply and demand. The supply of CO2 is intimately bound to ammonia and fertiliser manufacturing, which is typically carried out in the autumn and winter months ahead of spring
150
230250
272
0
50
100
150
200
250
300
2000 2015 2020 2025
MtC
O2/
yr
EOR (34%)
Urea (57%)Beverages (3%)
Food (3%)
Fab. metal (2%)
Other (4%)

Putting CO2 to Use: Creating Value from Emissions Technical analysis
PAGE | 22
IEA
. All
right
s re
serv
ed.
planting.4 Wholesale ammonia prices also have an effect on supply. This can result in supply shortages, particularly at times of high demand for food and beverage preparation, which is usually highest in the summer months. This imbalance became quite acute in Europe and Mexico in the summer of 2018, with rationing of CO2 supplies in some areas (Sampson, 2018).
Box 1. A mature application of CO2 use: enhanced oil recovery (EOR)
The oil industry is the largest consumer of externally sourced CO2, with an estimated annual global consumption of around 70 to 80 Mt (in 2017) of CO2 for EOR (CO2-EOR) (US EPA, 2018). CO2-EOR is a well-established commercial technology that has been applied since the 1970s, primarily in the United States. The technology involves the injection of CO2 into oil fields to enhance production. This increases the overall reservoir pressure and improves the mobility of the oil, resulting in a higher flow of oil towards the production wells. The United States continues to dominate the CO2-EOR industry, with around 5% of its oil produced using this technology. This is facilitated by an extensive pipeline infrastructure of over 6 000 km (GCCSI, 2012). Other countries applying CO2-EOR, but on a smaller scale, include Brazil, Canada, China and Turkey. The majority of purchased CO2 is currently produced from underground CO2 deposits; for example, in the United States, less than 30% of the CO2 was derived from non-geological sources, mainly due to the absence of available anthropogenic CO2 sources close to oil fields (IEA, 2018a).
Today, between 0.3 and 0.6 t of CO2 is injected in EOR processes per barrel (bbl) of oil produced in the United States, although this varies between fields and across the life of projects (IEA, 2018a). During the process, a portion of the CO2 remains below the ground, while the remainder returns to the surface as the oil is extracted. Most CO2-EOR projects recycle CO2 returning to the surface as it is an expensive input to the production process, resulting in over 99% of the injected CO2 being permanently stored over the life of the project. The cost of CO2 is generally linked to the oil price and can range from around USD 15-30/tCO2: injecting 0.5 tCO2/bbl oil would therefore cost around USD 7.5-15/bbl (IEA, 2018a). If the CO2 is sourced from biomass or the air, and the amount of CO2 stored exceeds the emissions from the production and combustion of the oil itself, the oil could be described as net “carbon negative”.
Globally, an estimated 190-430 billion bbl of oil are technically recoverable with CO2-EOR. This would require injecting between 60 and 390 billion tonnes of CO2: for comparison, total global energy-related emissions of CO2 are currently around 32 billion tonnes each year (IEA, 2015). The United States has the greatest potential, but there are also good prospects in Central Asia, the Middle East and the Russian Federation. Today, the key obstacles to wider deployment of CO2-EOR are high capital outlay for projects, suitable geology, a lack of CO2 transport infrastructure, and limited availability of low-cost and reliable sources of CO2 in close proximity to oil fields.
4 While most of the CO2 generated during ammonia production is used in onsite urea manufacturing, some of the CO2 is emitted to the atmosphere or sold for the CO2 market, especially when more ammonia (and thus CO2) is produced than is needed for urea manufacturing.

Putting CO2 to Use: Creating Value from Emissions Technical analysis
PAGE | 23
IEA
. All
right
s re
serv
ed.
What has spurred renewed interest in CO2 use? In recent years, governments and industry have shown renewed interest in CO2 use for a number of reasons. Climate change mitigation has been by far the most important driver. The 2015 Paris Agreement provides a framework for stronger climate action to limit the increase in global average temperatures to ”well below” 2 °C above pre-industrial levels. CO2 use has potential to play a role in reducing emissions as part of a broad portfolio of CO2 mitigation options and can be a complement to CCS (see Box 2).
Other drivers for CO2 use are indirectly related to climate change mitigation. CO2 is one of few alternatives to fossil fuel as a source of carbon. Even in a zero-emission economy, carbon will still be required in several applications. For example, organic chemicals cannot be decarbonised, as the carbon is inherent in providing its structure and properties. In other applications, such as aviation, carbon-containing fuels will continue to play an important role, because the use of carbon-free energy carriers, such as electricity or hydrogen, is extremely challenging. In addition to being a source of carbon, CO2 use allows for the utilisation of renewable electricity in other sectors of the economy, such as transport and industry, thus facilitating the energy transition.
In theory, CO2 could be used infinitely if recaptured from the atmosphere (or biogenic source) after its release to the atmosphere at the end of the product’s life cycle. As such, CO2 use has the potential to become part of a circular carbon economy, in which the maximum value of resources is used before disposing them in the environment. Finally, the pursuit of new uses of CO2 provides opportunities for industrial innovation and technology leadership.
Industry has become increasingly interested in using CO2 to manufacture low-carbon products, as it holds the promise of generating economic revenues in addition to their value in mitigating climate change. The key commercial drivers for emerging CO2 use applications include:
• Converting hydrogen into a fuel that is as easy to handle and use as gaseous or liquid fossil fuels, but with lower overall CO2 emissions.
• Integrating the carbon of CO2 into carbon-containing chemical products with lower overall CO2 emissions than their fossil equivalents.
• Producing cement and concrete with higher performance and lower overall CO2 emissions than conventional building materials.
• Stabilising waste products as a feedstock for higher-value building materials, while reducing waste disposal costs.
• Enhancing the yield of biological processes for improved crop output.
Putting CO2 to Use: Creating Value from Emissions Technical analysis
PAGE | 24
IEA
. All
right
s re
serv
ed.
Box 2. Exploiting synergies between CO2 use and CCS
CO2 use is often considered together and in comparison with CCS in the context of climate change mitigation. Analysis by the IEA has consistently highlighted the critical role of CCS in achieving deep emissions reductions across the energy system, including as a source of “negative emissions” (IEA, 2017). CO2 use is not expected to fulfil the same function as geological CO2 storage or to deliver emissions reductions at the same scale (IEA, 2019b). However, CO2 use can support the development of products and services with a lower CO2 footprint and contribute to emissions reductions as part of a portfolio of clean energy technologies. CO2 use and CCS should be considered complementary technologies within this portfolio, with the potential to enable and reinforce each other’s deployment. These synergies include:
Source of revenue: Demand for CO2 for productive use can provide an important revenue stream for CCS projects. The demand for CO2-EOR has supported investment in 14 of the 19 large-scale CCUS projects currently in operation (see Box 1). Other emerging CO2 use opportunities are unlikely to create demand at the same scale, but could provide a partial revenue stream for CCS projects in some circumstances.
Technology refinement: Smaller-scale CO2 use opportunities are supporting thedemonstration of novel CO2 capture routes, such as membranes and DAC. These earlydemonstrations can contribute to technology refinement and cost reductions for CCS andCO2 use and support the future deployment of both technologies.
Economies of scale: Near-term opportunities for CO2 use typically involve smallerstreams of CO2 demand than CCS, and can benefit from economies of scale in CO2 capture when co-located with large-scale CCS projects.
Shared infrastructure: CO2 use could benefit from the development of large-scalecapture and transport infrastructure for CO2, especially as part of future CO2 hubs andclusters in areas with emission-intensive industries. Such hubs and clusters can safeguardexisting emission-intensive industry, such as chemical and iron and steel factories, whileboosting novel industries pursuing CO2 use activities, thus aligning new businessopportunities with deep emissions reductions. The port of Rotterdam is an example of anindustrial area where efforts are being made to develop infrastructure that can facilitateboth geological storage and CO2 use in greenhouses to stimulate crop growth.
Stepping stone to CO2 storage: in limited cases, CO2 use can complement CCS in placeswhere geological storage for CCS is not accessible, ready on time or too expensive todevelop for small sources of CO2.

Putting CO2 to Use: Creating Value from Emissions Technical analysis
PAGE | 25
IEA
. All
right
s re
serv
ed.
Who is currently investing in CO2 use, and why? The increasing interest in CO2 conversion technologies is reflected in the growing amount of private and public funding that has been channelled to companies in this field. Over the last decade, global private funding for CO2 use start-ups has reached nearly USD 1 billion, primarily in the form of venture capital and growth equity (Cleantech Group, 2018). Investment in CO2 use applications within corporate R&D departments and other partnerships is harder to quantify. In addition to private investment, governments have allocated resources to deployment or have pledged to do so in the future. For example, the UK government plans to deliver a GBP 20 million Carbon Capture and Utilisation (CCU) Demonstration Programme by 2021 to fund design and construction of CCU demonstration plants in the United Kingdom (BEIS, 2018). Even with these developments, total public and private spending on CO2 use applications is small compared to investments in other clean technologies, such as electric vehicles and batteries. Most projects in operation today involve public-private partnerships and are located in Europe and North America.
Even though most of the private investment in technology start-ups comes from traditional venture capital firms, corporate funding makes up a large share of the total sum (Figure 14). This indicates that companies that are looking to reduce their emissions see opportunities in CO2 conversion technologies. For example, oil and gas firms have invested in various CO2 use companies operating on a small scale, including those making products for sectors other than the oil and gas industry, such as concrete and cement. Other large corporate investors are chemical companies and utilities. Overall, the large share of corporate investment indicates strategic interest from companies facing long-term technology challenges.
Breakdown of global investment in CO2 use start-ups by type of investor, 2008-18 Figure 14.
Notes: In the absence of detailed information, values are split equally between investors when there is more than one investor in the deal. Only deals with known transaction values are included. Source: Cleantech Group (2018), i3 Database; IEA (2018b), World Energy Investment 2018.
Most private funding in CO2 use start-ups stems from traditional venture capital firms, followed by corporate funding.
Non-corporate investors
68%
Oil & gas17%
Chemicals10%
Utilities5%

Putting CO2 to Use: Creating Value from Emissions Technical analysis
PAGE | 26
IEA
. All
right
s re
serv
ed.
How can CO2-derived products and services deliver climate benefits?
The amount of CO2 used in a product or service is not the same as the amount of CO2 emissions avoided. In fact, using CO2 in products or services does not necessarily reduce emissions. The climate benefits associated with a CO2-derived product or service primarily arise from displacing an equivalent product or service with higher life-cycle CO2 emissions, such as fossil-based fuels, chemicals or conventional building materials. Unlike CCS, most CO2 use applications ultimately release the CO2 to the atmosphere (Figure 15).
There are five key considerations in assessing the climate benefits of CO2 use:
the source of CO2 (from natural deposits, fossil fuels, industrial processes, biomass or air)
the type of product or service the CO2-based product or service is displacing
how much and what form of energy is used to convert the CO2
how long the carbon is retained in the product (temporary or permanent)
the scale of the opportunity for CO2 use.
Understanding the potential emissions reductions associated with displacement can be particularly difficult as this can differ depending on location and may change over time (for example, as the transport fuel mix becomes less dominated by fossil fuels). The carbon retention time can also vary per product; in general, the carbon is either permanently stored in the product (building materials) or ultimately released to the atmosphere as CO2 (fuels, chemicals). To provide climate benefits, the use of low-carbon energy is critical and the potential of CO2 use to contribute to climate goals will also depend on how far, and how fast, opportunities can be scaled up.
Over time, if global emissions are to reach net-zero, the CO2 used must increasingly be sourced from biomass or through DAC. Such CO2 sources can support a carbon-neutral life cycle for some CO2 use applications and could deliver negative emissions in applications where carbon is permanently stored, such as in building materials. However, in general, these opportunities are likely very limited and must be considered in the context of the product’s entire life cycle.
The challenges of quantifying the climate benefits of CO2 use are discussed in further detail in the next section.

Putting CO2 to Use: Creating Value from Emissions Technical analysis
PAGE | 27
IEA
. All
right
s re
serv
ed.
Systems perspective of carbon capture and storage and CO2 use Figure 15.
CO2 use
IEA 2019. All rights reserved.
CCS results in permanent storage of CO2, while CO2 use involves either permanent storage in building materials or temporary storage in fuels and chemicals.

Putting CO2 to Use: Creating Value from Emissions Technical analysis
PAGE | 28
IEA
. All
right
s re
serv
ed.
Understanding the future market for CO2-derived products and services
Which factors influence the future market? The future market for CO2-derived products and services is challenging to assess, reflecting the early stage of technology development for many applications and the need for supporting policy frameworks. The IEA has identified three interrelated factors that will be key to determining future markets for CO2-derived products and services: scalability, competitiveness and climate benefit (Figure 16).
Strictly speaking, scalability and competitiveness alone are sufficient for the creation of a market. However, for almost all CO2 use applications the potential to contribute to emissions reductions will be central to their future deployment.
Key factors affecting a future market for CO2-derived products and services Figure 16.
IEA 2019. All rights reserved.
The future market for CO2-derived products and services depends on their scalability, competitiveness and climate benefits.

Putting CO2 to Use: Creating Value from Emissions Technical analysis
PAGE | 29
IEA
. All
right
s re
serv
ed.
Scalability The potential market for CO2-derived products and services will depend on both supply and demand-side factors. Demand can vary considerably by region and by specific type of product and service. While some CO2-derived products and services could be traded on large commodity markets (for example, fuels), others would target specific niche markets with limited demand (for example, polymers). On top of existing demand for conventional products, CO2-derived products and services could also unlock new demand, due to lower production costs or superior attributes.
On the supply side, constraints in the availability of key inputs, particularly low-cost renewable energy, CO2, hydrogen, or other raw materials could determine the speed and scale with which CO2-derived products can enter the market.5 Implicit in this is the availability of infrastructure, including transporting hydrogen and CO2 to processing facilities (see Box 3). Similarly to the demand side, limitations on supply can vary significantly by region as well as by type of product or service.
Box 3. Infrastructure needed to deliver hydrogen and CO2
The extensive use of hydrogen and CO2 for conversion into fuels and chemicals would require the deployment of a large-scale transport infrastructure, including pipelines and, in some places, terminals, ships and trucks. A common transport network would benefit individual CO2 use companies, especially small ones, as it delivers economies of scale and provides access to hydrogen and CO2 sources that are not necessarily located close to demand. Further benefits could be achieved by combining CO2 transport for use in products (and services) and geological storage. Similarly, by pooling hydrogen demand coming from several sectors (e.g. industry, transport and heating) and transporting this in one common infrastructure can deliver considerable economies of scale.
Despite the economic benefits, securing investment for infrastructure networks is challenging. Investors must be confident of a large long-term market for hydrogen and CO2 to underpin their investment case. However, such a market is unlikely to emerge without the transport options already available. Given the potential impasse, public support will probably be necessary. In the United States, an extensive network of over 6 000 km of pipelines transports around 60 MtCO2 for EOR. The US EOR industry has grown at a rate unmatched globally, in large part due to the development of its transport network. While EOR is a profitable undertaking, policies have encouraged its development.
Competitiveness The market for CO2-derived products and services will expand if they are competitive. This is determined by their relative cost compared to their conventionally-produced counterparts and other low-carbon alternatives. The main factors affecting the cost of CO2-derived products and services are the costs of technology, energy, CO2 and other raw materials. The contribution of each factor in the total costs varies according to product and service. While capital costs for
5 Potential constraints on the availability of key inputs are discussed below.

Putting CO2 to Use: Creating Value from Emissions Technical analysis
PAGE | 30
IEA
. All
right
s re
serv
ed.
catalysts are typically product-specific, the availability and price of hydrogen and CO2 are relevant for multiple CO2-derived product groups and will be key determinants of the final cost of these products. Therefore, these are discussed in further detail below.
The price and availability of hydrogen If CO2-derived fuels or chemical intermediates that require hydrogen are to contribute to climate change mitigation, hydrogen has to be produced in a low-carbon manner. The main production route today is steam methane reforming (SMR) using natural gas, but this pathway results in around 10 kgCO2 per kgH2. This process can be decarbonised by applying CCS, which would result in production costs of around USD 1.5-2.5/kgH2 (40-90% higher than conventional SMR production), but depends on availability of suitable geological storage sites (IEA, 2019a).
Electrolysis using renewable electricity can also produce low-carbon hydrogen, with costs in the range of USD 2.5-6/kgH2. The competitiveness of clean hydrogen from natural gas with CCS or from renewable electricity (from solar PV or onshore wind) mainly depends on capacity factor and gas and electricity prices (Figure 17). In the short term, hydrogen production from fossil fuels will remain the most cost-competitive option in most regions around the world. Nevertheless, already today, in countries with good renewable resources but dependent on natural gas imports, producing hydrogen from renewables may be more attractive than natural gas SMR with CCS. In regions with cheap domestic gas or coal resources and availability of CO2 storage, production from natural gas or coal may be the more attractive option. In addition to price and availability of resources, local hydrogen transmission and distribution costs might play an important role in the market price for delivered hydrogen as well. Overall, the future hydrogen price will vary widely from region to region.
Comparison of hydrogen production costs from electricity and natural gas with CCS in Figure 17.the near term
Notes: CAPEX: electrolyser USD 700/kWel, SMR w CCS USD 1 360/kWH2; full load hours of hydrogen from natural gas 8 300 h; efficiencies (LHV): electrolyser 70%, gas with CCS 69%; capture rate for gas with CCS of 90%; discount rate: 8%. Source: IEA (2019a), The Future of Hydrogen: Seizing Today’s Opportunities.
Depending on local gas prices, electricity at USD 10/MWh to USD 40/MWh and at full load hours of around 4 000 h is needed for water electrolysis to become cost competitive with natural gas with CCUS.
0
1
2
3
4
5
0 10 20 30 40 50 60 70
USD
/kg
H2
Electricity price (USD/MWh)
Electrolysis, 30%capacity factor
Electrolysis, 50%capacity factor
Electrolysis, 70%capacity factor
Natural gas with CCS,11 USD/MBtu
Natural gas with CCS,3 USD/MBtu

Putting CO2 to Use: Creating Value from Emissions Technical analysis
PAGE | 31
IEA
. All
right
s re
serv
ed.
Regions that are less endowed with renewable resources, such as Japan, can import low-carbon hydrogen from regions with good solar or wind resources, such as Australia. IEA analysis shows that hydrogen imports can be substantially cheaper than domestic production for a number of supply routes, including from Australia to Japan, especially if hydrogen is incorporated into ammonia during transport (IEA, 2019a).
The price and availability of CO2 CO2 needs to be captured, purified and transported. The costs of CO2 capture and purification vary greatly by point source, ranging from USD 15 to 60/tCO2 for concentrated CO2 streams, USD 40 to 80/tCO2 for coal and gas-fired power plants, to over USD 100/tCO2 for small, dilute point sources (e.g. industrial furnaces) (Table 1). Capturing CO2 directly from the air is the most expensive method, with costs reported in academic literature ranging from roughly USD 94 to 232/tCO2, as it implies a much greater energy input than CO2 capture from concentrated point sources (Ishimoto et al., 2017; Keith et al., 2018).6 Over time, capture costs are expected to decrease for most of these applications as a result of technological learning that would arise from wide deployment. Most of the indicated cost figures apply to large-scale CCS applications. The volumes of CO2 anticipated for CO2 use applications are much smaller and could increase capture cost.
Table 1. Selected CO2 capture cost ranges for industrial production
CO2 source CO2 concentration [%] Capture cost [USD/tCO2]
Natural gas processing 96 - 100 15 - 25
Coal to chemicals (gasification) 98 - 100 15 - 25
Ammonia 98 - 100 25 - 35
Bioethanol 98 - 100 25 - 35
Ethylene oxide 98 - 100 25 - 35
Hydrogen (SMR) 30 - 100 15 - 60
Iron and steel 21 - 27 60 - 100
Cement 15 - 30 60 - 120
Notes: Some cost estimates refer to chemical sector and fuel transformation processes that generate relatively pure CO2 streams, for which emissions capture costs are lower; in these cases, capture costs are mostly related to further purification and compression of CO2 required for transport. Depending on the product, dilute energy-related emissions, which can have substantially higher capture costs, can still make up an important share of overall direct emissions. Costs estimates are based on capture in the United States. Hydrogen refers to production via steam reforming; the broad cost range reflects varying levels of CO2 concentration: the lower end of the CO2 concentration range applies to CO2 capture from the pressure swing adsorption off-gas, while the higher end applies to hydrogen manufacturing processes in which CO2 is inherently separated as part of the production process. Iron and steel and cement capture costs are based on ‘Nth of a kind’ plants, reflecting projected cost reductions as technology is applied more broadly. Iron and steel and cement costs are based on capture using existing production routes – however, innovative industry sector technologies under development have the potential to allow for reduced costs in the long term. The low end of the cost range for cement production applies to CO2 capture from precalciner emissions, while the high end refers to capture of all plant CO2 emissions. For CO2 capture from iron and steel manufacturing, the low end of the cost range corresponds to CO2 capture from the blast furnace, while the high end corresponds to capture from other small point sources. Costs associated with CCUS in industry are not yet fully understood and can vary by region; ongoing analysis of practical application is needed as development continues. SMR = steam methane reforming. Source: Analysis based on own estimates and GCCSI (2017), Global Costs of Carbon Capture and Storage, 2017 Update; IEAGHG (2014), CO2 Capture at Coal-Based Power and Hydrogen Plants; NETL (2014), Cost of Capturing CO2 from Industrial Sources.
6 Capture costs reported by direct air capture start-up companies and technology providers are in the range of USD 10/tCO2 to USD 200 /tCO2, which is significantly lower than values in the academic literature (Ishimoto et al., 2017). However, as the assumptions underpinning these cost estimates are often not available, these claims cannot be substantiated. One possible (partial) explanation for the discrepancy in costs is that companies and academics are examining different system designs.

Putting CO2 to Use: Creating Value from Emissions Technical analysis
PAGE | 32
IEA
. All
right
s re
serv
ed.
Transport of CO2 to the end-user can also be a significant cost, depending on the distance and transport mode (pipeline, ship, truck). One of the appeals of DAC is that it could potentially be situated anywhere, provided there is an available energy source, thus avoiding the need for CO2 transport. In general, carbon capture from high concentration CO2 streams in close proximity to CO2 use sites offers the cheapest supply of CO2. Local conditions may, however, require the use of CO2 from more dilute sources, due to the absence of low-cost sources or transport infrastructure.
The price for CO2 is not only affected by the cost of its capture and transport, but also by local market conditions and climate policies. For example, local CO2 supply shortages could drive up prices and increase costs for users of CO2, while a carbon tax could prompt producers of CO2 to sell their CO2 for a lower price than the costs for capture and transport if it can relieve their regulatory responsibility for their CO2 emissions (see section, “Implications for Policies”).
Climate benefits As outlined above, the climate benefits associated with a CO2-derived product or service primarily arise from displacing an equivalent product or service with higher life-cycle CO2 emissions. To determine the climate benefits, a robust life-cycle approach is required that compares the life-cycle CO2 emissions of a CO2-derived product or service with those of a system that provides a product or service with a similar function (reference system). In principle, a cradle-to-grave analysis is required, covering all stages of the value chain, including upstream emissions (fuel extraction, capture, purification and transport of CO2), emissions related to the conversion step, and downstream emissions (further processing of CO2-derived product, final product consumption and waste processing) (Figure 18).7
The current knowledge base on the potential climate benefits of CO2 use is limited. Life-cycle assessments (LCA) show considerable variations in their findings and conclusions, meaning that policy makers and consumers face uncertainty when trying to validate CO2 use as a viable climate mitigation tool. Part of the variation is inherent to CO2 use, as climate benefits can vary significantly depending on the specific circumstances, such as the carbon intensity of the input energy, conversion technology and the source of the carbon. But there are also other factors contributing to this variability, in particular methodological issues related to carrying out LCAs as well as limited availability of reliable data on the large-scale performance of CO2 conversion technologies. Several initiatives are seeking to address these methodological issues (Box 4).
The factors with the largest impact on the climate benefits of CO2-derived products or services are described in the remainder of this section below.
7 However, in some cases, common elements within the reference system can be excluded from the assessment, resulting in a so-called cradle-to-gate analysis. For instance, when comparing the lifecycle emissions of a CO2-derived fuel with those of a chemically-equivalent fossil fuel, the downstream emissions related to the distribution and end-use of the fuel can be excluded since these are similar for both systems.

Putting CO2 to Use: Creating Value from Emissions Technical analysis
PAGE | 33
IEA
. All
right
s re
serv
ed.
Life cycle of CO2-derived products and services Figure 18.
IEA 2019. All rights reserved.
The climate benefit of a CO2-derived product or service depends on its life-cycle CO2 emissions relative to those of a reference product providing the same function or service.
Box 4. Initiatives to develop a common LCA framework
The existing framework for performing LCAs is established in the International Organisation for Standardisation (ISO) 14000 series (ISO, 2006). However, this framework does not provide sufficient guidance for assessments of CO2 use applications, which show several practical complications, including on how to quantify the climate benefits of temporary carbon retention in products. These complications have resulted in large variations in findings across studies. Therefore, there is a need for a common methodological basis to determine climate benefits arising from CO2 use. This includes a clear set of assumptions on key input data and guidelines on how to do an appropriate LCA. Furthermore, data and results should be reported in a harmonised and transparent manner. To this end, several initiatives have started over recent years with the aim of developing a sound basis for LCA work and improve the comparability of various studies.
In 2016, the Global CO2 Initiative at the University of Michigan convened a global expert panel to attempt to “standardise” LCA analysis for CO2 use. Subsequently, a consortium consisting of RWTH Aachen University, TU Berlin, IASS Potsdam, and the University of Sheffield has

Putting CO2 to Use: Creating Value from Emissions Technical analysis
PAGE | 34
IEA
. All
right
s re
serv
ed.
developed standardised techno-economic assessment and LCA methodologies for CO2 use (Zimmermann et al., 2018).
In 2018, the IEA Greenhouse Gas R&D Programme (IEAGHG) published a report setting out an initial methodological approach for compiling a greenhouse gas (GHG) emissions inventory for CO2-derived products, including a CO2 benefits assessment methodology (IEAGHG, 2018).
The US National Energy Technology Laboratory has recently published a document to provide guidance, data, and tools for LCAs of CO2 use applications (Skone et al., 2019). In 2017 the European Union launched a process for benchmarking LCA approaches and methodologies for CO2 use applications. Its aim was to establish a common understanding for a sound basis for LCA work and to improve the comparability of the various studies. The initiative is presently on hold.
Origin of the CO2 CO2 can be taken from several sources: natural underground deposits where CO2 has accumulated over millions of years; anthropogenic CO2 from power plants or industrial facilities, including the combustion or processing of fossil fuels, biomass or other materials; or directly from the air.
Not all sources of CO2 are equally attractive from a climate perspective. The use of CO2 from natural deposits should be avoided as it ultimately results in higher CO2 emissions than if using anthropogenic sources or CO2 from DAC. CO2 use from these sources can deliver climate benefits, but these benefits depend on the potential for displacement of higher-carbon alternatives (which will change over time as key sectors are decarbonised) and whether or not the carbon is permanently stored in the product.
In principle, the use of CO2 from fossil energy and industrial sources, such as cement and iron and steel manufacturing, can be used in the production of fuels and chemicals to deliver climate benefits. Each carbon molecule is being used twice: the carbon contained in a fossil fuel is used to produce energy or in an industrial production process, and then the resulting CO2 is used in combination with hydrogen to produce a carbon-containing fuel or chemical. However, such a system would still involve emissions of CO2 from fossil fuels. From an energy system’s perspective, products or services derived from fossil or industrial CO2 can achieve a maximum emissions reduction of 50% (Bennett, Schroeder and McCoy, 2014). This is because CO2 can only be avoided once: either it can reduce the emissions from the fossil or industrial source when it was captured or it can reduce the emissions of the final product or service (Figure 19). It cannot do both.8 As a crude example, if 1 MtCO2 per year is captured from a coal-fired power plant and converted to a fuel with the same energy and carbon content as the fossil fuel it displaces, 1 MtCO2 is later released when the fuel is combusted. This system has annual emissions of 1 MtCO2 and it displaces a system that produces electricity and fuel separately with combined emissions of 2 MtCO2 per year.9
8 While emissions reductions could be shared, it is not possible to fully reduce the emissions of both point sources. 9 In this simplified case, it is unrealistically assumed that all upstream and direct emissions (from capture, purification, transport and processing of the CO2, including supply of other raw materials such as hydrogen, and the production of the displaced fuel) have no associated emissions.

Putting CO2 to Use: Creating Value from Emissions Technical analysis
PAGE | 35
IEA
. All
right
s re
serv
ed.
In the longer term, if global CO2 emissions are to reach net zero, only non-fossil CO2 sources could be used in applications that ultimately release the CO2. CO2 used for fuels and chemicals production would have to be sourced from sustainably produced biomass, such as anaerobic digestion and fermentation for the production of biogas or bioethanol, or directly from the air.
System’s perspective of emissions reductions from CO2-derived fuels and chemicals Figure 19.
IEA 2019. All rights reserved.
The use of CO2 from fossil or industrial sources can at best mitigate 50% of the system’s emissions; higher emissions reductions require the use of biogenic or atmospheric CO2.
Displaced product or service (reference system) The type of product or service displaced by the CO2-derived counterpart in the marketplace is often difficult to determine, but has a large impact on the climate benefits. The counterfactual product or service can vary depending on the market and CO2 use pathway. For example, in the case of methanol, the counterfactual product could be produced by reforming of natural gas (European market), or coal gasification (Chinese market), the former having a significantly lower carbon intensity than the latter. Also, the counterfactual product or service can change over time as a result of economy-wide decarbonisation efforts. For example, the transport fuel mix will gradually become less dominated by fossil fuels with progressively higher penetration of electric vehicles. To determine the climate benefits, an informed choice needs to be made in LCAs regarding the reference system.10
10 The final product is not the only possible basis for comparison in life-cycle assessment of CO2 use. Two other options can be identified along the value chain: (1) the product from the CO2 source plant (e.g. electricity from coal), or (2) the captured CO2 itself. Possible corresponding comparator products are renewable electricity (1) and geological storage of the CO2 (2). The choice for the basis for comparison and comparator product is critical and will give very different results in terms of potential climate benefits. Given this report’s focus on CO2-derived products, the final product is considered the best basis for comparison.

Putting CO2 to Use: Creating Value from Emissions Technical analysis
PAGE | 36
IEA
. All
right
s re
serv
ed.
Energy input To provide climate benefits, the use of low-carbon energy is critical. This is particularly important for CO2-derived products and services requiring large amounts of energy for the CO2 conversion process, such as fuels and chemical intermediates. Other energy-intensive steps across the life cycle are the capture of CO2 and the transport of raw materials. The use of fossil energy sources, such as coal and gas-fired power plants, would result in high life-cycle emissions, thus offsetting the potential climate benefits arising from the displacement of a more carbon-intensive product or service.
Retention time of carbon in the product The retention time of carbon in a CO2-derived product has a large impact on the climate benefits: the longer the carbon is retained, the smaller the climate impact of the emitted CO2. In some products (building materials), carbon is permanently stored, while in other products (fuels and chemicals) the carbon is only temporarily retained and ultimately released back to the atmosphere in the form of CO2. As can be expected, products offering permanent carbon retention provide the largest climate benefits. Temporary storage can range from less than 1 year for fuels, up to 10 years for most chemical intermediates, to hundreds of years for polymers, while permanent storage in building materials lasts for millions of years. The release of CO2 can also depend on the end-of-life pathway for certain products; for example, plastics may be recycled, incinerated or landfilled. While accounting for permanent carbon retention in LCA assessments is relatively straightforward, current LCA methods were not designed to distinguish between various temporary carbon retention times. Several approaches have been proposed to address this challenge, but consensus among experts has yet to be reached on how to deal with this time-related aspect within LCA assessments.11
Is it possible to assess the future market size? The challenges inherent in assessing the market potential for CO2-derived products and services is reflected in extremely wide-ranging global estimates, from 1 gigatonne (Gt) per year to 7 Gt in 2030 (Table 2). The figure of 7 Gt equates to nearly 20% of the global CO2 emissions today, which is considered extremely optimistic.
Most CO2 conversion technologies are still in an early stage of development and neither their technical performance nor their cost-effectiveness is well understood. Assessing their potential for scale-up necessitates assumptions on future technical performance, costs, time to reach maturity, their relative competiveness over competing production routes, the capacity of industry and consumers to adapt to a new technology, the capacity to overcome inherent industry inertia, and so on. Also, all these factors are highly specific to different applications and sectors. Assessing the future climate mitigation potential of CO2 use is even more challenging; it depends on the carbon-intensity of the energy and material sources as well as on the reference product or service replaced. In practice these are difficult to determine.
11 Current guidelines for LCAs were not designed to account for the carbon retention time and prescribe the use of a constant 100-year global warming potential. This means that products retaining carbon for less than 100 years would count the oxidation and release back to the atmosphere within the life-cycle assessment, whereas products offering storage of longer than 100 years would not.

Putting CO2 to Use: Creating Value from Emissions Technical analysis
PAGE | 37
IEA
. All
right
s re
serv
ed.
Table 2. Estimations of the potential for CO2 use in various publications
Source Year Projection on CO2 Estimate (Gt/yr) Time period
IPCC 2005 Avoidance < 1.0 Medium term
GCCSI 2011 Demand 0.5 - 1.87 Future
DNV 2011 Avoidance 3.7 None provided
Armstrong and Styring 2015 Demand 1.34 2030
Global CO2 Initiative 2016 Demand 7 2030 Note: Some estimates consider the amount of CO2 used, while others estimate CO2 avoided. Sources: Based on IPCC (2005), IPCC Special Report on Carbon Dioxide Capture and Storage; Table 1.4 in GCCSI (2011), Accelerating Uptake of CCS: Industrial Use of Captured Carbon Dioxide, excluding non-conversion uses; DNV (2011), Carbon dioxide utilization – electrochemical conversion of CO2 – opportunities and challenges; Armstrong, K. and P. Styring (2015), Assessing the potential of utilization and storage strategies for post-combustion CO2 emissions reduction; Global CO2 Initiative (2016), Global CO2 initiative launches with ambitious strategy to reduce atmospheric CO2.
In IEA scenario analysis, CO2 use plays a limited role as part of the portfolio of technologies and measures needed to achieve global energy and climate goals (Box 5). Although not a comprehensive examination of the potential for CO2 use12, the analysis finds that cumulative CO2 use would increase by a modest 4% (330 MtCO2) in the period to 2060 in a pathway consistent with the Paris Agreement climate goals – the Clean Technology Scenario (CTS) – relative to the Reference Technology Scenario (RTS). However, in further scenario analysis that limits the availability of CO2 storage while meeting climate goals, the role of CO2 use increases by 77% relative to the CTS (Box 5).
Box 5. The role of CO2-derived products in a clean technology scenario
The IEA Energy Technology Perspectives (ETP) scenario analysis incorporates several pathways for CO2 use: methanol as a raw material for production of chemical intermediates, liquid transport fuels (kerosene, gasoline and diesel) and methane to replace natural gas.13 All three applications require hydrogen for the conversion process, which is produced using renewable electricity.
Three scenarios were explored in recent analysis (IEA, 2019b):
Reference Technology Scenario (RTS): is broadly based on an extrapolation of current trends and builds on current levels of policy ambition.
Clean Technology Scenario (CTS): embodies a vision to reduce global energy-and process-related CO2 emissions by almost 75% in 2060, relative to today.
Limited CO2 Storage scenario variant (LCS): assesses the energy system-wide implications of a possible failure or delay in making CO2 storage available at the scale of the CTS. Limited storage availability could, for example, arise from a lack of investment in the assessment and characterisation of specific storage sites. In the LCS, total cumulative CO2 storage is limited to 10 GtCO2.
12 The analysis considers CO2 use only for the production of methanol, liquid fuels and methane, and excludes non-energy applications (such as building materials). Early-stage CO2 conversion technologies are also excluded due to the considerable uncertainty attached to their technical performance and costs. 13 Further information on the process descriptions, modelling assumptions and scenarios can be found in the report Exploring Clean Energy Pathways: The Role of CO2 Storage (IEA, 2019b).

Putting CO2 to Use: Creating Value from Emissions Technical analysis
PAGE | 38
IEA
. All
right
s re
serv
ed.
The modelling results show that CO2-derived fuels and chemicals play a very modest role in both the RTS and CTS, mainly due to their high CO2 abatement costs relative to other low-emission technologies, such as energy efficiency, fuel switching and CCS. Of the 241 MtCO2 used in 2060 in the CTS, an amount of 195 Mt is generated and used internally in urea manufacturing and 46 MtCO2 is captured from external sources (power plants and industrial facilities) and used for the production of methanol, methane and liquid fuels.
In the LCS, CO2 use starts to expand after 2045 and reaches nearly 900 Mt (0.9 Gt) in 2060. This is relatively small in comparison to the CO2 stored in the CTS in 2060 (5.5 Gt). Other low-emissions technologies and measures – such as energy efficiency measures, innovative industrial manufacturing processes and behavioural changes in transport (for example, higher shares of carpooling) – are deployed to compensate for the emissions reductions otherwise provided by geological CO2 storage in the CTS. This results in considerably higher costs than the CTS (IEA, 2019b).
Captured CO2 for geological storage and use by scenario
Source: IEA (2019b), Exploring Clean Energy Pathways: The Role of CO2 Storage.
CO2 use for methanol and fuel production only plays a role if geological storage is not widely available, but even then its role is limited to the long term.
Limited CO2 storage availability results in nearly six-fold increases in electrolysis-based methanol production by 2060, relative to the CTS, using 61 MtCO2 to produce 44 billion tonnes (240 TWh) of methanol. CO2-derived fuels account for the bulk of the CO2 used, with an amount of around 620 MtCO2 in 2060 to produce 2 010 TWh (7.2 EJ) of liquid fuels and 430 TWh (1.5 EJ) of methane. Compared to the CTS, this reduces global primary oil demand by 8% and gas demand by 2%. To achieve these levels of CO2-derived products, significant efforts are needed in the power sector. To produce the required hydrogen, 5 630 TWh of electricity will be needed in 2060, which represents 10% of global electricity generation in the limited CO2 storage variant. With tightening fossil CO2 emissions constraints over time, only a limited amount of fossil CO2 can be used in products; instead, the bulk of the CO2 used in 2060 will need to come from biogenic or atmospheric sources.
Geological storage Use
0
1
2
3
4
5
6
2030 2040 2050 2060
GtC
O2
per y
ear
RTS
0
1
2
3
4
5
6
2030 2040 2050 2060
CTS
0
1
2
3
4
5
6
2030 2040 2050 2060
LCS

Putting CO2 to Use: Creating Value from Emissions Technical analysis
PAGE | 39
IEA
. All
right
s re
serv
ed.
CO2-derived products and required inputs in a limited CO2 storage scenario
Source: IEA (2019b), Exploring Clean Energy Pathways: The Role of CO2 Storage
CO2-derived products in the limited CO2 storage scenario produce 240 TWh (44 Gt) of methanol and over 2 400 TWh (8.7 EJ) of fuels in 2060, requiring 5 600 TWh of electricity generation and 684 MtCO2.
While the total contribution of CO2 use applications in mitigating climate change is expected to be relatively small in the near-term, a high-level screening of the theoretical potential for CO2 use and its relative climate benefits was carried out (Figure 20). On the x-axis, the theoretical potential for CO2 use refers to the maximum volumes of CO2-derived products and services that would be generated if all conventionally-produced products or services were to be replaced. This analysis is carried out for the five key categories of CO2-derived product and services, as described in the scene-setter section: fuels, chemicals, building materials from minerals, building materials from waste, and the use of CO2 to enhance the yield of biological processes. The chemicals are split into chemical intermediates and polymers. The y-axis shows the relative climate benefits that can be achieved by displacing a product or service with one that has higher life-cycle CO2 emissions, such as fossil-based fuels, chemicals or conventional building materials.
Fuels show the greatest potential because of their vast market size (> 5 Gt/yr), followed by building materials and chemical intermediates (1–5 Gt/yr). Building materials have the greatest climate change mitigation potential, mainly because of their low energy requirements for the CO2 conversion process and the permanent retention of carbon in the product. This is followed by fuels and chemical intermediates. The use of CO2 in polymer processing and greenhouses show the lowest potential, both in terms of potential for CO2 use (0–1 Gt/yr) and in relative climate benefits. In the long term, novel CO2 use applications may be able to deliver greater climate benefits.
Methanol Methane Liquid fuel Biogenic CO₂ Fossil CO₂
0
1 000
2 000
3 000
4 000
5 000
6 000
2030 2040 2050 2060 2030 2040 2050 2060 2030 2040 2050 2060
CO₂-derived products (TWh) Electricity needs (TWh) CO₂ used (Mt)
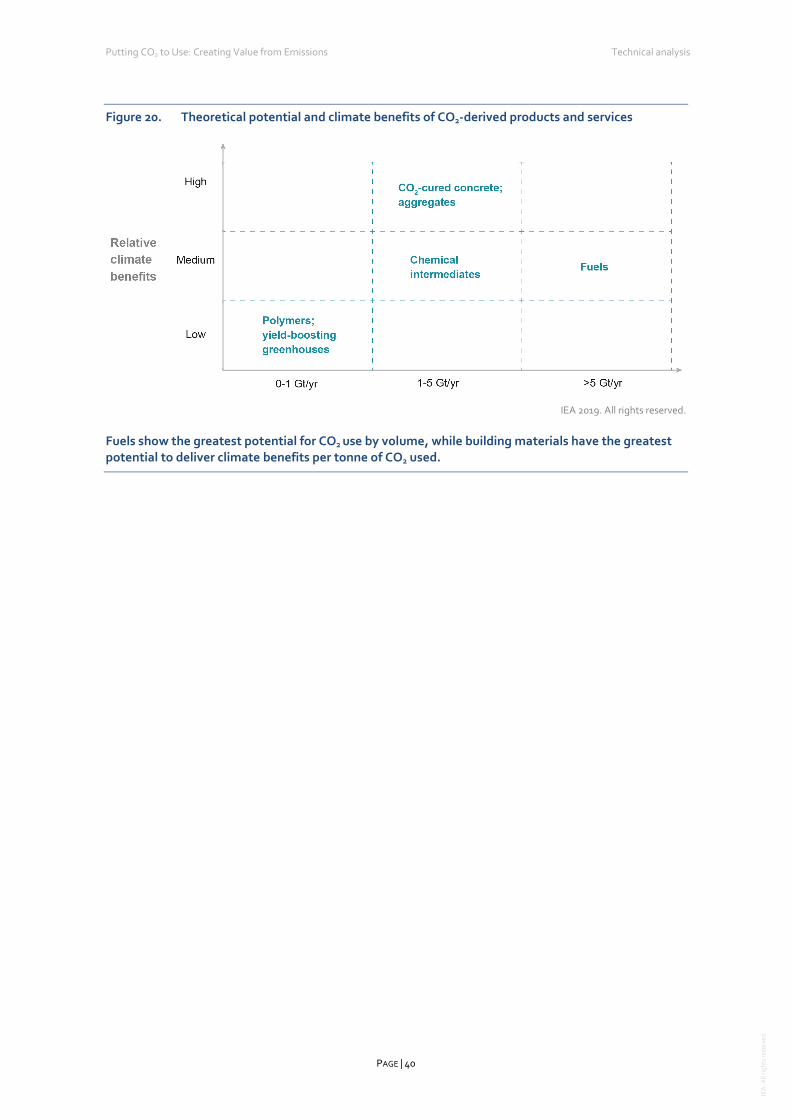
Putting CO2 to Use: Creating Value from Emissions Technical analysis
PAGE | 40
IEA
. All
right
s re
serv
ed.
Theoretical potential and climate benefits of CO2-derived products and services Figure 20.
IEA 2019. All rights reserved.
Fuels show the greatest potential for CO2 use by volume, while building materials have the greatest potential to deliver climate benefits per tonne of CO2 used.

Putting CO2 to Use: Creating Value from Emissions Technical analysis
PAGE | 41
IEA
. All
right
s re
serv
ed.
Scaling up the market
This section identifies the requirements for five key categories of CO2-derived products and services to grow to an initial market size of 10 MtCO2 used per year, which is almost as much as the current CO2 demand for food and beverages. The five CO2-derived products and services are those described in the scene-setter: fuels, chemicals, building materials from minerals, building materials from waste, and the use of CO2 to enhance the yield of biological processes. The evaluation is based on the factors and framework conditions as described in the previous section. The key regulatory requirements for each are also discussed.
CO2-derived fuels
What are CO2-derived fuels? CO2-derived synthetic fuels encompass an array of products that can be manufactured using CO2 as a feedstock. They consist of commercially established products such as methane, methanol and syngas (a gas mixture of carbon monoxide and hydrogen), which can be used directly as a fuel, or as an intermediate to produce a suite of other fuels that are compatible with existing infrastructure, such as diesel, gasoline and aviation fuels. The use of existing infrastructure is typically easier and cheaper than transporting and storing electricity and hydrogen. Most CO2-derived fuels have their application in the transport sector (e.g. methanol as a blend with gasoline), while others (e.g. methane) can be used across multiple sectors, including industry, heating and power generation. CO2-derived fuels may notably be used in sectors in which carbon-containing fuels will continue to play an important role, because the use of carbon-free energy carriers, such as electricity or hydrogen, is extremely challenging. An important example is the aviation sector.
These fuels can be manufactured through a large number of chemical and biological processes. The most technologically mature conversion routes are the direct conversion of CO2 (hydrogenation) into methanol and methane, and indirect conversion whereby the CO2 is first transformed into carbon monoxide (CO), followed by a synthesis step (Fischer-Tropsch) which then produces a range of other fuels (Figure 21). The CO2 use rates are high, with methanol requiring 1.37 tCO2 per tonne of product, and methane requiring 2.74 tCO2 per tonne of product, assuming 100% conversion efficiency. Unlike the chemical compounds making up fossil fuels, CO2 is a very stable, non-reactive molecule with a low energy state, meaning that large amounts of external energy must be supplied to convert it into an energy-rich fuel. The most mature conversion pathways use energy in the form of hydrogen. The overall conversion efficiency is around 50%, but differs per type of fuel (Figure 22). Methane is more energy-intensive to produce than methanol.
The fundamental conversion processes are well understood. The conversion of CO2 to CO has been successfully demonstrated on a small scale, while hydrogenation, and FT and methanol synthesis are technologically mature. Demonstration plants producing methanol and methane have been built in various locations (mainly in Europe); currently, they use hundreds to thousands of tonnes of CO2 per year. The majority of projects have been aimed at

Putting CO2 to Use: Creating Value from Emissions Technical analysis
PAGE | 42
IEA
. All
right
s re
serv
ed.
producing CO2-derived methane, with almost 70 demonstration plants located in particular in Germany and other European countries.
Examples of other CO2-derived fuels that are less technologically mature are formic acid, dimethyl ether, ethanol and butanol, which can be used directly or as an intermediate for the production of other fuels. Several novel conversion routes are being investigated, such as electrochemical conversion of CO2 to CO and direct reactions with the hydrogen (H2) content of water in an integrated, single-step process. This pathway holds the promise of having lower capital costs than the technologically-mature conversion routes. Other conversion routes include photochemical (use of sunlight) and biological processes (use of living organism such as enzymes). However, these processes are still in the early stages of their technological development.
Mature conversion routes for CO2-derived fuels and chemical intermediates Figure 21.
IEA 2019. All rights reserved.
CO2 can be used to produce fuels and chemical intermediates through several conversion routes, but require significant energy input.

Putting CO2 to Use: Creating Value from Emissions Technical analysis
PAGE | 43
IEA
. All
right
s re
serv
ed.
Mature conversion pathways for CO2-derived methane, methanol and diesel Figure 22.
IEA 2019. All rights reserved.
Around 45–60% of the electricity used for the production of CO2-derived fuels is lost during the conversion processes.
Are CO2-derived fuels scalable? Fuels represent one of the largest potential markets for CO2-derived products given high volumes, high market value and the global trend towards low-carbon fuels. Despite the growing importance of electricity as an energy carrier across the economy, chemical fuels will continue

Putting CO2 to Use: Creating Value from Emissions Technical analysis
PAGE | 44
IEA
. All
right
s re
serv
ed.
to play a major role in many sectors. For example, in the absence of stringent climate policies, global crude oil demand for the transport sector is expected to grow over the coming years to approximately 2 880 to 3 100 million tonnes of oil equivalent (Mtoe) (121 to 130 EJ) in 2030, up from 2 567 Mtoe (107 EJ) in 2017 (IEA, 2018a). A relatively large share of transport fuel demand is in market segments with few low-carbon alternatives, especially aviation.
Given the high fuel demand, there are no technical constraints to produce volumes of 7.3 Mt (165 PJ) of CO2-derived methanol or 3.6 Mt (182 PJ) of CO2-derived methane annually, which each correspond to around 10 Mt of CO2 per year. If the necessary hydrogen were to be produced through electrolysis, some 140 TWh of renewable electricity input would be needed. This represents less than 0.5% of current global electricity production. While the energy input and new capacity for hydrogen and fuel manufacturing corresponding with the use of 10 MtCO2 per year would be significant, this can be accommodated if distributed over large areas.
Under what conditions would CO2-derived fuels be competitive?
The main cost components for the production of CO2-derived fuels are the capital expenditure, hydrogen, electricity, and CO2 feedstock. At present, the cost of producing CO2-derived fuels is multiple times higher than the market price in most regions in the world (Figure 23).
Indicative production costs of CO2-derived fuels in the near and long term Figure 23.
Notes: Power-to-liquid fuels refer to the production of hydrocarbon liquid fuels via FT synthesis including upgrading; CAPEX: electrolyser near-term USD 700/kWe and long-term USD 450/kWe long-term, FT synthesis near-term USD 750/kWliq and long-term USD 550/kWliq, methanation near-term USD 740/kwgas and long-term USD 560/kWgas, methanol synthesis near- and long-term USD 46/(tCH3OH/yr); renewable electricity price of USD 50/MWh at 3 000 full load hours in near-term and USD 25/MWh in the long term; CO2 feedstock costs lower range based on CO2 from bioethanol production at USD 30/tCO2 in the near and long term; CO2 feedstock costs upper range based on DAC at USD 400/tCO2 based in the near term and USD 100/tCO2 in the long term; discount rate 8%. Source: IEA (2019a), The Future of Hydrogen: Seizing Today’s Opportunities.
Future cost reductions for CO2-derived fuels will depend on lowering the electricity costs, with cost reductions for CO2 feedstocks also being critical for synthetic hydrocarbons.
0
50
100
150
200
250
300
Near-term Long-term Near-term Long-term Near-term Long-term
CO₂-derived methane CO₂-derived methanol CO₂-derived liquid fuels
USD
/MW
h
CO₂ feedstock costs - high
CO₂ feedstock costs - low
Electricity costs
OPEX
CAPEX
Gas price - USD 7/Mbtu
Methanol price - USD 350/t
Diesel price - USD 75/bbl

Putting CO2 to Use: Creating Value from Emissions Technical analysis
PAGE | 45
IEA
. All
right
s re
serv
ed.
The chief cost factor is typically electricity, accounting for about 40-70% of the production costs. With an electricity price of USD 20/MWh, would be is equivalent to USD 60-70/bbl when used for liquid hydrocarbon production and USD 10-12 per million British thermal units (MBtu) of methane. These prices are already close to the price range of fossil fuel options without adding capital expenditure, operating and maintenance costs (OPEX), CO2 feedstock cost and other costs. Reducing the cost of electricity is therefore an important goal, together with increasing the overall efficiency of the conversion chain. CO2 feedstock costs can be an important further cost component, depending on the price and source of CO2. For example, CO2 feedstock costs of USD 30/tCO2 translate for synthetic diesel into a cost of USD 13/bbl; CO2 feedstock costs of USD 100/tCO2 into a cost of USD 42/bbl.
CO2-derived fuels can be produced competitively in locations where low-cost renewable electricity and CO2 are abundant and prices for fossil fuels are high. An example is Iceland, where methanol is commercially produced from geothermal energy and CO2 (Box 6). Over time, production costs of CO2-derived fuels are expected to come down, mainly due to capital cost reductions and availability of cheap renewable electricity and feedstock CO2 (Figure 23). Nevertheless, CO2-derived methane and CO2-derived liquid fuels, such as diesel or aviation fuels, will continue to be uncompetitive in the absence of a stringent CO2 price regime. On the other hand, in the long term, CO2-derived methanol may become competitive in more regions in the world, depending on local methanol market prices.
High CO2 prices (or equivalent policies discouraging fossil fuel use) would be needed for CO2-derived methane, methanol and CO2-derived diesel to become competitive with fossil fuel alternatives. If for example synthetic diesel can be produced at costs of USD 150/bbl, an equivalent CO2 price of USD 180/tCO2 would be needed for synthetic diesel to become competitive with fossil diesel at USD 75/bbl (Figure 24). The high level of equivalent CO2 prices that would be needed for synthetic hydrocarbon fuels from electrolytic hydrogen to compete with fossil fuels suggests that the use of synthetic hydrocarbon fuels at a larger scale is unlikely in the near term.
CO2-derived fuels must also compete with other low-carbon energy carriers. As the production of CO2-derived methanol and methane involves energy losses with each conversion step, i.e. from electricity to hydrogen to fuel, it will be unable to compete with hydrogen and electricity on an energy basis (Figure 22), unless the costs of the additional conversion steps are lower compared to the cost of a new hydrogen and electricity infrastructure. In sectors where direct use of hydrogen and electricity is extremely challenging, for example in aviation, CO2-derived fuels must compete with other low-carbon energy carriers such as biofuels.

Putting CO2 to Use: Creating Value from Emissions Technical analysis
PAGE | 46
IEA
. All
right
s re
serv
ed.
Indicative production costs of CO2-derived fuels for various full load hours and CO2 price Figure 24.penalty needed for competitiveness with their fossil counterparts
Notes: Left axes show the production costs for CO2-derived methane, methanol and diesel, while the right axes show the CO2 price needed to reach competitiveness with natural gas at USD 7/MBtu, fossil methanol at USD 350/t and fossil diesel of USD 75/bbl; FLH: full load hours; CAPEX: electrolyser USD 450/kWe, methanation USD 560/kWgas; methanol synthesis USD 46/(tCH3OH/yr), FT synthesis USD 560/kWliq; efficiency (LHV): electrolyser 74%, methanation 77%, FT synthesis 73%,; energy consumption: methanol synthesis 1.5 GJ/ tCH3OH; CO2 feedstock costs USD 30/tCO2; discount rate 8%. Source: Analysis based on IEA (2019a), The Future of Hydrogen: Seizing Today’s Opportunities.
A combination of low electricity costs and high CO2 prices is needed to make CO2-derived methane, methanol and diesel competitive with their fossil counterparts.
Box 6. Demonstration plants producing fuels from CO2 and H2
Over the past decade, several firms have built demonstration plants producing methane and methanol from electrolytic H2 and CO2. Two well-known examples are plants built by Audi and Carbon Recycling International (CRI). A large number of pilot plants have also been developed by companies such as AFUL Chantrerie, E.ON, RWE, Thüga Group and Korea Gas Corporation.
0
170
340
510
680
850
10
20
30
40
50
60
0 20 40 60 80
CO2
pric
e ne
eded
at U
SD 1
0/M
Btu
(USD
/tCO
2)
USD
/Mbt
u
Electricity costs (USD/MWh)
CO₂-derived methane
0
100
200
300
400
500
150
250
350
450
550
650
0 20 40 60 80
CO2
pric
e ne
eded
at U
SD 1
0/M
Btu
(USD
/tCO
2)
USD
/ton
ne
Electricity costs (USD/MWh)
CO₂-derived methanol
0
180
360
540
720
75
150
225
300
375
0 20 40 60 80
CO2
pric
e ne
eded
at U
SD 7
5/bb
l (U
SD/t
CO2)
USD
/bbl
Electricity costs (USD/MWh)
CO₂-derived diesel
FLH 2 000h FLH 3 000h FLH 5 000h

Putting CO2 to Use: Creating Value from Emissions Technical analysis
PAGE | 47
IEA
. All
right
s re
serv
ed.
The Audi e-gas plant in Werlte, Germany, is the largest facility to produce synthetic methane from CO2 and hydrogen generated from renewable electricity. The facility began operations in 2013 and has a rated output capacity of around 1 kt/yr. It obtains around 2.8 kt of CO2 per year from the exhaust gas of a biomethane plant in the immediate vicinity. By feeding the synthetic methane into the local gas grid, renewable energy is chemically stored and CO2 emissions from displaced natural gas are avoided (Audi, 2019).
The largest CO2-based fuel plant in operation today is the George Olah Renewable Methanol facility located in Svartsengi, Iceland. The facility, built by CRI in 2012, converts around 5.6 kt of CO2 per year into methanol using electrolytic hydrogen. The required energy comes from the Icelandic grid, which provides electricity generated from hydro and geothermal sources. The CO2 is imported from a geothermal power plant located nearby, where it is a by-product of steam extracted from geothermal reservoirs which would otherwise be vented into the atmosphere. In 2015, CRI expanded its original output capacity of 1 000 tonnes per year to more than 4 000 tonnes per year. The product, called “vulcanol”, is sold on the market in Iceland and abroad where it is blended with gasoline and used in the production of biodiesel. CRI claims that vulcanol reduces CO2 emissions by more than 90% compared to fossil fuels over the complete life cycle of the product (CRI, 2019). The CRI methanol facility is a good example of how lower-emission CO2-derived fuels or chemicals can be competitive in regions with ample and low-cost renewable energy and CO2.
Can CO2-derived fuels deliver climate benefits? The CO2 footprint of CO2-derived fuels can vary significantly, depending mainly on the energy use, carbon intensity of the energy and the type of displaced product. The use of natural gas-based hydrogen (without CCS) and carbon-intensive electricity from the grid can result in higher life-cycle CO2 emissions for CO2-derived fuels compared to the conventional fossil fuel-based production routes (Al-Kalbani et al., 2016; Reiter and Lindorfer, 2015). To achieve climate benefits, the use of low-carbon energy is critical. In a best case scenario, assuming the use of low-carbon energy and zero energy requirements for CO2 capture and purification, GHG emissions reductions of 0.5 to 1.0 tonne CO2-eq per tonne methanol are possible for both the direct and indirect conversion pathways, which equate to a 74% to 93% reduction as compared to the conventional production route (Artz et al., 2018). Similarly, under ideal conditions, assuming the use of wind electricity and heat integration, GHG emissions reductions of 0.03 to 0.05 tonne CO2-eq per MWh methane were found, which equate to a 54% to 87% reduction as compared to the conventional production route (Artz et al., 2018).
CRI claims that its production plant in Iceland reduces carbon emissions by more than 90% compared to fossil fuels over the complete product life cycle, from extraction and production to end use (CRI, 2019). However, the underlying assumptions are not reported. Furthermore, these emissions reduction potentials pertain to the fuel substitution only; from an energy system’s perspective the maximum emissions reductions are 50% if the CO2 originates from fossil or industrial sources (see previous section).

Putting CO2 to Use: Creating Value from Emissions Technical analysis
PAGE | 48
IEA
. All
right
s re
serv
ed.
What are the regulatory requirements? Fuel quality standards specifying technical requirements for transport fuels may currently limit the use of CO2-derived fuel. For example, most fuel quality standards worldwide restrict methanol blends with fossil gasoline for use in conventional car engines to several per cent by volume (Alberici et al., 2017). Fuel testing and warranties from engine manufacturers are needed before novel fuels can be earmarked as suitable and can be compatible with the existing infrastructure of road or aviation transport.
Table 3. Scaling up to a 10 MtCO2 market for CO2-derived fuels
Technology No major technological breakthroughs needed.
Scalability
The fuel market is large enough to absorb well in excess of 7.3 Mt of methanol or 3.6 Mt of methane, which would each correspond to the conversion of 10 Mt CO2/yr. Significant amounts of low-carbon energy are required. Production capacity for fuels and low-carbon hydrogen is needed.
Competitiveness
CO2-derived fuels are currently not competitive with fossil fuels in most regions of the world, nor with many other alternative energy carriers, such as the direct use of electricity and hydrogen. Low-cost renewable energy and CO2 are prerequisites.
Climate benefits Low-carbon hydrogen is essential to achieve climate benefits. Emissions reductions of up to 90% relative to convention fuels have been reported, but verification is needed.
Regulation and other issues
Fuel quality standards restrict methanol blends with gasoline. Extensive fuel testing and warranties from engine manufacturers are needed. Some emission standards are based on tailpipe emissions rather than on life-cycle emissions.
CO2-derived chemicals
What are CO2-derived chemicals? CO2-derived chemicals include a wide range of carbon-containing substances, including plastics, fibres, solvents and synthetic rubber. CO2 is used as a raw material to produce a number of intermediate chemicals, which can then be processed into an array of more complex chemicals. These intermediate chemicals – e.g. ethylene, propylene and methanol – are produced in large volumes and can also be finished products in themselves. Of the intermediate chemicals that can be created from CO2, the production process of methanol and methane is most technologically mature and can serve as a source for various other intermediate chemicals.
The two most important intermediate chemicals that can be derived from methanol are olefins (e.g. ethylene, propylene), which are widely used in the production of polymers to manufacture plastics, and aromatics (e.g. benzene, toluene, xylene), which are used for the production of plastic, but are also used in health and hygiene, food production and processing, information technology and other sectors. Methanol-to-olefins technology is currently deployed at commercial scale in China, accounting for 9 million tonnes per year (Mt/yr) or 18% of domestic high value chemicals production in 2018 (IEA, 2019a). Methanol-to-aromatics, which is used to produce more complex HVC molecules, is currently still in the

Putting CO2 to Use: Creating Value from Emissions Technical analysis
PAGE | 49
IEA
. All
right
s re
serv
ed.
demonstration phase (IEA, 2018c). Other production pathways, such as oxidative methane coupling, which involves a reaction between oxygen and methane into higher value chemicals, are in even earlier stages of development.
The amount of energy that must be added to convert CO2 varies significantly per type of chemical. In general, producing chemicals from CO2 that are rich in oxygen or contain a so-called carbonate group (CO3) requires much less energy than producing olefins and paraffins (for example methane) that only contain carbon and hydrogen. Furthermore, several conversion routes result in a mix of different substances, meaning that a lot of energy needs to be added to separate the CO2-derived chemical from other substances (Artz et al., 2018). Examples of chemicals with a CO3 group are sodium carbonate (soda ash) and sodium bicarbonate (baking soda) – valuable chemicals for glass manufacture, cleaning agents and detergents – which can be manufactured from CO2 and underground aqueous salt solutions (brine), seawater or salt (NaCl). The chemical process often involves electrolysis to convert the salt-containing substance into a solution of sodium hydroxide. This solution is then reacted with CO2 to produce soda ash or baking soda. Several companies are active in using captured CO2 to produce soda ash and baking soda today. The two largest companies are Carbon Free Chemicals (Skymine® process) and Searles Valley Minerals (Carbon Free Chemicals, 2019; Searles Valley Minerals, 2019). Another example of a company active in this field is Carbon Clean Solutions, which annually captures 60 ktCO2 from a coal-fired power station near Chennai, India. The captured CO2 is used by Indian firm Tuticorin Alkali Chemicals and Fertilizers for soda ash production (Alberici et al., 2017).
Polymers are a special group of chemicals that are used in the production of plastics and resins. CO2 can be used in the manufacturing process by replacing part of the fossil-based feedstock (Figure 25). The most mature and widely pursued variant for CO2 use is polycarbonate, which can contain up to 50% CO2 by weight. Unlike the conversion of CO2 to fuels and intermediate chemicals, the use of CO2 in polymer manufacturing does not require significant energy input for the conversion process itself. The energy for conversion is provided by the fossil feedstock – so-called epoxides – in the polymer molecule that is not replaced by the CO2. A number of companies, such as Asahi Kasei Chemicals, Chi Mei Corp and Covestro, are commercially producing polymers using CO2 (Fukuoka et al. 2007; Covestro, 2018). CO2-derived chemicals, such as formic acid, dimethyl ether, formaldehyde and acetic acid, are still in the early stages of development, but may prove promising in the long term (CarbonNext, 2017). Other future opportunities are related to the production of novel materials such as carbon nanofibers (e.g. graphene) using CO2 from air in electrochemical processes (SAM, 2018). However, this pathway is dependent on wider evolution of markets for such materials. The technology is at very early stages of RD&D.
The main value proposition of CO2-derived chemicals is the provision of a carbon-containing chemical with lower costs and/or a lower environmental impact than their fossil equivalents. Some chemical feedstocks cannot be decarbonised as the carbon is inherent in providing its structure and properties. Apart from biomass and waste, CO2 is one of the few carbon building blocks that can be used as an alternative raw material for carbon-containing chemicals.

Putting CO2 to Use: Creating Value from Emissions Technical analysis
PAGE | 50
IEA
. All
right
s re
serv
ed.
Mature conversion pathways for CO2-derived polymeric materials Figure 25.
IEA 2019. All rights reserved.
CO2 can be converted into polymers, which can be used in a wide variety of products.
Are CO2-derived chemicals scalable? The large size of the market for carbon-containing chemicals represents an important opportunity for CO2-derived chemicals, especially because of the need to reduce the use of fossil feedstocks. A large share of these organic chemicals can be produced by using CO2-derived methanol as a chemical building block.
Recent data on the global market size of baking soda and soda ash is limited, but is estimated to be around 2.5 Mt/yr and 55 Mt/yr, respectively (Merchant Research & Consulting, 2015; Alberici et al., 2017). To fulfil the global annual demand with CO2-derived soda carbonates, some 0.7 MtCO2 (baking soda) and 12.0 MtCO2 (soda ash) would be required.14
CO2-derived polycarbonates can replace their fossil counterparts, which are usually further processed into other polymers. A promising application of polycarbonates is in the upgrading to polyurethane, which is used in foams, coatings and other products. The global market for polyurethane is expected to reach 22.0 Mt in 2018, based on a compound annual growth rate of 7.5% between 2015 and 2020 (MRS, 2016). Over time, early stage applications of CO2 use in polycarbonates may open up new markets, such as elastomers, rubbers and coatings.
There are no technical constraints to produce 3.6 Mt of methanol or 20 Mt of polyurethane,15 which would individually correspond to the use of 10 Mt of CO2. As for the fuel market, significant amounts of low-carbon electricity would be required for the production of CO2-derived methanol. Producing all primary chemicals from CO2 would have large implications in terms of energy and raw material requirements (Box 7). 16
14 Based on a CO2 use rate of 0.26 tCO2 per tonne of baking soda and 0.21 tCO2 per tonne of soda ash. 15 The market for polyurethane is just large enough to absorb 10 Mt of CO2-derived polycarbonates. If needed, other polymer markets can absorb polycarbonates as well. 16 “Primary chemicals” is the collective term for ammonia, methanol, olefins and aromatics.

Putting CO2 to Use: Creating Value from Emissions Technical analysis
PAGE | 51
IEA
. All
right
s re
serv
ed.
Box 7. Producing all primary chemicals from CO2: how much electricity and raw materials would be needed?
The substitution of fossil fuels with CO2 as a raw material for chemicals production entails the consumption of considerable amounts of resources. Many process routes require significant energy to generate hydrogen for the transformation of CO2, particularly where electrolysis is used. In addition to electricity, water and CO2 are needed for the production of CO2-derived chemicals.
The IEA carried out a thought exercise, or “what if” analysis, in order to get a sense of the order of magnitude of the CO2, electricity and water needs to meet primary chemical demand in the future. Primary chemicals is the the collective term for ammonia, methanol, olefins and aromatics. In this exercise, methanol and ammonia are made from electrolytic hydrogen and used as a chemical building block to produce an array of end-use chemicals. The analysis was not part of a scenario, but was undertaken as a separate exercise.
To fulfil the global primary chemical demand, some 1.4 GtCO2 would be required in 2030. If primary chemicals sourced from the refining sector are also included, this figure would further rise to approximately 2.3 GtCO2. To put these quantities into perspective, the combined direct CO2 emissions of energy-intensive industries, excluding the chemicals sector, are projected to make up around 4.2 GtCO2 by 2030 in the CTS (IEA, 2018c).
Approximately 11.7 petawatt hour (PWh) of electricity is required in 2030, of which approximately 75% is consumed by electrolysers for the production of hydrogen. The remainder is primarily used to convert methanol into end-use chemicals. If primary chemicals sourced from the refining sector are also included, some 17.4 PWh are required by 2030. To put these figures into perspective, the current global electricity generation is 26.7 PWh, while the projected electricity consumption for the industrial sector is 1.6 PWh by 2030 in the CTS (IEA, 2018c). A complete shift to a CO2-based global primary chemical supply would therefore require many times the 2 336 gigawatts (GW) of currently installed global renewable generation capacity, especially because many renewable power technologies have low utilisation factors. At the same time, the electrification of the primary chemicals supply could represent an opportunity to enhance flexibility in the electricity grid. The large fleet of electrolysers could be used to reduce load (ramping down) or absorb surplus supply of electricity (ramping up).
In addition to very large increases in global electricity demand, replacing fossil feedstocks for chemicals production with CO2 would have a significant impact on water consumption. In the “what if” analysis, feedstock water consumption for the production of primary chemicals is 2.2 Gt, which is around three and a half times greater than in the CTS in 2030. The high water intensity of CO2-derived chemicals could be a constraint for areas with limited water availability. A careful selection of the location for electricity-based hydrogen production capacity would therefore need to consider access to local water resources. The use of sea water as a feedstock for electrolysis could help avoid water stress issues, provided this technology could be further developed and become cost effective. Water desalination and purification is another way to make use of sea water and avoid any contribution to water stress issues, but is an energy-intensive process in itself.

Putting CO2 to Use: Creating Value from Emissions Technical analysis
PAGE | 52
IEA
. All
right
s re
serv
ed.
Electricity and raw materials requirements for production of chemical intermediates
Notes: CTS = Clean Technology Scenario. The CTS numbers apply to: chemicals sector (category Electricity), primary chemical production (category Feedstock water) and energy-intensive industries (cement, iron and steel, pulp and paper and aluminium, but excluding the chemicals sector) (category CO2). The energy required to produce primary chemicals from refining is estimated based on the average energy intensity of end-use chemical production in 2017.
Source: IEA (2018c), The Future of Petrochemicals: Towards a More Sustainable Chemical Industry.
Some 17.4 PWh of renewable electricity, 2.2 Gt of feed water and 2.3 Gt of CO2 would be needed to satisfy all primary chemical demand with CO2-derived chemicals in 2030.
* The CTS embodies a vision to reduce global energy- and process-related CO2 emissions by almost 75% in 2060, relative to today. Further information can be found in IEA (2018c).
Under what conditions would CO2-derived chemicals be competitive?
Most commodity chemicals have highly optimised production chains and low profit margins, thus making it difficult for CO2-derived chemicals to compete. As for CO2-derived fuels, low-cost renewable electricity and significant cost reductions along the value chain are needed to make CO2-derived methanol competitive. Willingness to pay for CO2, however, is expected to be higher than for fuels due to the higher value of chemicals per tonne of CO2 used.
The production costs of CO2-derived soda ash and baking soda are unclear. A public study indicated production costs for CO2-derived soda are between USD 800-1500 /t, which is several times higher than the market price (USD 200-350 /t) (ADEME, 2014; Trading Economics, 2019).17 One of the main cost drivers is electricity needed for the electrolysis of the salt solution.
CO2-derived polymers are expected to be more competitive in the market, due to the relatively low energy requirements for their production and their high market value. Some claim that
17 Based on a conversion rate of 0.78 GBP/USD for the year 2017 (OECD, 2018).
CTS Primary chemicals from the chemicals sector Primary chemicals from refining
0
4
8
12
16
20
CTS CO₂ pathway
Electricity
PWh
0
1
2
3
4
5
CTS CO₂ pathway CTS CO₂ pathway
Feedstock water CO₂
Gt

Putting CO2 to Use: Creating Value from Emissions Technical analysis
PAGE | 53
IEA
. All
right
s re
serv
ed.
certain polycarbonates may be even 15% to 30% cheaper than fossil-based counterparts, provided that the CO2 is considerably cheaper than the petroleum-based feedstock it replaces, which can be the case for polyurethanes (Alberici et al., 2017). In some instances, existing polymer plants can be used with minimal retrofits, but this depends on the specific type of process and polycarbonates produced.
Several companies have already announced that they have reached the commercialisation phase (Box 8). Production costs will, however, depend on the specific application of the polycarbonate and the market price of the final product in which it is used. Apart from fossil feedstock, CO2-derived chemicals will also have to compete with other low-carbon products in the future, such as bio-based chemicals.
Box 8. Commercial production of polycarbonates from CO2
A number of companies developing CO2-derived polycarbonates announced they have reached the commercialisation phase. Large-scale plants have been built, or are under construction, in various locations around the world.
Chimei Asai, a joint venture of Asahi Kasei Chemicals and Chi Mei Corp, has been operating a polycarbonate plant in Chinese Taipei since 2002. It produces 150 000 tonnes per year and was the first commercial plant to announce that it had succeeded in producing polycarbonates using CO2 as a starting material. Reported emissions reductions are 0.173 tCO2 per tonne polycarbonate product compared to the conventional pathway (Fukuoka et al. 2007).
In 2016, Covestro commissioned a commercial plant producing 5 000 tonnes of polycarbonates per year at Dormagen, Germany. Once in operation, the facility will use CO2 to substitute a portion of the fossil feedstock normally fed into the production process, resulting in a CO2 content of around 20% by weight in the final product. The product will be used as a feedstock for the production of foams for mattresses and furniture (Covestro, 2018). Savings in life-cycle GHG emissions were estimated to be around 15% relative to the conventional production process (von der Assen, 2015).
The company Novomer, purchased by Saudi Aramco in 2016, is due to start a commercial production facility with a capacity of 50-100 kt/yr of CO2-derived polycarbonate in 2019 in Texas, United States. The company produces polymers that contain up to 50% CO2, which can be used in several industrial applications, such as coatings and foams (Alberici et al., 2017).
Can CO2-derived chemicals deliver climate benefits? The CO2 used for the production of chemicals is eventually released back into the atmosphere at the end of the lifetime of the material. As a result, potential climate benefits will come from the displacement of conventionally-produced chemicals with higher life-cycle emissions. In a best case scenario, assuming the use of low-carbon energy and zero energy requirements for CO2 capture and purification, GHG emissions reductions of 0.5 to 1.0 tonne CO2-eq per tonne methanol are possible, which equate to a 74% to 93% reduction as compared to the conventional production route (see previous section).

Putting CO2 to Use: Creating Value from Emissions Technical analysis
PAGE | 54
IEA
. All
right
s re
serv
ed.
The climate benefits of CO2-derived polycarbonates depend mainly on the percentage of CO2 that can be absorbed. For a polycarbonate containing 20% by weight of CO2, life-cycle CO2 emissions reductions of 15% relative to the conventional production process from fossil-based feedstock have been reported (von der Assen, 2015).18 Larger emissions reductions are possible when low-carbon energy is used; in fact, climate benefits could even exceed the amount of CO2 incorporated in the molecule, due to the displacement of energy-intensive epoxides as raw material (Artz et al., 2018). The climate benefits of CO2-derived baking soda or soda ash have not been considered in literature or in publicly-available studies.
What are the regulatory requirements? Chemicals from CO2 will have to meet industrial quality standards and regulations on safety. The properties of CO2-derived materials may differ slightly from conventionally produced chemicals and have an impact on downstream processes (Alberici et al., 2017). Extensive testing and official approval by government agencies is needed before these chemicals can be used, or be accepted, by companies as a building block for their end-use applications.
Table 4. Scaling up to a 10 MtCO2 market for CO2-derived chemicals
Technology No major technological breakthroughs needed.
Scalability
The chemicals market is large enough to absorb around 3.6 Mt of methanol, 20 Mt of polyurethane or 48 Mt of soda ash, which each correspond to the conversion of 10 MtCO2/yr. Production capacity for chemicals and low-carbon hydrogen is needed; existing polymer production capacity can be used in some instances. Significant amounts of low-carbon energy are required for methanol production.
Competitiveness
CO2-derived methanol is currently not competitive with fossil counterparts in most regions of the world. Low-cost renewable energy is a prerequisite. Some CO2-derived polycarbonates may already be competitive with their fossil-based counterparts.
Climate benefits
Low-carbon hydrogen is essential to achieve climate benefits for CO2-derived methanol. The climate benefits of baking soda and soda ash remain unclear. Climate benefits for polycarbonate depend mainly on the percentage of CO2 that can be absorbed.
Regulation and other issues
Industrial quality standards and regulations on environment and safety are required. Extensive testing and official approval by government agencies are required to allow use in end-use applications and create acceptance in industry.
CO2-derived building materials from natural minerals
What are CO2-derived building materials? CO2 can be used as an input in the concrete production process. In principle, CO2-derived concrete could be used for the same applications as conventional concrete, provided the
18 Lignite-fired electricity was assumed to be used in the reference case.

Putting CO2 to Use: Creating Value from Emissions Technical analysis
PAGE | 55
IEA
. All
right
s re
serv
ed.
material properties are similar or better. Concrete is a mixture of cement, water and solid aggregates, such as sand, gravel and crushed stone. It can be produced as ready-mixed concrete which is transported in trucks and set on site, or as pre-cast concrete products. CO2 can be used as a component of the filler (aggregate), as a feedstock in the production of the binding material (cement), and as input for concrete curing (Figure 26). All three applications are built around the same fundamental chemical process involving the reaction of CO2 with minerals, e.g. calcium oxide (burnt lime) or magnesium oxide (magnesia), to form carbonates, which is the form of carbon that makes up concrete. Under the right conditions, CO2 can be transformed into a carbonate without the need for external energy to drive the reaction. However, the CO2 use rates, which vary between 0.02% and 3% by weight of concrete, are much lower than for fuels and chemical intermediates (ICEF, 2017).
Concrete curing refers to a series of processes that occur when water, cement and aggregates are mixed. During these processes, cement is converted into interlocking crystals binding the elements of concrete together, which gives the material its strength. By injecting CO2 as part of the concrete mixing process, water is replaced by CO2 to produce calcium carbonate. In fact, this process occurs naturally in regular concrete, but at a very slow rate as the CO2 from the air penetrates the concrete at a rate of only a couple of millimetres per year (Alberici et al., 2017). For pre-cast concrete, this process can be complemented by using curing chambers with an elevated CO2 concentration.
The integration of CO2 in the production of cement itself, by reacting it with magnesium minerals or other materials, is a more complex process that is in an earlier stage of development than CO2-cured concrete. A possible advantage of novel cement is that it can use low-grade CO2 or even flue gas coming directly from industrial processes or power plants (Alberici et al., 2017). Both applications of using CO2 result in a reduction of the amount of cement needed in the concrete mixture, thus leading to reduced energy use and CO2 emissions from the production of cement. Aggregates made from CO2 and natural minerals are still in their early development stage and have not been demonstrated at scale. As CO2-curing is the most technologically mature process, the rest of this section focuses on this application.
The main value proposition for companies to use CO2 is to make concrete with higher performance and a smaller CO2 footprint than conventional building materials. Other potential benefits are shorter curing times, less water consumption, and a higher strength of concrete compared to conventional practices and products, thus reducing the demand for cement and cost per unit of concrete produced.
Mature conversion pathway for CO2-derived building materials Figure 26.
IEA 2019. All rights reserved.
CO2-derived building materials can be made from CO2 through a carbonation process.

Putting CO2 to Use: Creating Value from Emissions Technical analysis
PAGE | 56
IEA
. All
right
s re
serv
ed.
Are CO2-derived building materials scalable? Concrete and cement are among the most widely manufactured materials on the planet. Each year, around 30 billion tonnes of concrete are produced globally from a production base of approximately 4.2 billion tonnes of cement, and demand is set to grow further over the coming decades, due to growing populations and infrastructure needs (IEA, 2018d; NASEM, 2019).
Replacing all conventional concrete with CO2-cured concrete has been estimated to create a demand for CO2 of up to 1 000 MtCO2 globally today, and up to 1 200 MtCO2 in 2030 (ICEF, 2017). The use of 10 MtCO2 per year corresponds to approximately 300 million tonnes of CO2-cured concrete. CO2-cured concrete can be applied to the market for pre-cast concrete products and ready-mixed concrete that is cured with CO2 and water at the plant before being transported to its final destination. Applying CO2 to the concrete mixture at the construction site is more challenging, due to the need for special facilities on the ground.
While the construction sector offers large material flows, the manufacture of construction materials is a localised activity. For example, in the United States alone there are over 5 500 ready-mix concrete plants, hundreds of precast concrete plants and nearly 100 cement production plants. This implies that if CO2 is to be used in building materials on a large scale, CO2 will need to be consumed in many discrete locations (NASEM, 2019). Unlike in cement plants, there are no large sources of CO2 available in concrete plants. One of the logistical challenges is that CO2 sources and concrete plants are not always located in the same place, thus requiring transport over large distances, which can impact the economic viability of the manufactured product. The energy requirements for CO2-derived concrete products are relatively minor, provided the transport of cement and CO2 can be minimised.
Under what conditions would CO2-derived building materials be competitive?
Cement and concrete are highly standardised products in a low-margin and competitive market. The construction industry is conservative and has showed a slow uptake of new products in the past, thus making it difficult for novel building materials to enter the market. However, there is potential for CO2 curing technologies to produce concrete with lower production costs and higher strength than with conventional curing routes. The main cost savings come from the reduced time required for the curing process and a lower demand for cement in the concrete mix. The market value and uptake potential of CO2-cured concrete will ultimately depend on the costs, characteristics and applicability in various sectors as well as its acceptance by the industry. The low-carbon nature of these products could further improve their competitiveness in places where this is valued. Some companies working on concrete curing technologies claim to be able to mitigate emissions via CO2-curing at a CO2 abatement cost of less than 6 USD/tCO2 (Alberici et al., 2017).19
Companies using CO2 curing technology are likely willing to pay a higher price for feedstock CO2, mainly because relatively little CO2 is used in the process. CarbonCure has indicated that they can make commercially viable concrete from CO2 curing using merchant CO2 of USD 400 /t in a market with a cement price of USD 110 /t (CarbonCure, 2018).20 While CarbonCure has been using
19 Based on a conversion rate of 0.78 GBP/USD for the year 2017 (OECD, 2018). 20 This is based on a CO2 emissions intensity of the cement of 1.04, a CO2 mineralisation rate of 90% and a CO2 mineralisation rate 90%.

Putting CO2 to Use: Creating Value from Emissions Technical analysis
PAGE | 57
IEA
. All
right
s re
serv
ed.
purified CO2, this technology may allow for the use of less pure forms of CO2, which could further enhance the commercial viability of concrete from CO2 curing (Alberici et al., 2017). Several firms are pursuing commercially opportunities for CO2-cured concrete or novel cement technologies (Box 9).
Box 9. Commercialisation of CO2-derived cement and concrete
Two North-American companies are leading the development and marketing of CO2-derived concrete.
Founded in 2007, Canadian company CarbonCure has developed a commercial CO2 curing process that can be retrofitted to conventional “ready-mix” concrete plants. The process allows for the use of existing equipment and has little impact on the manufacturing conditions. In mid-2018, the CarbonCure process had already been adopted in 25 masonries and 54 ready-mix installations, with at least 15 more being retrofitted at the time, mainly in North America (CarbonCure, 2018). More recently, CarbonCure’s technology is available in nearly 150 concrete plants (Edelstein, 2019). CarbonCure claims that their product has better compressive strength and is more cost-effective than concrete from Portland cement. The CarbonCure process was primarily developed to create a high-value product with improved performance and lower costs rather than because of its low-carbon attributes. The company expects its main revenues to come from product sales and not from a carbon credit scheme or carbon tax, which indicates the difference in value proposition compared to many other CO2-derived products. Nevertheless, the company claims that for every tonne of CO2 used in CarbonCure concrete, around 254 tonnes of CO2 can be avoided, mainly because less cement is needed per m3 of CO2-cured concrete compared to conventionally produced concrete (CarbonCure, 2018). Furthermore, they estimate that CarbonCure “ready-mix” concrete technologies have the potential to provide a 500-700 MtCO2 per year impact by 2050.
The US-based company Solidia Technologies is developing both specialised cement-making that binds with more CO2 (Solidia CementTM) and CO2-based concrete curing (Solidia ConcreteTM, made using Solidia CementTM) for making high-strength, pre-cast concrete materials. In contrast to the CarbonCure process, Solidia CementTM must be cured in a sealed environment. Currently in commercialisation, Solidia reports lower costs, shorter curing times and improved product performance, while reducing the carbon footprint and water use by up to 70% and 80%, respectively. Several pre-cast customers in North America and Europe have been commercially testing the cement and curing process in the production of blocks, roof tiles and pavers. According to Solidia, the company’s demand for CO2 will more than double that of the existing CO2 market within five years (Solidia, 2019). While the curing process is readily deployable, the commercial adoption of Solidia CementTM could take longer as product standards and building codes need to be updated.

Putting CO2 to Use: Creating Value from Emissions Technical analysis
PAGE | 58
IEA
. All
right
s re
serv
ed.
Can CO2-derived building materials deliver climate benefits? The lower cement input required to manufacture concrete, and thus the lower upstream emissions related to the production of cement, is the major contributor to the lower life-cycle emissions of CO2-cured concrete relative to those of conventionally cured concrete. Another factor is the permanent retention of the carbon in the concrete. To date, the exact emissions reduction potential of CO2-cured concrete compared to conventional concrete remains unclear. CarbonCure reports that the CO2 footprint of concrete can be reduced by around 80%, but these claims have not been verified (CarbonCure, 2019). The net benefits are sensitive to the uptake rate of CO2 during the curing process (Alberici et al., 2017).
What are the regulatory requirements? Prior to adoption in some applications, it is necessary to demonstrate over a period of multiple years that CO2-cured concrete has a similar or better performance than conventional concrete. The extensive body of standards and codes governing the construction sector may prevent a fast adoption of CO2-cured cement by the market. Compliance with standards and codes is often a function of the material composition, for example based on ordinary Portland cement, rather than their performance. A shift from prescriptive to performance-based standards would facilitate the uptake of novel CO2-derived building materials (IEA, 2019c). Governments and industry need to update standards and codes, which can take up to a decade (ICEF, 2017). Standards and codes may be less stringent for non-structural applications of concrete – such as roads, floors and ditches – for which a high mechanical strength is not necessary. Early-stage adoption could target these market segments.
Table 5. Scaling up to a 10 MtCO2 market for CO2-derived building materials from natural minerals
Technology No major technological breakthroughs are needed. However, there is a need for long-term trials with CO2-cured concrete in various applications to demonstrate reliable performance.
Scalability The concrete market is large enough to absorb 10 MtCO2/yr for CO2- curing, which equates to around 100 million m3 (241 million tonnes) of concrete. Existing plants can be easily retrofitted to enable CO2-curing
Competitiveness CO2-cured concrete may already be competitive with conventionally cured concrete. The economics of the CO2-curing process can tolerate high CO2 prices.
Climate benefits Emission-intensive transport of CO2 and concrete should be minimised and CO2 uptake in concrete maximised. Climate benefits of up to 80% have been reported, but verification is needed.
Regulation and other issues
Multi-year trials are needed to demonstrate safe and environmentally friendly performance. Standards and codes governing the construction sector must be updated. A shift from prescriptive to performance-based design standards can avoid unnecessary restrictions on the uptake of CO2-derived building materials.

Putting CO2 to Use: Creating Value from Emissions Technical analysis
PAGE | 59
IEA
. All
right
s re
serv
ed.
CO2-derived building materials from waste
What are building materials made from waste? CO2 can be used to convert metal-containing waste materials into stable and solid carbonates with a market value (Figure 27). In many cases, the reaction products can be re-used in several applications, primarily in the construction industry as aggregates. Meanwhile, carbonation with CO2 presents an opportunity to reduce the probability of the metals leaching and causing environmental harm, which may happen when stored in landfill or stockpiled on industrial sites, and to avoid costs associated with waste disposal. A wide variety of waste streams coming from the power or industrial sector could be technically remediated with CO2, including coal fly ash, steel slag, cement-kiln dust, bauxite residue (red mud) and silicate mine tailings (Sanna et al., 2014). Particularly alkaline wastes, such as fly ash and steel slag, make a good candidate due to their high concentration in reactive metals, such as calcium and magnesium ions (up to 40% by weight). The reactivity and CO2-absorption capacity varies per waste type. As for natural mineral-based building materials, the CO2 use rates are relatively low, but the carbon is permanently stored in the material (Sanna et al., 2014). The CO2 use rates vary per type of waste material, with 0.07-0.25 tCO2 per tonne coal fly ash, 0.08-0.25 tCO2 per tonne cement kiln dust and 0.26-0.38 tCO2 per tonne blast furnace slag (Sanna et al., 2014).
Many alkaline waste streams require pre-treatment or extreme operating conditions (elevated pressure and temperature) to react at industrially acceptable rates (ECRA/CSI, 2017). The objective of the pre-treatment is to accelerate the slow carbonation process by increasing the surface area of the material or extracting the reactive metal ion from the mineral using chemicals. Other waste materials and processes require a separation step after the carbonation process. Both the pre-treatment and separation steps are typically energy-intensive and costly, in terms of both capital and operating expenses. Furthermore, large amounts of mineral feedstock are required per tonne of CO2 used, which needs to be transported to the carbonation facility. Technological improvements are needed to enhance the CO2-uptake capacity of waste materials under moderate operational conditions (low temperature and pressure) and industrially acceptable reaction times, for example, by developing new catalysts and exploring new conversion pathways (ICEF, 2017). In addition, further insight is required into the effect of the purity level of the CO2 on the vast majority of mineral carbonation technologies. While waste materials can tolerate CO2 at a wide range of purity levels (e.g. 10% to 90%), reaction rates tend to decline with lower purity levels (Alberici et al., 2017).
The main value proposition for companies to react waste materials with CO2 is to reduce waste disposal costs, while creating a saleable CO2-containing product for the construction sector. Companies in different parts of the world are scaling up businesses based on this value proposition, together using around 75 kt of CO2 annually. The main waste streams used are bauxite residue, steel slag and air pollution control residues.

Putting CO2 to Use: Creating Value from Emissions Technical analysis
PAGE | 60
IEA
. All
right
s re
serv
ed.
Mature conversion pathway for building materials from waste and CO2 Figure 27.
IEA 2019. All rights reserved.
Waste materials can be reacted with CO2 to manufacture building materials.
Are building materials from waste scalable? Traditionally, aggregates are made from natural resources, such as gypsum, chalk and limestone. The aggregates market alone would be able to absorb quantities of carbonated waste products that correspond with an amount of CO2 in the order of several billion tonnes per year (ICEF, 2017). Several estimates have been made on the global amount of CO2 that could technically be absorbed by waste streams, mostly in the range of 100 Mt/yr to 1 200 Mt/yr (Gomes et al., 2016; ICEF, 2017; Renforth et al., 2011).
The availability of waste streams may be an important long-term constraint due to reduced coal-fired power generation and primary steel production, although legacy waste from stockpiles may be available. Furthermore, technological improvements may unlock the treatment of waste materials that cannot be converted at industrially acceptable rates today. According to the UK-based company Carbon8, around 15 Mt/yr of CO2 can be realistically used for the carbonation of waste materials with current technology, based on the availability of CO2 and suitable waste materials close to the market for building materials (Alberici et al., 2017). In some locations, there may not be sufficient waste material in the short term (three to ten years) as most of it is under contract with waste disposal companies (Alberici et al., 2017).
Under what conditions are building materials from waste competitive?
The relatively low product value of building materials makes it difficult for building materials from waste to compete in the market. Carbonated waste products are only viable if the combined costs of transport, pre-treatment and carbonation, minus the avoided cost of waste treatment, are lower than the product’s market price. Given the low market value of building aggregates, the willingness to pay for CO2 will likely be lower than in the case of CO2-cured concrete. In addition to aggregates made from natural minerals, carbonated waste products would have to compete with alternative waste treatment processes that can extract valuable metals for sale. Nevertheless, Carbon8 has stated that the cost for their waste-based building material is three times lower than that of other secondary aggregates.21 In terms of
21 “Secondary aggregates” are materials that can be used as aggregate but are the waste product of another process. An example is fly ash.

Putting CO2 to Use: Creating Value from Emissions Technical analysis
PAGE | 61
IEA
. All
right
s re
serv
ed.
CO2 avoidance cost, a range of USD 50 to USD 300 per tCO2 sequestered was found in literature (Sanna et al., 2014).
Early opportunities involve materials with low processing costs and locations where low-cost CO2 and suitable waste streams exist in close proximity to potential consumers of building materials. The first markets are likely to emerge in places where these conditions exist as well as where costs of waste disposal are high. Currently, the European Union is attractive from this perspective. Regions producing aluminium are also promising because of their scale and tightening regulations on so-called “red mud” waste. An example of a company exploiting early opportunities is Carbon8 (Box 10).
Box 10. Commercial building materials from waste: The case of Carbon8
Formed in 2006, the British company Carbon8 is among the global leaders making building materials out of industrial waste and CO2. Today, the firm is operating two commercial carbonation plants producing lightweight aggregates from municipal air pollution control (APC) residues in the United Kingdom. Both plants are located next to a concrete manufacturer that uses the Carbon8 product in dense and medium-dense aggregate blocks. The company’s business model is based on two streams of revenue: a fee for waste treatment and the sale of its product. Carbon8’s material is reportedly three times less expensive than most other recycled aggregates (Alberici et al., 2017).
On an annual basis, the plants collectively use around 5 kt of high purity CO2 to convert 60 kt of APC residues, which would otherwise be treated and disposed to landfill or stored in salt caverns. If cheaper CO2 (with lower purity levels) was available, even more wastes could be processed economically with the company’s technology, such as cement dust and steel slag. The energy consumed across the value chain is relatively small, due to the short transport distances and little need for pre-treatment. According to Carbon8, the process fixes more CO2 in the aggregate than it emits over its life cycle, resulting in the first carbon-negative aggregate on the market (Carbon8, 2019).
The company aims to have five to six plants in operation by 2021, using around 19 kt/yr of CO2. It may be challenging to find sufficient material to process in the near future as most companies producing these materials are under contract with waste companies. In addition, local policies restrict plant output capacity to 30 kt/yr, while EU waste regulations forbid the use of certain waste streams in commercial products (Alberici et al., 2017). These barriers could seriously delay the company’s growth plan.
Can building materials from waste deliver climate benefits? The permanent storage of the carbon in the building material is a major contributor to the low life-cycle emissions in comparison to those of conventionally produced aggregates. While not all CO2 used is locked up in the carbonate product, the cost of the CO2 input encourages recycling of unreacted CO2. This means that the vast majority of the CO2 input is sequestered. The overall CO2 emission reductions depend particularly on the energy consumption for the

Putting CO2 to Use: Creating Value from Emissions Technical analysis
PAGE | 62
IEA
. All
right
s re
serv
ed.
pre-treatment and reaction of the waste materials and the transport of both the inputs and carbonate products. Industrial areas where suitable waste materials, CO2 and potential product off-takers coexist are good locations to manufacture carbonate materials with maximum overall emissions reductions.
The availability of robust and transparent life-cycle assessment studies on carbonated waste products is very limited. Carbon8 reports an absorption rate of 40 kgCO2 per tonne of aggregate, although this depends on the type of waste material (Carbon8, 2019). In addition, the firm claims that more carbon is permanently stored during the process than emitted as CO2 in its manufacture, resulting in a carbon-negative aggregate. However, this cannot be verified because the underlying assumptions are not reported.
What are the regulatory requirements? Existing regulations, such as the EU End of Waste Regulations, may prohibit the integration of waste in commercial products. A revision of such regulations is needed to allow the use of certain waste materials, provided the environmental integrity of the end product can be guaranteed. Meanwhile, imposing stricter waste disposal regulations may improve the business case for the carbonation of waste materials using CO2. The UK Landfill Tax and Australian bauxite residue disposal rules are currently the main existing enablers for commercial activities in this area. Lastly, the conservative building sector may not readily accept novel building materials. Multi-year trials demonstrating the safe and environment-friendly performance of these products would facilitate this process. In the meantime, targeting market segments that are more receptive towards novel building materials could be an effective strategy.
Table 6. Scaling up to a 10 MtCO2 market for building materials from waste and CO2
Technology No major breakthroughs are needed for regular steel, bauxite and air pollution control waste.
Scalability
The aggregates market is large enough for the use of 10 MtCO2/yr, which equates to around 120 Mt of aggregates. In some locations, there may not be sufficient waste material in the short term as it is under contract with waste disposal companies.
Competitiveness
Building materials from waste and CO2 may already be competitive with other secondary aggregates. Early markets may be found in locations with high waste disposal costs and coexistence of suitable waste materials, CO2 and product off-takers.
Climate benefits As transport distances, pre-treatment of waste materials and carbon uptake in the product have a strong impact on climate benefits, they should be optimised.
Regulation and other issues
Existing regulations may prohibit integration of waste in products. Multi-year trials are required to demonstrate safe and environment-friendly performance.

Putting CO2 to Use: Creating Value from Emissions Technical analysis
PAGE | 63
IEA
. All
right
s re
serv
ed.
CO2 use to enhance the yield of biological processes
What is yield boosting? CO2 can be used to enhance the yield in a variety of biological and chemical processes, typically where CO2 is already used but could be increased to improve process conditions (Figure 28). Today, there are several applications using additional CO2 in the chemical and horticulture industry that are commercial in certain settings and regions worldwide. These include fertilizer and methanol manufacturing as well as crop cultivation in greenhouses.
Using CO2 in industrial greenhouses to enrich the growing environment and thereby increase crop yields is the most common and most mature application. The CO2 needs to be very pure to avoid damage to the crops. For some crops, this method can increase yield by up to 25% to 30% (Becker and Kläring, 2016). In addition to CO2, low-temperature heat is needed to stimulate plant growth. Nowadays, the main way of meeting both CO2 and heat demand is through on-site gas-fired boilers or cogeneration systems, although the application of externally sourced CO2 and heat is increasingly being practised.
A novel application of CO2 is in the cultivation of algae to produce commercial petroleum substitutes. As with greenhouses, CO2 is artificially introduced to closed systems to enhance algal growth. Algae cultivation has been the subject of a wide range of RD&D and semi-commercial enterprises over recent years, but is still in an early stage of development. Several pilot-scale, closed-system, algae cultivation facilities have been constructed in different parts of the world using purified CO2 from power plants or industrial facilities. The diversity of activities makes it challenging to characterise the status of the technology and the potential scale for CO2 utilisation. The main challenges include low yield rates, system sensitivity to impurities and the high energy requirements for processing algal products. Research efforts focus on improving conversion efficiencies, enhancing production rates and reducing capital costs of bioreactors (NASEM, 2019).
CO2 use to enhance the yield of a biological or chemical process Figure 28.
IEA 2019. All rights reserved.
CO2 can be used to enhance the yield of biological or chemical processes.

Putting CO2 to Use: Creating Value from Emissions Technical analysis
PAGE | 64
IEA
. All
right
s re
serv
ed.
Is CO2 yield boosting scalable? The global demand for CO2 for biological yield boosting in the horticulture sector is unknown. Of the total greenhouse area worldwide, only a very small share uses CO2 to stimulate plant growth. The clear leader in the use of CO2 delivered to greenhouses is the Netherlands, with an estimated annual consumption between 5 and 6.3 MtCO2. Of this amount, approximately 500 ktCO2 per year is taken from external sources, mainly industrial plants, and delivered to nearly 600 greenhouses (1 900 hectares) in the Western part of the country (Alberici et al., 2017; OCAP, 2019). By using externally sourced CO2, 140 million cubic metres of natural gas are saved on a yearly basis. This corresponds with a reduction of some 250 ktCO2 per year (OCAP, 2019). The current market in the Netherlands is not limited by demand, but rather by supply of low-cost and high purity CO2, as well as by a lack of pipeline infrastructure.
The global potential for CO2 use in greenhouses easily outstrips an amount of 10 MtCO2 per year. In addition to low-cost and pure CO2, the main conditions for further expansion of the market is CO2 and heat transport infrastructure, as well as the availability of heat sources in close proximity to the greenhouses, such as industrial facilities and waste-to-energy plants.
Under what conditions is CO2 yield boosting competitive? The use of external CO2 for yield boosting in greenhouses is already competitive in several places. Typically, these locations are in close proximity to industrial sources with low-cost and high-purity CO2, low-cost waste heat and with a CO2 pipeline infrastructure. In many other places, costs for external CO2 and heat supply, including for new pipelines, outweigh the potential revenues or are higher than the costs of CO2 and heat from a gas-fired boiler or cogeneration plant.
Opportunities for further market growth of CO2 use are therefore near areas with low-cost and high-purity CO2 sources. Ideal distances between the greenhouse and industrial source of CO2 and heat are within 10 km and 5 km, respectively (Alberici et al., 2017). Depending on the transportation distance, in general, a minimum scale of the (cluster of) greenhouses is required, to warrant investment in dedicated CO2 capture and the required transportation infrastructure.
Can CO2 yield boosting deliver climate benefits? Climate benefits can be achieved if the externally-sourced CO2 is displacing onsite CO2 production, or if the CO2 is captured directly from the air. On average, around 20% of the CO2 fed to the greenhouses is absorbed by the crops, while the other 80% is vented with fresh air intake to control humidity (Alberici et al., 2017). The absorbed CO2 is fixed in the crops for a relatively short period until it is released into the atmosphere. To achieve carbon abatement, displaced CO2 emissions from natural gas combustion need to outweigh the emissions related to capture, purification and transport.

Putting CO2 to Use: Creating Value from Emissions Technical analysis
PAGE | 65
IEA
. All
right
s re
serv
ed.
What are the regulatory requirements? No regulatory barriers were identified for yield-boosting applications of CO2 use.
Table 7. Requirements for a 10 MtCO2 market for CO2 yield boosting
Technology No technological breakthroughs are needed. The use of external CO2 in greenhouses does not require changes to the greenhouses.
Scalability The global potential for CO2 for greenhouses is greater than 10 MtCO2 per year. In some locations, there may not be sufficient CO2 or low-temperature heat.
Competitiveness
The competitiveness of CO2 yield boosting depends mainly on the relative price of natural gas and externally sourced CO2 and heat. Early opportunities exist in places with sources of low-temperature heat and high-purity CO2 in close proximity to greenhouses.
Climate benefits come from the displacement of gas-based CO2 production. Transport of CO2 should be minimised to optimise climate benefits.
Regulation No regulatory barriers were identified.
Where are suitable locations for an early market? The CO2-derived products and services identified in the previous sections vary in many ways, including on their required energy inputs, their willingness to pay for CO2 and sources of revenues (Table 8). The challenges and market entry barriers are different as well, although for each application there are companies working to manufacture them commercially and deliver climate benefits under the right set of conditions. Many of these conditions are location specific.
In general, locations with favourable conditions include a low-cost and abundant supply of CO2 (with the right purity), availability of raw materials (waste streams, cement, water), and low-carbon energy (electricity, heat, hydrogen) as well as an existing CO2 infrastructure and product or service off-takers. By concentrating the different elements of the value chain in one area, costs and emissions related to transport can be minimised. Other favourable conditions are the presence of supporting regulation, and if possible, policies supporting products and services with lower life-cycle CO2 emissions. Areas with high industrial activity, in particular around ports, often provide access to CO2, raw materials and outlet markets for CO2 services as well as CO2-derived fuels, chemicals and building materials from waste. Several port areas, such as Rotterdam and Antwerp, already have ambitious plans to exploit CO2 use opportunities (ZEP, 2015). For CO2 yield boosting, suitable locations could also be near other sources of CO2 and waste heat, such as power plants. Concrete plants are usually distributed over a larger area and are often far away from sources of CO2, thus requiring transport of either CO2 or concrete. However, early opportunities exist for concrete plants that are reasonably close to industrial areas with potential availability of infrastructure for transporting CO2.
Co-location of CO2 use plants in industrial clusters could also provide synergies by enhancing demand for input products and transport infrastructure. CO2-derived products and services with low investment requirements for new production capacity, such as building materials, polymer processing and CO2 yield boosting, could be suitable candidates for early markets.

Putting CO2 to Use: Creating Value from Emissions Technical analysis
PAGE | 66
IEA
. All
right
s re
serv
ed.
Table 8. Overview of mature CO2-derived products and services.
Fuels / chemical intermediates
Polymer chemicals
Building materials
Stabilising waste
Yield boosting
Mature application Methanol; methane
Poly-carbonates
CO2-cured concrete
Aggregates from waste Greenhouses
Energy inputs High Low
Low, but depends on transport distances
Depends on carbonation process and transport distances
Low, but depends on transport distances
Willingness to pay for CO2
Low (fuels); high (chemicals) High High Low Low
Source of revenues (other than normal product sale value)
None Cheaper feedstock
Lower cement use; extra market value of superior product
Avoided waste disposal cost
Avoided natural gas use
Main source of potential climate benefits
Displacement of fossil fuel
Displacement of fossil feedstock
Lower cement use; permanent retention of CO2
Permanent retention of CO2
Displacement of natural gas
Early opportunities
Areas with low-cost CO2 and renewable energy
Industrial sites with excess polymer production capacity
Areas with minimum transport distances Target market segments receptive to product
Areas with minimum transport distances and high waste disposal costs
Areas with minimum transport distances and existing CO2 and heat infrastructure

Putting CO2 to Use: Creating Value from Emissions Technical analysis
PAGE | 67
IEA
. All
right
s re
serv
ed.
Implications for policy
Governments can have multiple reasons for supporting the development and commercialisation of CO2-derived products and services. Most of the interest in CO2 use has been driven by the objective of governments to mitigate global CO2 emissions. However, other reasons play a role as well, such as stimulating industrial innovation, technological leadership and enabling the circular economy. The optimal policy framework depends on the primary reason and objective to be pursued. This section focuses on policies supporting CO2 use as a climate mitigation option.
Most conversion processes and CO2-derived products and services are at early stages of technological development and are unable to compete with incumbent products and services, particularly in the absence of policies that recognise and value lower-carbon alternatives. While a carbon price could drive the market for some CO2-derived products and services in the long term (Box 11), additional policy measures are needed for the initial commercialisation phase. Effective policy support would have to recognise the early-stage challenges of CO2-derived products and services, including the commercial gap with incumbent products and services, legal barriers, and creating a robust emissions accounting framework.
A range of tailored policies and incentives can be used to improve the business case for investment in CO2-derived products and services. Regardless of the policy instrument, it must be underpinned by a transparent and robust measurement, reporting and verification (MRV) framework to provide confidence that emissions reductions are actually achieved. The design of such a framework is very challenging, because of the wide range of products operating in different markets and the complexity inherent in determining the emissions reductions for all of them.
Presently, policies supporting CO2 use are scarce, due to the relative novelty of some applications and uncertainties in emissions accounting and MRV. This section discusses several policy instruments that could be used to drive the market for CO2-derived products and services.
Box 11. Would a carbon price drive the use of CO2?
Carbon pricing is a policy instrument that charges those who emit CO2 for their emissions, either in the form of a carbon tax or a cap-and-trade system. Carbon pricing can act as an incentive to capture CO2 and use it (or sell it for use) in the manufacture of products or services, provided this is the cheapest compliance strategy for the emitter. Carbon pricing systems are currently operating in different regions; however, in most cases the carbon price is currently too low to support deployment of relatively nascent technologies, including CO2 use applications. Furthermore, the cost of using CO2 as a feedstock for products or services is often too high relative to other compliance strategies, such as CO2 storage or simply paying the carbon price. However, as CO2 conversion costs are expected to decline over time while carbon prices increase, there may be instances in which CO2 use becomes a cost-effective strategy.

Putting CO2 to Use: Creating Value from Emissions Technical analysis
PAGE | 68
IEA
. All
right
s re
serv
ed.
A carbon pricing system does not automatically incentivise CO2 use; this depends on if and how the system recognises the CO2 emissions reductions. The impact of the carbon price on the competitiveness of a CO2-derived product can vary per product type, depending on the transferability of regulatory responsibility, sale price of the CO2 and the percentage of CO2 that is permanently stored in the product.
For instance, the European Union’s Emissions Trading Scheme (EU ETS) does not allow an emitter to deduct the emissions related to any CO2 transferred from its facility for use in products or services. This means that whenever an emitter uses or sells CO2 for conversion into products, the CO2 must be reported as emitted, and the emissions allowances surrendered to the regulator.22 As a result, the emitter would only capture and sell the CO2 to a company using it as a feedstock if the price they receive for the CO2 covers at least the cost of capture. This price can be higher if the emitter can acquit its emissions allowances through other, lower-cost abatement options, for instance with CCS. However, if the carbon pricing system recognised emissions reductions related to CO2 use, emitters may be willing to accept much lower sale prices, since the transfer of CO2 to a user would relieve them of all or part of their regulatory responsibility for their CO2 emissions. This means that the buyer would have to accept the legal (and financial) responsibility for the CO2 emissions.
The entity responsible for the CO2 should be exempted from the carbon price at a rate consistent with the climate benefits achieved over the life cycle of the CO2-derived product or service. The underlying MRV framework would have to recognise whether or not the carbon is permanently stored in the product and assumptions on the type and carbon intensity of the counterfactual product and service have to be made. None of the carbon pricing systems in force today cover CO2 emissions across all sectors of the economy. Hence, if CO2 use were to be recognised, the MRV framework may have to deal with carbon entering sectors not covered by the system. This could be done by tracking the carbon or by using average emissions values when a product crosses sectoral borders, for example combustion emissions related to transport fuels. If not done properly, there is a risk that emissions reductions are claimed in both sectors (double counting), or monetised in the sector covered by the system, but later emitted in a sector outside of it. Finally, the inclusion of downstream emissions in the MRV framework may interfere with legislation that is already put in place to tackle these emissions, such as transport fuel directives. To uphold the integrity of the carbon price system, a careful and tailored design is essential.
Public procurement Public procurement expenditures in OECD countries amount to 12% of gross domestic product (GDP), and up to 29% of GDP in many developing countries (OECD, 2019). Leveraging this purchasing power for lower-carbon (including CO2-derived) products and services can help to establish early markets and promote innovation, especially in sectors where government demand is significant, such as in building materials and transport fuels. Government purchase contracts
22 CO2 transfer for producing precipitate calcium carbonate (PCC) is exempt from surrendering emissions allowances. This exemption was introduced in December 2018 as a direct consequence of the Schaefer Kalk court ruling, which established that CO2 that is chemically stable bound to PCC should be considered as not emitted (EUR-Lex, 2019).

Putting CO2 to Use: Creating Value from Emissions Technical analysis
PAGE | 69
IEA
. All
right
s re
serv
ed.
can provide an assured market, which can be important in securing capital for investment. Labels and standards that verify the lower-carbon credentials of products can support public procurement efforts as well as broader marketing to industrial and individual consumers.
In recent years, several countries have implemented public procurement rules that favour low-carbon products and services. In the Netherlands, tenderers can have their bids evaluated with a price reduction of up to 5% if their performance meets certain criteria (OECD, 2016). The government of Ontario (Canada) is looking at how to account for the emissions embedded in cement and concrete in public procurement rules (ECO, 2017). These measures have the potential to support commercialisation of emerging technologies particularly for CO2-derived building materials, but would rely on an underlying MRV framework to validate the climate benefits.
Mandates Mandates are legal requirements to bring forward products or services that meet certain standards or criteria. Obliging manufacturers to meet emissions criteria, or firms to purchase a minimum percentage of products or services with low life-cycle CO2 emissions, would allow CO2-derived products and services to enter the market. Mandates can also be a safeguard against carbon leakage, insofar as they could prevent the import of more carbon-intensive products. This policy instrument has been enacted for a variety of products and services, including transport fuels.
A notable example is the Renewable Energy Directive (RED II) in the European Union, which prescribes that a minimum of 14% of the energy consumed in road and rail transport should be of renewable origin by 2030. The Directive defines a series of GHG emission criteria that transport fuels must comply with. RED II recognises CO2-derived fuels regardless of the origin of the CO2, but several criteria have to be met. GHG emissions savings must be at least 70%; input energy must be fully renewable; it must be demonstrated that electricity generation capacity (for the fuel production) came into operation after or at the same time as the installation producing the fuel, and the electricity is not imported from the grid. CO2-derived fuels will likely struggle to be competitive with other low-carbon fuels recognised by RED II, such as renewable electricity and hydrogen. Another example is the Low Carbon Fuel Standard in California (US), which sets a declining target for the GHG intensity of the fuel supplied. The Fuel Standard recognises oil-based transport fuels produced with CO2-EOR that would reflect a better GHG performance due to the CO2 geologically stored during the oil recovery stage.
Economic incentives A wide range of economic incentives can be used to bridge the commercial gap between CO2-derived products (and services) and incumbents in the market. These include direct support for project costs and tax incentives. In addition to lowering capital and operational expenditures, guarantees for input prices and revenue streams are critical for most commercial entities to establish a sound business case with an acceptable risk profile. Tax incentives have been used to advance several low-carbon technologies in different regions of the world. Such incentives could play a similar role for companies, sellers or consumers of CO2-derived products and services. An example of how such a tax incentive scheme could stimulate the use of CO2 in products is the 2018 US Budget Bill, although it would probably need to be combined with other incentives to stimulate large-scale CO2 use outside of EOR applications (Box 12).

Putting CO2 to Use: Creating Value from Emissions Technical analysis
PAGE | 70
IEA
. All
right
s re
serv
ed.
Box 12. Creating a CO2 market: The case of the 45Q tax credit
In February 2018, the US Congress passed legislation to expand and reform a key tax credit called 45Q. The expanded 45Q provisions are designed to encourage innovation and adoption of technologies related to CCUS, including technologies linked to carbon capture and the conversion of CO2 into useable products. The tax credit is available for 12 years from commencement of operation.
In the case of CO2 use, the level of tax credit will increase progressively from USD 17/tCO2 in 2018 to USD 35/tCO2 in 2026; thereafter, credits will be indexed to inflation. In addition to being in construction by 2024, three conditions need to be satisfied to claim the credit: the CO2 would have otherwise been released into the air; a minimum of 25 000 tCO2 per year from each carbon capture facility must be converted to products; a life-cycle assessment by the regulator must show a benefit to the climate and the tax credit will only apply to the portion of the converted CO2 that can be shown to reduce overall emissions. The policy encourages companies to seek CO2 capture from the sources with the lowest cost, which are likely to be hydrogen plants, natural gas processing facilities and bioethanol mills. While the legislation has been passed, there are still several issues that need to be clarified by the government, including requirements for life-cycle analysis and the transferability of the credit to parties other than the owner of the carbon capture equipment (NETL, 2019).
The extent to which the 45Q tax credit will drive CO2 uptake for conversion into products is uncertain, but is expected to be relatively limited. For fuels and chemicals, the CO2 is ultimately released, suggesting that only a share of the USD 35/tCO2 tax credit will be available. This is unlikely to be sufficient to close the large cost gap with incumbent products unless combined with other incentives. Products offering permanent retention of carbon, such as concrete and carbonate materials, are expected to be able to claim higher credits, but typically have lower CO2 uptake rates.
IEA analysis suggests that the tax credit could trigger a surge in carbon capture investment, with the bulk of the captured CO2 earmarked for underground uses, namely EOR and geological storage (IEA, 2018b). For example, oil production through CO2-EOR could increase by 50 to 100 thousand barrels per day, which corresponds with an additional CO2 consumption of at least 10 to 30 million tonnes per year (IEA, 2018b). The expected activity growth is facilitated by the pipeline network already in place for CO2-EOR. Firms seeking early opportunities to integrate CO2 into products will benefit from the expansion of this infrastructure as a result of a growing CO2 market. The 45Q tax credit is an example of how policy incentives can drive a joint market for captured CO2 and encourage the rollout of CO2 capture and transport capacity providing multiple services.
Labelling, certification and testing Carbon footprint labelling is a means for individual and industrial consumers to recognise the sustainability of a company’s products. In recent years, organisations have been increasingly looking for opportunities to lower their total CO2 emissions. Labels can help to identify these opportunities and lower the carbon footprint of their supply chains. Environmental labelling has

Putting CO2 to Use: Creating Value from Emissions Technical analysis
PAGE | 71
IEA
. All
right
s re
serv
ed.
been successfully applied in multiple industries, from clothing and household appliances to food and packaging materials. Leading examples are the EU energy label scheme and the voluntary US Energy Star programme. Labels for CO2-derived products would have to clearly indicate emissions reductions. Governments are well-placed to set up appropriate labelling programmes in consultation with industry.
While labels may steer consumers towards purchasing more CO2-derived products, testing and certification are required to validate product quality and ensure compliance with certain criteria defined by authoritative organisations. Certification plays an important role in many product markets, from electronics to food and sustainable forest products. Testing of new products can take many years to ensure that criteria are met. Although governments are not always involved in these processes, they can facilitate them by co-ordinating testing and certification requirements. Furthermore, governments can support the development of international standards for CO2-derived products. This is particularly important for building materials, such as CO2-derived cement and aggregates, which require extensive demonstration and compliance with industry standards before widespread adoption (ICEF, 2017).
Research development and demonstration Support for research, development and demonstration (RD&D) can play a key role in the deployment of promising CO2-derived products and services that are scalable, provide climate benefits and have good prospects to become competitive over time. This includes both short-term opportunities, such as certain building materials, and long-term applications that can play a key role in a net-zero CO2 emission economy, for example aviation fuels and chemicals. In addition to conversion technologies, RD&D is needed across other parts of the value chain, such as CO2 capture technologies and low-carbon hydrogen production. RD&D support should have a clear link to deployment policies.
To date, several governments and agencies have been supporting RD&D of CO2-conversion technologies. For example, Japan released a Carbon Recycling Roadmap in June 2019 with emphasis on early RD&D for commercialisation of CO2 use technologies form 2030 (METI, 2019). The European Commission (EC) is funding several RD&D programmes, including public-private partnerships, under the Horizon 2020 umbrella. In total, 61 projects on CO2 use technologies were funded over the last decade for a total of USD 273 million23 (SAM, 2018). In addition, the EC is designing the Innovation Fund, which will be funded by the auctioning of the emission allowances of the EU ETS, starting in 2021. The Fund will include support for the demonstration of innovative CO2 use technologies amongst a broad portfolio of low-carbon technologies and may total more than USD 11 billion, depending on the carbon price (EC, 2019). In the United States, the American Reinvestment and Recovery Act (ARRA) and the DOE Carbon Use and Reuse R&D portfolio have supported CO2 conversion projects and R&D initiatives (respectively) (US DOE, 2019). In China, several R&D programmes were set up as part of the 13th Five Year Plan, primarily focusing on chemicals and building materials (ACCA21, 2019) while in Canada several innovation funding programs are supporting CO2 us in various applications (NRCan, 2019).
In parallel, several prize programmes have been initiated with the aim to promote the development of CO2 conversion technologies by awarding a prize to the most innovative CO2 use applications. The most notable example is the NRG COSIA Carbon XPrize, which is a
23 Based on a conversion rate of 0.89 EUR/USD for the year 2017 (OECD, 2018).

Putting CO2 to Use: Creating Value from Emissions Technical analysis
PAGE | 72
IEA
. All
right
s re
serv
ed.
USD 20 million global competition funded by NRG and Canada’s Oil Sands Innovation Alliance. Ten finalists from the United States, Canada, United Kingdom, China and India will be demonstrating their technologies at either the Wyoming Integrated Test Center under the competition’s coal track or the Alberta Carbon Conversion Technology Centre under the competition’s natural gas track – with one winner per track to be announced in 2020 (XPRIZE, 2019).
Governments can also play a facilitative role by convening stakeholders, particularly industry and academia, and encouraging collaboration through international RD&D programmes. An example is Mission Innovation, which is a coalition of more than 20 countries that pledged to double RD&D funding on clean energy. In 2016, the Mission Innovation countries committed to seven Grand Challenges, including one for CCUS. The programme involves collaboration among experts from many countries in determining RD&D needs (US DOE, 2019).
Table 9. Policy instruments for the creation of a market for CO2-derived products and services.
Policy instrument Examples of existing policies / support
Public procurement Public procurement rules in Canada and the Netherlands that favour material inputs with low-carbon footprints for construction projects
Mandates Renewable Energy Directive (RED II) (EU) and Low Carbon Fuel Standard in California, both favouring low-carbon transport fuels, including CO2-derived fuels
Economic incentive US 45Q tax credit that encourages the capture and conversion of CO2 into useable products
Product labelling Environmental labelling of numerous products, including household appliances and packaging materials
Certification and testing Certification and testing of wide range of product markets, including electronics and food.
RD&D support
International level: Mission Innovation – coalition of countries that pledged to double R&D budgets on clean energy, which offers an opportunity to expand R&D on CO2 use as well. National level: EU’s Horizon 2020 programme, US DOE’s Carbon Use and Reuse R&D portfolio, National Key R&D programmes on CO2 use in the Chinese 13th Five-Year Plan

Putting CO2 to Use: Creating Value from Emissions Technical analysis
PAGE | 73
IEA
. All
right
s re
serv
ed.
Recommendations
The market for CO2 is expected to remain relatively small in the short term, but has potential to grow in the longer term, especially as a raw material for products that will continue to require carbon, such as aviation fuel and chemicals. Governments can identify early opportunities to build markets for captured CO2 to enable technologies to mature over the coming decades and support future investment in sectors where CO2-derived products could play an important role.
Several measures are recommended for the short term:
Support greater understanding and improved quantification of CO2 use applications and their benefits to the climate. To inform policy decisions there is a need for robust life-cycle analyses based on clear methodological guidelines and transparent datasets. Governments could establish international working groups with experts to facilitate knowledge sharing, development of standards and best practice guidelines.
Identify and enable early market opportunities for CO2 use that are scalable, commercially-feasible and can deliver emissions reductions. The use of CO2 in building materials for non-structural applications, such as roads and floors, is one such opportunity, but in some cases also in polymers and in greenhouses to promote crop growth. Certification of polymers and the revision of waste regulations to allow conversion of waste into building materials is warranted, provided their environmental integrity can be assured.
Consider the implementation of public procurement guidelines for low-carbon products. This can create an early market for CO2-derived products and assist in the establishment of technical standards and specifications. The procurement guidelines should be underpinned by a robust emissions accounting and MRV framework to ensure climate benefits are actually achieved.
In parallel, several other measures can be taken to prepare the market for the longer term:
Facilitate multi-year test trials for CO2-derived building materials. This is required to demonstrate reliable performance and gain broader acceptance for these products, in particular in markets for structural materials that have to support heavy loads, for example in high-rise buildings. If trials are successful, close collaboration between governments and industry is needed to update and extend existing product standards and codes.
Support RD&D for future applications of CO2 use that could play a role in a net-zero CO2 emissions economy, including in aviation fuels and chemicals manufacturing. This should be in conjunction with RD&D for low-carbon hydrogen production and CO2 capture from biomass and the air. Support for international RD&D programmes and knowledge transfer networks can facilitate accelerated development and uptake of these technologies. Governments could also provide direct funding for demonstration of technologies with good prospects in terms of scalability, competitiveness, and CO2 emissions reductions.

Putting CO2 to Use: Creating Value from Emissions Technical analysis
PAGE | 74
IEA
. All
right
s re
serv
ed.
References
Acca21 (The Administrative Centre for China’s Agenda21) (2019), General introduction of Acca21, presentation given at the International Energy Agency, Paris, France on 24 April 2019.
ADEME (L'Agence de l'environnement et de la maîtrise de l'énergie/Environment and Energy Management Agency) (2014), Chemical Conversion of CO2: Quantification of Energy and Environmental Benefits and Economic Evaluation of Three Chemical Routes, ADEME, France, www.ademe.fr/chemical-conversion-of-co2-overview-quantification-of-energy-and-environmental-benefits-and-economic-evaluation-of-three-chemical-routes.
Alberici, S. et al. (2017), Assessing the Potential of CO2 Utilisation in the UK, Ecofys UK, Ltd., https://assets.publishing.service.gov.uk/government/uploads/system/uploads/attachment_data/file/799293/SISUK17099AssessingCO2_utilisationUK_ReportFinal_260517v2__1_.pdf.
Al-Kalbani et al. (2016), Comparative energetic assessment of methanol production from CO2: Chemical versus electrochemical process. Applied Energy, Vol. 165, pp. 1-13. https://doi.org/10.1016/j.apenergy.2015.12.027.
Armstrong, K. and P. Styring (2015), Assessing the potential of utilization and storage strategies for post-combustion CO2 emissions reduction. Frontiers in Energy Research, 03 March 2015, doi.org/10.3389/fenrg.2015.00008.
Artz, J. et al., (2018), Sustainable conversion of carbon dioxide: An integrated review of catalysis and life cycle assessment. Chemical Reviews, Vol. 118, pp. 434-504, http://dx.doi.org/10.1021/acs.chemrev.7b00435.
Audi (2019), Audi Technology Portal. Audi e-gas (web page), www.audi-technology-portal.de/en/mobility-for-the-future/audi-future-lab-mobility_en/audi-future-energies_en/audi-e-gas_en (accessed February 2019).
Becker, C. and H-P. Kläring (2016), CO2 enrichment can produce high red leaf lettuce yield while increasing most flavonoid glycoside and some caffeic acid derivative concentrations, Food Chemistry, Vol. 199, pp. 736–745.
BEIS (UK Department for Business, Energy and Industrial Strategy) (2018), The UK Carbon Capture Usage and Storage (CCUS) Deployment Pathway: An Action Plan, London, https://assets.publishing.service.gov.uk/government/uploads/system/uploads/attachment_data/file/759637/beis-ccus-action-plan.pdf.
Bennett, S.J., D.J. Schroeder and S.T. McCoy (2014), Towards a framework for discussing and assessing CO2 utilisation in a climate context, Energy Procedia, Vol. 63, pp. 7976 – 7992, doi: http:// dx.doi.org/10.1016/j.egypro.2014.11.835.
Carbon8 (2019), Carbon8 (web page), www.c8s.co.uk (accessed 10 May 2019).
CarbonCure (2019), From Carbon to Simply Better Concrete (web page), www.carboncure.com (accessed 10 May 2019).
CarbonCure (2018), CO2 utilization to unlock profits (while helping the planet), presentation at IEA CCUS Policy and Investment Workshop in Paris, France on 13 June 2018.
CarbonFree Chemicals (2019), CarbonFree Chemicals (web page), www.carbonfreechem.com/ (accessed 14 May 2019).

Putting CO2 to Use: Creating Value from Emissions Technical analysis
PAGE | 75
IEA
. All
right
s re
serv
ed.
CarbonNext (2017), Deliverable 2.1: Report on Fully Integrated and Intensified Value Chain Concepts for Process Selection, CarbonNext, http://carbonnext.eu/Deliverables/_/D2.1%20Value%20Chains%2031%2010%202017.pdf.
Cleantech Group (2018), i3 Database, Cleantech Group (accessed 12 December 2018).
Covestro (2018), Covestro Global Corporate Website, www.covestro.com/en (accessed 10 May 2019).
CRI (Carbon Recycling International) (2019). The George Olah Renewable Methanol Plant (web page), www.carbonrecycling.is/george-olah/ (accessed February 2019).
DNV (Det Norske Veritas) (2011), Carbon dioxide utilization – electrochemical conversion of CO2 –opportunities and challenges, Research and Innovation, Position Paper 07 – 2011, https://issuu.com/dnv.com/docs/dnv-position_paper_co2_utilization.
EC (European Commission) (2019), Innovation Fund (website), https://ec.europa.eu/clima/policies/innovation-fund_en (accessed 10 May 2019).
ECO (Environmental Commissioner of Ontario) (2017), “Low-carbon procurement”, in Ontario’s Climate Act from Plan to Progress: Annual Greenhouse Gas Progress Report 2017, Toronto, Ontario, https://docs.assets.eco.on.ca/reports/climate-change/2017/From-Plan-to-Progress.pdf.
ECRA/CSI (European Cement Research Academy; Cement Sustainability Initiative) (2017), Development of state-of-the-art techniques in cement manufacturing: Trying to look ahead, CSI/ECRA-Technology Papers 2017, Düsseldorf, Geneva, www.wbcsd.org/Sector-Projects/Cement-Sustainability-Initiative/Resources/Development-of-State-of-the-Art-Techniques-in-Cement-Manufacturing.
Edelstein, K. (2019), Q&A: CarbonCure’s Rob Niven plans to ‘expand portfolio of technologies’, CarbonCure, www.carboncure.com/news-press/2019/07/17/qa-rob-niven (accessed 10 August 2019).
ETC (Energy Transitions Commission) (2018), “Carbon capture in a zero-carbon economy” (consultation paper), Cross-Cutting Technologies (web page), www.energy-transitions.org/content/cross-cutting-technologies.
EUR-Lex (2019), “Judgement of the Court (First Chamber) of 19 January 2017”, Schaefer Kalk GmbH & Co. KG v Bundesrepublik Deutschland.Court Reports – General, ECLI identifier: ECLI:EU:C:2017:29, https://eur-lex.europa.eu/legal-content/EN/TXT/HTML/?uri=CELEX:62015CJ0460&from=EN.
Fukuoka, S. et al. (2007), Green and sustainable chemistry in practice: Development and industrialization of a novel process for polycarbonate production from CO2 without using phosgene, Polymer Journal, Vol. 39(2), pp. 91-114. http:// dx.doi.org/DOI: http:// dx.doi.org/10.1295/polymj.PJ2006140.
GCCSI (Global Carbon Capture and Storage Institute) (2017), Global Costs of Carbon Capture and Storage, 2017 Update, www.globalccsinstitute.com/archive/hub/publications/201688/global-ccs-cost-updatev4.pdf.
GCCSI (2012), Carbon Dioxide (CO2) Distribution Infrastructure: The Opportunities and Challenges Confronting CO2 Transport for the Purposes of Carbon Capture and Storage, Global CCS Institute, Canberra, Australia.
GCCSI (2011), Accelerating Uptake of CCS: Industrial Use of Captured Carbon Dioxide, Global CCS Institute, Canberra, Australia.
Global CO2 Initiative (2016), Global CO2 initiative launches with ambitious strategy to reduce atmospheric CO2, (press release), World Economic Forum annual meeting, Davos, 21 January 2016, www.globalCO2initiative.org/news/global-CO2-initiative-launches-with-ambitious-strategy-to-reduce-atmospheric-CO2 (accessed July 2018).
Gomes, H.I.et al. (2016), Alkaline residues and the environment: A review of impacts, management practices and opportunities, Journal of Cleaner Production, Vol. 112(4), pp. 3571–3582.

Putting CO2 to Use: Creating Value from Emissions Technical analysis
PAGE | 76
IEA
. All
right
s re
serv
ed.
ICEF (Innovation for Cool Earth Forum) (2017), Carbon dioxide utilization (CO2U): ICEF Roadmap 2.0, Tokyo, Japan, https://e-reports-ext.llnl.gov/pdf/892916.pdf.
IEA (International Energy Agency) (2019a), The Future of Hydrogen: Seizing Today’s Opportunities, IEA, Paris.
IEA (2019b), Exploring Clean Energy Pathways: The Role of CO2 Storage, IEA, Paris.
IEA (2019c), Material Efficiency in Clean Energy Transitions, IEA, Paris.
IEA (2018a), World Energy Outlook 2018, IEA, Paris.
IEA (2018b), World Energy Investment 2018, IEA, Paris.
IEA (2018c), The Future of Petrochemicals: Towards a More Sustainable Chemical Industry, IEA, Paris.
IEA (2018d), Technology Roadmap: Low-Carbon Transition in the Cement Industry, IEA, Paris.
IEA (2017), Energy Technology Perspectives 2017: Catalysing Energy Technology Transformations, IEA, Paris.
IEA (2015), Storing CO2 through Enhanced Oil Recovery, Insights Series, IEA, Paris.
IEAGHG (IEA Greenhouse Gas R&D Programme) (2018), Greenhouse Gas Emissions Accounting for Carbon Dioxide Capture And Utilisation (CCU) Technologies – Greenhouse Gas Accounting Guidelines for CCU, 2018-TR01b, March 2018, Cheltenham UK.
IEAGHG (2014), CO2 Capture at Coal Based Power and Hydrogen Plants, IEAGHG, 2014/3, June, Cheltenham UK, https://ieaghg.org/docs/General_Docs/Reports/2014-03.pdf.
IHS Markit (2018), “Introduction”, in Chemical Economics Handbook – Carbon Dioxide, https://ihsmarkit.com/products/carbon-dioxide-chemical-economics-handbook.html (accessed July 2018).
IPCC (Intergovernmental Panel on Climate Change) (2005), IPCC Special Report on Carbon Dioxide Capture and Storage, prepared by Working Group III of the IPCC, Cambridge and New York: Cambridge University Press.
Ishimoto, Y.et al. (2017), Putting costs of direct air capture in context, Working Paper Series: 002, Forum for Climate Engineering Assessment, https://papers.ssrn.com/sol3/papers.cfm?abstract_id=2982422.
ISO (International Organization of Standardization) (2006), The ISO 14000 Family of International Standards – Environmental Management, ISO, Geneva.
Keith, D. et al. (2018), A process for capturing CO2 from the atmosphere, Joule, Vol. 2, pp. 1573-1594.
MRS (Market Research Store) (2016), Global polyurethane market set for rapid growth, to reach around USD 77.0 billion by 2020, www.marketresearchstore.com/news/global-polyurethane-market-164 (accessed 10 May 2019).
Merchant Research & Consulting (2019), Possible slowdown as current trend of global & regional soda ash markets, https://mcgroup.co.uk/news/20150603/slowdown-current-trend-global-regional-soda-ash-markets.html (accessed June 2019).
METI (Ministry of Economy, Trade and Industry) (2019), Roadmap for Carbon Recycling Technologies, METI, www.meti.go.jp/press/2019/06/20190607002/20190607002-2.pdf.
NASEM (National Academies of Sciences, Engineering, and Medicine) (2019), Gaseous Carbon Waste Streams Utilization: Status and Research Needs, The National Academies Press, Washington DC, https://doi.org/10.17226/25232.
NETL (National Energy Technology Laboratory) (2014), Cost of Capturing CO2 from Industrial Sources, DOE/NETL-2013/1602, NETL, US Department of Energy, www.netl.doe.gov/projects/files/CostofCapturingCO2fromIndustrialSources_011014.pdf.

Putting CO2 to Use: Creating Value from Emissions Technical analysis
PAGE | 77
IEA
. All
right
s re
serv
ed.
NETL (2019), “CCUS and 45Q”, presentation at IEAGHG CCS Cost Workshop, 19-20 March 2019, Palo Alto CA, NETL, US Department of Energy.
NRCan (Natural Resources Canada) (2019), Current Investments (website), www.nrcan.gc.ca/science-data/funding-partnerships/funding-opportunities/current-investments/21146 (accessed 10 August 2019).
OCAP (Organic CO2 for Assimilation by Plants) (2019), Zuivere CO2 voor de glastuinbouw [Pure CO2 for the horticulture sector], Factsheet, OCAP, Netherlands.
OECD (Organisation of Economic Co-operation and Development) (2019), Public Procurement (website), www.oecd.org/governance/ethics/public-procurement.htm (accessed 10 May 2019).
OECD (2018), Exchange Rates (database), https://data.oecd.org/conversion/exchange-rates.htm (accessed 10 May 2019).
OECD (2016), Country Case: Green Public Procurement in the Netherlands, Public Procurement Toolbox (website), OECD, Paris, www.oecd.org/governance/procurement/toolbox/search/green-public-procurement-netherlands.pdf (accessed 3 December 2018).
Renforth, P. et al. (2011), Silicate production and availability for mineral carbonation, Environmental Science & Technology, Vol 45, pp. 2035-2041.
Reiter, G. and J. Lindorfer (2015), Evaluating CO2 sources for power-to-gas applications: A case study for Austria, Journal of CO2 Utilization, Vol. 10, pp. 40-49, https://doi.org/10.1016/j.jcou.2015.03.003
SAM (Scientific Advice Mechanism) (2018), “Novel carbon capture and utilisation technologies”, Group of Chief Scientific Advisors, Scientific Opinion 4/2018, European Commission, Directorate-General for Research and Innovation, Brussels.
Sampson, J. (2018), CO2 supply crisis hits Europe (web report), gasworld, www.gasworld.com/CO2-supply-crisis-hits-europe/2014944.article (accessed 19 February 2019).
Sanna, A. et al. (2014), A review of mineral carbonation technologies to sequester CO2, Chemical Society Reviews, Vol. 43, pp. 8049-8080.
Searles Valley Minerals (2019), Welcome to Searles Valley Minerals (web page), www.svminerals.com/default.aspx (accessed 14 May 2019).
Skone, T.J. et al. (2019), Carbon Dioxide Utilization Life Cycle Analysis Guidance for the U.S. DOE Carbon Use and Reuse Program, National Energy Technology Laboratory (NETL), US Department of Energy, Pittsburgh, PA.
Solida (2019), Solidia (web portal), https://solidiatech.com/ (accessed 10 May 2019).
Trading Economics (2019), Soda Ash (database), https://tradingeconomics.com/commodity/soda-ash (accessed June 2019).
US DOE (United States Department of Energy) (2019), Accelerating Breakthrough Innovation in Carbon Capture, Utilization, and Storage, report of the Mission Innovation Carbon Capture, Utilization, and Storage Experts’ Workshop, Houston, Texas on 26-28 September 2017, US Department of Energy and Kingdom of Saudi Arabia, Ministry of Energy, Industry and Mineral Resources, www.energy.gov/fe/downloads/accelerating-breakthrough-innovation-carbon-capture-utilization-and-storage.
US EPA (United States Environmental Protection Agency) (2018), Inventory of U.S. Greenhouse Gas Emissions and Sinks 1990-2017, (as submitted to the UNFCCC), www.epa.gov/sites/production/files/2019-04/documents/us-ghg-inventory-2019-main-text.pdf.

Putting CO2 to Use: Creating Value from Emissions Technical analysis
PAGE | 78
IEA
. All
right
s re
serv
ed.
von der Assen, N.V. (2015), From Life-Cycle Assessment towards Life-Cycle Design of Carbon Dioxide Capture and Utilization (Ph.D. thesis), University of Aachen, http://publications.rwth-aachen.de/record/570980/files/570980.pdf.
XPRIZE (2019), Transforming CO2 into Valuable Products (website), NRG COSIA XPRIZE, http://carbon.xprize.org (accessed 10 May 2019).
ZEP (Zero Emissions Platform) (2015), CCU – Carbon Capture and Utilisation, European Technology Platform for Zero Emission Fossil Fuel Power Plants, Brussels, www.zeroemissionsplatform.eu/library/publication/265-ccu.html.
Zimmermann, A. et al. (2018), Techno-Economic Assessment & Life-Cycle Assessment Guidelines for CO2 Utilization, University of Sheffield, RWTH Aachen, IASS Potsdam, TU Berlin.

Putting CO2 to Use: Creating Value from Emissions Technical analysis
PAGE | 79
IEA
. All
right
s re
serv
ed.
General annex
Abbreviations and acronyms APC air pollution control ARRA American Reinvestment and Recovery Act BEIS Business, Energy & Industrial Strategy CCS carbon capture and storage CCU carbon capture and utilisation CCUS carbon capture, utilisation and storage CO carbon monoxide CO2 carbon dioxide CRI Carbon Recycling International CTS Clean Technology Scenario DAC direct air capture DOE Department of Energy EC European Commission EOR enhanced oil recovery ETC Energy Transitions Commission ETP Energy Technology Perspectives EU ETS European Union’s Emissions Trading Scheme FT Fischer-Tropsch process (methanol synthesis) GDP gross domestic product GHG greenhouse gas IPCC Intergovernmental Panel on Climate Change ISO International Organisation for Standardisation LCA life-cycle assessment METI Ministry of Economy, Trade and Industry MRV measurement, reporting and verification MOST Ministry of Science and Technology NASEM National Academies of Sciences, Engineering, and Medicine NETL National Energy Technology Laboratory PCC precipitate calcium carbonate PV photovoltaic R&D research and development RD&D research, development and demonstration RED II Renewable Energy Directive RTS Reference Technology Scenario SMR steam methane reforming
Putting CO2 to Use: Creating Value from Emissions Technical analysis
PAGE | 80
IEA
. All
right
s re
serv
ed.
Acknowledgements This report was prepared by the Directorate of Sustainability, Technology and Outlooks under the direction of Mechthild Wörsdörfer, in co-operation with other directorates and offices of the International Energy Agency (IEA).
The lead author is Niels Berghout. Samantha McCulloch, head of the Carbon Capture, Utilisation and Storage Technology Unit contributed significant input and guidance. The report benefited from valuable inputs and comments from other experts within the IEA, including Simon Bennett, Thomas Berly, Herib Blanco, Araceli Fernandez Pales, Nick Johnstone, Peter Levi, Raimund Malischek, Cédric Philibert, Uwe Remme, Andreas Schröder, Tristan Stanley, Dave Turk, Laszlo Varro, and Tiffany Vass. Marina Dos Santos provided essential support. Important external contributions were provided by Paul Zakkour (Carbon Counts), in particular on the CO2 conversion technologies and their climate benefits.
Barbara Zatlokal carries editorial responsibility. The IEA Communications and Digital Office assisted and contributed to the production of the final report and website materials, particularly Tom Allen-Olivar, Astrid Dumond, Robert Stone, Sabrina Tan, and Therese Walsh.
Several experts from outside the IEA were consulted during the data and information collection process and reviewed the report. Their contributions were of great value. Those experts include: Katy Armstrong (University of Sheffield), Alexis Bazzanella (Dechema), Dominique Copin (Total), Kathryn Gagnon (Canadian Department of Natural Resources [NRCan]), Jasmin Kemper (IEA Greenhouse Gas R&D Programme), Will Lochhead (United Kingdom’s Department of Business, Energy and Industrial Strategy [BEIS]), Niall Mac Dowell (Imperial College), Carmine Marzano (European Commission), Sean McCoy (University of Calgary), David Nevicato (Total), Luis Robles (Total), Paul Zakkour (Carbon Counts), Xian Zhang (China’s Ministry of Science and Technology [MOST], Ping Zhong, (China’s Ministry of Science and Technology [MOST].
The IEA gratefully acknowledges Natural Resources Canada (NRCan) for their support of this work.

Putting CO2 to Use: Creating Value from Emissions Technical analysis
PAGE | 81
IEA
. All
right
s re
serv
ed.
Table of contents Abstract ........................................................................................................................................ 1
Highlights ..................................................................................................................................... 2
Executive summary........................................................................................................................ 3
Findings and recommendations ...................................................................................................... 5
Policy recommendations ........................................................................................................................ 5
Millions of tonnes of CO2 are being used today ....................................................................................... 5
New pathways for CO2 are generating global interest ............................................................................ 6
CO2 use can contribute to climate goals, but with caveats ...................................................................... 7
The future scale of CO2 use is highly uncertain ....................................................................................... 8
Where are the emerging market opportunities? ..................................................................................... 9
CO2 use can complement CO2 storage, but is not an alternative ........................................................... 13
References ........................................................................................................................................... 14
Technical analysis ........................................................................................................................ 16
Introduction ................................................................................................................................ 16
Setting the scene ......................................................................................................................... 17
What is CO2 use? .................................................................................................................................. 17
Where is CO2 being used today? ........................................................................................................... 20
What has spurred renewed interest in CO2 use? .................................................................................... 23
Who is currently investing in CO2 use, and why? ................................................................................... 25
How can CO2-derived products and services deliver climate benefits? .................................................. 26
Understanding the future market for CO2-derived products and services ......................................... 28
Which factors influence the future market? .......................................................................................... 28
Scalability............................................................................................................................................. 29
Competitiveness .................................................................................................................................. 29
Climate benefits ................................................................................................................................... 32
Is it possible to assess the future market size? ...................................................................................... 36
Scaling up the market .................................................................................................................. 41
CO2-derived fuels ................................................................................................................................. 41
CO2-derived chemicals ......................................................................................................................... 48
CO2-derived building materials from natural minerals .......................................................................... 54
CO2-derived building materials from waste .......................................................................................... 59
CO2 use to enhance the yield of biological processes ............................................................................ 63
Where are suitable locations for an early market? ................................................................................ 65
Implications for policy .................................................................................................................. 67
Public procurement .............................................................................................................................. 68
Mandates ............................................................................................................................................. 69
Economic incentives ............................................................................................................................. 69

Putting CO2 to Use: Creating Value from Emissions Technical analysis
PAGE | 82
IEA
. All
right
s re
serv
ed.
Labelling, certification and testing ....................................................................................................... 70
Research development and demonstration .......................................................................................... 71
Recommendations ....................................................................................................................... 73
References .................................................................................................................................. 74
General annexes .......................................................................................................................... 79
Acknowledgements ............................................................................................................................. 80
List of figures Growth in global demand of CO2 over the years (left); breakdown of demand Figure 1.
in 2015 (right) ............................................................................................................................. 6 Simple classification of pathways for CO2 use ............................................................................ 7 Figure 2. CO2 flows for CO2 use applications ............................................................................................. 8 Figure 3. Theoretical potential and climate benefits of CO2-derived products and services ....................... 9 Figure 4. Mature conversion route for CO2-derived fuels and chemical intermediates ............................ 10 Figure 5. Mature conversion pathway for CO2-derived polymers ............................................................ 11 Figure 6. Mature conversion pathway for CO2-derived building materials ............................................... 12 Figure 7. CO2 use in a climate pathway with limited availability of CO2 storage ...................................... 14 Figure 8. Simple classification of CO2 use pathways................................................................................ 17 Figure 9. Mature conversion route for CO2-derived fuels and chemical intermediates ............................ 18 Figure 10. Mature conversion pathway for CO2-derived polymers ............................................................ 19 Figure 11. Mature conversion pathway for CO2-derived building materials ............................................... 20 Figure 12. Growth in global CO2 demand over the years (left) and breakdown of demand Figure 13.in 2015 (right) ........................................................................................................................... 21 Breakdown of global investment in CO2 use start-ups by type of investor, 2008-18 .................. 25 Figure 14. Systems perspective of carbon capture and storage and CO2 use ............................................. 27 Figure 15. Key factors affecting a future market for CO2-derived products and services ........................... 28 Figure 16. Comparison of hydrogen production costs from electricity and natural gas with CCS Figure 17.in the near term ....................................................................................................................... 30 Life cycle of CO2-derived products and services ....................................................................... 33 Figure 18. System’s perspective of emissions reductions from CO2-derived fuels and chemicals .............. 35 Figure 19. Theoretical potential and climate benefits of CO2-derived products and services ..................... 40 Figure 20. Mature conversion routes for CO2-derived fuels and chemical intermediates ........................... 42 Figure 21. Mature conversion pathways for CO2-derived methane, methanol and diesel .......................... 43 Figure 22. Indicative production costs of CO2-derived fuels in the near and long term .............................. 44 Figure 23. Indicative production costs of CO2-derived fuels for various full load hours and CO2 price Figure 24.
penalty needed for competitiveness with their fossil counterparts ........................................... 46 Mature conversion pathways for CO2-derived polymeric materials .......................................... 50 Figure 25. Mature conversion pathway for CO2-derived building materials ............................................... 55 Figure 26. Mature conversion pathway for building materials from waste and CO2 ................................... 60 Figure 27. CO2 use to enhance the yield of a biological or chemical process .............................................. 63 Figure 28.
List of boxes Box 1. A mature application of CO2 use: enhanced oil recovery (EOR) ................................................ 22 Box 2. Exploiting synergies between CO2 use and CCS ....................................................................... 24 Box 3. Infrastructure needed to deliver hydrogen and CO2.................................................................. 29 Box 4. Initiatives to develop a common LCA framework ..................................................................... 33 Box 5. The role of CO2-derived products in a clean technology scenario ............................................. 37 Box 6. Demonstration plants producing fuels from CO2 and H2 ........................................................... 46

Putting CO2 to Use: Creating Value from Emissions Technical analysis
PAGE | 83
IEA
. All
right
s re
serv
ed.
Box 7. Producing all primary chemicals from CO2: How much electricity and raw materials would be needed? ................................................................................................................................... 51 Box 8. Commercial production of polycarbonates from CO2 ............................................................... 53 Box 9. Commercialisation of CO2-derived cement and concrete ......................................................... 57 Box 10. Commercial building materials from waste: The case of Carbon8 ............................................. 61 Box 11. Would a carbon price drive the use of CO2? .............................................................................. 67 Box 12. Creating a CO2 market: The case of the 45Q tax credit ............................................................. 70
List of tables Table 1. Selected CO2 capture cost ranges for industrial production ...................................................... 31 Table 2. Estimations of the potential for CO2 use in various publications ............................................... 37 Table 3. Scaling up to a 10 MtCO2 market for CO2-derived fuels ............................................................ 48 Table 4. Scaling up to a 10 MtCO2 market for CO2-derived chemicals .................................................... 54 Table 5. Scaling up to a 10 MtCO2 market for CO2-derived building materials from natural minerals ..... 58 Table 6. Scaling up to a 10 MtCO2 market for building materials from waste and CO2 ........................... 62 Table 7. Requirements for a 10 MtCO2 market for CO2 yield boosting ................................................... 65 Table 8. Overview of mature CO2-derived products and services. .......................................................... 66 Table 9. Policy instruments for the creation of a market for CO2-derived products and services. ........... 72

The IEA examines the full spectrum of energy issues including oil, gas and coal supply and demand, renewable energy technologies, electricity markets, energy efficiency, access to energy, demand side management and much more. Through its work, the IEA advocates policies that will enhance the reliability, affordability and sustainability of energy in its 30 member countries, 8 association countries and beyond.
Please note that this publication is subject to specific restrictions that limit its use and distribution. The terms and conditions are available online at www.iea.org/t&c/
Source: IEA. All rights reserved.International Energy Agency Website: www.iea.org
IEA member countries:
Australia Austria BelgiumCanadaCzech Republic DenmarkEstoniaFinland France Germany Greece HungaryIreland ItalyJapanKorea Luxembourg Mexico Netherlands New Zealand NorwayPoland Portugal Slovak Republic Spain Sweden Switzerland Turkey United Kingdom United States
The European Commission also participates in the work of the IEA
IEA association countries:
BrazilChinaIndiaIndonesiaMoroccoSingaporeSouth AfricaThailand
INTERNATIONAL ENERGYAGENCY

This publication reflects the views of the IEA Secretariat but does not necessarily reflect those of individual IEA member countries. The IEA makes no representation or warranty, express or implied, in respect of the publication’s contents (including its completeness or accuracy) and shall not be responsible for any use of, or reliance on, the publication. Unless otherwise indicated, all material presented in figures and tables is derived from IEA data and analysis.
This publication and any map included herein are without prejudice to the status of or sovereignty over any territory, to the delimitation of international frontiers and boundaries and to the name of any territory, city or area.
IEA. All rights reserved.IEA PublicationsInternational Energy Agency Website: www.iea.orgContact information: www.iea.org/about/contact
Typeset in France by IEA - September 2019Cover design: IEAPhoto credits: © Shutterstock


![Milano, 25 novembre 2015 - AISISA · Case study 3: Ammonia Urea plant, energy assessment p v [barg] T CW [°C] Net Electric Power [MWe] Net Yearly Electric Energy [GWe/yr] CO2 Emission](https://img.pdfslide.us/doc/110x75/6069e767f10ea16b003ec339/milano-25-novembre-2015-case-study-3-ammonia-urea-plant-energy-assessment-p.jpg)