Embed Size (px)
Citation preview
Footprint-adjusted net ecosystem CO2 exchange and
carbon balance components of a temperate forest
Miklos T. Nagy 1, Ivan A. Janssens, Jorge Curiel Yuste 3,Arnaud Carrara 2, Reinhart Ceulemans *
University of Antwerp, Department of Biology, Research Group of Plant and
Vegetation Ecology, Universiteitsplein 1, B-2610 Wilrijk, Belgium
Received 24 August 2005; received in revised form 4 August 2006; accepted 7 August 2006
Abstract
We combined eddy covariance measurements of CO2 exchange with a suite of ecological methods to construct the carbon
balance of a mixed coniferous–deciduous forest in northern Belgium. The CO2 flux measurements were footprint-corrected to
eliminate all fluxes originating from outside of the study site, and the ecological measurements were up-scaled by weighting the
main vegetation types by their relative contribution to the footprint of the CO2 flux measurements. The footprint-corrected annual
net ecosystem exchange (NEE) was much lower than previously published u*-corrected NEE. Annual NEE ranged from �1.1 to
1.1 t(C) ha�1 year�1, and the forest ecosystem was a moderate CO2 sink with a mean annual rate of�0.3 t(C) ha�1 year�1 over the
investigated period (1997–2002). In 2001–2002, the mean NEE was�1.0 t(C) ha�1 year�1. However, despite this net CO2 sink, the
forest was losing carbon because carbon export via wood harvesting amounted to 1.2 t(C) ha�1 year�1. Also in 2001–2002, gross
primary productivity (GPP) calculated from the eddy covariance data was estimated to be 10.4 t(C) ha�1 year�1. Thus, of the
photosynthetically absorbed CO2, 90% was offset by respiration by plants and heterotrophs. The net primary production (NPP) in
the effectively contributing forest ecosystem amounted to 5.5–5.8 t(C) ha�1 year�1. Therefore, the NPP/GPP ratio was slightly
higher than the previously assumed fixed ratio of 0.47. These results highlight the importance of including management-related
carbon fluxes and of applying footprint corrections in carbon-balance studies.
# 2006 Elsevier B.V. All rights reserved.
Keywords: Carbon balance; Net ecosystem exchange; Footprint corrections
www.elsevier.com/locate/agrformet
Agricultural and Forest Meteorology 139 (2006) 344–360
1. Introduction
The increasing atmospheric CO2 concentration and
subsequent climate change have drawn the attention of
* Corresponding author. Tel.: +32 3 820 2256; fax: +32 3 820 2271.
E-mail address: [email protected] (R. Ceulemans).1 Present address: University College Dublin, School of Biology
and Environmental Science, Belfield, Dublin 4, Ireland.2 Present address: Fundacion CEAM, Parque Tecnologico, Calle
Charles R. Darwin, Paterna (Valencia) SP-46980, Spain.3 Present address: University of California-Berkeley, Ecosystems
Science Division, Department of Environmental Science Policy and
Management, 137 Mulford Hall, Berkeley, CA 94720-3114, USA.
0168-1923/$ – see front matter # 2006 Elsevier B.V. All rights reserved.
doi:10.1016/j.agrformet.2006.08.012
scientists worldwide on the carbon cycle. Hence, many
studies aim to determine the carbon balance of
terrestrial ecosystems at local to global scales, and to
predict changes herein under different climatic condi-
tions (Prentice et al., 2001). The net carbon balance of
an ecosystem is the result of several carbon flows that
act simultaneously, but often respond in contrasting
ways to changes in environmental factors (Goulden
et al., 1996). Moreover, spatial differences in species
composition, age, and management practices contri-
bute to the complexity and make the interpretation as
well as the spatial and temporal up-scaling very
difficult.
M.T. Nagy et al. / Agricultural and Forest Meteorology 139 (2006) 344–360 345
The eddy covariance technique offers an indepen-
dent and useful tool to complement chamber-based
CO2-flux measurements. This technique, originally
proposed by Swinbank (1951), allows measuring the
net ecosystem CO2 exchange (NEE) between ecosys-
tems and the atmosphere directly (Desjardins, 1985;
Verma et al., 1986; Baldocchi et al., 1988; Falge et al.,
2001). The eddy covariance technique became widely
applied only in the second half of the 1990’s; therefore
the length of most long-term data sets averages around 7
or 8 years (Valentini et al., 2000).
When NEE, chamber-based CO2-flux measure-
ments, and field measurements of biomass growth,
litter production, etc. are assessed simultaneously, the
carbon balance of an ecosystem can be determined in
great detail. Moreover, the constructed carbon balance
becomes more reliable, because these independently
collected measurements provide mutual constraints.
However, before eddy covariance-based fluxes can be
compared to up-scaled ecological measurements, two
major difficulties have to be overcome:
(1) T
he eddy covariance measurements must originatefrom the ecosystem under investigation.
(2) W
e have to be able to correctly identify the surfacearea that is actually measured by the eddy
covariance technique. This area is commonly
referred to as ‘‘footprint’’ and changes with wind
direction, wind speed and stability (Schmid, 1997).
An accurate comparison of eddy covariance and other
ecological measurements thus requires both footprint
correction of the eddy flux data set (to exclude all fluxes
originating from outside of the ecosystem under study)
and up-scaling of the ecological measurements in
different areas proportional to their relative contribution
to the footprint of the eddy covariance system.
The eddy covariance technique can be deconvoluted
into its main contributing fluxes: gross primary
productivity (GPP) and total ecosystem respiration
(TER; Falge et al., 2002; Carrara et al., 2004). Waring
et al. (1998) reported that in forest ecosystems net
primary productivity (NPP) is proportional to GPP
(approximately 50%). However, in their study, gross
primary productivity was not measured but estimated
indirectly. Although the assumption of a constant NPP
to GPP ratio has been applied in stand growth-models
with promising results (e.g., Battaglia and Sands, 1997;
Landsberg and Waring, 1997), other studies questioned
this assumption. Makela and Valentine (2001) suggested
that a significant decline in the NPP to GPP ratio with
tree size or age seems highly probable, especially in
even-aged forests. Other ecosystem models suggested
that the NPP to GPP ratio is not constant, but is confined
to a narrow range (Thornley and Cannell, 2000). None-
theless, all of these studies agreed that the assumption of a
fixed NPP to GPP ratio needs verification (or rejection) in
studies where both NPP and GPP are measured indep-
endently within the same ecosystem.
Previous analyses of the 6 years long eddy covariance
dataset (Carrara et al., 2004) suggested that this study site
fluctuated between a negligible CO2 sink and a moderate
CO2 source, but these analyses were not footprint-
corrected nor compared with independent ecological
measurements. The main objectives of this study are
therefore: (1) to construct a detailed footprint-adjusted
carbon balance of a mixed, temperate forest ecosystem
for the period 2001–2002; and (2) to test the hypothesis of
a constant NPP to GPP ratio, by comparing eddy
covariance-based GPP estimates with independent NPP
estimates scaled-up to the same footprint area.
2. Materials and methods
2.1. Site description
The study site is a mixed coniferous/deciduous forest
located in Brasschaat in the Belgian Campine region
(5181803300N, 483101400E). The site is a level-II
observation plot of the European ICP-Forests network
(International Cooperative Programme on Assessment
and Monitoring of Air Pollution Effects on Forests in
the ECE-Region, UNEP-UN/ECE) and is also part of
the CARBOEUROPE flux towers network (Valentini
et al., 2000). The landscape is a coastal plain at a mean
elevation of 16 m and is almost flat (slope <0.3%). The
climate is temperate maritime with a mean annual
temperature of 9.8 8C and 750 mm of annual precipita-
tion. The soil is loamy sand, moderately wet, with a
distinct humus and iron B-horizon (Baeyens et al.,
1993), and is classified as Umbric Regosol (FAO
classification; Roskams et al., 1997). A clay layer lies
below the upper sandy layer at a depth of 1.5–2 m. Due
to this clay layer, the site has poor drainage, and
groundwater depth usually is between 1.2 and 1.5 m
(Baeyens et al., 1993). A more detailed description of
the physical and chemical description of the soil is
available (Janssens et al., 1999; Neirynck et al., 2002).
This relatively small (150 ha) forest consists of many
mono-specific patches of different coniferous and
deciduous species, with a variety of under storey
species as well. Scots pine (Pinus sylvestris L.) covering
about 80% of the coniferous plots and pedunculate oak
(Quercus robur L.) also covering 80% of the deciduous
M.T. Nagy et al. / Agricultural and Forest Meteorology 139 (2006) 344–360346
plots, are the dominant over storey species. The
undergrowth is dominated by black cherry (Prunus
serotina Ehrh.), rhododendron (Rhododendron ponti-
cum L.) and grass (Molinia caerulea L. Moench). A
more complete description of the forest, with vegetation
composition of the various patches has been previously
published (de Pury and Ceulemans, 1997; Janssens
et al., 2000).
The forest stands in the investigated area were
relatively even-aged and had similar characteristics. The
Scots pine stands were all planted in 1929 and were
characterized by a mean stand density of 361 trees ha�1,
mean tree height of 21.4 m, mean diameter at breast
height (DBH) of 0.29 m and mean stem basal area of
24 m2 ha�1. The pedunculate oak stands were slightly
younger (planted in 1936) and had a mean stand density
of about 310 trees ha�1, mean tree height of 17.2 m,
mean DBH of about 0.24 m and stem basal area of
14 m2 ha�1 (Curiel Yuste et al., 2005b; Xiao et al., 2003).
The area-weighted maximum leaf area index (LAI) for
the entire forest, including both over and under storey
LAI was about 3 m2 m�2 (Gond et al., 1999).
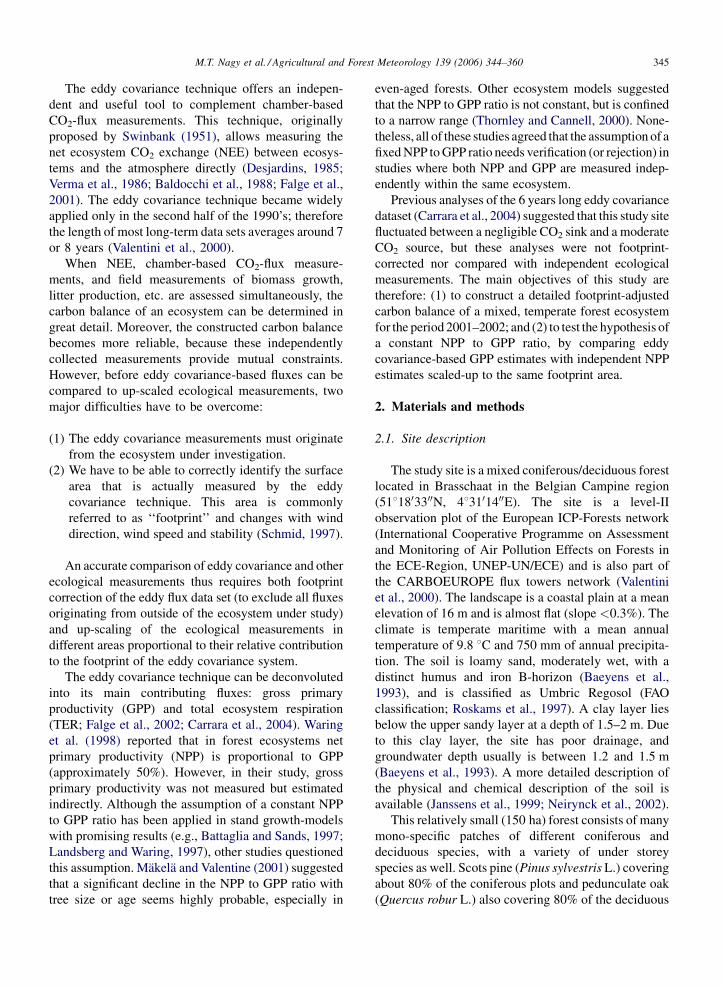
This managed forest is bordered by urban area on the
north and west, and by rural area (mostly forested
terrain) on the south and east sides (Fig. 1). The shortest
fetch (about 500 m) to the measuring tower is in the
western sector and a larger fetch (1000 m) is toward the
east side. The main wind direction at the site is
Fig. 1. Aerial photo of the surroundings around the eddy covariance tower. (
border of the forest, (- - -) indicates the approximate border of the wind se
southwest, the roughness length of the forest is about
1 m and the zero plane displacement is 19.2 m (Carrara
et al., 2003).
2.2. Instrumentation and measurements
The net carbon dioxide exchange between the forest
ecosystem and the atmosphere was calculated from
turbulence measurements on top of a 40 m tall flux
tower located in the experimental forest (Fig. 1) using
the eddy covariance technique. The instrumentation on
the flux tower included a three-dimensional sonic
anemometer (Model SOLENT 1012R2, Gill Instru-
ments, Lymington, UK) for wind speed, wind direction
and temperature measurements, and an infrared gas
analyzer (IRGA) (Model LI-6262, LI-COR Inc.,
Lincoln, NE, USA) for CO2 concentration measure-
ments. The data were logged at 20.8 Hz and fluxes were
computed in real time using the EDISOL software
(Moncrieff et al., 1997) and stored as half-hourly
values. More detailed information can be found in
Carrara et al. (2003, 2004).
Continuous meteorological measurements were car-
ried out with additional instruments on top of the tower.
The measured parameters were global radiation (pyr-
anometer, Kipp and Zonen, type CM6B, Delft, The
Netherlands), net radiation (REBS 07, Seattle, WA,
USA), photosynthetically active radiation (PAR quantum
) Indicates the location of the tower, (—) indicates the administrative
ctors.
M.T. Nagy et al. / Agricultural and Forest Meteorology 139 (2006) 344–360 347
sensor, JYP-1000, SDEC, Tours, France), precipitation
(tipping-bucket rain gauge, Didcot DRG-51, Didcot
Instrument Co. Ltd., Abingdon, UK), relative humidity
and temperature (psychrometer, Didcot DTS-5A, Abing-
don, UK). The measured data were stored as half-hourly
means on a data logger (Campbell CR 10, CSI, Logan,
UT, USA). Temperature in the soil was measured at 2 and
9 cm depth (Didcot DPS-404, Abingdon, UK). More
details about the instruments and methods can be found in
Overloop and Meiresonne (1999), Kowalski et al. (2000),
and Carrara et al. (2003).
2.3. NEE calculations
The calculation of eddy covariance fluxes and the
processing of data correction were made according to
the guidelines of the standard EUROFLUX methodol-
ogy (Aubinet et al., 2000). The calculations and flux
analyses for the forest over the period 1997–2002 were
carried out and discussed in detail in two earlier
publications (Carrara et al., 2003, 2004). In these
papers, however, data were not selected based on a
footprint analysis.
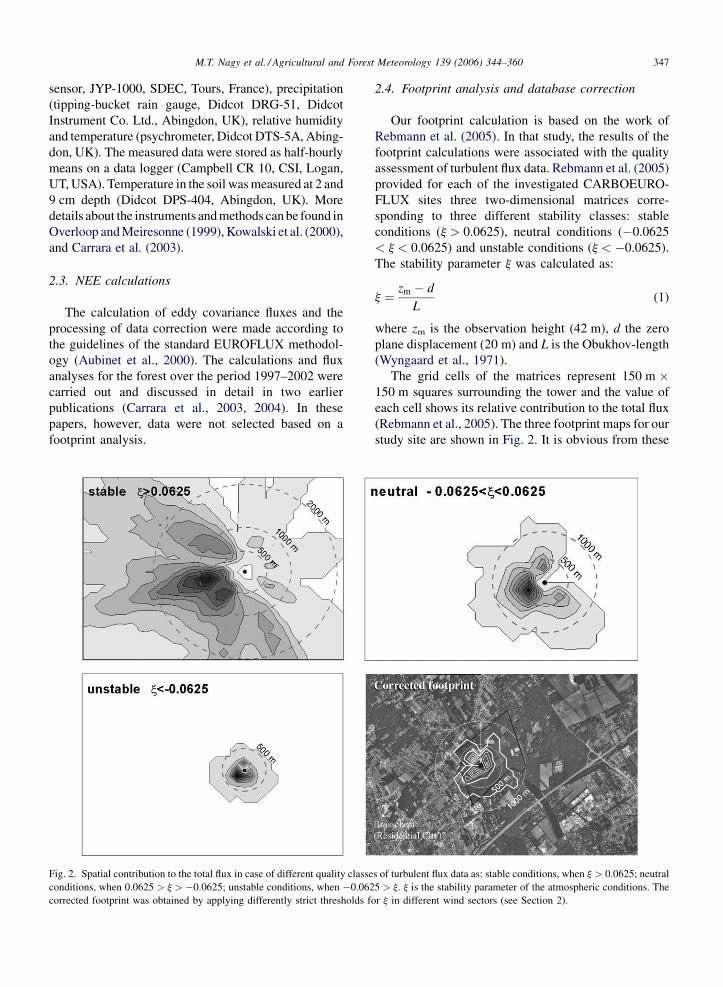
Fig. 2. Spatial contribution to the total flux in case of different quality classe
conditions, when 0.0625 > j > �0.0625; unstable conditions, when �0.062
corrected footprint was obtained by applying differently strict thresholds fo
2.4. Footprint analysis and database correction
Our footprint calculation is based on the work of
Rebmann et al. (2005). In that study, the results of the
footprint calculations were associated with the quality
assessment of turbulent flux data. Rebmann et al. (2005)
provided for each of the investigated CARBOEURO-
FLUX sites three two-dimensional matrices corre-
sponding to three different stability classes: stable
conditions (j > 0.0625), neutral conditions (�0.0625
< j < 0.0625) and unstable conditions (j < �0.0625).
The stability parameter j was calculated as:
j ¼ zm � d
L(1)
where zm is the observation height (42 m), d the zero
plane displacement (20 m) and L is the Obukhov-length
(Wyngaard et al., 1971).
The grid cells of the matrices represent 150 m �150 m squares surrounding the tower and the value of
each cell shows its relative contribution to the total flux
(Rebmann et al., 2005). The three footprint maps for our
study site are shown in Fig. 2. It is obvious from these
s of turbulent flux data as: stable conditions, when j > 0.0625; neutral
5 > j. j is the stability parameter of the atmospheric conditions. The
r j in different wind sectors (see Section 2).
M.T. Nagy et al. / Agricultural and Forest Meteorology 139 (2006) 344–360348
graphs, that under stable conditions the majority of the
fluxes originate from outside of the studied area, while
under unstable conditions fluxes originate from within
the forest boundaries. Thus, we selected our data set as
follows:
The surroundings around the flux tower were divided
into 12 wind sectors (about 308 range each) (Fig. 1). In a
few sectors all data were rejected either because of an
insufficient fetch or an undesired vegetation type (e.g.
grassland, or recently afforested area; Table 1). In each
of the remaining wind sectors all data obtained under
stable conditions were rejected. In these sectors,
different j thresholds were applied according to the
fetch in that direction. Where the fetch was large
enough, also fluxes obtained under neutral conditions
were maintained. Where the fetch was intermediate, the
j threshold was set at 0 (Table 1).
Where sector borders split a matrix cell, the matrix
values were divided proportionally to the area of the
matrix cell within each wind sector. The use of different
j thresholds depending on available fetch and vegeta-
tion composition modified both the footprint and the
flux data set, and the resulting fluxes were more
representative for the investigated forest. We were
afraid that eliminating data obtained under stable
conditions would induce a systematic bias, but we did
not observe substantial association between weather
patterns and stability. Hence, we assume that this filter
induced no systematic bias in the data.
2.5. Gap filling and annual NEE
The gap filling method applied on this j-modified
data set was based on the gap filling procedures
recommended by Falge et al. (2001). The data set of
each year was separated into two-monthly periods
(January–February; March–April; . . .) and nonlinear
regressions fitted to the data. Daytime and nighttime
data were analyzed separately.
Table 1
Criteria for dismissing CO2 flux data in different wind sectors of the fores
Wind sector Criterium of applied data
0–298 No data
30–2098 j < 0.0625
210–2408 j < 0
241–3008 No data
301–3328 j < 0.0313
333–3598 No data
Criteria were determined on the basis of the stability parameter (j) of the CO
each sector.
Daytime data were sorted in 5 8C-wide temperature
classes and light response functions were evaluated
using a modified form of the Michaelis–Menten
equation (Michaelis and Menten, 1913), with the same
modification as in Carrara et al. (2003):
FNEE ¼a0Rg
1� ðRg=1000Þ þ ða0Rg=FGPP;optÞ� FRE;day
(2)
where FNEE is the daytime flux (mmol CO2 m�2 s�1), a0
the ecosystem quantum yield (mmol CO2 J�1), Rg glo-
bal radiation (W m�2), FGPP,opt the optimum gross
primary production (mmol CO2 m�2 s�1) at a Rg value
of 1000 W m�2 and FRE,day is the ecosystem respiration
during the daytime (mmol CO2 m�2 s�1).
To evaluate the temperature response of nighttime
CO2 fluxes, we fitted the following exponential function
to the data:
FRE;night ¼ r0 eðbTÞ (3)
where FRE,night is the nighttime respiration
(mmol CO2 m�2 s�1), b the fitted temperature sensitiv-
ity parameter, T air temperature (8C) and r0 is the
ecosystem respiration (mmol CO2 m�2 s�1) at 0 8C.
Gaps of more than 2 weeks long were filled using
non-linear regressions (with T for FRE,night and with Rg
for FNEE) created from 6 years pooled data of the same
period of other years. The annual rate of net carbon
ecosystem exchange (NEE) (t(C) ha�1 year�1) was
calculated from the gap filled half hourly CO2 flux
data FNEE and FRE,night (mmol m�2 s�1).
2.6. Total ecosystem respiration
Total ecosystem respiration (TER) was estimated
based on the assumption that dark respiration during
nighttime and daytime follow the same temperature
response. Nighttime respiration responses to air
t
Reasons
Extensive grassland in the sector
Moderately short fetch (600 m)
Less than 500 m fetch and undesired vegetation
Moderately short fetch (600 m)
Extensive grassland in the sector
2 flux data, as well as on the vegetation type and the available fetch in
M.T. Nagy et al. / Agricultural and Forest Meteorology 139 (2006) 344–360 349
temperature were fitted in two-monthly periods. The
temperature response was determined from the para-
meters of Eq. (3), and the daytime half-hourly mean air
temperature was then substituted into the equation to
obtain the daytime respiration flux. Annual TER (TER)
was finally obtained as:
TER ¼X6
k¼1
ðRnighttime þ RdaytimeÞk (4)
where Rnighttime and Rdaytime are the two-monthly
sums of nighttime and daytime respiration values,
respectively, and k indicates a bimonthly period.
Because our objective was to compute the carbon
balance for the 2001–2002 period, TER values for
2001 and 2002 were computed separately and subse-
quently averaged.
2.7. Gross primary production
Annual rate of gross primary production
(GPP = GPP) was obtained from the equation:
GPP ¼ TER � NEE (5)
GPP for the reconstructed carbon balance was
calculated as the mean of the GPP values of 2001
and 2002.
2.8. Effect of footprint correction on NEE
An earlier NEE estimate was produced for this forest
over the 1997–2002 period by Carrara et al. (2003,
2004), where fluxes were not discarded based on
footprint criteria, but on a friction velocity (u*)
threshold of 0.2 m s�1. The difference between this
earlier and our current NEE estimate was analyzed
statistically as follows. Two-monthly NEE values were
calculated for both u*- and footprint-corrected fluxes.
Daytime and nighttime NEE were addressed separately.
Differences between the u*- and footprint-corrected
data sets were tested for significance with a t-test at the
P < 0.05 level.
2.9. The effectively contributing ecosystem
(footprint weighted)
The forest ecosystem surrounding an eddy flux
tower is hardly ever perfectly homogeneous. Species
composition and leaf area index usually differ in diff-
erent areas around the tower. Therefore, the ecosystem
that is effectively influencing the eddy covariance
system is determined by turbulence characteristicsand
by the geographic distribution of vegetation types. As
the relative occurrence of different wind directions and
wind speed varied seasonally and inter-annually, also
the vegetation measured by our eddy covariance system
varied seasonally and inter-annually (Table 2). For a
more reliable assessment of the ecosystem represented
by our data set, we therefore computed the ‘‘effectively
contributing ecosystem’’ in which the contribution of
the different vegetation types varied seasonally and
inter-annually. This effectively contributing ecosystem
method was applied to determine not only the
vegetation composition of the ecosystem represented
by the eddy flux data set, but also for the spatial up-
scaling of all other ecological measurements.
2.10. Net primary production, litter fall, biomass
Detailed inventories of standing biomass were
made in one representative oak and one representative
Scots pine stand in the winters of 2000–2001 and of
2003–2004. We assume that these plots were
representative for all other pine and oak plots.
Because all other plots were of similar age and the
soil is relatively homogeneous, this assumption was
not unreasonable. Because oak and Scots pine
represented the vast majority of the over storey
composition, we further assumed that all other
deciduous or coniferous species had similar growth
rates. The estimate of the carbon stored in the standing
biomass reported in the carbon balance represents the
calculated winter 2001/2002 condition. Thus, the
deciduous species were calculated without foliage
biomass, and both oak and pine biomass were
calculated with fine root biomass measured and repo-
rted for February 2003 in both stand types (Konopka
et al., 2005).
Annual net primary production (NPP) was calculated
by combining changes in standing biomass, litter fall
and fine root productivity over the period concerned.
Productivity of stems was determined with two different
methods: (1) by establishing allometric relationships
between stem biomass and diameter at breast height
(DBH; Curiel Yuste et al., 2005a). The difference in
standing stem biomass between repeated forest inven-
tories (2000, 2001, 2003) was then assumed as stem
NPP. (2) with species-specific growth tables (Jansen
et al., 1996). These yield tables are empirical tables used
by forest managers to estimate aboveground wood
volume and current wood increment in standing forests.
As soil and other environmental factors determine
productivity of a forest tree species at a specific
location, several yield classes (ranging from optimal to
M.T
.N
ag
yet
al./A
gricu
ltura
la
nd
Fo
restM
eteoro
log
y1
39
(20
06
)3
44
–3
60
35
0
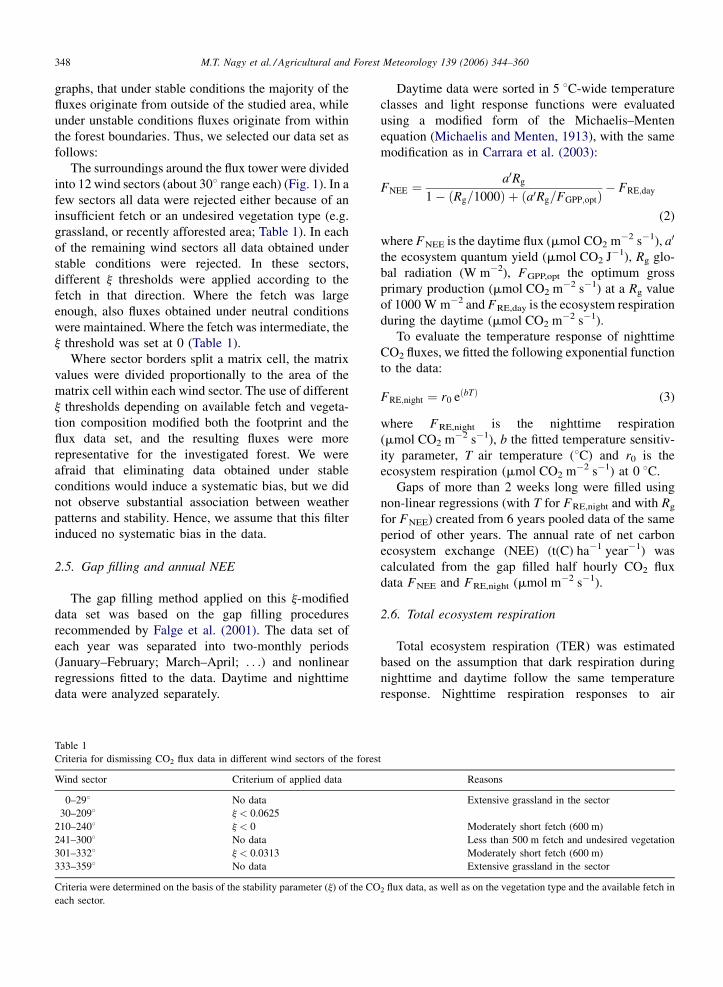
Table 2
Annual and seasonal variation in the vegetation composition of the footprint-weighted ecosystem
Over storey Pinus sylvestris Other coniferous Quercus robur Other deciduous GrassP
Under storey Prunus Rhodo Molinia Org. lay. Total Prunus Molinia Org. lay. Total Prunus Rhodo Endemic Org. lay. Total Prunus Org. lay. Total
Annual variation
1997 31.6 6.1 10.9 10.7 59.3 2.6 0.5 9.8 13.0 8.1 1.6 2.4 8.9 21.0 0.8 3.8 4.6 2.1 1001998 32.7 4.8 8.9 10.2 56.6 2.4 0.3 10.7 13.4 8.6 1.5 2.8 10.2 23.1 0.8 3.5 4.3 2.6 1001999 30.0 4.5 10.7 9.7 54.8 2.9 0.7 10.7 14.2 8.6 2.0 2.0 10.3 22.9 0.7 5.0 5.8 2.4 1002000 35.0 4.8 8.8 9.4 58.0 2.0 0.5 9.4 11.9 9.3 1.5 2.9 10.5 24.2 0.9 2.5 3.4 2.5 1002001 29.4 4.5 10.8 9.7 54.5 2.7 0.7 11.1 14.6 7.6 2.0 2.2 10.5 22.3 0.6 4.9 5.5 3.2 1002002 29.1 4.3 11.2 9.6 54.2 3.6 0.5 12.5 16.5 7.3 1.9 2.2 8.8 20.2 0.6 6.1 6.7 2.4 100
Seasonal variation
Months 1–2 39.8 3.2 7.1 6.6 56.7 2.3 0.4 9.9 12.6 10.1 1.5 3.7 9.7 25.0 1.1 2.6 3.6 2.1 100Months 3–4 32.3 4.8 10.0 9.6 56.7 2.6 0.5 10.7 13.7 8.2 1.7 2.6 9.8 22.3 0.7 3.8 4.6 2.8 100Months 5–6 29.7 4.8 11.5 9.8 55.8 2.5 0.7 11.1 14.4 7.6 2.0 1.7 9.5 20.8 0.6 4.8 5.4 3.7 100Months 7–8 31.2 4.8 11.5 9.5 57.0 2.3 0.6 11.7 14.6 7.6 1.8 1.4 8.0 18.8 0.7 4.4 5.1 4.5 100Months 9–10 33.0 4.8 9.2 9.8 56.9 2.8 0.4 9.7 12.9 9.6 1.6 2.8 10.4 24.4 0.9 3.8 4.7 1.2 100Months 11–12 25.3 6.0 10.7 12.4 54.3 3.5 0.5 10.9 14.9 7.1 1.9 2.8 11.7 23.6 0.4 5.9 6.3 0.9 100
Mean 2001–2002 29.3 4.4 11.0 9.7 54.4 3.1 0.6 11.8 15.5 7.4 2.0 2.2 9.6 21.2 0.6 5.5 6.1 2.8 100
All values are in % of total. The footprint-weighted ecosystem was calculated by weighting the vegetation composition of every wind sector (combining over storey and under storey) with the
proportion of data originating from each particular sector.
M.T. Nagy et al. / Agricultural and Forest Meteorology 139 (2006) 344–360 351
extremely poor) have been developed for each species.
Yield classes are tree species-specific at a given site and
can be determined from stand age, mean DBH and mean
height. Current aboveground wood increment can then
be estimated from the empirical yield table. This results
in a fairly correct estimation of the current wood
increment rate of even-aged stands, in particular in the
case of middle-aged forests.
For branch NPP, we also applied allometric relation-
ships (Curiel Yuste et al., 2005a) to determine the
change in standing biomass, and summed this with the
measured fine- and coarse branch litter fall. Above-
ground litter fall (leaves, cones and branches) was
measured from January 2001 until December 2003
(Curiel Yuste et al., 2005a). We used the average of the 3
years’ results for the carbon balance.
Foliage NPP was calculated differently for pine and
oak. In pine, NPP of needles was estimated from
allometric relationships between current-year needles
and DBH (Xiao et al., 2003), and the stand inventory
data. Foliage in oak was estimated directly from the
foliage litter fall during 2001–2003 (Curiel Yuste et al.,
2005a).
Coarse root NPP was estimated with allometric
relationships between coarse root biomass and DBH
(Curiel Yuste et al., 2005a) and repeated forest
inventories (2000, 2001, 2003).
Fine root NPP was estimated by repeated root
coring (see Konopka et al., 2005, for detailed
description of methodology). Belowground litter
production was assumed equal to fine root NPP.
Then, NPP for the over storey was calculated by
weighting the oak and Scots pine NPP according to
their relative contribution to the effectively contribut-
ing ecosystem.
For the main under storey tree species (Prunus and
Rhododendron), biomass, NPP and litter production were
estimated as follows: for Rhododendron, we applied the
estimates of Nadezhdina et al. (2003) measured at the
same site. For Prunus, a similar allometric relationship
between component biomass and diameter at breast
height (DBH) was applied as for oak (Curiel Yuste et al.,
2005a).
2.11. Soil carbon content and soil respiration
Carbon stores in the organic surface layer and in the
mineral soil (up to 30 cm deep) were determined in
2003, separately for the oak and the pine stands (Curiel
Yuste et al., 2005a). As samples were taken only until
30 cm depth, the soil carbon stores reported here are
underestimated (see Curiel Yuste et al., 2005a for more
detailed information about organic layers and mineral
soil content).
Soil CO2 efflux was measured during 2001 at
monthly intervals with a closed dynamic system and an
IRGA (CIRAS-1, PP SYSTEMS, Hitchin, Herts, UK) in
nine plots representative for the forest composition
(different associations of canopy/under storey vegeta-
tion; 10 collars per plot; Curiel Yuste et al., 2005b). The
vegetation types were determined by the combination of
the over storey and under storey species, and
corresponded to the vegetation types that were used
to determine the effectively contributing ecosystem. A
more detailed description of the methods and results are
given by Curiel Yuste et al. (2005b).
2.12. Thinnings, wood export, slash inputs and
decomposition
Wood export was quantified from the annual timber
selling reports of the local forest station (detailed for
each management unit in the forest). The remaining
slash was estimated from the allometric relations
established to determine standing biomass. For the
under storey (which was systematically removed)
slash inputs were estimated by multiplying the
cleaned areas (also annually reported for each
management unit) with our estimate of standing
biomass.
Decomposition of this remaining slash was esti-
mated with an exponential decay model applying
different parameters for woody tissues and foliage/fine
roots (Janssens et al., unpublished results):
RSD ¼ BC eð�kaÞ (6)
where RSD is the respiration from slash decomposition
(t(C) ha�1 year�1), BC is the carbon content of the
remaining slash, k is the decomposition parameter
and a is the time passed since the slash started to
decompose (year). The applied values for the decom-
position parameter k were 0.12 for stumps, 0.22 for
branches and coarse roots, 0.25 for pine and rhododen-
dron foliage and fine roots, and 0.35 for oak and Prunus
foliage and fine roots, respectively (decomposition
parameters were obtained by averaging parameter
values of a range of studies; Berg, 1984; McClaugherty
et al., 1984; Berg and Staaf, 1987; Berg et al., 1993;
Liski et al., 2002).
Respiration originating from slash decomposition was
determined for each plot separately (t(C) ha�1 year�1)
and subsequently scaled-up to the effectively contribut-
ing forest ecosystem as described earlier.
M.T. Nagy et al. / Agricultural and Forest Meteorology 139 (2006) 344–360352
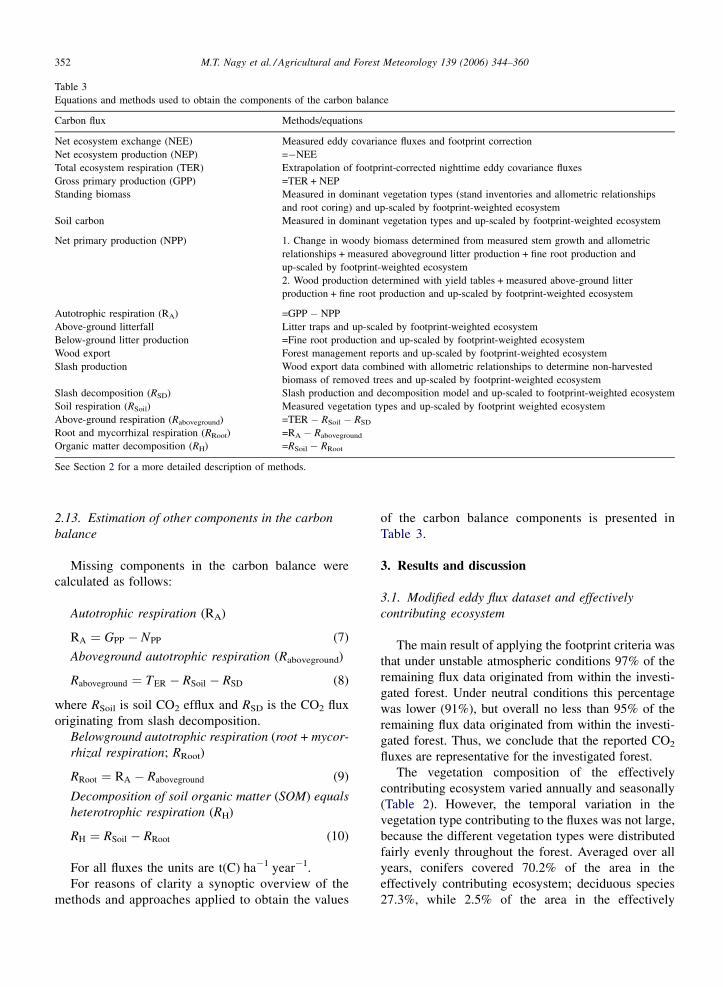
Table 3
Equations and methods used to obtain the components of the carbon balance
Carbon flux Methods/equations
Net ecosystem exchange (NEE) Measured eddy covariance fluxes and footprint correction
Net ecosystem production (NEP) =�NEE
Total ecosystem respiration (TER) Extrapolation of footprint-corrected nighttime eddy covariance fluxes
Gross primary production (GPP) =TER + NEP
Standing biomass Measured in dominant vegetation types (stand inventories and allometric relationships
and root coring) and up-scaled by footprint-weighted ecosystem
Soil carbon Measured in dominant vegetation types and up-scaled by footprint-weighted ecosystem
Net primary production (NPP) 1. Change in woody biomass determined from measured stem growth and allometric
relationships + measured aboveground litter production + fine root production and
up-scaled by footprint-weighted ecosystem
2. Wood production determined with yield tables + measured above-ground litter
production + fine root production and up-scaled by footprint-weighted ecosystem
Autotrophic respiration (RA) =GPP � NPP
Above-ground litterfall Litter traps and up-scaled by footprint-weighted ecosystem
Below-ground litter production =Fine root production and up-scaled by footprint-weighted ecosystem
Wood export Forest management reports and up-scaled by footprint-weighted ecosystem
Slash production Wood export data combined with allometric relationships to determine non-harvested
biomass of removed trees and up-scaled by footprint-weighted ecosystem
Slash decomposition (RSD) Slash production and decomposition model and up-scaled to footprint-weighted ecosystem
Soil respiration (RSoil) Measured vegetation types and up-scaled by footprint weighted ecosystem
Above-ground respiration (Raboveground) =TER � RSoil � RSD
Root and mycorrhizal respiration (RRoot) =RA � Raboveground
Organic matter decomposition (RH) =RSoil � RRoot
See Section 2 for a more detailed description of methods.
2.13. Estimation of other components in the carbon
balance
Missing components in the carbon balance were
calculated as follows:
Autotrophic respiration (RA)
RA ¼ GPP � NPP (7)
Aboveground autotrophic respiration (Raboveground)
Raboveground ¼ TER � RSoil � RSD (8)
where RSoil is soil CO2 efflux and RSD is the CO2 flux
originating from slash decomposition.
Belowground autotrophic respiration (root + mycor-
rhizal respiration; RRoot)
RRoot ¼ RA � Raboveground (9)
Decomposition of soil organic matter (SOM) equals
heterotrophic respiration (RH)
RH ¼ RSoil � RRoot (10)
�1 �1
For all fluxes the units are t(C) ha year .For reasons of clarity a synoptic overview of the
methods and approaches applied to obtain the values
of the carbon balance components is presented in
Table 3.
3. Results and discussion
3.1. Modified eddy flux dataset and effectively
contributing ecosystem
The main result of applying the footprint criteria was
that under unstable atmospheric conditions 97% of the
remaining flux data originated from within the investi-
gated forest. Under neutral conditions this percentage
was lower (91%), but overall no less than 95% of the
remaining flux data originated from within the investi-
gated forest. Thus, we conclude that the reported CO2
fluxes are representative for the investigated forest.
The vegetation composition of the effectively
contributing ecosystem varied annually and seasonally
(Table 2). However, the temporal variation in the
vegetation type contributing to the fluxes was not large,
because the different vegetation types were distributed
fairly evenly throughout the forest. Averaged over all
years, conifers covered 70.2% of the area in the
effectively contributing ecosystem; deciduous species
27.3%, while 2.5% of the area in the effectively
M.T. Nagy et al. / Agricultural and Forest Meteorology 139 (2006) 344–360 353
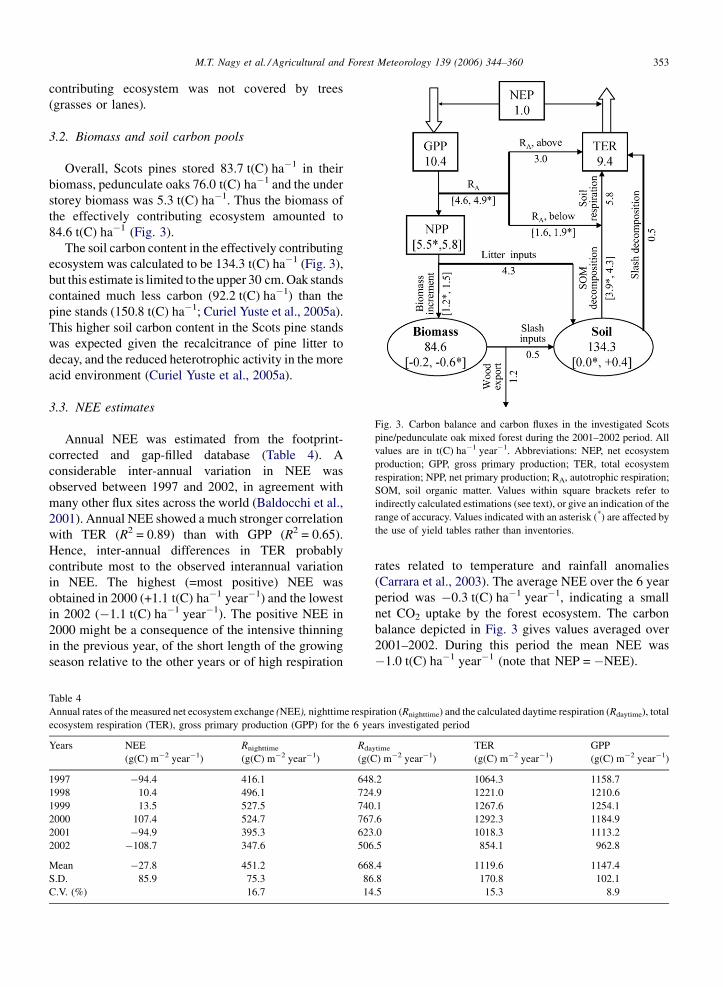
Fig. 3. Carbon balance and carbon fluxes in the investigated Scots
pine/pedunculate oak mixed forest during the 2001–2002 period. All
values are in t(C) ha�1 year�1. Abbreviations: NEP, net ecosystem
production; GPP, gross primary production; TER, total ecosystem
respiration; NPP, net primary production; RA, autotrophic respiration;
SOM, soil organic matter. Values within square brackets refer to
indirectly calculated estimations (see text), or give an indication of the
range of accuracy. Values indicated with an asterisk (*) are affected by
the use of yield tables rather than inventories.
contributing ecosystem was not covered by trees
(grasses or lanes).
3.2. Biomass and soil carbon pools
Overall, Scots pines stored 83.7 t(C) ha�1 in their
biomass, pedunculate oaks 76.0 t(C) ha�1 and the under
storey biomass was 5.3 t(C) ha�1. Thus the biomass of
the effectively contributing ecosystem amounted to
84.6 t(C) ha�1 (Fig. 3).
The soil carbon content in the effectively contributing
ecosystem was calculated to be 134.3 t(C) ha�1 (Fig. 3),
but this estimate is limited to the upper 30 cm. Oak stands
contained much less carbon (92.2 t(C) ha�1) than the
pine stands (150.8 t(C) ha�1; Curiel Yuste et al., 2005a).
This higher soil carbon content in the Scots pine stands
was expected given the recalcitrance of pine litter to
decay, and the reduced heterotrophic activity in the more
acid environment (Curiel Yuste et al., 2005a).
3.3. NEE estimates
Annual NEE was estimated from the footprint-
corrected and gap-filled database (Table 4). A
considerable inter-annual variation in NEE was
observed between 1997 and 2002, in agreement with
many other flux sites across the world (Baldocchi et al.,
2001). Annual NEE showed a much stronger correlation
with TER (R2 = 0.89) than with GPP (R2 = 0.65).
Hence, inter-annual differences in TER probably
contribute most to the observed interannual variation
in NEE. The highest (=most positive) NEE was
obtained in 2000 (+1.1 t(C) ha�1 year�1) and the lowest
in 2002 (�1.1 t(C) ha�1 year�1). The positive NEE in
2000 might be a consequence of the intensive thinning
in the previous year, of the short length of the growing
season relative to the other years or of high respiration
Table 4
Annual rates of the measured net ecosystem exchange (NEE), nighttime respi
ecosystem respiration (TER), gross primary production (GPP) for the 6 ye
Years NEE
(g(C) m�2 year�1)
Rnighttime
(g(C) m�2 year�1)
Rda
(g(C
1997 �94.4 416.1 648
1998 10.4 496.1 724
1999 13.5 527.5 740
2000 107.4 524.7 767
2001 �94.9 395.3 623
2002 �108.7 347.6 506
Mean �27.8 451.2 668
S.D. 85.9 75.3 86
C.V. (%) 16.7 14
rates related to temperature and rainfall anomalies
(Carrara et al., 2003). The average NEE over the 6 year
period was �0.3 t(C) ha�1 year�1, indicating a small
net CO2 uptake by the forest ecosystem. The carbon
balance depicted in Fig. 3 gives values averaged over
2001–2002. During this period the mean NEE was
�1.0 t(C) ha�1 year�1 (note that NEP = �NEE).
ration (Rnighttime) and the calculated daytime respiration (Rdaytime), total
ars investigated period
ytime
) m�2 year�1)
TER
(g(C) m�2 year�1)
GPP
(g(C) m�2 year�1)
.2 1064.3 1158.7
.9 1221.0 1210.6
.1 1267.6 1254.1
.6 1292.3 1184.9
.0 1018.3 1113.2
.5 854.1 962.8
.4 1119.6 1147.4
.8 170.8 102.1
.5 15.3 8.9
M.T. Nagy et al. / Agricultural and Forest Meteorology 139 (2006) 344–360354
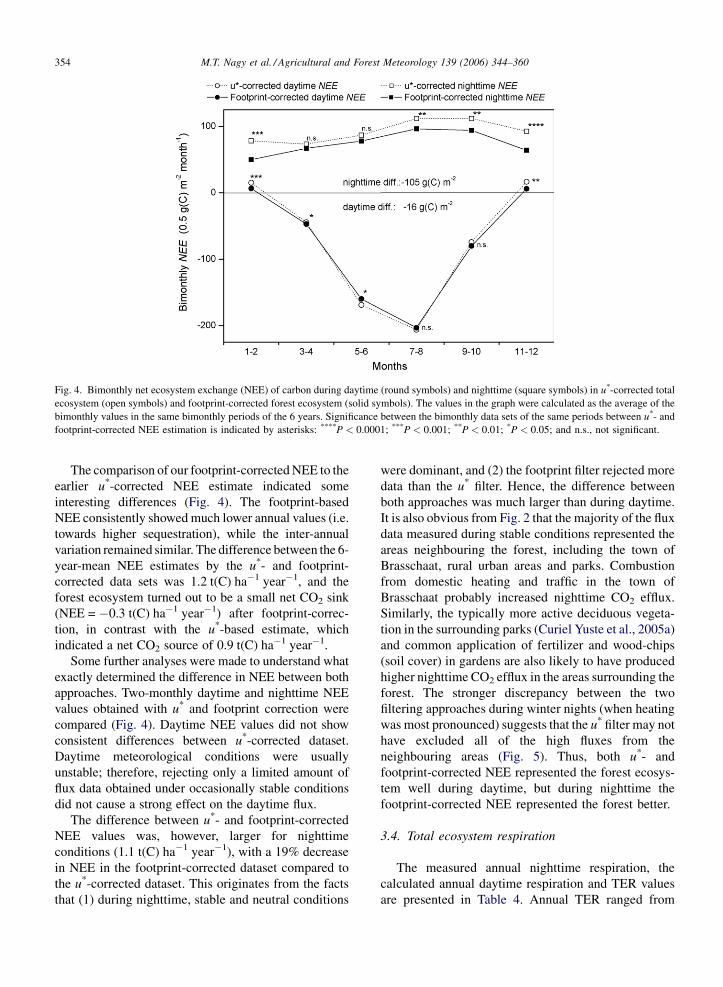
Fig. 4. Bimonthly net ecosystem exchange (NEE) of carbon during daytime (round symbols) and nighttime (square symbols) in u*-corrected total
ecosystem (open symbols) and footprint-corrected forest ecosystem (solid symbols). The values in the graph were calculated as the average of the
bimonthly values in the same bimonthly periods of the 6 years. Significance between the bimonthly data sets of the same periods between u*- and
footprint-corrected NEE estimation is indicated by asterisks: ****P < 0.0001; ***P < 0.001; **P < 0.01; *P < 0.05; and n.s., not significant.
The comparison of our footprint-corrected NEE to the
earlier u*-corrected NEE estimate indicated some
interesting differences (Fig. 4). The footprint-based
NEE consistently showed much lower annual values (i.e.
towards higher sequestration), while the inter-annual
variation remained similar. The difference between the 6-
year-mean NEE estimates by the u*- and footprint-
corrected data sets was 1.2 t(C) ha�1 year�1, and the
forest ecosystem turned out to be a small net CO2 sink
(NEE = �0.3 t(C) ha�1 year�1) after footprint-correc-
tion, in contrast with the u*-based estimate, which
indicated a net CO2 source of 0.9 t(C) ha�1 year�1.
Some further analyses were made to understand what
exactly determined the difference in NEE between both
approaches. Two-monthly daytime and nighttime NEE
values obtained with u* and footprint correction were
compared (Fig. 4). Daytime NEE values did not show
consistent differences between u*-corrected dataset.
Daytime meteorological conditions were usually
unstable; therefore, rejecting only a limited amount of
flux data obtained under occasionally stable conditions
did not cause a strong effect on the daytime flux.
The difference between u*- and footprint-corrected
NEE values was, however, larger for nighttime
conditions (1.1 t(C) ha�1 year�1), with a 19% decrease
in NEE in the footprint-corrected dataset compared to
the u*-corrected dataset. This originates from the facts
that (1) during nighttime, stable and neutral conditions
were dominant, and (2) the footprint filter rejected more
data than the u* filter. Hence, the difference between
both approaches was much larger than during daytime.
It is also obvious from Fig. 2 that the majority of the flux
data measured during stable conditions represented the
areas neighbouring the forest, including the town of
Brasschaat, rural urban areas and parks. Combustion
from domestic heating and traffic in the town of
Brasschaat probably increased nighttime CO2 efflux.
Similarly, the typically more active deciduous vegeta-
tion in the surrounding parks (Curiel Yuste et al., 2005a)
and common application of fertilizer and wood-chips
(soil cover) in gardens are also likely to have produced
higher nighttime CO2 efflux in the areas surrounding the
forest. The stronger discrepancy between the two
filtering approaches during winter nights (when heating
was most pronounced) suggests that the u* filter may not
have excluded all of the high fluxes from the
neighbouring areas (Fig. 5). Thus, both u*- and
footprint-corrected NEE represented the forest ecosys-
tem well during daytime, but during nighttime the
footprint-corrected NEE represented the forest better.
3.4. Total ecosystem respiration
The measured annual nighttime respiration, the
calculated annual daytime respiration and TER values
are presented in Table 4. Annual TER ranged from
M.T. Nagy et al. / Agricultural and Forest Meteorology 139 (2006) 344–360 355
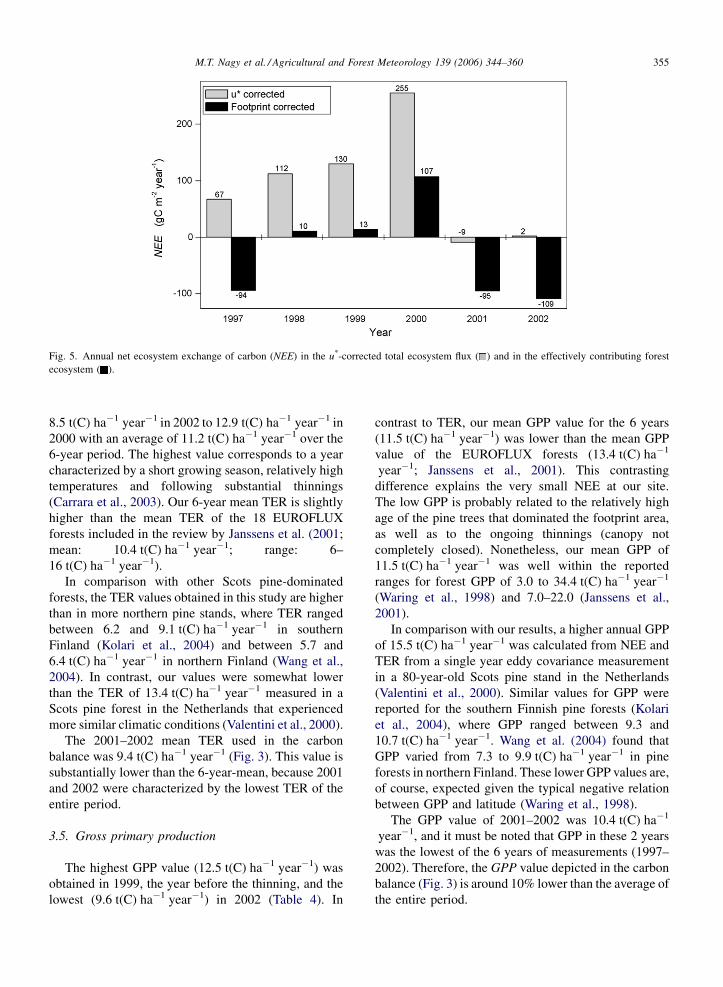
Fig. 5. Annual net ecosystem exchange of carbon (NEE) in the u*-corrected total ecosystem flux ( ) and in the effectively contributing forest
ecosystem ( ).
8.5 t(C) ha�1 year�1 in 2002 to 12.9 t(C) ha�1 year�1 in
2000 with an average of 11.2 t(C) ha�1 year�1 over the
6-year period. The highest value corresponds to a year
characterized by a short growing season, relatively high
temperatures and following substantial thinnings
(Carrara et al., 2003). Our 6-year mean TER is slightly
higher than the mean TER of the 18 EUROFLUX
forests included in the review by Janssens et al. (2001;
mean: 10.4 t(C) ha�1 year�1; range: 6–
16 t(C) ha�1 year�1).
In comparison with other Scots pine-dominated
forests, the TER values obtained in this study are higher
than in more northern pine stands, where TER ranged
between 6.2 and 9.1 t(C) ha�1 year�1 in southern
Finland (Kolari et al., 2004) and between 5.7 and
6.4 t(C) ha�1 year�1 in northern Finland (Wang et al.,
2004). In contrast, our values were somewhat lower
than the TER of 13.4 t(C) ha�1 year�1 measured in a
Scots pine forest in the Netherlands that experienced
more similar climatic conditions (Valentini et al., 2000).
The 2001–2002 mean TER used in the carbon
balance was 9.4 t(C) ha�1 year�1 (Fig. 3). This value is
substantially lower than the 6-year-mean, because 2001
and 2002 were characterized by the lowest TER of the
entire period.
3.5. Gross primary production
The highest GPP value (12.5 t(C) ha�1 year�1) was
obtained in 1999, the year before the thinning, and the
lowest (9.6 t(C) ha�1 year�1) in 2002 (Table 4). In
contrast to TER, our mean GPP value for the 6 years
(11.5 t(C) ha�1 year�1) was lower than the mean GPP
value of the EUROFLUX forests (13.4 t(C) ha�1
year�1; Janssens et al., 2001). This contrasting
difference explains the very small NEE at our site.
The low GPP is probably related to the relatively high
age of the pine trees that dominated the footprint area,
as well as to the ongoing thinnings (canopy not
completely closed). Nonetheless, our mean GPP of
11.5 t(C) ha�1 year�1 was well within the reported
ranges for forest GPP of 3.0 to 34.4 t(C) ha�1 year�1
(Waring et al., 1998) and 7.0–22.0 (Janssens et al.,
2001).
In comparison with our results, a higher annual GPP
of 15.5 t(C) ha�1 year�1 was calculated from NEE and
TER from a single year eddy covariance measurement
in a 80-year-old Scots pine stand in the Netherlands
(Valentini et al., 2000). Similar values for GPP were
reported for the southern Finnish pine forests (Kolari
et al., 2004), where GPP ranged between 9.3 and
10.7 t(C) ha�1 year�1. Wang et al. (2004) found that
GPP varied from 7.3 to 9.9 t(C) ha�1 year�1 in pine
forests in northern Finland. These lower GPP values are,
of course, expected given the typical negative relation
between GPP and latitude (Waring et al., 1998).
The GPP value of 2001–2002 was 10.4 t(C) ha�1
year�1, and it must be noted that GPP in these 2 years
was the lowest of the 6 years of measurements (1997–
2002). Therefore, the GPP value depicted in the carbon
balance (Fig. 3) is around 10% lower than the average of
the entire period.
M.T. Nagy et al. / Agricultural and Forest Meteorology 139 (2006) 344–360356
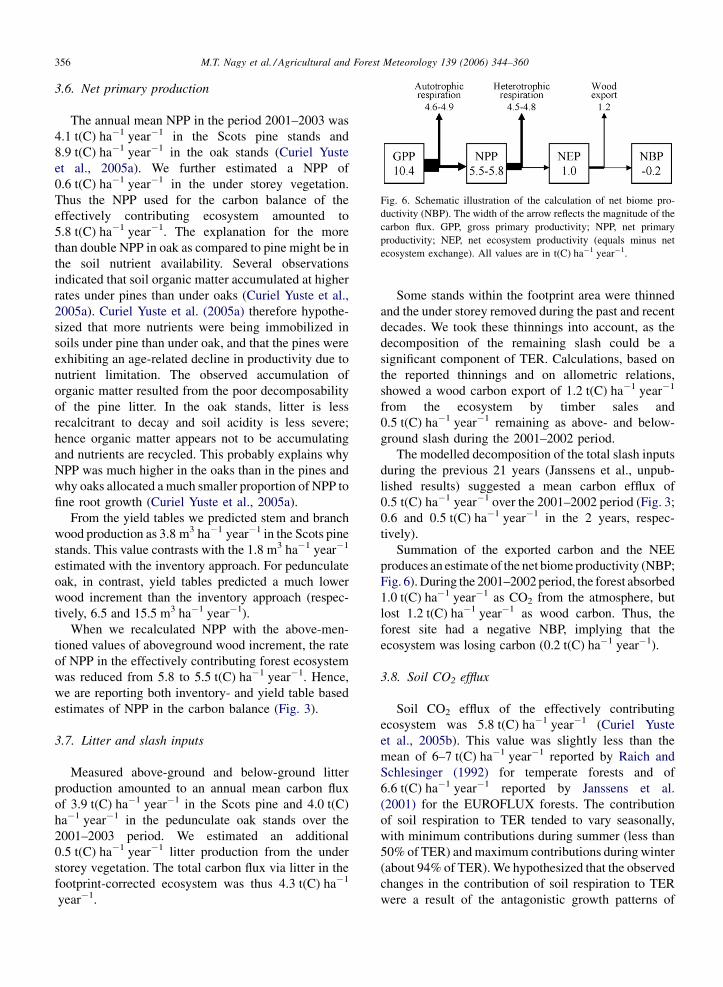
Fig. 6. Schematic illustration of the calculation of net biome pro-
ductivity (NBP). The width of the arrow reflects the magnitude of the
carbon flux. GPP, gross primary productivity; NPP, net primary
productivity; NEP, net ecosystem productivity (equals minus net
ecosystem exchange). All values are in t(C) ha�1 year�1.
3.6. Net primary production
The annual mean NPP in the period 2001–2003 was
4.1 t(C) ha�1 year�1 in the Scots pine stands and
8.9 t(C) ha�1 year�1 in the oak stands (Curiel Yuste
et al., 2005a). We further estimated a NPP of
0.6 t(C) ha�1 year�1 in the under storey vegetation.
Thus the NPP used for the carbon balance of the
effectively contributing ecosystem amounted to
5.8 t(C) ha�1 year�1. The explanation for the more
than double NPP in oak as compared to pine might be in
the soil nutrient availability. Several observations
indicated that soil organic matter accumulated at higher
rates under pines than under oaks (Curiel Yuste et al.,
2005a). Curiel Yuste et al. (2005a) therefore hypothe-
sized that more nutrients were being immobilized in
soils under pine than under oak, and that the pines were
exhibiting an age-related decline in productivity due to
nutrient limitation. The observed accumulation of
organic matter resulted from the poor decomposability
of the pine litter. In the oak stands, litter is less
recalcitrant to decay and soil acidity is less severe;
hence organic matter appears not to be accumulating
and nutrients are recycled. This probably explains why
NPP was much higher in the oaks than in the pines and
why oaks allocated a much smaller proportion of NPP to
fine root growth (Curiel Yuste et al., 2005a).
From the yield tables we predicted stem and branch
wood production as 3.8 m3 ha�1 year�1 in the Scots pine
stands. This value contrasts with the 1.8 m3 ha�1 year�1
estimated with the inventory approach. For pedunculate
oak, in contrast, yield tables predicted a much lower
wood increment than the inventory approach (respec-
tively, 6.5 and 15.5 m3 ha�1 year�1).
When we recalculated NPP with the above-men-
tioned values of aboveground wood increment, the rate
of NPP in the effectively contributing forest ecosystem
was reduced from 5.8 to 5.5 t(C) ha�1 year�1. Hence,
we are reporting both inventory- and yield table based
estimates of NPP in the carbon balance (Fig. 3).
3.7. Litter and slash inputs
Measured above-ground and below-ground litter
production amounted to an annual mean carbon flux
of 3.9 t(C) ha�1 year�1 in the Scots pine and 4.0 t(C)
ha�1 year�1 in the pedunculate oak stands over the
2001–2003 period. We estimated an additional
0.5 t(C) ha�1 year�1 litter production from the under
storey vegetation. The total carbon flux via litter in the
footprint-corrected ecosystem was thus 4.3 t(C) ha�1
year�1.
Some stands within the footprint area were thinned
and the under storey removed during the past and recent
decades. We took these thinnings into account, as the
decomposition of the remaining slash could be a
significant component of TER. Calculations, based on
the reported thinnings and on allometric relations,
showed a wood carbon export of 1.2 t(C) ha�1 year�1
from the ecosystem by timber sales and
0.5 t(C) ha�1 year�1 remaining as above- and below-
ground slash during the 2001–2002 period.
The modelled decomposition of the total slash inputs
during the previous 21 years (Janssens et al., unpub-
lished results) suggested a mean carbon efflux of
0.5 t(C) ha�1 year�1 over the 2001–2002 period (Fig. 3;
0.6 and 0.5 t(C) ha�1 year�1 in the 2 years, respec-
tively).
Summation of the exported carbon and the NEE
produces an estimate of the net biome productivity (NBP;
Fig. 6). During the 2001–2002 period, the forest absorbed
1.0 t(C) ha�1 year�1 as CO2 from the atmosphere, but
lost 1.2 t(C) ha�1 year�1 as wood carbon. Thus, the
forest site had a negative NBP, implying that the
ecosystem was losing carbon (0.2 t(C) ha�1 year�1).
3.8. Soil CO2 efflux
Soil CO2 efflux of the effectively contributing
ecosystem was 5.8 t(C) ha�1 year�1 (Curiel Yuste
et al., 2005b). This value was slightly less than the
mean of 6–7 t(C) ha�1 year�1 reported by Raich and
Schlesinger (1992) for temperate forests and of
6.6 t(C) ha�1 year�1 reported by Janssens et al.
(2001) for the EUROFLUX forests. The contribution
of soil respiration to TER tended to vary seasonally,
with minimum contributions during summer (less than
50% of TER) and maximum contributions during winter
(about 94% of TER). We hypothesized that the observed
changes in the contribution of soil respiration to TER
were a result of the antagonistic growth patterns of
M.T. Nagy et al. / Agricultural and Forest Meteorology 139 (2006) 344–360 357
shoots and roots caused by seasonal changes in carbon
allocation, the larger seasonal changes in foliar biomass
than in root biomass, and the differences in soil and air
temperature (Curiel Yuste et al., 2005b).
3.9. Carbon accumulation in biomass and soil
Based on the two inventories, we calculated that
biomass was increasing at a rate of 4.9 t(C) ha�1 year�1
in the pedunculate oak stands and of 0.2 t(C) ha�1 year�1
in the Scots pine stands. Biomass of the under storey of
the ecosystem was estimated to increase by
0.1 t(C) ha�1 year�1. These results suggested that the
total net biomass in the effectively contributing
ecosystem increased at a rate of 1.5 t(C) ha�1 year�1
(excluding harvest). When biomass increases were based
on yield table estimates, the rate of biomass increment
was 1.2 t(C) ha�1 year�1 in the effectively contributing
ecosystem (excluding harvest). Given that almost
1.7 t(C) ha�1 year�1 was removed from the biomass
compartment as wood export or slash, the biomass carbon
pool was declining by 0.2–0.6 t(C) ha�1 year�1.
The carbon balance of the effectively contributing
ecosystem further suggested no change in soil carbon
content when NPP was calculated from the results of the
inventory measurements. Both litter- and slash inputs
(4.3 and 0.5 t(C) ha�1 year�1) were in balance with
their decomposition rates (4.3 and 0.5 t(C) ha�1 year�1,
respectively). When growth was estimated with yield
tables, however, we calculated a small increment in soil
carbon (0.4 t(C) ha�1 year�1). Curiel Yuste et al.
(2005a) did observe C sequestration in the soil of the
pine stands, but unfortunately did not measure in the
other vegetation types. Thus, the forest ecosystem was
losing 0.2 t(C) ha�1 year�1 (see discussion about NBP
above) and this decline concealed a loss of biomass-
carbon of 0.2–0.6 t(C) ha�1 year�1 and a gain in soil
carbon of 0–0.4 t(C) ha�1 year�1.
3.10. Other component fluxes
Other components in the carbon balance model were
determined from simple equations as described in
Section 2. Two rates were obtained for several of the
missing components. These two rates represented
carbon fluxes when NPP was estimated either from
inventory results or from yield tables. Total autotrophic
respiration was estimated as 4.6–4.9 t(C) ha�1 year�1.
Of this total, aboveground autotrophic respiration
consumed the largest fraction (3.0 t(C) ha�1 year�1),
and root-mycorrhizal respiration the smallest: 1.6–
1.9 t(C) ha�1 year�1 (Fig. 3).
Heterotrophic respiration (RH) associated with the
decomposition of soil carbon (excluding the decom-
position of slash) was estimated as 3.9–4.3 t(C) ha�1
year�1.
3.11. Discussion of accuracy
To close the carbon balance, calculations were made
in the same order as the results presented above. As
measurement and scaling errors were thus propagated,
the individual autotrophic and heterotrophic respiratory
components were the most uncertain elements of the
carbon balance. We have no data to validate these
fluxes, nor information about their accuracy. An
alternative approach to test the validity of the flux
estimates in our carbon balance is to compare fluxes that
should be of similar magnitude or whose ratios are often
assumed to be relatively conservative. For instance, the
fact that the measured litter inputs and calculated
decomposition rates were of similar magnitude, despite
the fact that they were obtained independently, suggests
that either the values in the carbon balance are reliable,
or that both are incorrect.
The ratio of soil CO2 efflux to total ecosystem
respiration (0.62) was also very conservative and close
to the average ratio observed among the EUROFLUX
forests (0.63; Janssens et al., 2001).
The ratio of root respiration to soil CO2 efflux was
estimated at 27% when NPP was calculated from
allometric relations and 33% when the NPP calculation
was based on yield tables. Landsberg and Gower (1997)
reported that the average contribution of root respiration
to total soil CO2 efflux was 45% in forests, but the
estimates ranged widely from 22% (Tate et al., 1993) to
90% (Thierron and Laudelout, 1996). More recently,
Bond-Lamberty et al. (2004) reported global trends in
the contributions of roots and heterotrophs to soil CO2
efflux. When applied to our site, their regressions
predict root respiration to be 2.15 t(C) ha�1 year�1 (we
estimated 1.6–1.9), and heterotrophic respiration to be
3.4 t(C) ha�1 year�1 (we estimated 3.9–4.3). Although
our estimate of root respiration thus appears too low, it
is well within the ranges reported both by Landsberg
and Gower (1997) and Bond-Lamberty et al. (2004).
Another approach to check the accuracy of the
estimated values of the component fluxes in our carbon
balance is based on the assumption that respiration of
the different plant parts should be more or less
proportional to their NPP. For example, the ratio of
aboveground to belowground NPP (1.97 and 1.76
depending on the method) was very similar to the ratio
of aboveground to belowground autotrophic respiration
M.T. Nagy et al. / Agricultural and Forest Meteorology 139 (2006) 344–360358
(1.93 and 1.57 for both methods to determine NPP).
Also the ratio of NPPaboveground to Raboveground (1.15 and
1.03, respectively, for the two NPP estimates) was
similar to the ratio of NPPbelowground to RRoot (1.13 and
0.92, respectively, for the two NPP estimates). These
consistent results further increased confidence in the
validity of our carbon balance fluxes.
The observation of Waring et al. (1998) that NPP was
approximately proportional to GPP (0.47 � 0.04 (S.D.))
in 12 contrasting forest ecosystems allows a great
simplification of forest growth models. However, as
these authors calculated respiration and GPP in an
indirect way, their observation remains a hypothesis that
should be tested and verified by independent growth and
respiration measurements (Waring et al., 1998; Medlyn
and Dewar, 1999).
In our study growth was measured directly and GPP
was calculated independently. It should, however, be
noted that the GPP estimate of a specific year (using the
generally applied method for eddy covariance studies)
is not independent from the NPP of the previous years.
The calculation of GPP is based on the measurement of
TER, yet a substantial fraction of TER originates from
the decomposition of the previous years’ litter fall.
Therefore, comparing mean NPP to mean GPP over a
longer measurement period is a better reflection of the
NPP/GPP ratio.
When the mean NPP from the inventory measure-
ments of the 3 years period (2001–2003), i.e.
5.8 t(C) ha�1 year�1 was compared to the mean GPP
over 6 years (1997–2002), i.e. 11.5 t(C) ha�1 year�1,
the ratio was 0.51, a result that supports the hypothesis
of Waring et al. (1998). When the NPP calculation
based on yield tables (5.5 t(C) ha�1 year�1) was
compared to the 6 years’ mean GPP, the NPP/GPP
ratio changed to 0.475, which agreed almost perfectly
with the 0.47 prediction of Waring et al. (1998).
4. Conclusions
Application of a footprint correction to eddy
covariance CO2 flux data in a relatively small forest
reduced NEE by 1.2 t(C) ha�1 year�1 in comparison to
a u* correction, and shifted the NEE of the forest from
positive to negative (�0.3 t(C) ha�1 year�1).
These footprint-corrected NEE data were combined
with a footprint-weighted ecological study and manage-
ment information to construct a complete carbon
balance representative for the forested ecosystem.
Despite being a net CO2 sink, the forest was losing
carbon due to intensive thinnings and subsequent export
of wood. Our presented carbon balance further
describes the main carbon processes in a predominantly
old and even-aged Scots pine ecosystem, where the
declining growth process is accompanied by a low
carbon sequestration in the biosphere.
Our results tended to support the predicted 0.47 ratio
between NPP and GPP, even when these components
were measured independently in a forest ecosystem.
Volumes and rates in the carbon balance presented in
this study may differ from those in other ecosystem
types, but the similar footprint correction applied to
eddy covariance data, ecological measurements, and
management information makes the carbon balance
reported in this study relevant to better understand and
quantify carbon flows in forests.
Acknowledgements
This research was financially supported by the EC’s
Fourth (EUROFLUX contract ENV4-CT95-0078) and
Fifth (CARBOEUROFLUX contract EVKL-CT-1999-
00032) Framework Programs. The authors acknowl-
edge the Division of Forests & Green Areas of the
Ministry of the Flemish Community for access to the
forest site, the Institute for Forestry and Game
Management (IFG) and forest ranger M. Schuermans
for logistic support. We are also grateful to F.
Kockelbergh (UA), N. Calluy (UA) and Y. Buidin
(IFG) for technical assistance. M.T. Nagy was
supported by a grant from the UA-Research Council
(call 2003) during his sojourn at the University of
Antwerpen. This study also contributes to the GCTE
Core Project of the International Geosphere Biosphere
Programme (IGBP).
References
Aubinet, M., Grelle, A., Ibrom, A., Rannik, U., Moncrieff, J., Foken,
T., Kowalski, A.S., Martin, Ph., Berbigier, P., Clement, R., Elbers,
J., Granier, A., Grunwald, T., Morgenstern, K., Pilegaard, K.,
Rebmann, C., Snijders, W., Valentini, R., Vesala, T., 2000. Esti-
mates of the annual net carbon and water exchanges of forests: the
EUROFLUX methodology. Adv. Ecol. Res. 30, 113–175.
Baeyens, L., Van Slycken, J., Stevens, D., 1993. Description of the
Soil Profile in Brasschaat. Internal Research Paper. Institute for
Forestry and Game Management, Geraardsbergen, Belgium, pp.
17.
Baldocchi, D.D., Hicks, B.B., Meyers, T.P., 1988. Measuring bio-
sphere–atmosphere exchange of biologically related gases with
micrometeorological methods. Ecology 69, 1331–1340.
Baldocchi, D.D., Falge, E., Gu, L., Olson, R., Hollinger, D., Running,
S., Anthoni, P., Bernhofer, C., Davis, K., Fuentes, J., Goldstein, A.,
Katul, G., Law, B., Lee, X., Mahli, Y., Meyers, T., Munger, W.,
Oechel, W., Paw, U.K.T., Pilegaard, K., Schmid, H.P., Valentini,
R., Verma, S., Vesala, T., Wilson, K., Wofsy, S., 2001. FLUXNET:
a new tool to study the temporal and spatial variability of
M.T. Nagy et al. / Agricultural and Forest Meteorology 139 (2006) 344–360 359
ecosystem-scale carbon dioxide, water vapour and energy flux
densities. Bull. Am. Meteorol. Soc. 82, 2415–2434.
Battaglia, M., Sands, P., 1997. Modelling site productivity of Euca-
lyptus globulus in response of climatic and site factors. Aust. J.
Plant Physiol. 24, 831–850.
Berg, B., 1984. Decomposition of root litter and some factors regulat-
ing the process. Soil Biol. Biochem. 16, 609–617.
Berg, B., Staaf, H., 1987. Release of nutrients from decomposition of
white birch leaves and Scots pine needle litter. Pedobiology 30,
55–63.
Berg, B., McClaugherty, C.A., Johansson, M.-B., 1993. Litter mass
loss rates in late stages of decomposition at some climatically and
nutritionally different pine sites. Long-term decomposition in a
Scots pine forest. VIII. Can. J. Bot. 71, 680–692.
Bond-Lamberty, B., Chuankuan, W., Gower, S.T., 2004. A global
relationship between heterotrophic and autotrophic components of
soil respiration? Global Change Biol. 10, 1756–1766.
Carrara, A., Kowalski, A.S., Neirynck, J., Janssens, I.A., Curiel Yuste,
J., Ceulemans, R., 2003. Net ecosystem CO2 exchange of mixed
forest in Belgium over 5 years. Agric. For. Meteorol. 119, 209–
227.
Carrara, A., Janssens, I.A., Curiel Yuste, J., Ceulemans, R., 2004.
Seasonal changes in photosynthesis, respiration and NEE of a
mixed temperate forest. Agric. For. Meteorol. 126, 15–31.
Curiel Yuste, J., Konopka, B., Janssens, I.A., Coenen, K., Xiao, C.W.,
Ceulemans, R., 2005a. Contrasting net primary productivity and
carbon distribution between neighbouring stands of Quercus robur
and Pinus sylvestris. Tree Physiol. 25, 701–712.
Curiel Yuste, J., Nagy, M., Janssens, I.A., Carrara, A., Ceulemans, R.,
2005b. Soil respiration in a mixed temperate forest and its
contribution to total ecosystem respiration. Tree Physiol. 25,
609–619.
de Pury, D.G.G., Ceulemans, R., 1997. Scaling-up carbon fluxes from
leaves to stands in a patchy coniferous/deciduous forest. In:
Mohren, G.M.J., Kramer, K., Sabate, S. (Eds.), Impacts of Global
Change on Tree Physiology and Forest Ecosystems. Kluwer
Academic Publishers, Dordrecht, pp. 263–272.
Desjardins, R.L., 1985. Carbon dioxide budget of maize. Agric. For.
Meteorol. 36, 29–41.
Falge, E., Baldocchi, D., Olson, R.J., Anthoni, P., Aubinet, M.,
Bernhofer, C., Burba, G., Ceulemans, R., Dolman, H., Granier,
A., Gross, P., Grunwald, T., Hollinger, D., Jensen, N.O., Katul, G.,
Keronen, P., Kowalski, A.S., Ta Lai, C., Law, B.E., Meyers, T.,
Moncrieff, J., Moors, E., Munger, J.W., Pilegaard, K., Rannik, U.,
Rebmann, C., Suyker, A., Tenhunen, J., Tu, K., Verma, S., Vesala,
T., Wilson, K., Wofsy, S., 2001. Gap filling strategies for defen-
sible annual sums of net ecosystem exchange. Agric. For.
Meteorol. 107, 43–69.
Falge, E., Baldocchi, D., Tenhunen, J., Aubinet, M., Bakwin, P.,
Berbigier, P., Bernhofer, C., Burba, G., Clement, R., Davis,
K.J., Elbers, J.A., Goldstein, A.H., Grelle, A., Granier, A., Guo-
mundsson, J., Hollinger, D., Kowalski, A.S., Katul, G., Law, B.E.,
Malhi, Y., Meyers, T., Monson, R.K., Munger, J.W., Oechel, W.,
Paw, K.T., Pilegaard, K., Rannik, U., Rebmann, C., Suyker, A.,
Valentini, R., Wilson, K., Wofsy, S., 2002. Seasonality of eco-
system respiration and gross primary production as derived from
FLUXNET measurements. Agric. For. Meteorol. 113, 53–74.
Gond, V., de Pury, D.G.G., Veroustraete, F., Ceulemans, R., 1999.
Seasonal variation in leaf area index, leaf chlorophyll, and water
content; scaling-up to estimate fAPAR and carbon balance in a
multilayer, multispecies temperate forest. Tree Physiol. 19, 673–
679.
Goulden, M.L., Munger, J.W., Fan, S.M., Daube, B.C., Wofsy, S.C.,
1996. Measurements of carbon storage by long-term eddy correla-
tion: methods and a critical assessment of accuracy. Global
Change Biol. 2, 169–182.
Jansen, J.J., Sevenster, J., Faber, P.J., 1996. Opbrengsttabellen voor
belangrijke boomsoorten in Nederland (Yield tables for important
tree species in the Netherlands). IBN Report 221, IBN-DLO,
Wageningen, pp. 42–45 and 77–82 (in Dutch).
Janssens, I.A., Sampson, D.A., Cermak, J., Meiresonne, L., Riguzzi,
F., Overloop, S., Ceulemans, R., 1999. Above- and below-ground
phytomass and carbon storage in a Belgian Scots pine stand. Ann.
For. Sci. 56, 81–90.
Janssens, I.A., Meiresonne, L., Ceulemans, R., 2000. Mean soil CO2
efflux from a mixed forest: temporal and spatial integration. In:
Ceulemans, R.J.M., Veroustraete, F., Gond, V., Van Rensbergen,
J.B.H.F. (Eds.), Forest Ecosystem Modeling, Upscaling and
Remote Sensing. SPB Academic Publishing, The Hague, The
Netherlands, pp. 19–33.
Janssens, I.A., Lankreijer, H., Matteucci, G., Kowalski, A.S., Buch-
mann, N., Epron, D., Pilegaard, K., Kutsch, W., Longdoz, B.,
Grunwald, T., Montagnani, L., Dore, S., Rebmann, C., Moors, E.J.,
Grelle, A., Rannik, U., Morgenstern, K., Clement, R., Oltchev, S.,
Guðmundsson, J., Minerbi, S., Berbigier, P., Ibrom, A., Moncrieff,
J., Aubinet, M., Bernhofer, C., Jensen, N.O., Vesala, T., Granier,
A., Schulze, E.-D., Lindroth, A., Dolman, A.J., Jarvis, P.G.,
Ceulemans, R., Valentini, R., 2001. Productivity overshadows
temperature in determining soil and ecosystem respiration across
European forests. Global Change Biol. 7, 269–278.
Kolari, P., Pumpanen, J., Rannik, U., Ilvesniemi, H., Hari, P., Ber-
ninger, F., 2004. Carbon balance of different aged Scots pine
forests in Southern Finland. Global Change Biol. 10, 1106–1119.
Konopka, B., Curiel Yuste, J., Janssens, I.A., Ceulemans, R., 2005.
Comparison of fine root dynamics in Scots pine and Pedunculate
oak in sandy soil. Plant and Soil 276, 33–45.
Kowalski, A.S., Overloop, S., Ceulemans, R., 2000. Eddy fluxes above
a Belgian, Campine forest and their relationship with predicting
variables. In: Ceulemans, R.J.M., Veroustraete, F., Gond, V., Van
Rensbergen, J.B.H.F. (Eds.), Forest Ecosystem Modeling, Upscal-
ing and Remote Sensing. SPB Academic Publishing, The Hague,
The Netherlands, pp. 3–17.
Landsberg, J.J., Gower, S.T., 1997. Applications of Physiological
Ecology to Forest Management. Academic Press, San Diego.
Landsberg, J.J., Waring, R.H., 1997. A generalised model of forest
productivity using simplified concepts of radiation-use efficiency,
carbon balance and partitioning. For. Ecol. Manage. 95, 209–228.
Liski, J., Perruchoud, D., Karjalainen, T., 2002. Increasing carbon
stocks in the forest soils of western Europe. For. Ecol. Manage.
169, 159–175.
Makela, A., Valentine, H.T., 2001. The ratio of NPP to GPP: evidence
of change over the course of stand development. Tree Physiol. 21,
1015–1030.
McClaugherty, C.A., Aber, J.D., Melillo, J.M., 1984. Decomposition
dynamics of fine roots in forested ecosystems. Oikos 42, 378–386.
Medlyn, B.E., Dewar, R.C., 1999. Comment on the article by R.H.
Waring, J. Landsberg and M. Williams relating net primary
production to gross primary production. Tree Physiol. 19, 137–
138.
Michaelis, L., Menten, M.L., 1913. Die Kinetik der Invertin Wirkung.
Biochemische Zeitschrift 49, 333.
Moncrieff, J.B., Massheder, J.M., de Bruin, H., Elbers, J., Friborg, T.,
Heusinkveld, B., Kabat, P., Scott, S., Soegaard, H., Verhoef, A.,
1997. A system to measure surface fluxes of momentum, sensible
M.T. Nagy et al. / Agricultural and Forest Meteorology 139 (2006) 344–360360
heat, water vapour and carbon dioxide. J. Hydrol. 188–189, 589–
611.
Nadezhdina, N., Tatarinov, F., Ceulemans, R., 2003. Leaf area and
biomass of Rhododendron under story in a stand of Scots pine. For.
Ecol. Manage. 187, 235–246.
Neirynck, J., Van Ranst, E., Roskams, P., Lust, N., 2002. Impact of
decreasing through fall depositions on soil solutions chemistry at
coniferous monitoring sites in northern Belgium. For. Ecol. Man-
age. 160, 127–142.
Overloop, S., Meiresonne, L., 1999. Basiskarakteristieken van het
proefvlak Brasschaat, domeinbos de Inslag. Communications of
the Institute for Forestry and Game Management, Ministry of the
Flemish Community 1, pp. 11–21 (in Dutch).
Prentice, I.C., Farquhar, G.D., Fasham, M.J.R., Goulden, M.L.,
Heimann, M., Kheshi, H.S., Le Quere, C., Scholes, R.J., Wallace,
D.W.R., Archer, D., Ashmore, M.R., Aumont, O., Baker, D.,
Battle, M., Bender, M., Bopp, L.P., Bousquet, P., Caldeira, K.,
Ciais, P., Cramer, W., Dentener, F., Enting, I.G., Field, C.B.,
Holland, E.A., Houghton, R.A., House, J.I., Ishida, A., Jain,
A.K., Janssens, I.A., Joos, F., Kaminski, T., Keeling, C.D.,
Keeling, R.F., Kicklighter, D.W., Kohfeld, K.E., Knorr, W.,
Law, R., Lenton, T., Lindsay, K., Maier-Reimer, E., Manning,
A., Matear, R.J., McGuire, A.D., Melillo, J.M., Meyer, R., Mund,
M., Orr, J.C., Piper, S., Plattner, K., Rayner, P.J., Sitch, S., Slater,
R., Taguchi, S., Tans, P.P., Tian, H.Q., Weirig, M.F., Whorf, T.,
Yool, A., 2001. The carbon cycle and atmospheric carbon
dioxide. In: Houghton, J.T., Ding, Y., Griggs, D.J., Noguer,
M., van der Linden, P.J., Xiaosu, D. (Eds.), Climate Change
2001. The Scientific Basis. Contribution of Working Group I to
the Third Assessment Report of the Intergovernmental Panel on
Climate Change. Cambridge University Press, Cambridge, pp.
183–237.
Rebmann, C., Gockede, M., Foken, T., Aubinet, M., Aurela, M.,
Berbigier, P., Bernhofer, C., Buchmann, N., Carrara, A., Cescatti,
A., Ceulemans, R., Clement, R., Elbers, J.A., Granier, A., Grun-
wald, T., Guyon, D., Havrankova, K., Heinesch, B., Knohl, A.,
Laurila, T., Longdoz, B., Marcolla, B., Markkanen, T., Miglietta,
F., Moncrieff, J., Montagnani, L., Moors, E., Nardino, M., Ourci-
val, J.M., Rambal, S., Rannik, U., Rotenberg, E., Sedlak, P.,
Unterhuber, G., Vesala, T., Yakir, D., 2005. Quality analysis
applied on eddy covariance measurements at complex forest sites
using footprint modelling. Theor. Appl. Clim. 80, 121–141.
Raich, J.W., Schlesinger, W.H., 1992. The global carbon dioxide flux
in soil respiration and its relationship to vegetation and climate.
Tellus 44B, 81–99.
Roskams, P., Sioen, G., Overloop, S., 1997. Meetnet voor de inten-
sieve monitoring van het bosecosysteem in het Vlaamse Gewest
resultaten 1991–1992. Communications of the Institute for For-
estry and Game Management, Ministry of the Flemish Community
(in Dutch), pp. 191.
Schmid, H.P., 1997. Experimental design for flux measurements:
matching scales of observations and fluxes. Agric. For. Meteorol.
87, 179–200.
Swinbank, W.C., 1951. The measurement of vertical transfer of heat
and water vapour by eddies in the lower atmosphere. J. Atmos. Sci.
8, 135–145.
Tate, K.R., Ross, D.J., O’Brien, B.J., Kelliher, F.M., 1993. Carbon
storage and turnover, and respiratory activity, in the litter and soil
of an old-growth southern beech (Nothofagus) forest. Soil Biol.
Biochem. 25, 1601–1612.
Thierron, V., Laudelout, H., 1996. Contribution of root respiration to
total CO2 efflux from the soil of a deciduous forest. Can. J. For.
Res. 26, 1142–1148.
Thornley, J.H.M., Cannell, M.G.R., 2000. Modelling the components
of plant respiration. Ann. Bot. 85, 55–67.
Valentini, R., Matteucci, G., Dolman, A.J., Schulze, E.-D., Rebmann,
C., Moors, E.J., Granier, A., Gross, P., Jensen, N.O., Pilegaard, K.,
Lindroth, A., Grelle, A., Bernhofer, C., Grunwald, T., Aubinet, M.,
Ceulemans, R., Kowalski, A.S., Vesala, T., Rannik, U., Berbigier,
P., Loustau, D., Gudmundsson, J., Thorgeirsson, H., Ibrom, A.,
Morgenstern, K., Clement, R., Moncrieff, J., Montagnani, L.,
Minerbi, S., Jarvis, P.G., 2000. Respiration as the main determi-
nant of carbon balance in European forests. Nature 404, 861–865.
Verma, S.B., Baldocchi, D.D., Anderson, D.E., Matt, D.R., Clement,
R.J., 1986. Eddy fluxes of CO2, water vapour and sensible heat
over a deciduous forest. Boundary-Layer Meteorol. 36, 71–91.
Wang, K.-Y., Kellomaki, S., Zha, T.S., Peltola, H., 2004. Component
carbon fluxes and their contribution to ecosystem carbon exchange
in a pine forest: an assessment based on eddy covariance measure-
ments and an integrated model. Tree Physiol. 24, 19–34.
Waring, R.H., Landsberg, J.J., Williams, M., 1998. Net primary
production of forests: a constant fraction of gross primary
production? Tree Physiol. 18, 129–134.
Wyngaard, J.C., Cote, O.R., Izumi, Y., 1971. Local free convection,
similarity and the budgets of shear stress and heat flux. J. Atmos.
Sci. 28, 1171–1182.
Xiao, C.-W., Curiel Yuste, J., Janssens, I.A., Roskams, P., Nachtergale,
L., Carrara, A., Sanchez, B.Y., Ceulemans, R., 2003. Above- and
belowground biomass and net primary production in a 73-year-old
Scots pine forest. Tree Physiol. 23, 505–516.


![2013 PRODUCT FOOTPRINT REPORT MARCH 12, 2014 …Global Warming ("carbon footprint") [kg CO2-equiv.] : A measure of greenhouse gas emissions, such as CO2 and methane. These emissions](https://img.pdfslide.us/doc/110x75/60de4d1f5e4c5c44de6fdb55/2013-product-footprint-report-march-12-2014-global-warming-carbon-footprint.jpg)