Embed Size (px)
Citation preview
2 0 17 S U S TA I N A B I L I T Y R E P O R T
purpose + people + action
1. EXECUTIVE SUMMARY .......................................................................................................................................................3About the Theme.........................................................................................................................................................................4Message from our CEO and CSO .........................................................................................................................................52017 Year in Review ..................................................................................................................................................................9Company Profile ........................................................................................................................................................................13Stakeholder Engagement and Material Issues .................................................................................................................18 Alignment with United Nations SDGs .................................................................................................................................25
2. PRODUCT RESPONSIBILITY ......................................................................................................................................... 34Building Science ...................................................................................................................................................................... 35Product Innovation ................................................................................................................................................................... 43Product Sustainability + Stewardship ................................................................................................................................49
3. ENVIRONMENTAL RESPONSIBILITY .........................................................................................................................62Climate Change ....................................................................................................................................................................... 63Energy ......................................................................................................................................................................................... 66Emissions ....................................................................................................................................................................................75Water .......................................................................................................................................................................................... 88Waste .......................................................................................................................................................................................... 94Protecting Biodiversity ......................................................................................................................................................... 105Environmental Control .......................................................................................................................................................... 108
4. SOCIAL RESPONSIBILITY ..............................................................................................................................................110Employee Experience ............................................................................................................................................................111Human Rights ......................................................................................................................................................................... 128Healthy Living.......................................................................................................................................................................... 133Living Safely ............................................................................................................................................................................ 140Community Impact ................................................................................................................................................................ 148
5. SUPPLY CHAIN RESPONSIBILITY ............................................................................................................................ 159Supply Chain Sustainability ................................................................................................................................................ 160
6. ECONOMIC RESPONSIBILITY .................................................................................................................................... 170Growth Strategy + Prosperity ............................................................................................................................................ 171Economic Impact ................................................................................................................................................................... 177
7. GOVERNANCE AND ETHICS ......................................................................................................................................... 180Corporate Governance ........................................................................................................................................................ 181Ethics ........................................................................................................................................................................................ 193
8. ABOUT THE REPORT ........................................................................................................................................................ 201APPENDICES .............................................................................................................................................................................206GRI STANDARDS INDEX .....................................................................................................................................................233
Table of Contents
COVER PHOTO CREDIT:
Kelsey David | Gastonia, North Carolina, U.S.
Owens Corning employee Claudia Losada, during a company-sponsored volunteer day for Habitat for Humanity in October 2017
PHOTO CREDIT:
Lance Li, Shanghai, China
Lance Li and his family enjoying the spring sunshine in a park in Shanghai, China
1Executive SummaryABOUT THE THEME
MESSAGE FROM OUR CEO AND CSO
2017 YEAR IN REVIEW
COMPANY PROFILE
STAKEHOLDER ENGAGEMENT AND MATER IAL ISSUES
ALIGNMENT WITH UN ITED NATIONS SDGs
2017 OWENS CORNING SUSTAINABILITY REPORT | PURPOSE + PEOPLE + ACTION | 4
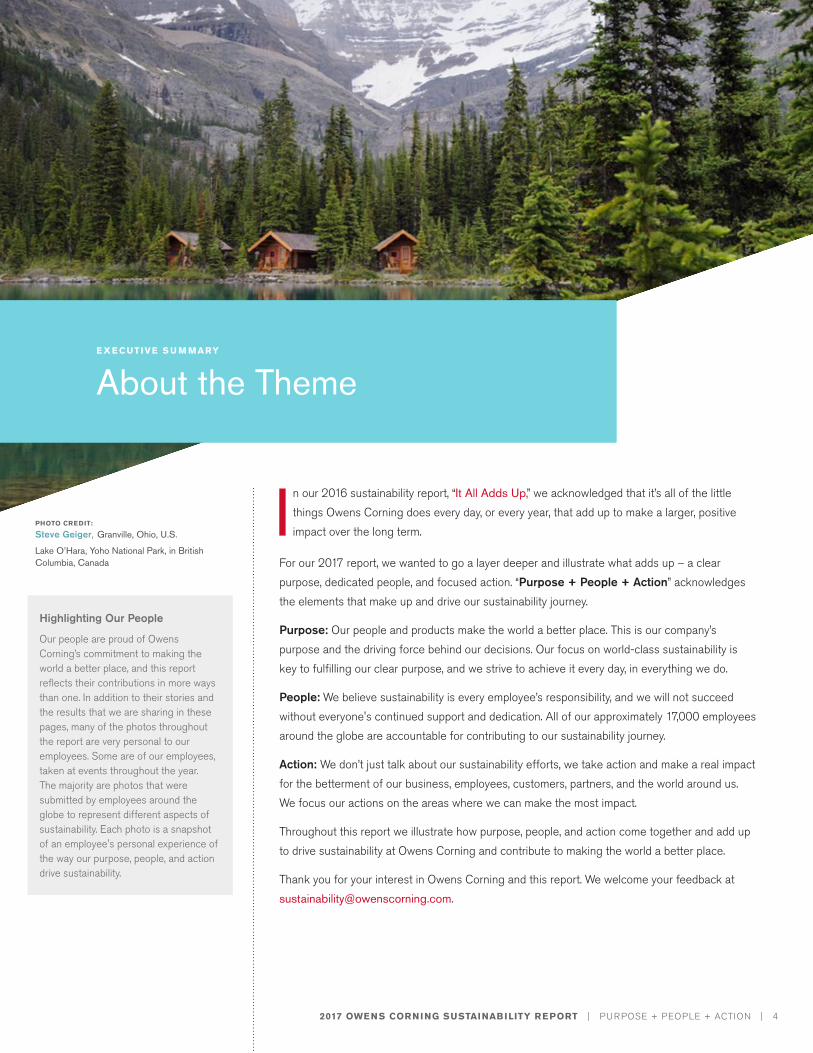
PHOTO CREDIT:
Steve Geiger, Granville, Ohio, U.S.
Lake O’Hara, Yoho National Park, in British Columbia, Canada
I n our 2016 sustainability report, “It All Adds Up,” we acknowledged that it’s all of the little things Owens Corning does every day, or every year, that add up to make a larger, positive impact over the long term.
For our 2017 report, we wanted to go a layer deeper and illustrate what adds up – a clear purpose, dedicated people, and focused action. “Purpose + People + Action” acknowledges the elements that make up and drive our sustainability journey.
Purpose: Our people and products make the world a better place. This is our company’s purpose and the driving force behind our decisions. Our focus on world-class sustainability is key to fulfilling our clear purpose, and we strive to achieve it every day, in everything we do.
People: We believe sustainability is every employee’s responsibility, and we will not succeed without everyone's continued support and dedication. All of our approximately 17,000 employees around the globe are accountable for contributing to our sustainability journey.
Action: We don’t just talk about our sustainability efforts, we take action and make a real impact for the betterment of our business, employees, customers, partners, and the world around us. We focus our actions on the areas where we can make the most impact.
Throughout this report we illustrate how purpose, people, and action come together and add up to drive sustainability at Owens Corning and contribute to making the world a better place.
Thank you for your interest in Owens Corning and this report. We welcome your feedback at [email protected].
E X E CUTIVE S U M MARY
About the Theme
Our people are proud of Owens Corning’s commitment to making the world a better place, and this report reflects their contributions in more ways than one. In addition to their stories and the results that we are sharing in these pages, many of the photos throughout the report are very personal to our employees. Some are of our employees, taken at events throughout the year. The majority are photos that were submitted by employees around the globe to represent different aspects of sustainability. Each photo is a snapshot of an employee's personal experience of the way our purpose, people, and action drive sustainability.
Highlighting Our People
2017 OWENS CORNING SUSTAINABILITY REPORT | PURPOSE + PEOPLE + ACTION | 5
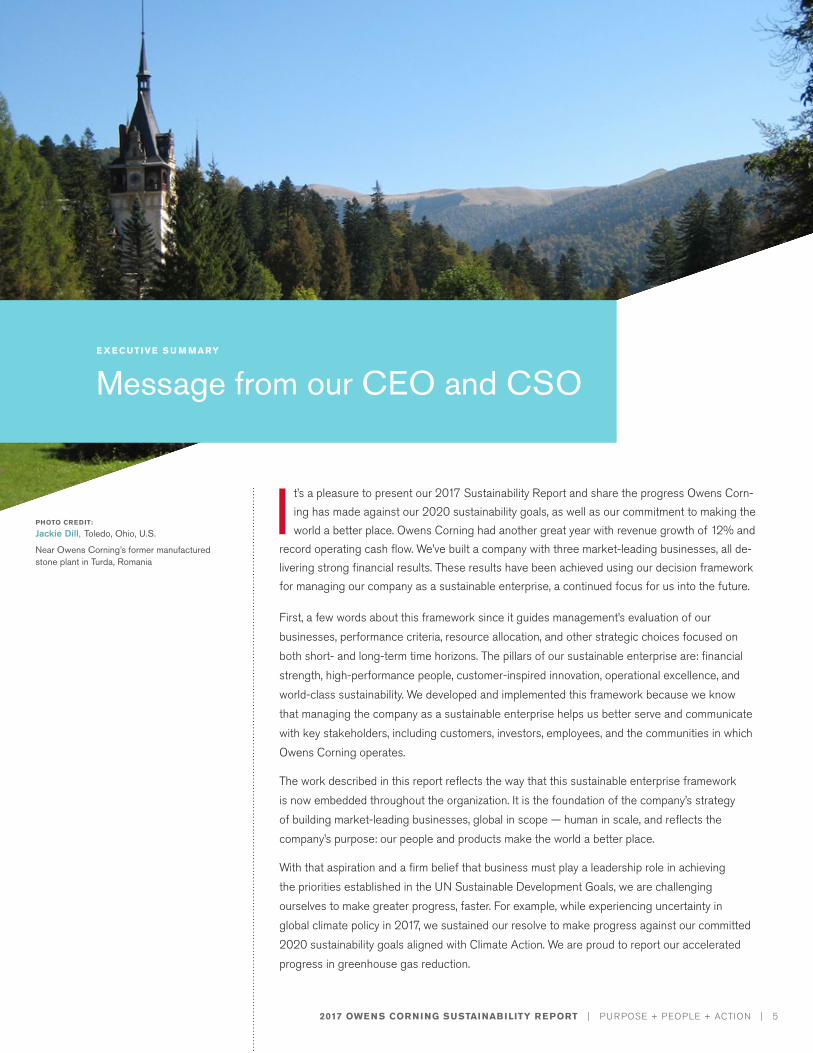
PHOTO CREDIT:
Jackie Dill, Toledo, Ohio, U.S.
Near Owens Corning’s former manufactured stone plant in Turda, Romania
E X E CUTIVE S U M MARY
Message from our CEO and CSO
I t’s a pleasure to present our 2017 Sustainability Report and share the progress Owens Corn-ing has made against our 2020 sustainability goals, as well as our commitment to making the world a better place. Owens Corning had another great year with revenue growth of 12% and
record operating cash flow. We’ve built a company with three market-leading businesses, all de-livering strong financial results. These results have been achieved using our decision framework for managing our company as a sustainable enterprise, a continued focus for us into the future.
First, a few words about this framework since it guides management’s evaluation of our businesses, performance criteria, resource allocation, and other strategic choices focused on both short- and long-term time horizons. The pillars of our sustainable enterprise are: financial strength, high-performance people, customer-inspired innovation, operational excellence, and world-class sustainability. We developed and implemented this framework because we know that managing the company as a sustainable enterprise helps us better serve and communicate with key stakeholders, including customers, investors, employees, and the communities in which Owens Corning operates.
The work described in this report reflects the way that this sustainable enterprise framework is now embedded throughout the organization. It is the foundation of the company’s strategy of building market-leading businesses, global in scope — human in scale, and reflects the company’s purpose: our people and products make the world a better place.
With that aspiration and a firm belief that business must play a leadership role in achieving the priorities established in the UN Sustainable Development Goals, we are challenging ourselves to make greater progress, faster. For example, while experiencing uncertainty in global climate policy in 2017, we sustained our resolve to make progress against our committed 2020 sustainability goals aligned with Climate Action. We are proud to report our accelerated progress in greenhouse gas reduction.
2017 OWENS CORNING SUSTAINABILITY REPORT | PURPOSE + PEOPLE + ACTION | 6
E X E CUTIVE S U M MARY
Message from our CEO and CSO
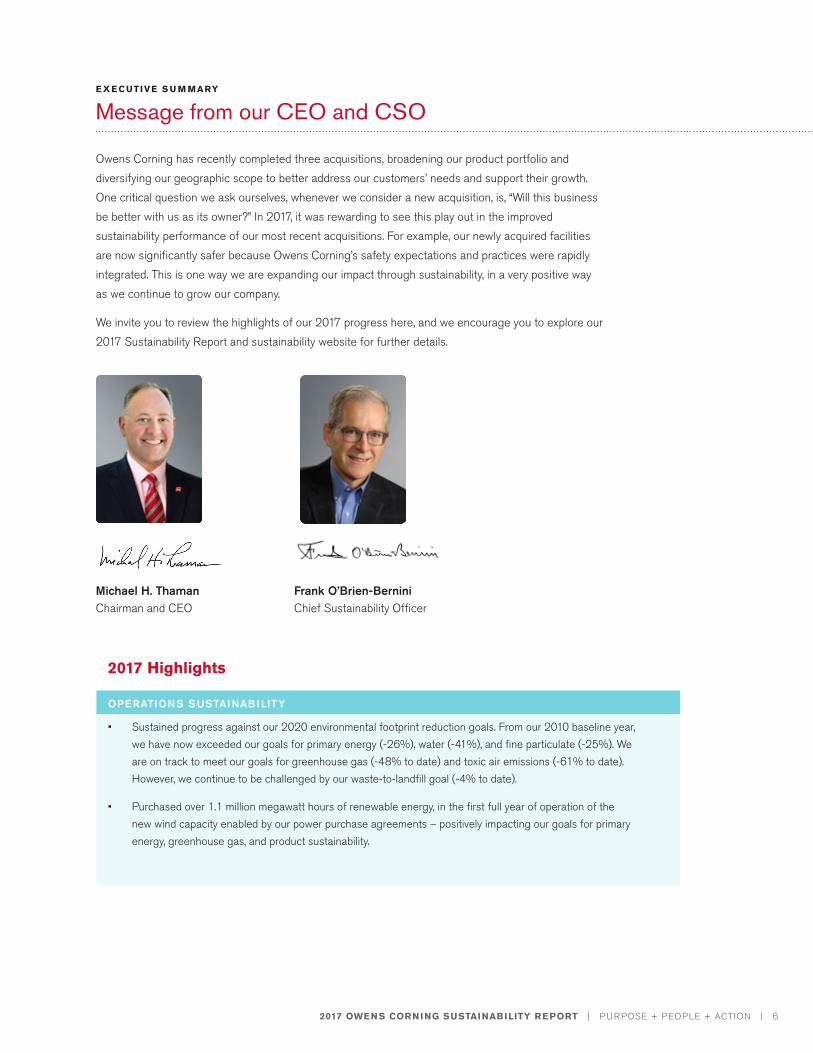
Owens Corning has recently completed three acquisitions, broadening our product portfolio and diversifying our geographic scope to better address our customers’ needs and support their growth. One critical question we ask ourselves, whenever we consider a new acquisition, is, “Will this business be better with us as its owner?” In 2017, it was rewarding to see this play out in the improved sustainability performance of our most recent acquisitions. For example, our newly acquired facilities are now significantly safer because Owens Corning’s safety expectations and practices were rapidly integrated. This is one way we are expanding our impact through sustainability, in a very positive way as we continue to grow our company.
We invite you to review the highlights of our 2017 progress here, and we encourage you to explore our 2017 Sustainability Report and sustainability website for further details.
Michael H. Thaman Chairman and CEO
Frank O’Brien-Bernini Chief Sustainability Officer
2017 Highlights
OPERATIONS SUSTAINABILITY
• Sustained progress against our 2020 environmental footprint reduction goals. From our 2010 baseline year, we have now exceeded our goals for primary energy (-26%), water (-41%), and fine particulate (-25%). We are on track to meet our goals for greenhouse gas (-48% to date) and toxic air emissions (-61% to date). However, we continue to be challenged by our waste-to-landfill goal (-4% to date).
• Purchased over 1.1 million megawatt hours of renewable energy, in the first full year of operation of the new wind capacity enabled by our power purchase agreements – positively impacting our goals for primary energy, greenhouse gas, and product sustainability.
2017 OWENS CORNING SUSTAINABILITY REPORT | PURPOSE + PEOPLE + ACTION | 7
E X E CUTIVE S U M MARY
2017 Highlights
PRODUCT AND SUPPLY CHAIN SUSTAINABILITY
• Manufactured the world’s first products certified as made with 100% wind-powered electricity and
reduced embodied carbon: EcoTouch® Insulation, Thermafiber® RainBarrier® continuous insulation, and unbonded loosefill insulation.
• Introduced the first formaldehyde-free mineral wool insulation in North America Thermafiber® SAFB™ (Sound Attenuation Fire Blankets) FF.
• Earned the world’s first and only asthma & allergy friendly® certification for insulation products — Pure Safety™ high performance insulation.
• Earned the first insulation SAFETY Act Designation through the Department of Homeland Security for
several Thermafiber® fire barrier solutions — qualified as anti-terrorism technologies, providing a safety and liability benefit to our customers, building owners, architects, and contractors.
• Acquired Pittsburgh Corning, the leading producer of FOAMGLAS® cellular glass insulation systems, expanding our portfolio with this high-performance insulation offering unique sustainability attributes, water and fire resistance, high compressive strength, and durable thermal performance.
• Achieved our highest ever recycled glass use and recycled glass content in our insulation products, recycling over 1.4 billion pounds.
ENERGY EFFICIENCY AND DURABLE MATERIAL SOLUTIONS AT SCALE
• Hosted our second Builder Summit, taught by internal and external world-class experts and attended by 20 select builders, focused on expanding skills and capabilities to improve the builders’ businesses through building highly energy-efficient, durable, and comfortable homes.
• Produced a simple video, detailing how products can be certified as made with 100% wind-powered electricity and reduced embodied carbon, to help others adopt this market-pull climate strategy.
• Acquired Aslan FRP™, producer of composite rebar used to reinforce concrete in new and restorative infrastructure. This acquisition will help us accelerate market transformation by providing a compelling alternative to steel reinforcements in concrete structures. Sustainability advantages include corrosion resistance, lighter weight, and service life of 100 years.
2017 OWENS CORNING SUSTAINABILITY REPORT | PURPOSE + PEOPLE + ACTION | 8
E X E CUTIVE S U M MARY
2017 Highlights
SAFETY, HEALTH, EMPLOYEE ENGAGEMENT, AND COMMUNITY VITALITY
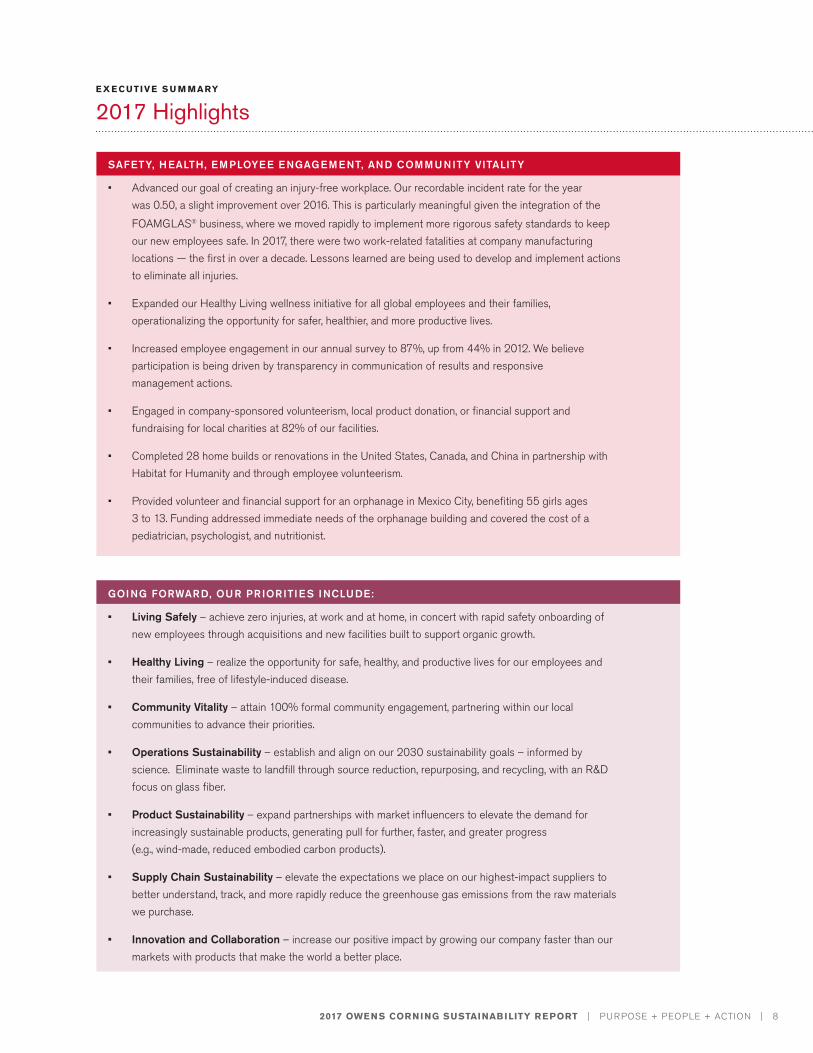
• Advanced our goal of creating an injury-free workplace. Our recordable incident rate for the year was 0.50, a slight improvement over 2016. This is particularly meaningful given the integration of the
FOAMGLAS® business, where we moved rapidly to implement more rigorous safety standards to keep our new employees safe. In 2017, there were two work-related fatalities at company manufacturing locations — the first in over a decade. Lessons learned are being used to develop and implement actions to eliminate all injuries.
• Expanded our Healthy Living wellness initiative for all global employees and their families, operationalizing the opportunity for safer, healthier, and more productive lives.
• Increased employee engagement in our annual survey to 87%, up from 44% in 2012. We believe participation is being driven by transparency in communication of results and responsive management actions.
• Engaged in company-sponsored volunteerism, local product donation, or financial support and fundraising for local charities at 82% of our facilities.
• Completed 28 home builds or renovations in the United States, Canada, and China in partnership with Habitat for Humanity and through employee volunteerism.
• Provided volunteer and financial support for an orphanage in Mexico City, benefiting 55 girls ages 3 to 13. Funding addressed immediate needs of the orphanage building and covered the cost of a pediatrician, psychologist, and nutritionist.
GOING FORWARD, OUR PRIORITIES INCLUDE:
• Living Safely – achieve zero injuries, at work and at home, in concert with rapid safety onboarding of new employees through acquisitions and new facilities built to support organic growth.
• Healthy Living – realize the opportunity for safe, healthy, and productive lives for our employees and their families, free of lifestyle-induced disease.
• Community Vitality – attain 100% formal community engagement, partnering within our local communities to advance their priorities.
• Operations Sustainability – establish and align on our 2030 sustainability goals – informed by science. Eliminate waste to landfill through source reduction, repurposing, and recycling, with an R&D focus on glass fiber.
• Product Sustainability – expand partnerships with market influencers to elevate the demand for increasingly sustainable products, generating pull for further, faster, and greater progress (e.g., wind-made, reduced embodied carbon products).
• Supply Chain Sustainability – elevate the expectations we place on our highest-impact suppliers to better understand, track, and more rapidly reduce the greenhouse gas emissions from the raw materials we purchase.
• Innovation and Collaboration – increase our positive impact by growing our company faster than our markets with products that make the world a better place.
2017 OWENS CORNING SUSTAINABILITY REPORT | PURPOSE + PEOPLE + ACTION | 9
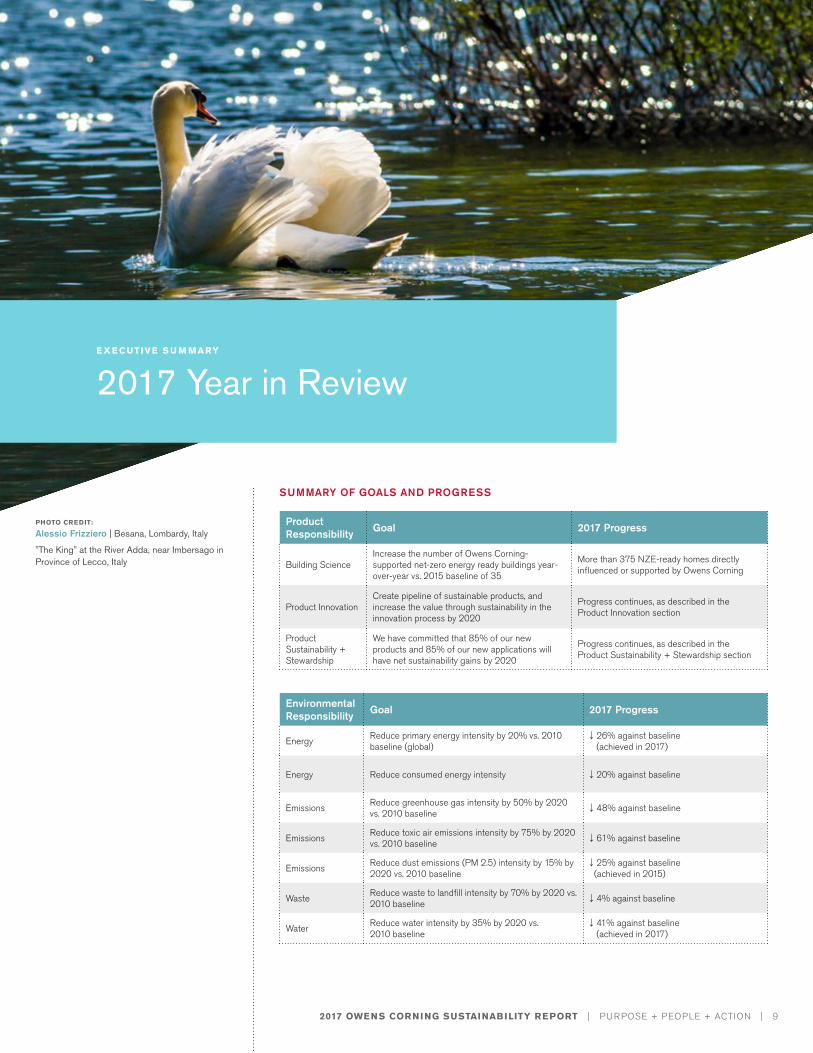
SUMMARY OF GOALS AND PROGRESS
PHOTO CREDIT:
Alessio Frizziero | Besana, Lombardy, Italy
"The King" at the River Adda, near Imbersago in Province of Lecco, Italy
E X E CUTIVE S U M MARY
2017 Year in Review
Product Responsibility Goal 2017 Progress
Building ScienceIncrease the number of Owens Corning-supported net-zero energy ready buildings year-over-year vs. 2015 baseline of 35
More than 375 NZE-ready homes directly influenced or supported by Owens Corning
Product InnovationCreate pipeline of sustainable products, and increase the value through sustainability in the innovation process by 2020
Progress continues, as described in the Product Innovation section
Product Sustainability + Stewardship
We have committed that 85% of our new products and 85% of our new applications will have net sustainability gains by 2020
Progress continues, as described in the Product Sustainability + Stewardship section
Environmental Responsibility Goal 2017 Progress
Energy Reduce primary energy intensity by 20% vs. 2010 baseline (global)
↓ 26% against baseline (achieved in 2017)
Energy Reduce consumed energy intensity ↓ 20% against baseline
Emissions Reduce greenhouse gas intensity by 50% by 2020 vs. 2010 baseline
↓ 48% against baseline
Emissions Reduce toxic air emissions intensity by 75% by 2020 vs. 2010 baseline
↓ 61% against baseline
Emissions Reduce dust emissions (PM 2.5) intensity by 15% by 2020 vs. 2010 baseline
↓ 25% against baseline (achieved in 2015)
Waste Reduce waste to landfill intensity by 70% by 2020 vs. 2010 baseline
↓ 4% against baseline
Water Reduce water intensity by 35% by 2020 vs. 2010 baseline
↓ 41% against baseline (achieved in 2017)
2017 OWENS CORNING SUSTAINABILITY REPORT | PURPOSE + PEOPLE + ACTION | 10
E X E CUTIVE S U M MARY
2017 Year in Review
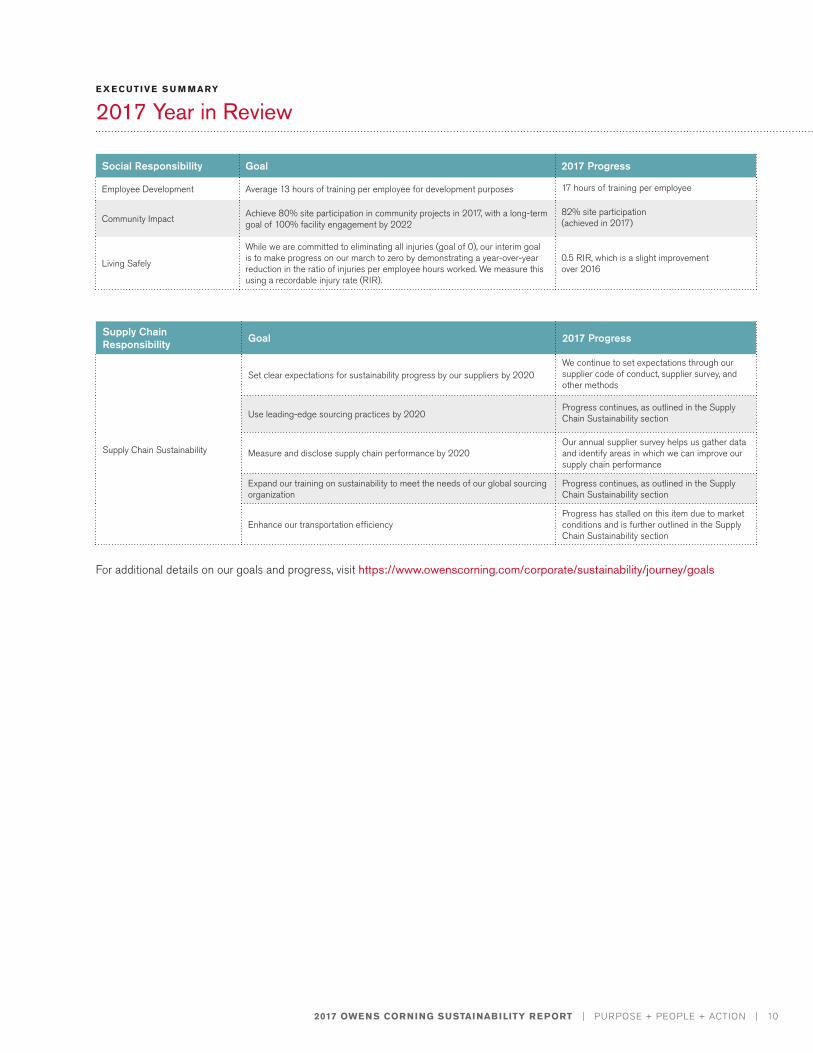
Social Responsibility Goal 2017 Progress
Employee Development Average 13 hours of training per employee for development purposes 17 hours of training per employee
Community Impact Achieve 80% site participation in community projects in 2017, with a long-term goal of 100% facility engagement by 2022
82% site participation (achieved in 2017)
Living Safely
While we are committed to eliminating all injuries (goal of 0), our interim goal is to make progress on our march to zero by demonstrating a year-over-year reduction in the ratio of injuries per employee hours worked. We measure this using a recordable injury rate (RIR).
0.5 RIR, which is a slight improvement over 2016
Supply Chain Responsibility Goal 2017 Progress
Supply Chain Sustainability
Set clear expectations for sustainability progress by our suppliers by 2020We continue to set expectations through our supplier code of conduct, supplier survey, andother methods
Use leading-edge sourcing practices by 2020Progress continues, as outlined in the Supply Chain Sustainability section
Measure and disclose supply chain performance by 2020Our annual supplier survey helps us gather data and identify areas in which we can improve our supply chain performance
Expand our training on sustainability to meet the needs of our global sourcing organization
Progress continues, as outlined in the Supply Chain Sustainability section
Enhance our transportation efficiencyProgress has stalled on this item due to market conditions and is further outlined in the Supply Chain Sustainability section
For additional details on our goals and progress, visit https://www.owenscorning.com/corporate/sustainability/journey/goals

S USTAI NAB I LITY I N ACTION
2017 OWENS CORNING SUSTAINABILITY REPORT | PURPOSE + PEOPLE + ACTION | 11
E X E CUTIVE S U M MARY
2017 Year in Review
At Owens Corning, we are on a “march to zero” – zero accidents, zero defects, zero losses. This is what we call perfect production, and it is our goal for all our global manufacturing plants.
To meet this ambitious goal, we have adopted a systematic management approach called Total Productive Maintenance (TPM). We committed to TPM in 2016, and in 2017, made huge strides in launching and implementing TPM throughout our operations.
What is TPM?TPM is a comprehensive management system that emphasizes proactive and preventive activities to maintain, operate, and improve production, and creates a culture of safety and zero loss. TPM includes eight pillars:
• Planned maintenance
• Early management
• Quality maintenance
• Office and administration
• Environment, health, and safety
• Focused improvement
• Autonomous maintenance
• Training and development
The TPM JourneyThe majority of our plants, across all three businesses, declared their commitment to TPM. The Composites business, which began its journey in 2011, has 100% of plants committed to TPM. Insulation is just getting started, with close to 20% of plants committed to TPM in 2017. In the Roofing business, 100% of our roofing
and asphalt shingle plants are active with TPM, and we anticipate all of our components plants will be active by the end of 2018.
Every plant is at a different point on the journey, but each is moving with purpose and sharing TPM lessons across the network.
The plants approach TPM strategically, beginning with a TPM preparation plan that focuses on daily management, which is the foundation of the TPM pillars. The preparation plan also includes an analysis of baseline key performance indicators for safety, quality, delivery, cost, production, and morale, plus key management indicators to help drive accountability and results. An employee survey shows plant leaders the level of employee readiness for TPM and identifies gaps in knowledge and skills. With all this information and best practice examples, plants develop training workshops and team-building programs to engage their teams and build capacity.
At the end of 2017, three Composites plants had earned TPM Excellence awards from the Japan Institute of Plant Maintenance (JIPM) – Tlaxcala, Mexico (the first awardee); Taloja, India; and Yuhang, China. Each plant needed to show full commitment to TPM for three full years before applying for the award, and the assessment process lasted an additional year.
Our Approach for Managing Global Manufacturing Plants
“TPM is about transforming people, processes, and results.”
- Monique Buch, glass reinforcement solutions operations leader in Europe
2017 OWENS CORNING SUSTAINABILITY REPORT | PURPOSE + PEOPLE + ACTION | 12
E X E CUTIVE S U M MARY
2017 Year in Review
S USTAI NAB I LITY I N ACTION — CONT’D
The TPM momentum is growing. Tlaxcala is now working toward the next-level award known as TPM Consistency. We expect to see further commitment to TPM in our remaining plants as we aim to have 100% integration in 2018.
TPM’s BenefitsTPM is teaching us how to make our plants stronger. TPM is much more than a new way to keep machines running smoothly. It’s people development. It’s rethinking every aspect of work, even those where traditional metrics indicate strong performance. It’s a total team effort, which we believe creates added value for everyone, including our customers.
Our Approach for Managing Global Manufacturing Plants
“The impact of TPM is astonishing.” --Eric Ramirez, quality and TPM leader in Tlaxcala, Mexico
2017 OWENS CORNING SUSTAINABILITY REPORT | PURPOSE + PEOPLE + ACTION | 13
PHOTO CREDIT:
Brenda Salas | Monterrey, Mexico
Exquisite Caribbean sunset
OVERVIEW
O wens Corning is a global leader in engineered materials for insulation, roofing, and composites. Our market-leading businesses deliver a broad spectrum of innovative and high-quality products and services. Our products range from glass fiber
used to reinforce composite materials for transportation, building and construction, marine, infrastructure, wind-energy, and other high-performance markets, to insulation and roofing for residential, commercial, and industrial applications.
Global in scope and human in scale, we use our deep expertise in materials, manufacturing, and building science to develop products and systems that save energy and improve comfort in commercial and residential buildings. Through our glass reinforcements business, the company makes thousands of products lighter, stronger, and more durable. Ultimately, Owens Corning people and products make the world a better place.
Owens Corning was founded in 1938 in Toledo, Ohio, and we are still based there today. The company has been on the Fortune® 500 list for 63 consecutive years.
Owens Corning is a publicly traded company on the New York Stock Exchange. As of December 31, 2017, beneficial ownership includes: The Vanguard Group, 9.3%; BlackRock Fund Advisors, 5.0%; and Barrow, Hanley, Mewhinney & Strauss, LLC, 3.5%.
E X E CUTIVE S U M MARY
Company Profile
2017 OWENS CORNING SUSTAINABILITY REPORT | PURPOSE + PEOPLE + ACTION | 14
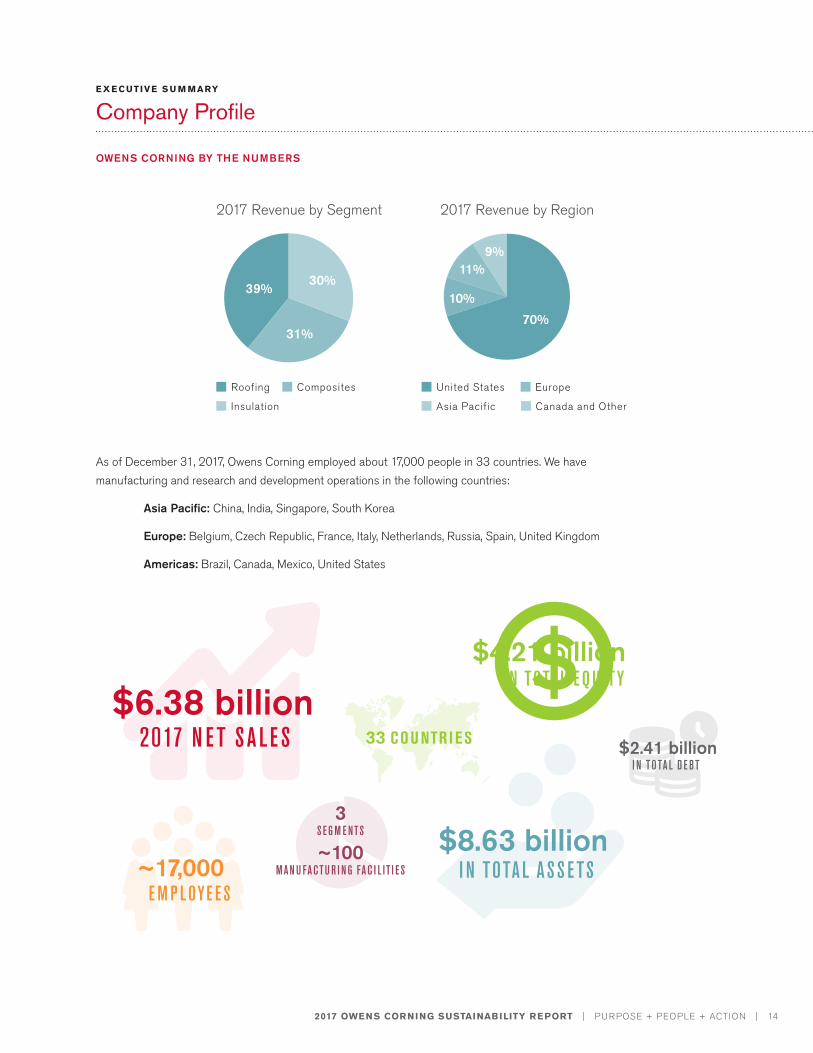
OWENS CORNING BY THE NUMBERS
As of December 31, 2017, Owens Corning employed about 17,000 people in 33 countries. We have manufacturing and research and development operations in the following countries:
Asia Pacific: China, India, Singapore, South Korea
Europe: Belgium, Czech Republic, France, Italy, Netherlands, Russia, Spain, United Kingdom
Americas: Brazil, Canada, Mexico, United States
E X E CUTIVE S U M MARY
Company Profile
$6.38 billion 2017 N E T S A L E S
$8.63 billion I N TOTA L A S S E TS~17,000
E M P L OYE E S
33 C O U NTR I E S
3S E G M E NTS
~100M A N U FA CTU R I N G FA C I L IT I E S
$2.41 billion I N TOTA L D E BT
$4.21 billion I N TOTA L E Q U IT Y
39%10%
11%9%
30%
70%31%
2017 Revenue by Segment 2017 Revenue by Region
Roofing United StatesComposites Europe
Insulation Asia Pacific Canada and Other
2017 OWENS CORNING SUSTAINABILITY REPORT | PURPOSE + PEOPLE + ACTION | 15
THE OWENS CORNING STORY
Our Mission: We aspire to build market-leading businesses; global in scope – human in scale.
Our Purpose: Our people and products make the world a better place.
Our Company Values:
Living Safely
Winning with Customers
Leading in Quality
Expanding Our Impact through Sustainability
Turning Knowledge into Value
Striving to Be Better, Every Day
OUR BUSINESSES
The company has three reporting segments: Composites, Insulation, and Roofing:
Composites
Owens Corning® glass fiber materials can be found in more than 40,000 end-use applications within four primary markets: building and construction, wind energy, thermoplastics (automotive), and infrastructure. Such end-use applications include pipe, roofing shingles, sporting goods, telecommunications cables, boats, aircraft, gypsum wall board, flooring, automotive, industrial containers, and wind blades. Our products are manufactured and sold worldwide, primarily to parts molders and fabricators. Within the building and construction market, our Composites segment sells glass fiber and/or glass mat directly to a small number of major shingle manufacturers, including our own roofing business.
Our Composites segment includes vertically integrated downstream activities. The company manufactures, fabricates, and sells glass reinforcements in the form of fiber. Glass reinforcement materials are also used downstream by the Composites segment to manufacture and sell glass fiber products in the form of fabrics, non-wovens, and other specialized products.
Demand for composites is driven by general global economic activity and, more specifically, by the increasing replacement of traditional materials such as aluminum, wood, and steel with composites that offer lighter weight, improved strength and durability, freedom of design, and corrosion resistance.
We compete with composite manufacturers worldwide. According to various industry reports and company estimates, our Composites segment is a world leader in the production of glass fiber reinforcement materials. Primary methods of competition include innovation, quality, customer service, and global geographic reach. For our commodity products, price is also a method of competition. Significant competitors to the Composites segment include China Jushi Group Co., Ltd., Chongqing Polycom International Corporation Ltd (“CPIC”), Johns Manville, Nippon Electric Glass Co. Ltd. (“NEG”), and Taishan Glass Fiber Co., Ltd.
E X E CUTIVE S U M MARY
Company Profile
2017 OWENS CORNING SUSTAINABILITY REPORT | PURPOSE + PEOPLE + ACTION | 16
Typically, our composites plants run continuously throughout the year, and we warehouse much of our production prior to sale, since we operate primarily with short delivery cycles.
Insulation
Our insulating solutions help builders, architects, and installers design homes and buildings to perform for their intended service life. Specifically, our insulating products help customers conserve energy, provide improved acoustical performance, and offer convenience of installation and use. Our products in the residential channel include thermal and acoustical batts, loosefill insulation, foam sheathing, and accessories, and are sold under well-recognized brand names and trademarks such as Owens Corning PINK® FIBERGLAS™ insulation. Our products in the commercial and industrial channel include glass fiber pipe insulation, energy-efficient, flexible-duct media, bonded and granulated mineral wool insulation, cellular glass insulation, and XPS rigid foam insulation used in above- and below-grade construction applications, and are sold under well-recognized brand names and trademarks such as Thermafiber® and FOAMGLAS®. We sell our insulation products primarily to insulation installers, home centers, lumberyards, retailers, and distributors in the United States, Canada, Europe, and Asia Pacific.
Demand for Owens Corning’s insulating products is driven by new residential construction, remodeling and repair activity, commercial and industrial construction activity, increasingly stringent building codes, and the growing need for energy efficiency. Demand in the residential channel typically follows seasonal home improvement, remodeling and renovation, and new construction industry patterns. Demand for new residential construction typically follows housing starts on a three-month lagged basis, although the new residential construction cycle can elongate due to labor availability and other factors beyond our control. The peak season for home construction and remodeling in our geographic markets generally corresponds with the second and third calendar quarters and, therefore, our sales levels are typically higher during the second half of the year. Demand for commercial and industrial applications is more heavily tied to industrial production growth in the global markets we serve.
Our Insulation segment competes primarily with manufacturers in the United States and, to a lesser extent, in other geographic regions. According to various industry reports and company estimates, Owens Corning is North America’s largest producer of residential, commercial, and industrial insulation, and the second-largest producer of extruded polystyrene foam insulation. Principal methods of competition include innovation and product design, service, location, quality, price, and compatibility of systems solutions. Significant competitors in this segment include CertainTeed Corporation, Dow Chemical, Johns Manville, Knauf Insulation, and ROCKWOOL International.
Our Insulation segment includes a diverse portfolio of high, mid, and low-temperature products with a geographic mix of United States, Canada, Europe, Asia Pacific, and Latin America, a market mix of residential, commercial, industrial, and other markets, and a channel mix of retail, contractor, and distribution. In 2017, we acquired Pittsburgh Corning, the world’s leading producer of cellular glass insulation systems for commercial and industrial markets. This acquisition expanded the Owens Corning commercial and industrial product offering and grew the company’s presence in Europe and Asia.
Working capital practices for this segment historically have followed a seasonal cycle. Typically, our insulation plants run continuously throughout the year. This production plan, along with the seasonal nature of the segment, generally results in higher finished goods inventory balances in the first half of
E X E CUTIVE S U M MARY
Company Profile
2017 OWENS CORNING SUSTAINABILITY REPORT | PURPOSE + PEOPLE + ACTION | 17
the year. Since sales increase during the second half of the year, our accounts receivable balances are typically higher during this period.
Roofing
Our primary products in the Roofing segment are laminate and strip asphalt roofing shingles. Other products include oxidized asphalt, roofing components, and synthetic packaging materials. We have been able to meet the growing demand for longer-lasting, aesthetically attractive laminate products with modest capital investment.
We sell shingles and roofing components primarily through home centers, lumberyards, retailers, distributors, and contractors in the United States. Our synthetic packaging materials are used primarily in the construction industry for lumber and metal packaging. Oxidized asphalt is a significant input used in the production of our asphalt roofing shingles. We are vertically integrated and have manufacturing facilities that process asphalt for use in our roofing shingles manufacturing process. In addition, we sell processed asphalt to other shingle manufacturers, to roofing contractors for built-up roofing asphalt systems, and to manufacturers in a variety of other industries, including automotive, chemical, rubber, and construction. Asphalt input costs and third-party asphalt sales prices are correlated to crude oil prices. As a result, third-party asphalt sales are largely a cost-plus business.
Demand for products in our Roofing segment is generally driven by both residential repair and remodeling activity and by new residential construction. Roof damage from major storms can significantly increase demand in this segment. As a result, sales in this segment do not always follow seasonal home improvement, remodeling, and new construction industry patterns as closely as our Insulation segment.
Our Roofing segment competes primarily with manufacturers in the United States. According to various industry reports and company estimates, Owens Corning’s Roofing segment is the second- largest producer of asphalt roofing shingles in the United States. Principal methods of competition include innovation and product design, proximity to customers, quality, and price. Significant competitors in the Roofing segment include CertainTeed Corporation, GAF, and TAMKO.
Our manufacturing operations are generally continuous in nature, and we warehouse much of our production prior to sale, since we operate with relatively short delivery cycles. One of the raw materials important to this segment is sourced from a sole supplier. We have a long-term supply contract for this material, and have no reason to believe that any availability issues will exist. If this supply were to become unavailable, our production could be interrupted until such time as the supply again became available or the company reformulated its products. Additionally, the supply of asphalt, another significant raw material in this segment, has been constricted at times. Although this has not caused an interruption of our production in the past, prolonged asphalt shortages would restrict our ability to produce products in this segment.
OWENS CORNING HEADQUARTERS
One Owens Corning Parkway, Toledo, Ohio, 43659, USA
E X E CUTIVE S U M MARY
Company Profile
2017 OWENS CORNING SUSTAINABILITY REPORT | PURPOSE + PEOPLE + ACTION | 18
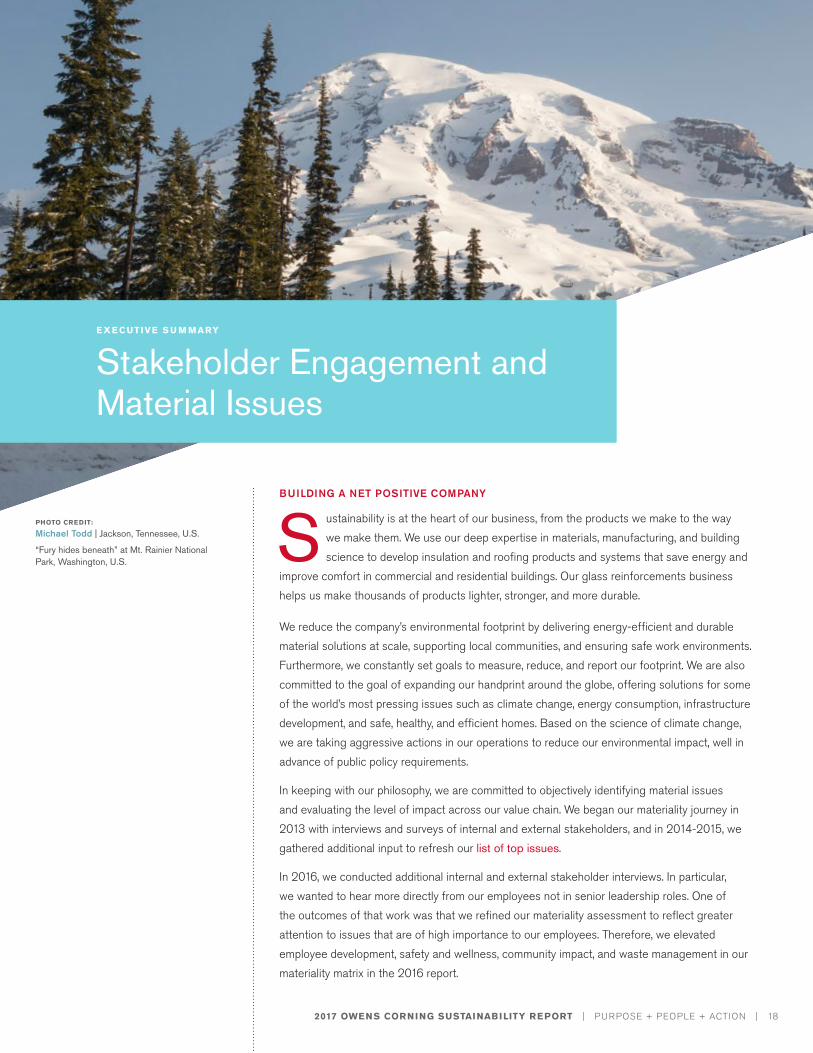
PHOTO CREDIT:
Michael Todd | Jackson, Tennessee, U.S.
“Fury hides beneath” at Mt. Rainier National Park, Washington, U.S.
E X E CUTIVE S U M MARY
Stakeholder Engagement and Material Issues
BUILDING A NET POSITIVE COMPANY
S ustainability is at the heart of our business, from the products we make to the way we make them. We use our deep expertise in materials, manufacturing, and building science to develop insulation and roofing products and systems that save energy and
improve comfort in commercial and residential buildings. Our glass reinforcements business helps us make thousands of products lighter, stronger, and more durable.
We reduce the company’s environmental footprint by delivering energy-efficient and durable material solutions at scale, supporting local communities, and ensuring safe work environments. Furthermore, we constantly set goals to measure, reduce, and report our footprint. We are also committed to the goal of expanding our handprint around the globe, offering solutions for some of the world’s most pressing issues such as climate change, energy consumption, infrastructure development, and safe, healthy, and efficient homes. Based on the science of climate change, we are taking aggressive actions in our operations to reduce our environmental impact, well in advance of public policy requirements.
In keeping with our philosophy, we are committed to objectively identifying material issues and evaluating the level of impact across our value chain. We began our materiality journey in 2013 with interviews and surveys of internal and external stakeholders, and in 2014-2015, we gathered additional input to refresh our list of top issues.
In 2016, we conducted additional internal and external stakeholder interviews. In particular, we wanted to hear more directly from our employees not in senior leadership roles. One of the outcomes of that work was that we refined our materiality assessment to reflect greater attention to issues that are of high importance to our employees. Therefore, we elevated employee development, safety and wellness, community impact, and waste management in our materiality matrix in the 2016 report.
2017 OWENS CORNING SUSTAINABILITY REPORT | PURPOSE + PEOPLE + ACTION | 19
In addition, we reclassified greenhouse gas and toxic air emissions as a priority area. Previously, due to differences in terminology, emissions had been identified as a priority, while climate change was not as prominent among our stakeholders. In our outreach, we found many stakeholders now see climate change and greenhouse gas and toxic air emissions as essentially the same, material issue.
Also as a result of this additional stakeholder input, we made a number of changes in the format and design of our sustainability report. These changes make it more employee- and all-reader-friendly, and continue to be reflected in the 2017 report.
2017 MATERIALITY UPDATES
In 2017, we continued to evolve and enhance our thinking and execution around material topics for our business. This evolution has been based on several inputs: standards and guidelines such as the Global Reporting Initiative Standards, Dow Jones Sustainability Index, CDP (formerly Carbon Disclosure Project), and United Nations Sustainable Development Goals; industry and workplace trends; the evolution of Owens Corning’s approach to these topics; and input from ongoing internal and external stakeholder engagement.
The first major change is that we revised the parameters of our materiality matrix to reflect the new GRI Standards. As you will see in our matrix on page 21, we have redefined the x-axis as “Significance of Owens Corning’s Impact and Influence” and the y-axis as “Significance of Impact on Stakeholders’ Decisions and Perceptions.” As a practical matter, that means all stakeholder views, including from our senior management, are now accounted for on the y-axis.
In addition, considering industry and workplace trends, and the realities of how we address the topics within Owens Corning, we have updated the wording and relative materiality of some of our topics. In all cases, we continued to use our original materiality data from 2014 and 2015 as the backbone for our materiality matrix, with all inputs since then enabling us to evolve our view of material topics. We believe materiality is both a science and an art that reflects the practical realities of how we run our business, what stakeholders want and need from us, and how they view our efforts.
Our 2017 materiality matrix includes the following notable changes:
• Employee Experience: We updated the wording to “Employee Experience” (from “Employee Development”) to encompass a broader range of activities, including talent attraction and retention, succession planning, engagement programs, compensation and benefits, diversity, inclusion, and gender equality, as well as training and development. Given the changes, we also elevated the relative importance of employee experience as a material topic.
• Customer Experience: We created the “Customer Experience” category to encompass all that we are doing to attract, retain, and engage customers. Given the broader scope, we have slightly elevated the relative importance of customer experience as a material topic, and “Customer Relationship Management” is now part of customer experience.
• Safety and Wellness: “Safety and Wellness” has been elevated on the y-axis to reflect the impact it
has on all stakeholders’ decisions and perceptions (particularly internal stakeholders).
E X E CUTIVE S U M MARY
Stakeholder Engagement and Material Issues
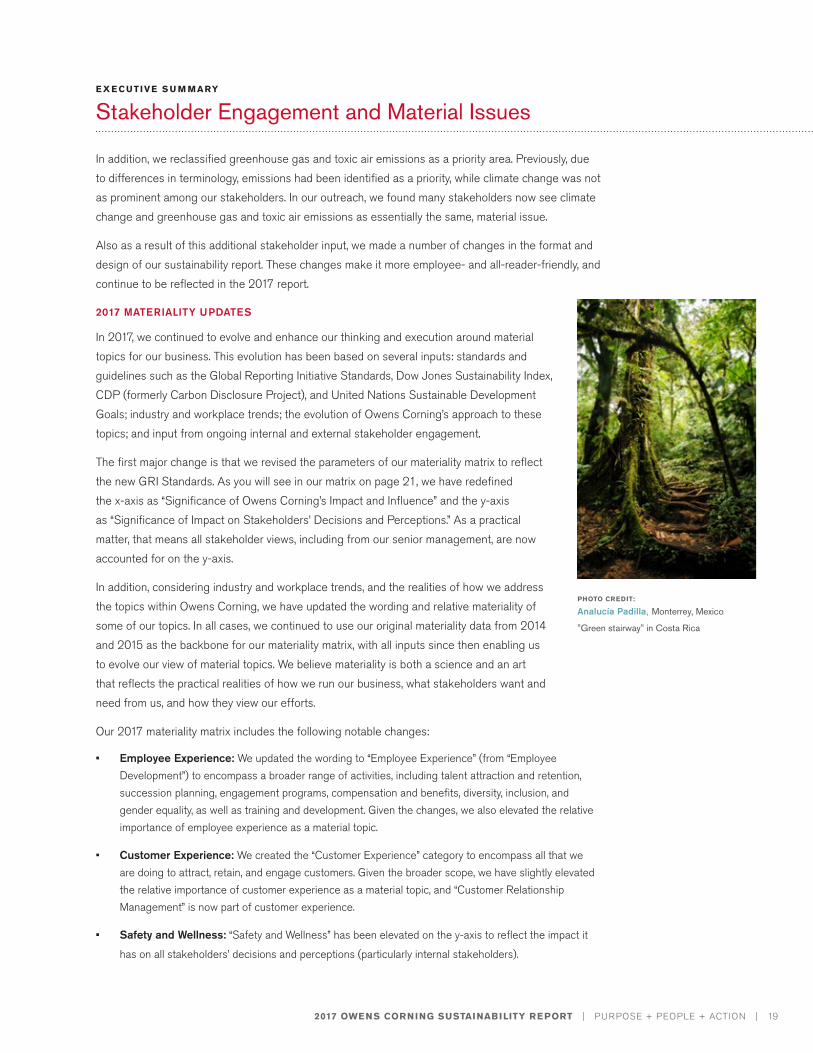
PHOTO CREDIT:
Analucía Padilla, Monterrey, Mexico
"Green stairway" in Costa Rica
2017 OWENS CORNING SUSTAINABILITY REPORT | PURPOSE + PEOPLE + ACTION | 20
E X E CUTIVE S U M MARY
Stakeholder Engagement and Material Issues
• Waste Management: “Waste Management” has been elevated on the x-axis to reflect the significant impact that Owens Corning, as a multinational company with a large product portfolio and packaging needs, can have on the environment. Owens Corning recognizes this impact and redoubled its efforts in 2017 to address the topic, which includes a goal to reduce our waste-to-landfill intensity by 70% between our 2010 baseline and 2020.
• Growth Strategy + Prosperity: “Growth Strategy + Prosperity” has been introduced into the materiality matrix as a focused reporting topic. As Owens Corning is pursuing an aggressive growth program that includes organic growth as well as acquisitions, the company is recognizing the impact those growth plans can have on its sustainability efforts and stakeholders’ expectations. We believe our growth strategy will drive prosperity and sustainability for our investors, employees, partners, customers, communities, and other stakeholders. “Economic Impact” is now a factor under “Growth Strategy + Prosperity.”
• Human Rights: We have added “Human Rights” to our materiality matrix to reflect our ongoing efforts to align with the United Nations Global Compact (UNGC), to which Owens Corning is a signatory, and the UN Sustainable Development Goals (SDGs). While one company’s ability to impact human rights is somewhat limited, we recognize the significant need, and we are committed to helping to lead on this
issue. For more information on our alignment with the UNGC and UN SDGs, see page 25.
In addition, “Disclosure of Risk,” which barely registered on our previous matrices, has been removed from the 2017 matrix. Disclosure and management of risk remain critical throughout our business and in how we address all our material topics; therefore, we do not believe it should be called out as a distinct material topic.
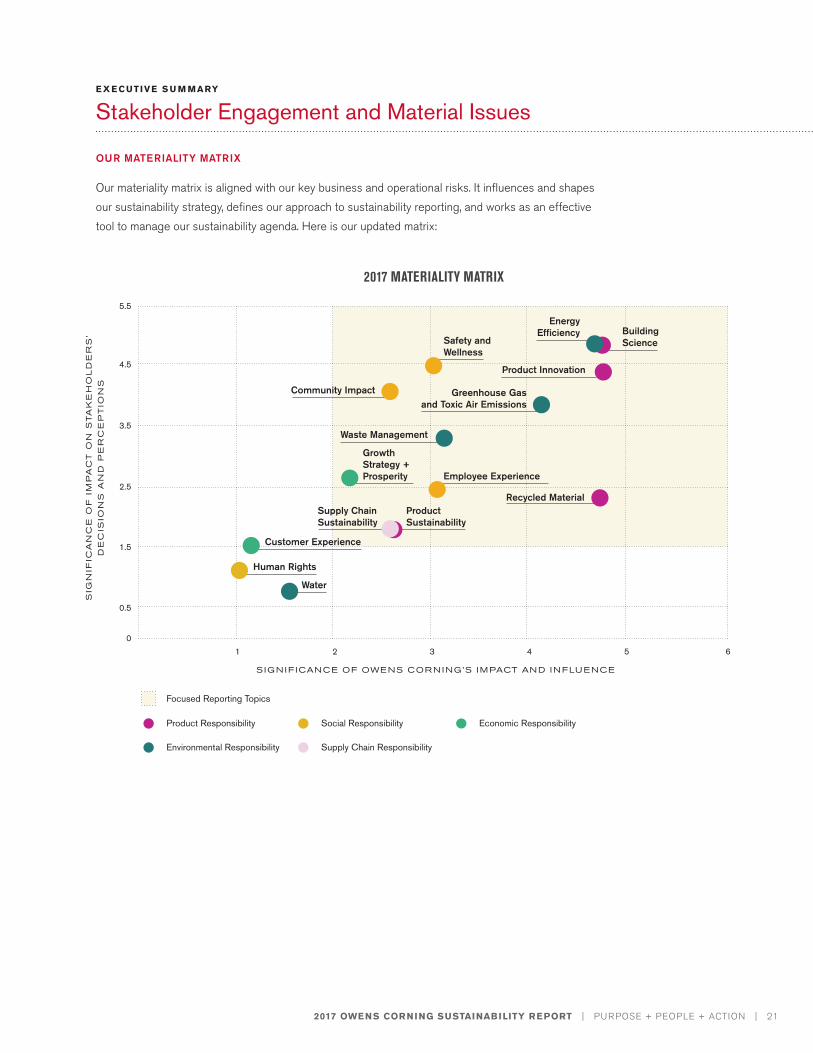
KEY MATERIAL TOPICS
Product Responsibility • Building Science
• Product Innovation
• Recycled Material
• Product Sustainability
Environmental Responsibility • Energy Efficiency
• Greenhouse Gas and Toxic Air Emissions
• Waste Management
• Water
Social Responsibility • Safety and Wellness
• Employee Experience
• Community Impact
• Human Rights
Supply Chain Responsibility • Supply Chain Sustainability
Economic Responsibility • Growth Strategy + Prosperity
• Customer Experience
2017 OWENS CORNING SUSTAINABILITY REPORT | PURPOSE + PEOPLE + ACTION | 21
E X E CUTIVE S U M MARY
Stakeholder Engagement and Material Issues
OUR MATERIALITY MATRIX
Our materiality matrix is aligned with our key business and operational risks. It influences and shapes our sustainability strategy, defines our approach to sustainability reporting, and works as an effective tool to manage our sustainability agenda. Here is our updated matrix:
10
1.5
0.5
4.5
2.5
3.5
5.5
2 3 4 5 6
Safety and Wellness
Employee Experience
Building Science
Product Innovation
Supply Chain Sustainability
Water
Focused Reporting Topics
Environmental Responsibility
Product Sustainability
Community Impact
Energy Efficiency
Greenhouse Gas and Toxic Air Emissions
Waste Management
Recycled Material
SIG N I F ICANCE OF OWE NS COR N I NG’S I M PACT AN D I N FLU E NCE
SIG
NIF
ICA
NC
E O
F I
MP
AC
T O
N S
TA
KE
HO
LD
ER
S’
D
EC
ISIO
NS
AN
D P
ER
CE
PT
ION
S
2017 MATERIALITY MATRIX
Product Responsibility
Supply Chain Responsibility
Growth Strategy + Prosperity
Economic Responsibility
Human Rights
Customer Experience
Social Responsibility
2017 OWENS CORNING SUSTAINABILITY REPORT | PURPOSE + PEOPLE + ACTION | 22
E X E CUTIVE S U M MARY
Stakeholder Engagement and Material Issues
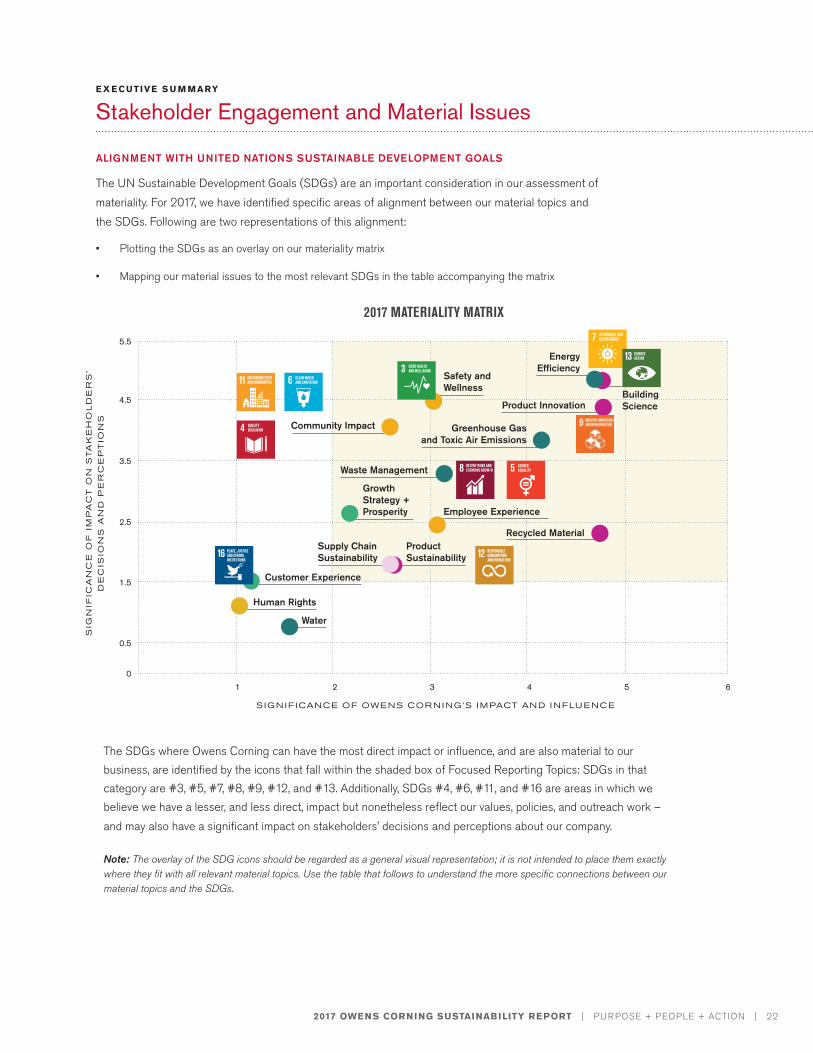
ALIGNMENT WITH UNITED NATIONS SUSTAINABLE DEVELOPMENT GOALS
The UN Sustainable Development Goals (SDGs) are an important consideration in our assessment of materiality. For 2017, we have identified specific areas of alignment between our material topics and the SDGs. Following are two representations of this alignment:
• Plotting the SDGs as an overlay on our materiality matrix
• Mapping our material issues to the most relevant SDGs in the table accompanying the matrix
Safety and Wellness
Employee Experience
Building ScienceProduct Innovation
Supply Chain Sustainability
Water
Product Sustainability
Community Impact
Energy Efficiency
Greenhouse Gas and Toxic Air Emissions
Waste Management
Recycled Material
Growth Strategy + Prosperity
Human Rights
Customer Experience
10
1.5
0.5
4.5
2.5
3.5
5.5
2 3 4 5 6
SIG N I F ICANCE OF OWE NS COR N I NG’S I M PACT AN D I N FLU E NCE
SIG
NIF
ICA
NC
E O
F I
MP
AC
T O
N S
TA
KE
HO
LD
ER
S’
D
EC
ISIO
NS
AN
D P
ER
CE
PT
ION
S
2017 MATERIALITY MATRIX
The SDGs where Owens Corning can have the most direct impact or influence, and are also material to our business, are identified by the icons that fall within the shaded box of Focused Reporting Topics: SDGs in that category are #3, #5, #7, #8, #9, #12, and #13. Additionally, SDGs #4, #6, #11, and #16 are areas in which we believe we have a lesser, and less direct, impact but nonetheless reflect our values, policies, and outreach work – and may also have a significant impact on stakeholders’ decisions and perceptions about our company.
Note: The overlay of the SDG icons should be regarded as a general visual representation; it is not intended to place them exactly where they fit with all relevant material topics. Use the table that follows to understand the more specific connections between our material topics and the SDGs.
2017 OWENS CORNING SUSTAINABILITY REPORT | PURPOSE + PEOPLE + ACTION | 23
E X E CUTIVE S U M MARY
Stakeholder Engagement and Material Issues
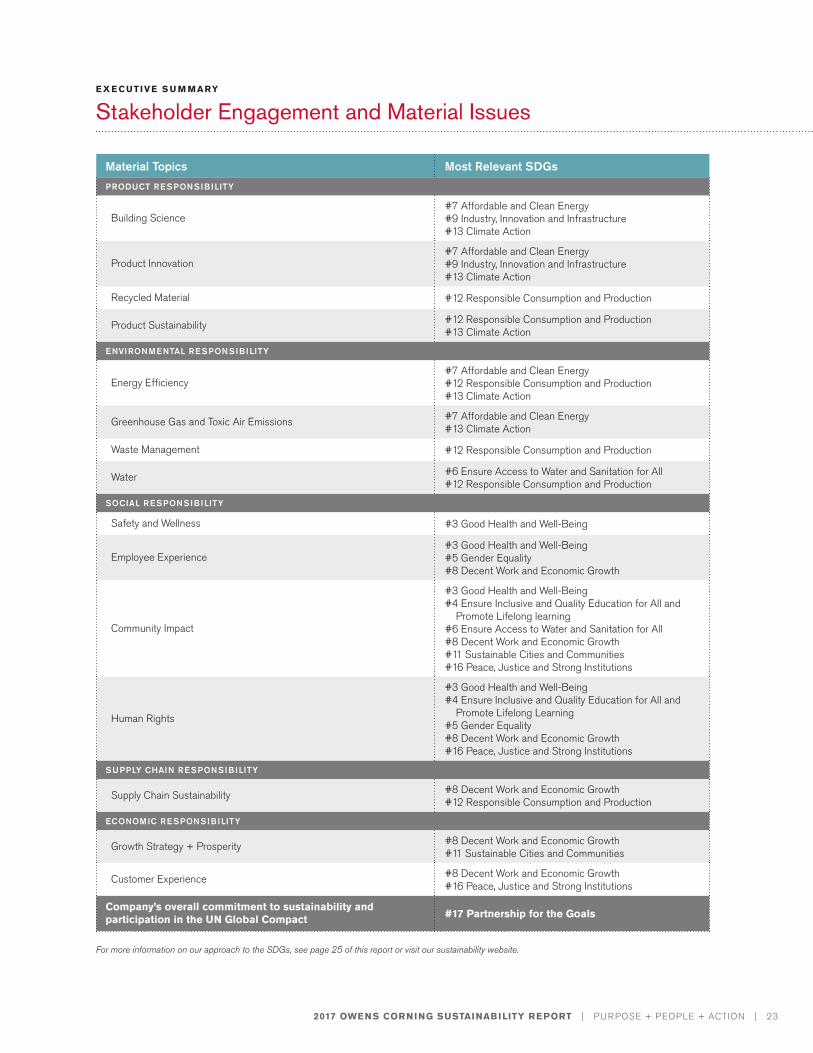
Material Topics Most Relevant SDGs
PRODUCT RESPONSIBILITY
Building Science#7 Affordable and Clean Energy#9 Industry, Innovation and Infrastructure#13 Climate Action
Product Innovation#7 Affordable and Clean Energy#9 Industry, Innovation and Infrastructure#13 Climate Action
Recycled Material #12 Responsible Consumption and Production
Product Sustainability #12 Responsible Consumption and Production #13 Climate Action
ENVIRONMENTAL RESPONSIBILITY
Energy Efficiency#7 Affordable and Clean Energy#12 Responsible Consumption and Production#13 Climate Action
Greenhouse Gas and Toxic Air Emissions #7 Affordable and Clean Energy#13 Climate Action
Waste Management #12 Responsible Consumption and Production
Water #6 Ensure Access to Water and Sanitation for All #12 Responsible Consumption and Production
SOCIAL RESPONSIBILITY
Safety and Wellness #3 Good Health and Well-Being
Employee Experience#3 Good Health and Well-Being#5 Gender Equality#8 Decent Work and Economic Growth
Community Impact
#3 Good Health and Well-Being#4 Ensure Inclusive and Quality Education for All and Promote Lifelong learning#6 Ensure Access to Water and Sanitation for All#8 Decent Work and Economic Growth#11 Sustainable Cities and Communities#16 Peace, Justice and Strong Institutions
Human Rights
#3 Good Health and Well-Being#4 Ensure Inclusive and Quality Education for All and Promote Lifelong Learning #5 Gender Equality#8 Decent Work and Economic Growth#16 Peace, Justice and Strong Institutions
SUPPLY CHAIN RESPONSIBILITY
Supply Chain Sustainability #8 Decent Work and Economic Growth#12 Responsible Consumption and Production
ECONOMIC RESPONSIBILITY
Growth Strategy + Prosperity #8 Decent Work and Economic Growth#11 Sustainable Cities and Communities
Customer Experience #8 Decent Work and Economic Growth#16 Peace, Justice and Strong Institutions
Company’s overall commitment to sustainability and participation in the UN Global Compact #17 Partnership for the Goals
For more information on our approach to the SDGs, see page 25 of this report or visit our sustainability website.
2017 OWENS CORNING SUSTAINABILITY REPORT | PURPOSE + PEOPLE + ACTION | 24
E X E CUTIVE S U M MARY
Stakeholder Engagement and Material Issues
STAKEHOLDER ENGAGEMENT
Owens Corning is committed to robust sustainability reporting that aligns with the needs and priorities of our business as well as our stakeholders. Because we know business needs, stakeholder interests, and industry and global trends are constantly evolving, we regularly review and update our material issues. Doing so helps us ensure we are reporting the most relevant information regarding the impact, positive or negative, of our business operations on the economy, environment, and society. Our materiality work not only impacts our reporting, but directly informs our sustainability strategy. We are committed to taking stakeholder needs and opinions into account when developing our sustainability goals and strategy.
Stakeholders such as customers, homeowners, architects, and specifiers are often interested and inquire about our products’ environmental and ingredient transparency, and their safety and health impacts. To that end, we have provided third-party certifications as a mechanism to help communicate this information. Among the third-party certifications of our products are: Environmental Product Declarations (EPD), Material Health Certifications (MHC), and Declare labels, mostly for our building materials. MHCs assess health impacts of the product and present the result in a color-coded, easy-to-understand format, while Declare labels act as easy-to-use nutrition labels for building materials. We also have third-party certification on low-emissions products and validation of ingredients, e.g., products that are formaldehyde-free. On a case-by-case basis, we provide more detailed information if the product is used in combination with other materials to create a new finished product. These inquiries can be handled through our 1-800-GET-PINK® call line or email at [email protected].
In 2017, we held a “Sustainability Summit” at our Toledo, Ohio, headquarters for employees to engage on key topics such as operations sustainability, product sustainability, fiber safety, supply chain sustainability, climate change, health and well-being, and community involvement. Our keynote speaker was Andrew Winston, co-author of "Green to Gold," who addressed both the challenges and opportunities related to climate change. The summit included breakout sessions that enabled several hundred employees to learn and brainstorm about sustainability with their colleagues and outside experts.
We also continue to engage with our local communities to demonstrate that we operate every day with a focus on reducing our environmental footprint and protecting the natural environment. We engage with our local communities to expand our handprint through the creation of good jobs and economic prosperity, community involvement, charitable giving, and disaster relief. We are proud that our facilities and our people are committed to active, positive engagement in their local communities wherever we do business – from our headquarters in Toledo to our plant in Tlaxcala, Mexico, and from our state-of-the-art composites manufacturing operations in Taloja, India, to our recently acquired facility in Klášterec, Czech Republic. All stakeholders can contact our community relations department directly through our website. Click here for a full list of company locations.
Additional methods for stakeholder communication are outlined in Governance and Ethics. We also welcome questions, comments, ideas, and suggestions through a contact form on our website: https://www.owenscorning.com/contact-us
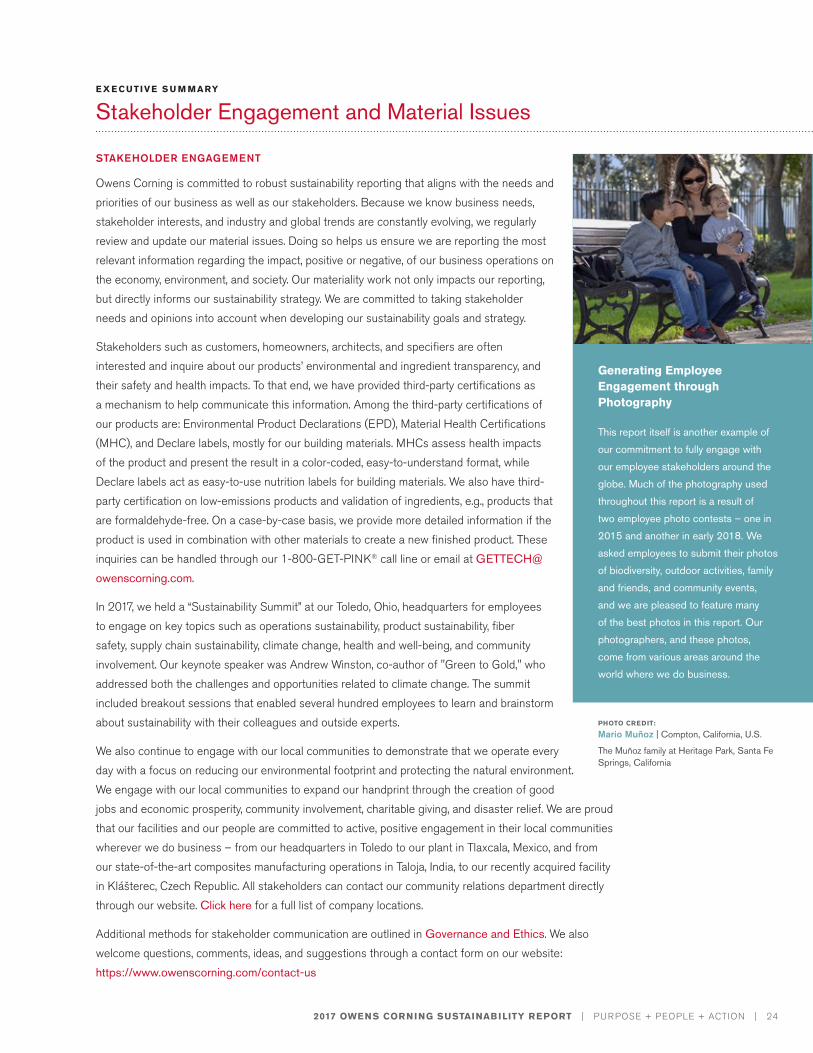
Generating Employee Engagement through Photography
This report itself is another example of
our commitment to fully engage with
our employee stakeholders around the
globe. Much of the photography used
throughout this report is a result of
two employee photo contests – one in
2015 and another in early 2018. We
asked employees to submit their photos
of biodiversity, outdoor activities, family
and friends, and community events,
and we are pleased to feature many
of the best photos in this report. Our
photographers, and these photos,
come from various areas around the
world where we do business.
PHOTO CREDIT:
Mario Muñoz | Compton, California, U.S.
The Muñoz family at Heritage Park, Santa Fe Springs, California
2017 OWENS CORNING SUSTAINABILITY REPORT | PURPOSE + PEOPLE + ACTION | 25
PHOTO CREDIT:
Jesse Bailey | Toledo, Ohio, U.S.
Blue jay in Jackson, Michigan, U.S.
E X E CUTIVE S U M MARY
Alignment with United Nations SDGs
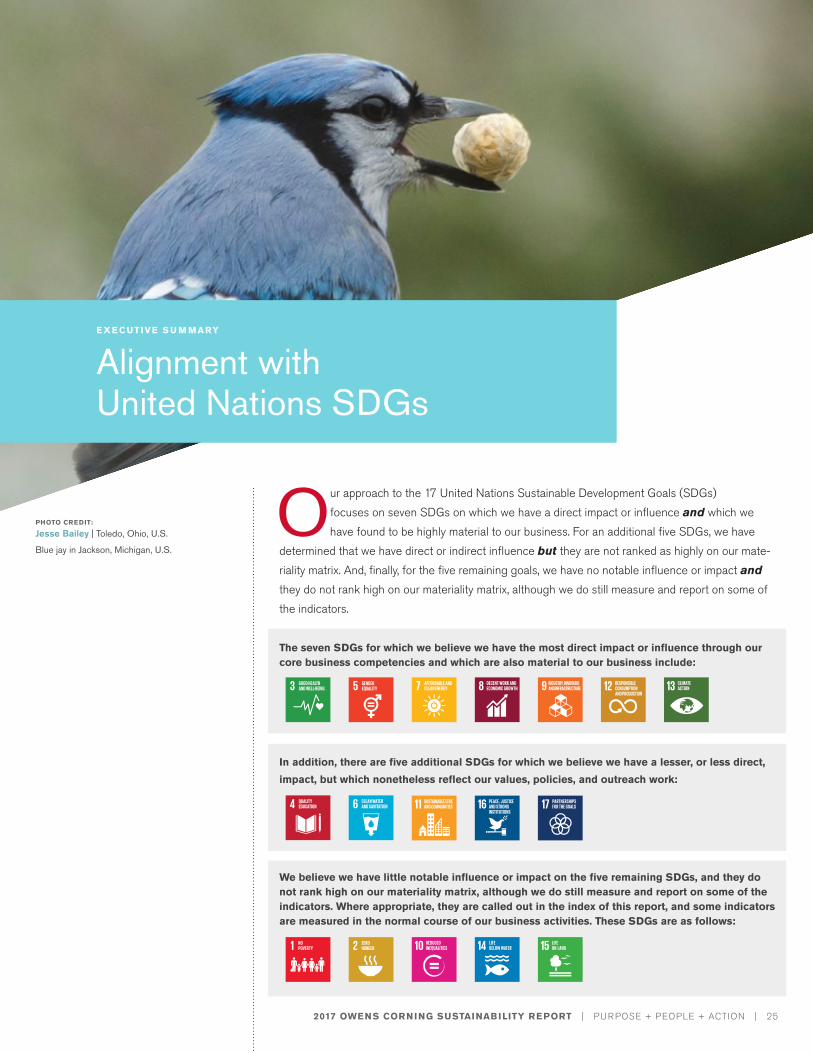
Our approach to the 17 United Nations Sustainable Development Goals (SDGs) focuses on seven SDGs on which we have a direct impact or influence and which we have found to be highly material to our business. For an additional five SDGs, we have
determined that we have direct or indirect influence but they are not ranked as highly on our mate-riality matrix. And, finally, for the five remaining goals, we have no notable influence or impact and they do not rank high on our materiality matrix, although we do still measure and report on some of the indicators.
The seven SDGs for which we believe we have the most direct impact or influence through our core business competencies and which are also material to our business include:
In addition, there are five additional SDGs for which we believe we have a lesser, or less direct,
impact, but which nonetheless reflect our values, policies, and outreach work:
We believe we have little notable influence or impact on the five remaining SDGs, and they do not rank high on our materiality matrix, although we do still measure and report on some of the indicators. Where appropriate, they are called out in the index of this report, and some indicators are measured in the normal course of our business activities. These SDGs are as follows:
2017 OWENS CORNING SUSTAINABILITY REPORT | PURPOSE + PEOPLE + ACTION | 26
E X E CUTIVE S U M MARY
Alignment with United Nations SDGs
7 SDGs where we believe we have the most direct impact or influence and are also material to our business
#3 GOOD HEALTH AND WELL-BEING
With our commitment to safety (zero injuries) and goal to eliminate lifestyle-induced disease and promote mental health and well-being, through our Healthy Living platform, we are setting goals for many of the indicators for this Development Goal. Specific programs address substance abuse, tobacco use, and safe driving. Industrial health and hygiene, as well as footprint reduction in air contaminants, are also key areas of focus. Moreover, accessibility of health services, including mental health and work/life balance resources, is part of our platform.
SDG Target 3.4 | By 2030, reduce by one-third pre-mature mortality from non-communicable diseases (NCDs) through prevention and treatment, and promote mental health and well-being
Our Healthy Living platform promotes preventive care, healthy minds, physical activity, nutrition, a tobacco-free life, and financial wellness. In 2017, we signed a new corporate wellness partner, Virgin Pulse, to help extend the reach of our wellness resources to the thousands of our employees who work in plants and in the field. By enrolling with Virgin Pulse, employees can track activity and other wellness metrics easily using mobile devices and apps. Daily messages and measurements help nudge employees toward healthy behavior changes, which we expect will facilitate culture change across facilities and our company as a whole. The program also includes monetary awards and healthy competitions among teams and individuals. Additionally in 2017, we implemented a significant workplace pilot project to study worker fatigue.
SDG Target 3.5 | Strengthen prevention and treatment of substance abuse, including narcotic drug abuse and harmful use of alcohol
We not only provide an employee assistance program (EAP) to all global employees, but also employ onsite nurses and educate supervisors on how to do interventions. In 2017, in response to the opioid crisis in the U.S., we made significant changes in our workplace narcotics procedures to address workers who might come to work under the influence, as well as new procedures to limit the length of prescriptions for non-chronic use, based on the Centers for Disease Control and Prevention estimate of risk for addiction.
SDG Target 3.6 | By 2020, halve global deaths and injuries from road traffic accidents
We have implemented a policy banning cell phone use to conduct company business when driving, and when driving on company property, and seek to educate employees on the danger of distracted driving in all situations. We are on the board of the National Safety Council, which is addressing this issue nationwide in the U.S.
SDG Target 3.8 | Achieve universal health care coverage (UHC), including financial risk protection, access to quality essential health care services, and access to safe, effective, quality, and affordable essential medicines and vaccines for all
We provide benefits for all U.S. employees and work to ensure that employees in other countries have access to care through benefits programs specific to their country. We made EAP services, including work/life resource services, global in 2016 and embarked on onsite health care facilities for major locations in 2017.
2017 OWENS CORNING SUSTAINABILITY REPORT | PURPOSE + PEOPLE + ACTION | 27
E X E CUTIVE S U M MARY
Alignment with United Nations SDGs
SDG Target 3.9 | By 2030 substantially reduce the number of deaths and illnesses from hazardous chemicals and air, water, and soil pollution and contamination
Our goal is zero workplace injuries and we employ hazard recognition and control programs, with more than 800 employees certified as hazard recognition and control specialists worldwide. Owens Corning has a rigorous product stewardship process that ensures that all products (new and existing) are safe for employees to make, are safe for consumers, perform as intended, and can be disposed of responsibly. Finally, we have beyond-compliance goals to reduce our emissions footprint worldwide.
SDG Target 3.A | Strengthen implementation of the Framework Convention on Tobacco Control in all countries as appropriate
We provide cessation programs and support to all employees and their families. Our U.S. facilities became 100% tobacco-free by the start of 2018, and all international facilities have pledged to be tobacco-free by the start of 2019.
#5 GENDER EQUALITY
Owens Corning is committed to being a company where opportunity for professional growth and success is determined by each employee’s performance, regardless of personal attributes or other individual differences. For that to be a reality, all employees must be free to bring their complete selves to work, knowing that they will have an equal opportunity to reach their full potential with our company. Gender diversity is measured, and programs for ensuring equity and increasing the participation of women in our business are part of our diversity efforts.
SDG Target 5.1 | End all forms of discrimination against all women and girls everywhere
Owens Corning has a global equal opportunity policy, specifically addressing gender and gender expression, and addresses recruitment, retention, and development of women. We use a variety of approaches, including targeted recruiting, internal professional networking for women, outreach to external networks, employee referral campaigns, early career development programs, and workshops to address issues such as unconscious bias. We believe that one of the most important characteristics of a truly diverse and inclusive culture is that women and men receive equal remuneration for work of equal value. At Owens Corning, employee compensation is performance-driven, market-competitive, and fair.
SDG Target 5.2 | Eliminate all forms of violence against all women and girls in the public and private spheres, including trafficking and sexual and other types of exploitation
Owens Corning has a specific policy against harassment, including sexual harassment, as well as annual training and a confidential complaint procedure. We also address the prevention of human trafficking through our Human Rights Policy and Supplier Code of Conduct, the latter of which is enforced through annual assessments.
2017 OWENS CORNING SUSTAINABILITY REPORT | PURPOSE + PEOPLE + ACTION | 28
E X E CUTIVE S U M MARY
Alignment with United Nations SDGs
SDG Target 5.5 | Ensure women’s full and effective participation and equal opportunities for leadership at all levels of decision making in political, economic and public life
Education, development, and resources for work/life balance help women progress in Owens Corning. Development programs are tracked through the talent review process. Our Women’s Information Network (WIN) is a group of highly engaged, dedicated, and compassionate professional women who are committed to attracting, retaining, and developing outstanding women at Owens Corning.
5.5.2 Proportion of women in managerial positions
Women hold 22% of management positions in Owens Corning, and currently there are three women serving as directors on our board, at 30%.
#7 AFFORDABLE AND CLEAN ENERGY
We constantly strive to decrease our dependence on fossil fuels by leveraging alternative and renewable sources. We are also focused on nurturing a portfolio of projects to reduce energy costs and usage, backed by our renewable energy sourcing. By 2020, we aim to reduce our primary energy intensity (energy used per unit of product produced) by 20%. We report annually on our progress against our energy consumption goals. For the second year in a row, Owens Corning attained the A list on the CDP Climate 2017 report.
SDG Target 7.2 | Increase substantially the share of renewable energy in the global energy mix by 2030
SDG Target 7.A | Enhance international cooperation to facilitate access to clean energy research and technology, including renewable energy, energy efficiency and advanced and cleaner fossil-fuel technology, and promote investment in energy infrastructure and clean energy technology
Owens Corning has invested in several clean-energy projects, the most notable being power purchase agreements for the creation of two wind farms for a total installed capacity of 250 megawatts of wind energy. Energy efficiency is a main benefit of our products and our expertise in building and materials science for improved efficiency of buildings, transportation, and the production of renewable energy. We promote renewable energy, and reduction of embodied energy and carbon, in our products — while helping others learn how they can do the same. We have also worked with SCS Global Services to develop a product verification guideline to encourage other companies to follow in our footsteps.
We currently have three types of commercial and residential insulation independently certified as made with renewable energy: EcoTouch® insulation (35% embodied carbon reduction); Thermafiber® RainBarrier® continuous insulation (20% embodied carbon reduction); and unbonded loosefill insulation (55% embodied carbon reduction). In addition, through our Composites business, we provide innovations to the wind-energy market for making wind turbines more productive.
SDG Target 7.3 | Double of the global rate of improvement in energy efficiency by 2030
We have a track record of improvement in energy efficiency in our facilities; we work with builders and architects to construct energy-efficient buildings based on building science; and we provide lightweight components to the automotive industry to improve fuel efficiency. Owens Corning continues to participate in the development of energy-efficient showcase homes and net-zero energy communities to demonstrate products and technologies that have the potential to fundamentally transform current energy efficiency models.
2017 OWENS CORNING SUSTAINABILITY REPORT | PURPOSE + PEOPLE + ACTION | 29
E X E CUTIVE S U M MARY
Alignment with United Nations SDGs
#8 DECENT WORK AND ECONOMIC GROWTH
Our strategy – to build market-leading businesses that are global in scope, human in scale – guides our approach to supporting this goal as we make progress on our five pillars of a sustainable enterprise:
• High-performance people
• Customer-inspired innovation
• Operational excellence
• World-class sustainability
• Financial strength
Our vision for a sustainable enterprise includes attention to environmental and social progress, human rights, and an employee experience that leads employees to want to recommend the company to a friend. It is also worth noting that as our company is now well-positioned to pursue its growth agenda, we have added Growth Strategy + Prosperity to our materiality matrix for 2017, and, beginning on page 171, we have devoted a section of this report to this topic.
SDG Target 8.1 | Sustain per capita economic growth in accordance with national circumstances, and in particular at least 7% per annum GDP growth in the least-developed countries
We are committed to balancing economic growth with social progress and environmental stewardship by delivering sustainable solutions to customers around the world. With our positive revenue results and growth strategy, we are confident our operations are having positive impact on the economies in the 33 countries where we operate.
SDG Target 8.4 | Improve progressively, through 2030, global resource efficiency in consumption and production and endeavor to decouple economic growth from environmental degradation, in accordance with the 10-year framework of programs on sustainable consumption and production, with developed countries taking the lead
We have comprehensive goals and programs for material, water, and energy conservation. We have either met our 2020 goals, or, in other cases, continue to make progress toward reaching them, and we expect to establish new goals, most likely for 2030, by the time we are reporting final results against our 2020 goals.
SDG Target 8.5 | By 2030, achieve full and productive employment and decent work for all women and men, including for young people and persons with disabilities, and equal pay for work of equal value
Diversity is a core value and we have many programs in place to achieve a representative workforce and inclusive workplace. We continue to experience progress in raising the number of women in leadership roles. At the management level (bands 2-6), as of the end of 2017, 22% are women. We are accomplishing this through a variety of approaches including: targeted recruiting, internal professional networking for women, outreach to external networks, employee referral campaigns, early career development programs, and workshops.
2017 OWENS CORNING SUSTAINABILITY REPORT | PURPOSE + PEOPLE + ACTION | 30
E X E CUTIVE S U M MARY
Alignment with United Nations SDGs
SDG Target 8.7 | Take immediate and effective measures to eradicate forced labor, end modern slavery and human trafficking and secure the prohibition and elimination of the worst forms of child labor, including recruitment and use of child soldiers, and by 2025 end child labor in all its forms
SDG Target 8.8 | Protect labor rights and promote safe and secure working environments for all workers, including migrant workers, in particular women migrants, and those in precarious employment
Owens Corning has been a signatory to the UN Global Compact since 2010 and our human rights policy can be found on our website. In this, our 2017 sustainability report, to further align our efforts with the UN SDGs, we have added human rights to our materiality matrix and have devoted a section of this report to our commitment to human rights, which begins on page 128.
#9 INDUSTRY, INNOVATION AND INFRASTRUCTURE
All three businesses in Owens Corning (Composites, Insulation, and Roofing) engage in research and innovation for products and services that bring performance and durability to infrastructure and the built environment. Examples include our geothermal solutions with XPS foam, and glass-fiber reinforced rebar solutions for more durable concrete structures (particularly in marine environments), which also reduce the carbon impact of such infrastructure. We have science and technology sites in nine locations around the world. We collaborate with NGOs and the public sector in local communities where we have facilities to bring needed infrastructure and help improve the standard of living – examples include our work with Habitat for Humanity and the installation of toilet enclosures in India.
SDG Target 9.1 | Develop quality, reliable, sustainable and resilient infrastructure, including regional and transborder infrastructure, to support economic development and human well-being, with a focus on affordable and equitable access for all
SDG Target 9.4 | By 2030, upgrade infrastructure and retrofit industries to make them sustainable, with increased resource-use efficiency and greater adoption of clean and environmentally sound technologies and industrial processes, with all countries taking action in accordance with their respective capabilities
Regarding both 9.1 and 9.4, we develop materials and systems that create resilient buildings and infrastructure. Our involvement in the joint research project called SEACON is focused on promoting best practices in the use of glass-fiber reinforced rebar made from alternative materials for concrete and reinforced concrete structures. This project has shown that we can use seawater to make cement and there will be no corrosion in marine environments. Our FOAMULAR® extruded polystyrene (XPS) foam insulation is being used to make roads more durable in areas such as Alaska where freeze/thaw damage can be signifcant.
SDG Target 9.5 Enhance scientific research, upgrade the technological capabilities of industrial sectors in all countries, in particular developing countries, including, by 2030, encouraging innovation and substantially increasing the number of research and development workers per 1 million people and public and private research and development spending
We have established nine science and technology centers in key markets worldwide, which together comprise one of the strongest technical teams in the industry. Our centers are located in the U.S., Mexico, Europe, and China. For more information on this topic, see the Product Innovation section on page 43.
2017 OWENS CORNING SUSTAINABILITY REPORT | PURPOSE + PEOPLE + ACTION | 31
E X E CUTIVE S U M MARY
Alignment with United Nations SDGs
#12 RESPONSIBLE CONSUMPTION AND PRODUCTION
Our sustainability practices for our operations and supply chain reflect the attention to product sustainability and reducing our manufacturing footprint. Goals and programs for materials, water, and energy conservation are in place as well as teams, processes, and tools to improve our product sustainability. Ongoing efforts to reduce air emissions and solid waste are also in place, and we report annually on our progress. We work to influence our suppliers to adopt sustainable practices as described by the Owens Corning Supplier Code of Conduct.
Our sustainability practices for the supply chain, our products, and manufacturing are further described on our website and throughout this report.
SDG Target 12.2 | By 2030, achieve sustainable management and efficient use of natural resources
We have comprehensive goals and programs for material, water, and energy conservation. In addition, we have a commitment to product sustainability, which includes material efficiency wherever possible; using recycled or plant-based content; process waste recycling; and providing for reuse or recyclable products at the end of their life.
SDG Target 12.4 | By 2020, achieve environmentally sound management of chemicals and all wastes throughout their life cycle in accordance with agreed international frameworks and significantly reduce their release to air, water and soil to minimize adverse impacts on human health and the environment
We address materials of concern and seek to replace materials with those that are less hazardous without compromising performance. In 2017, for example, we eliminated the use of hexabromocyclododecane (HBCD) as a flame retardant for our XPS foam products in all our North American plants, and introduced the first formaldehyde-free Thermafiber® mineral wool insulation in North America. Our long-term goal is to eliminate formaldehyde in all our products.
SDG Target 12.5 | By 2030 substantially reduce waste generation through prevention, reduction, recycling and reuse
We have comprehensive goals and programs for emissions and waste reduction. We aspire to be at zero waste in all our facilities, which has been a challenge but has spurred innovation. We are also a large purchaser of recycled materials such as glass from container recycling and continue to work to make this material more available.
SDG Target 12.6 | Encourage companies, especially large and transnational companies to adopt sustainable practices and to integrate sustainability information into their reporting cycle.
At Owens Corning, we disclose sustainability performance on a number of different platforms, including our website, this GRI report, our CDP report, and application to the Dow Jones Sustainability Index (DJSI). Due to timing and data collection requirements, we have not published simultaneous financial and sustainability reports.
SDG Target 12.7 | Promote public procurement practices that are sustainable in accordance with national policies and priorities
For supply chain efficiency and sustainability reasons, we procure many goods within a 250-mile range of where they are being used, and our supplier code of conduct outlines our expectations that suppliers also establish footprint reduction goals. In this, our 2017 report, we have devoted an entire section to our commitment to supply chain sustainability.
2017 OWENS CORNING SUSTAINABILITY REPORT | PURPOSE + PEOPLE + ACTION | 32
E X E CUTIVE S U M MARY
Alignment with United Nations SDGs
#13 CLIMATE ACTION
To reduce the impact of our operations and activities on global climate change, we focus on accelerating energy efficiency improvements, renewable energy deployment, and greenhouse gas (GHG) emission reductions. Our new GHG reduction goal is informed by science-based methodologies that are designed to reduce carbon emissions enough to limit global warming to less than 2° Celsius compared to pre-industrial temperatures. Other efforts include helping builders construct more energy-efficient and durable buildings, and enhancing the productivity of wind turbines through innovative solutions produced by our Composites business.
SDG Target 13.1 | Strengthen resilience and adaptive capacity to climate related hazards and natural disasters in all countries
In addition to footprint reduction, Owens Corning conducts risk assessments and mitigation programs, including to address climate risk. Owens Corning’s GHG reduction targets remain aligned with limiting global warming to less than 2° C. In addition, we participate with builders, architects, and engineers to provide technical information and product innovations for resilience in building construction and infrastructure. One example is the glass-fiber reinforced rebar used in concrete and marine structures.
SDG Target 13.3 | Improved education, awareness raising and human and institutional capacity on climate change mitigation, adaptation, impact reduction and early warning
We provide education throughout the company, as well as with customers and suppliers, on sustainability practices. Our 2017 Sustainability Summit featured education and brainstorming for employees on climate change, health and well-being, and product and operations sustainability. In addition, we engaged selected suppliers on a one-on-one basis to set the stage for reducing Scope 3 burdens for purchased goods and services.
5 additional SDGs for which we believe we have a lesser, or less direct, impact, but nonetheless reflect our values, policies and outreach work
The following five SDGs are also covered in this report, but our scale of influence is often localized to the operations and communities where we do business. Our contributions are scaled to be important to local communities in accordance with their needs, and they tend to be focused on a few sites, most notably in several communities in India and China where Owens Corning has a significant presence.
#4: ENSURE INCLUSIVE AND QUALITY EDUCATION FOR ALL AND PROMOTE
LIFELONG LEARNING
Our work in India and China supports many of the targets for this goal. In 2017, more than 300 migrant children received assistance through non-formal education (NFE) classes to help build their basic knowledge in language and mathematics. Over 800 students were enrolled in computer education classes, granting them access to more information and an enhanced education, and 18 students were awarded scholarships. In China, the Owens Corning Foundation has supported the founding of the Green IT Classroom programs in migrant schools near several of our plants. In 2017, we sponsored a new Green IT Classroom, bringing the total number to five classrooms in Owens Corning communities and benefiting more than 2,400 students. In addition, training and education are cornerstones for the development of our 17,000 employees around the world.
2017 OWENS CORNING SUSTAINABILITY REPORT | PURPOSE + PEOPLE + ACTION | 33
E X E CUTIVE S U M MARY
Alignment with United Nations SDGs
#6 ENSURE ACCESS TO WATER AND SANITATION FOR ALL
The Owens Corning Foundation has worked with United Way Mumbai and the HOPE Foundation to provide basic health services, clean water facilities, and basic sanitation in villages and schools. In 2017, a total of 550 students in Mumbai communities gained access to basic sanitation facilities and clean water, and four families received toilet facilities. Our water conservation and risk mitigation programs, driven by plant-level efforts and engagement, help reduce our water footprint. A deep understanding of water use, quality, and preservation enables us to achieve our water management goals.
#11 SUSTAINABLE CITIES AND COMMUNITIES
Owens Corning works with developers, architects, and builders of communities and buildings within cities to bring building science and product solutions for high-performance residential and commercial buildings. Energy efficiency, durability, and life safety all contribute to comfort and healthy living for residents and workers in these buildings. Our work with Habitat for Humanity, neighborhood development, and community involvement in the locations where we do business bring solutions for sustainability and well-being. We believe we are positively impacting the following SDG indicators:
• By 2030, ensure access for all to adequate, safe and affordable housing and basic services, and upgrade slums
• By 2020, substantially increase the number of cities and human settlements adopting and implementing integrated policies and plans towards inclusion, resource efficiency, mitigation and adaptation to climate change, resilience to disasters, and develop and implement, in line with the Sendai Framework for Disaster Risk Reduction 2015-2030, holistic disaster risk management at all levels
• Support least developed countries, including through financial and technical assistance, in building sustainable and resilient buildings utilizing local materials
#16 PEACE, JUSTICE AND STRONG INSTITUTIONS
Owens Corning is committed to ethical and responsible behavior and expects such behavior from our employees and those with whom we do business. The Owens Corning Code of Conduct, our Human Rights Policy, and our Supplier Code of Conduct support targets for this goal.
#17 PARTNERSHIPS FOR THE GOALS
Owens Corning demonstrates collaboration and partnering to extend our work and our handprint (positive impacts) where synergy can escalate the work. In particular, we partner with local organizations to extend the work of the Owens Corning Foundation in developing countries – with the goal of enhancing our ability to bring worthwhile change and improvements where we do business. See Appendix C for a list of partnerships and collarborations.
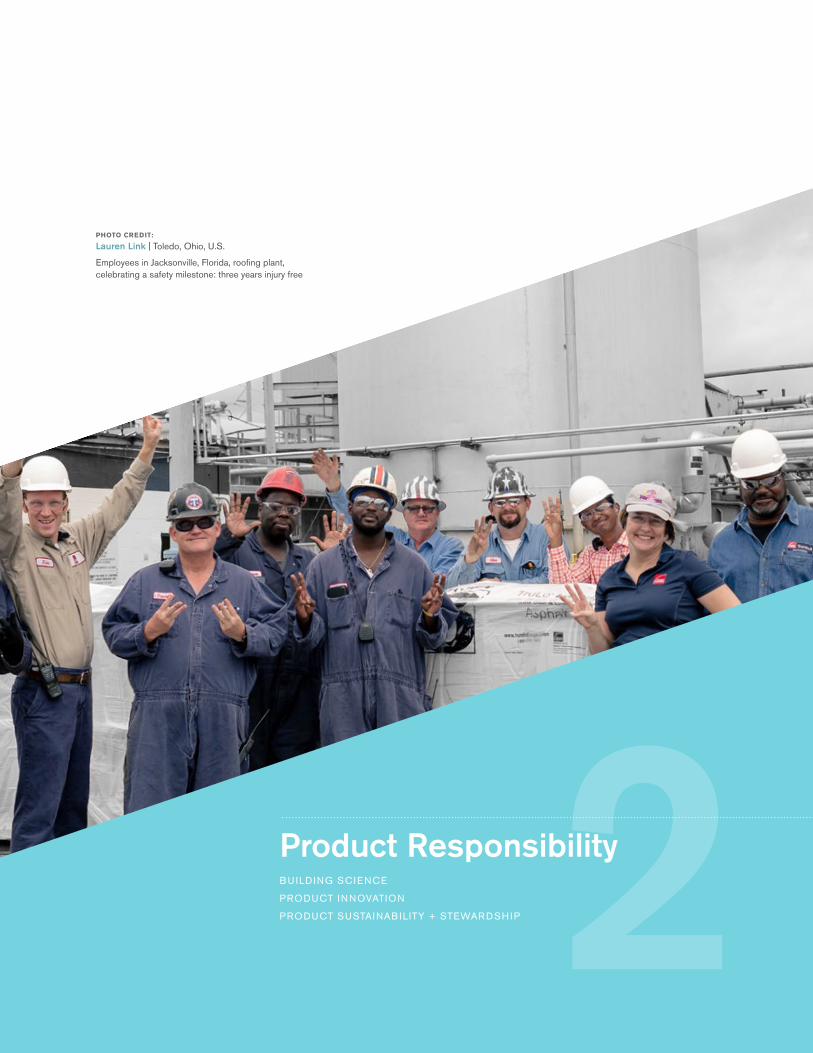
PHOTO CREDIT:
Lauren Link | Toledo, Ohio, U.S.
Employees in Jacksonville, Florida, roofing plant, celebrating a safety milestone: three years injury free
2Product ResponsibilityBUILDING SCIENCE
PRODUCT INNOVATION
PRODUCT SUSTAINAB ILITY + STEWARDSHIP
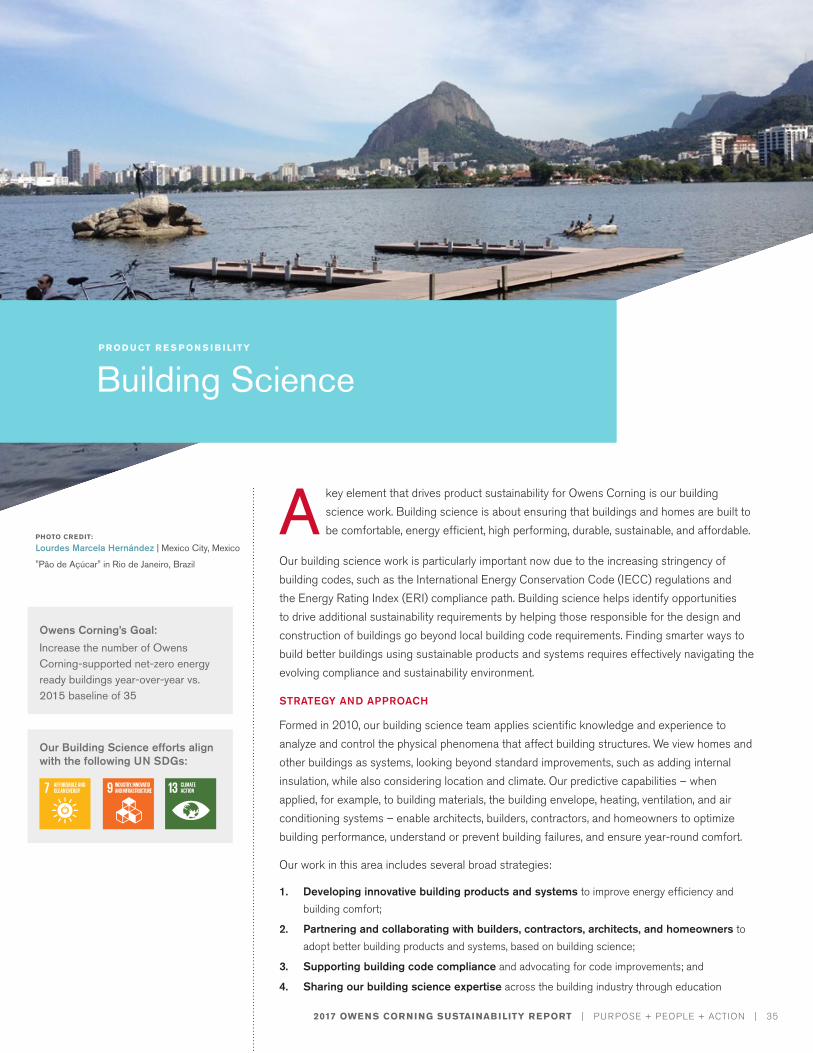
2017 OWENS CORNING SUSTAINABILITY REPORT | PURPOSE + PEOPLE + ACTION | 35
Owens Corning’s Goal:
PHOTO CREDIT:
Lourdes Marcela Hernández | Mexico City, Mexico
"Pão de Açúcar" in Rio de Janeiro, Brazil
Our Building Science efforts align with the following UN SDGs:
Increase the number of Owens Corning-supported net-zero energy ready buildings year-over-year vs. 2015 baseline of 35
A key element that drives product sustainability for Owens Corning is our building science work. Building science is about ensuring that buildings and homes are built to be comfortable, energy efficient, high performing, durable, sustainable, and affordable.
Our building science work is particularly important now due to the increasing stringency of building codes, such as the International Energy Conservation Code (IECC) regulations and the Energy Rating Index (ERI) compliance path. Building science helps identify opportunities to drive additional sustainability requirements by helping those responsible for the design and construction of buildings go beyond local building code requirements. Finding smarter ways to build better buildings using sustainable products and systems requires effectively navigating the evolving compliance and sustainability environment.
STRATEGY AND APPROACH
Formed in 2010, our building science team applies scientific knowledge and experience to analyze and control the physical phenomena that affect building structures. We view homes and other buildings as systems, looking beyond standard improvements, such as adding internal insulation, while also considering location and climate. Our predictive capabilities – when applied, for example, to building materials, the building envelope, heating, ventilation, and air conditioning systems – enable architects, builders, contractors, and homeowners to optimize building performance, understand or prevent building failures, and ensure year-round comfort.
Our work in this area includes several broad strategies:
1. Developing innovative building products and systems to improve energy efficiency and building comfort;
2. Partnering and collaborating with builders, contractors, architects, and homeowners to adopt better building products and systems, based on building science;
3. Supporting building code compliance and advocating for code improvements; and
4. Sharing our building science expertise across the building industry through education
PR OD U CT R E S P ON S I B I L ITY
Building Science
2017 OWENS CORNING SUSTAINABILITY REPORT | PURPOSE + PEOPLE + ACTION | 36
PR OD U CT R E S P ON S I B I L ITY
Building Science
Through product development, partnerships, advocacy, and education, we are improving the way people think about, build, and use buildings.
PARTNERING TO INCREASE THE NUMBER OF NET-ZERO ENERGY READY BUILDINGS
We actively partner with builders, contractors, architects, and homeowners to improve building performance and comfort. Our building science team works closely with them to support projects from blueprint through the construction phase. Together, we address climate challenges and achieve performance goals as measured in part by the Home Energy Rating System (HERS) Index.
One of our primary goals is to support the design and construction of an increased number of net-zero energy (NZE) ready buildings. An NZE building is a building with zero annual net energy consumption, meaning that the total amount of energy the building produces equals the amount of energy it consumes. An NZE-ready building is designed to be ultra-energy efficient, so it only lacks the energy production, such as roof solar panels, to be net-zero energy.
The HERS index is measured by raters under the standards of RESNET (Residential Energy Services Network). Owens Corning has been an advocate and leader in forming the Supplier Advisory Board, to involve manufacturers in gaining scale for more high-performance buildings. Many people consider a HERS Index Score of 40 or less as a tipping point to NZE homes. In 2017, there were 2,099 homes that were HERS Rated and had a HERS Index Score of 40 or less.
In 2015, we set a goal to increase the number of Owens Corning-supported NZE-ready buildings year-over-year, compared to a 2015 baseline of 35. Through strategic partnerships with several homebuilders, we made significant progress in 2017 towards achieving this goal:
Builder Name Number of NZE or NZE-Ready Homes Built in 2017 Location Owen Corning Support
Thrive Homes 204 ColoradoOwens Corning applied hygrothermal analysis to help the selection of optimum envelope packages that meet NZE performances.
De Young Properties
5 (started in late 2017 – start of a 36-home
community)California
Owens Corning R-21 fiberglass insulation batts were used in between the wall studs. Owens Corning’s R-38 fiberglass loosefill insulation was also used to seal the attic and insulate under the roof, creating a quasi-interior conditioned space.
Shea Xero 150 California
We worked with Shea on a high-performance insulation solution for walls and attics that helped move them to the next step. Owens Corning’s high-performance unvented attic system was deployed.
Les Constructions Lacourse 1 Quebec
Owens Corning’s ComfortCertified™ air barrier system was used to provide homeowners with safer, more comfortable homes.
Reid’s Heritage Homes 10 Ontario
Many years of working with Reid’s to bring them from ENERGY STAR® to NZE using advanced insulation and sealing methods.
Other Canadian home builders 18 Canada Several builders are now embarking on entire communities.
PHOTO CREDIT:
Lance Li | Shanghai, China
Lance Li with his daughter in a Shanghai park
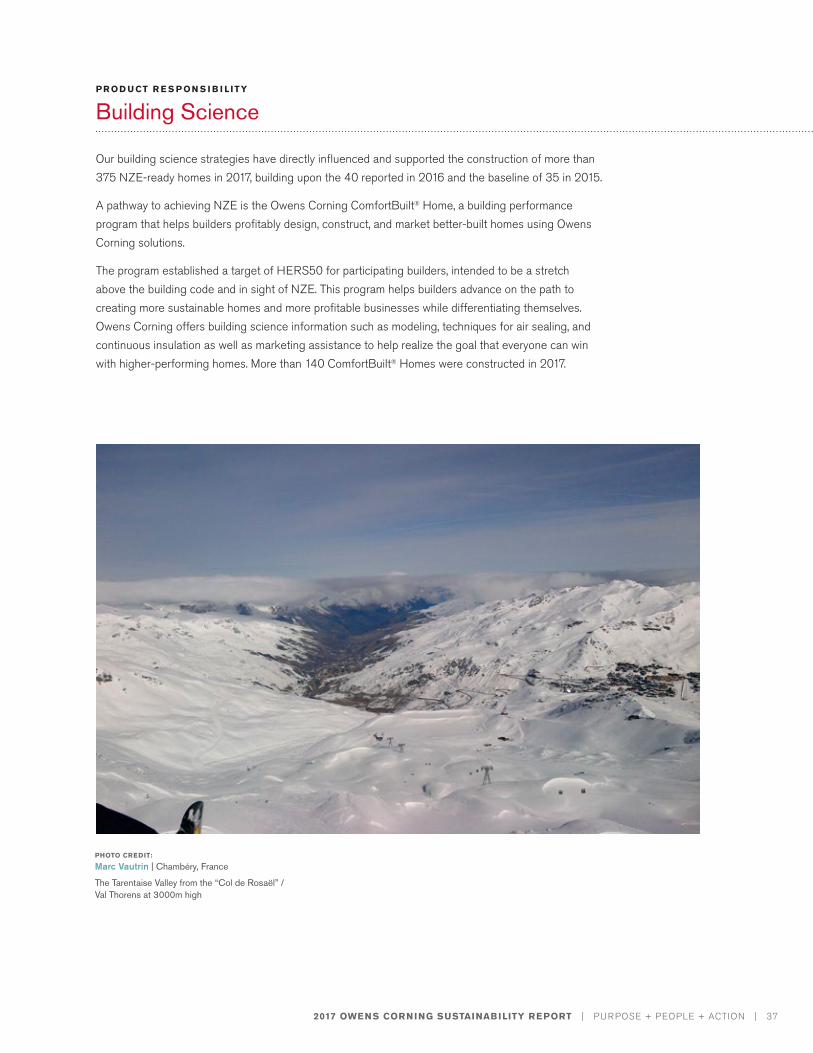
2017 OWENS CORNING SUSTAINABILITY REPORT | PURPOSE + PEOPLE + ACTION | 37
PR OD U CT R E S P ON S I B I L ITY
Building Science
Our building science strategies have directly influenced and supported the construction of more than 375 NZE-ready homes in 2017, building upon the 40 reported in 2016 and the baseline of 35 in 2015.
A pathway to achieving NZE is the Owens Corning ComfortBuilt® Home, a building performance program that helps builders profitably design, construct, and market better-built homes using Owens Corning solutions.
The program established a target of HERS50 for participating builders, intended to be a stretch above the building code and in sight of NZE. This program helps builders advance on the path to creating more sustainable homes and more profitable businesses while differentiating themselves. Owens Corning offers building science information such as modeling, techniques for air sealing, and continuous insulation as well as marketing assistance to help realize the goal that everyone can win with higher-performing homes. More than 140 ComfortBuilt® Homes were constructed in 2017.
PHOTO CREDIT:
Marc Vautrin | Chambéry, France
The Tarentaise Valley from the “Col de Rosaël” / Val Thorens at 3000m high
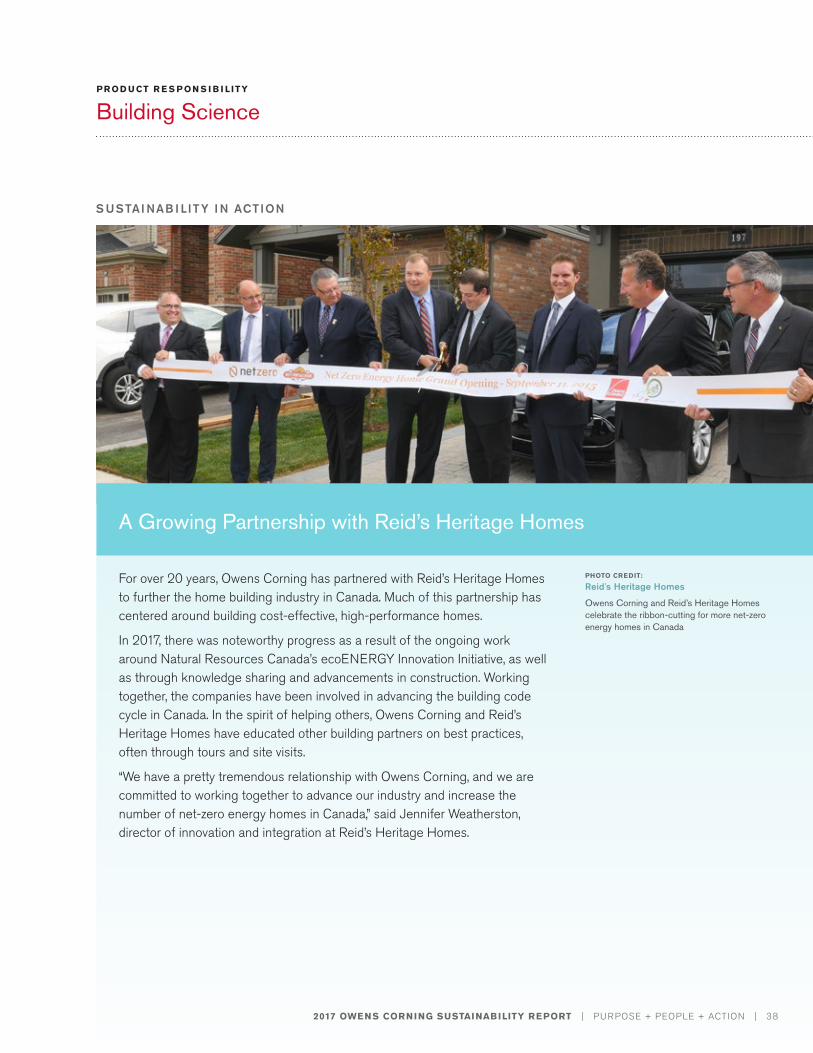
S USTAI NAB I LITY I N ACTION
2017 OWENS CORNING SUSTAINABILITY REPORT | PURPOSE + PEOPLE + ACTION | 38
PR OD U CT R E S P ON S I B I L ITY
Building Science
A Growing Partnership with Reid’s Heritage Homes
For over 20 years, Owens Corning has partnered with Reid’s Heritage Homes to further the home building industry in Canada. Much of this partnership has centered around building cost-effective, high-performance homes.
In 2017, there was noteworthy progress as a result of the ongoing work around Natural Resources Canada’s ecoENERGY Innovation Initiative, as well as through knowledge sharing and advancements in construction. Working together, the companies have been involved in advancing the building code cycle in Canada. In the spirit of helping others, Owens Corning and Reid’s Heritage Homes have educated other building partners on best practices, often through tours and site visits.
“We have a pretty tremendous relationship with Owens Corning, and we are committed to working together to advance our industry and increase the number of net-zero energy homes in Canada,” said Jennifer Weatherston, director of innovation and integration at Reid’s Heritage Homes.
PHOTO CREDIT:
Reid's Heritage Homes
Owens Corning and Reid’s Heritage Homes celebrate the ribbon-cutting for more net-zero energy homes in Canada
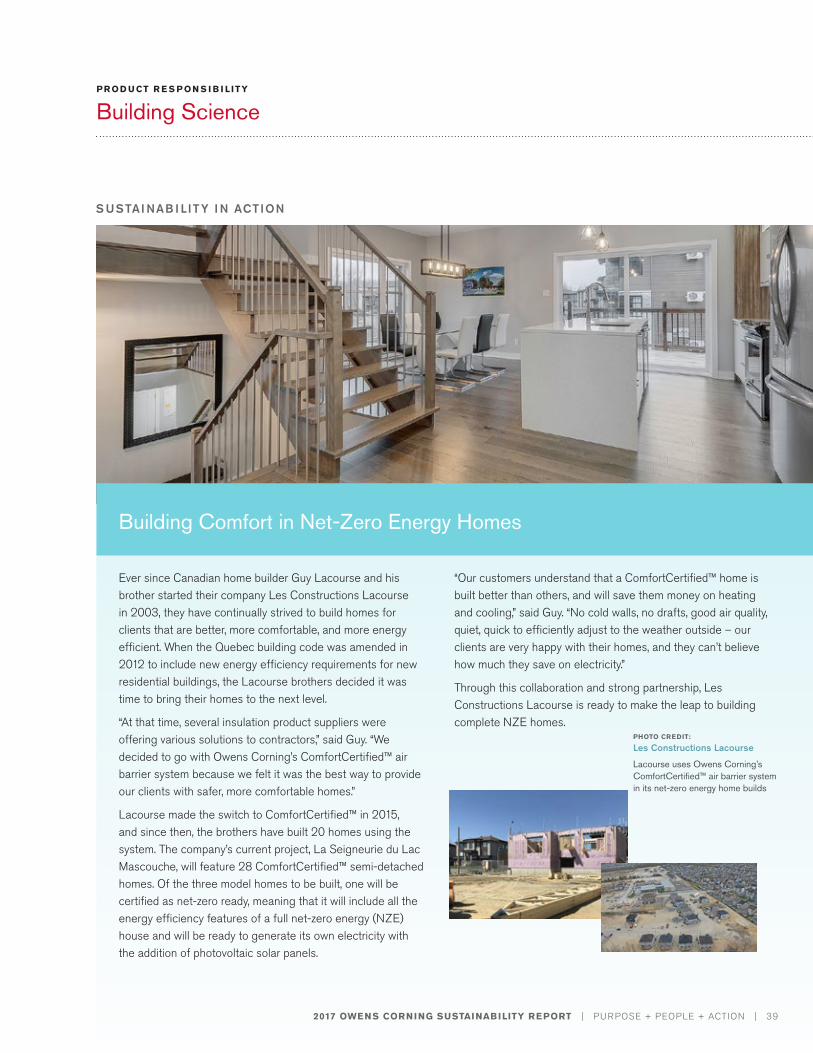
S USTAI NAB I LITY I N ACTION
2017 OWENS CORNING SUSTAINABILITY REPORT | PURPOSE + PEOPLE + ACTION | 39
PR OD U CT R E S P ON S I B I L ITY
Building Science
Building Comfort in Net-Zero Energy Homes
Ever since Canadian home builder Guy Lacourse and his brother started their company Les Constructions Lacourse in 2003, they have continually strived to build homes for clients that are better, more comfortable, and more energy efficient. When the Quebec building code was amended in 2012 to include new energy efficiency requirements for new residential buildings, the Lacourse brothers decided it was time to bring their homes to the next level.
“At that time, several insulation product suppliers were offering various solutions to contractors,” said Guy. “We decided to go with Owens Corning’s ComfortCertified™ air barrier system because we felt it was the best way to provide our clients with safer, more comfortable homes.”
Lacourse made the switch to ComfortCertified™ in 2015, and since then, the brothers have built 20 homes using the system. The company’s current project, La Seigneurie du Lac Mascouche, will feature 28 ComfortCertified™ semi-detached homes. Of the three model homes to be built, one will be certified as net-zero ready, meaning that it will include all the energy efficiency features of a full net-zero energy (NZE) house and will be ready to generate its own electricity with the addition of photovoltaic solar panels.
“Our customers understand that a ComfortCertified™ home is built better than others, and will save them money on heating and cooling,” said Guy. “No cold walls, no drafts, good air quality, quiet, quick to efficiently adjust to the weather outside – our clients are very happy with their homes, and they can’t believe how much they save on electricity.”
Through this collaboration and strong partnership, Les Constructions Lacourse is ready to make the leap to building complete NZE homes.
PHOTO CREDIT:
Les Constructions Lacourse
Lacourse uses Owens Corning’s ComfortCertified™ air barrier system in its net-zero energy home builds
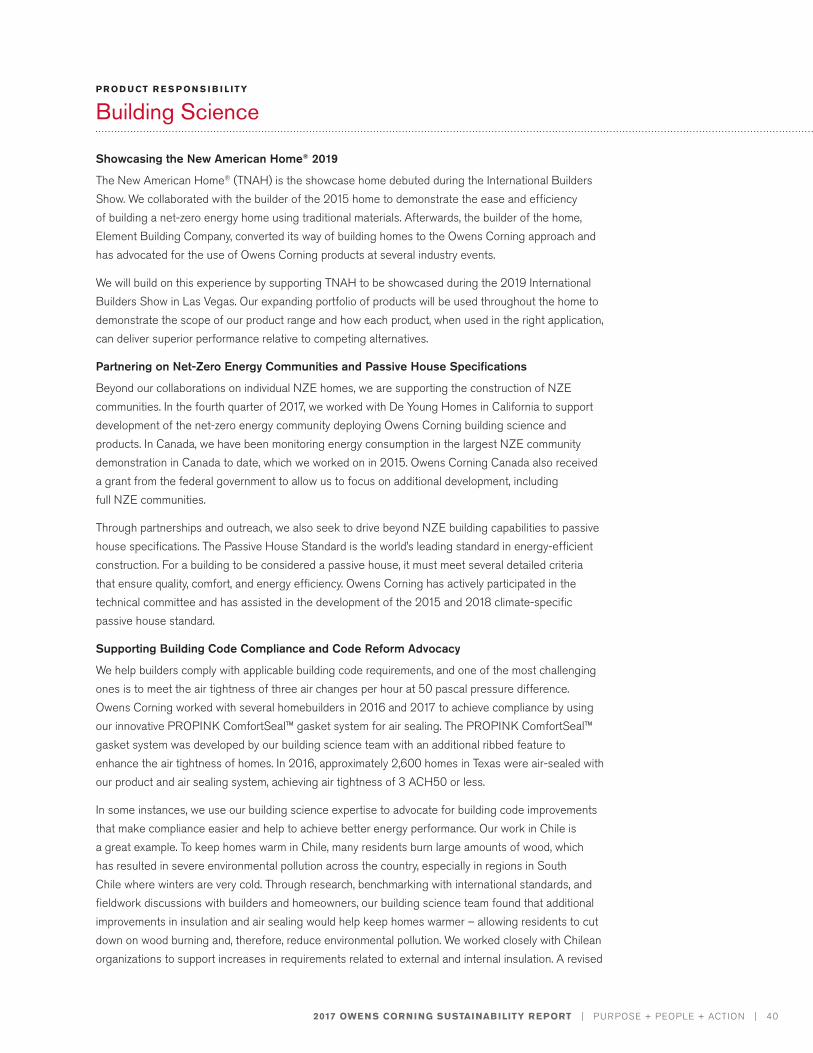
2017 OWENS CORNING SUSTAINABILITY REPORT | PURPOSE + PEOPLE + ACTION | 40
PR OD U CT R E S P ON S I B I L ITY
Building Science
Showcasing the New American Home® 2019
The New American Home® (TNAH) is the showcase home debuted during the International Builders Show. We collaborated with the builder of the 2015 home to demonstrate the ease and efficiency of building a net-zero energy home using traditional materials. Afterwards, the builder of the home, Element Building Company, converted its way of building homes to the Owens Corning approach and has advocated for the use of Owens Corning products at several industry events.
We will build on this experience by supporting TNAH to be showcased during the 2019 International Builders Show in Las Vegas. Our expanding portfolio of products will be used throughout the home to demonstrate the scope of our product range and how each product, when used in the right application, can deliver superior performance relative to competing alternatives.
Partnering on Net-Zero Energy Communities and Passive House Specifications
Beyond our collaborations on individual NZE homes, we are supporting the construction of NZE communities. In the fourth quarter of 2017, we worked with De Young Homes in California to support development of the net-zero energy community deploying Owens Corning building science and products. In Canada, we have been monitoring energy consumption in the largest NZE community demonstration in Canada to date, which we worked on in 2015. Owens Corning Canada also received a grant from the federal government to allow us to focus on additional development, including full NZE communities.
Through partnerships and outreach, we also seek to drive beyond NZE building capabilities to passive house specifications. The Passive House Standard is the world’s leading standard in energy-efficient construction. For a building to be considered a passive house, it must meet several detailed criteria that ensure quality, comfort, and energy efficiency. Owens Corning has actively participated in the technical committee and has assisted in the development of the 2015 and 2018 climate-specific passive house standard.
Supporting Building Code Compliance and Code Reform Advocacy
We help builders comply with applicable building code requirements, and one of the most challenging ones is to meet the air tightness of three air changes per hour at 50 pascal pressure difference. Owens Corning worked with several homebuilders in 2016 and 2017 to achieve compliance by using our innovative PROPINK ComfortSeal™ gasket system for air sealing. The PROPINK ComfortSeal™ gasket system was developed by our building science team with an additional ribbed feature to enhance the air tightness of homes. In 2016, approximately 2,600 homes in Texas were air-sealed with our product and air sealing system, achieving air tightness of 3 ACH50 or less.
In some instances, we use our building science expertise to advocate for building code improvements that make compliance easier and help to achieve better energy performance. Our work in Chile is a great example. To keep homes warm in Chile, many residents burn large amounts of wood, which has resulted in severe environmental pollution across the country, especially in regions in South Chile where winters are very cold. Through research, benchmarking with international standards, and fieldwork discussions with builders and homeowners, our building science team found that additional improvements in insulation and air sealing would help keep homes warmer – allowing residents to cut down on wood burning and, therefore, reduce environmental pollution. We worked closely with Chilean organizations to support increases in requirements related to external and internal insulation. A revised
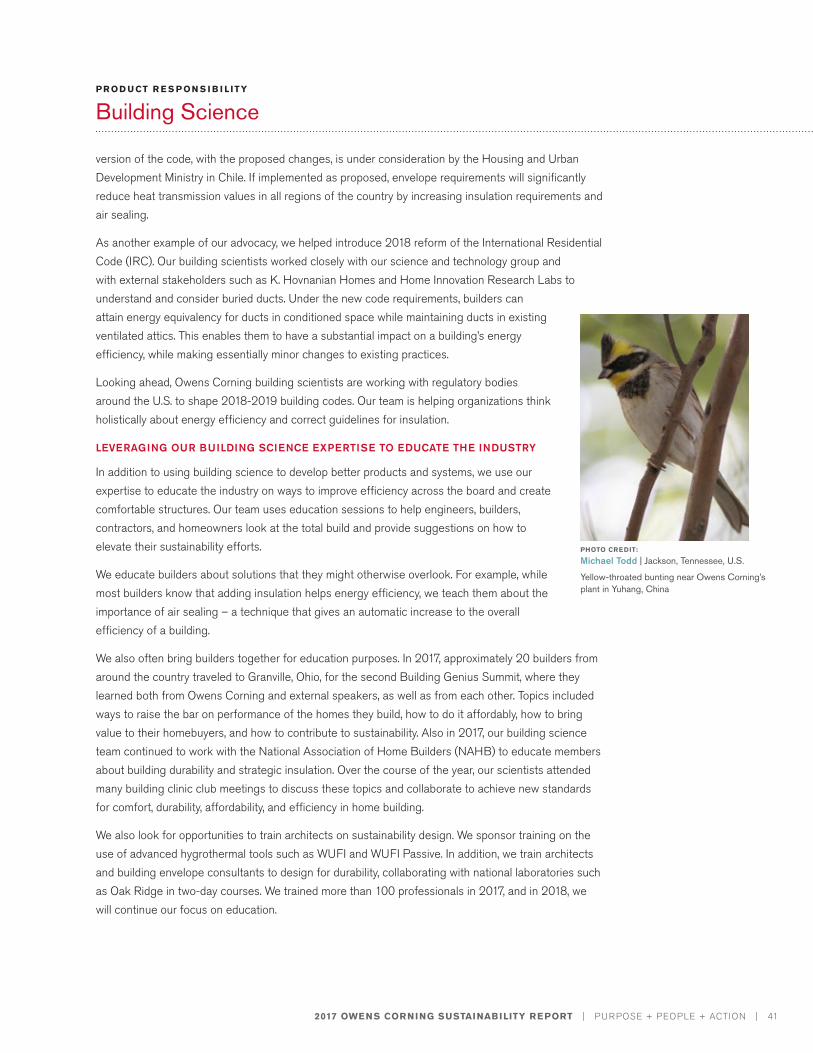
2017 OWENS CORNING SUSTAINABILITY REPORT | PURPOSE + PEOPLE + ACTION | 41
PR OD U CT R E S P ON S I B I L ITY
Building Science
version of the code, with the proposed changes, is under consideration by the Housing and Urban Development Ministry in Chile. If implemented as proposed, envelope requirements will significantly reduce heat transmission values in all regions of the country by increasing insulation requirements and air sealing.
As another example of our advocacy, we helped introduce 2018 reform of the International Residential Code (IRC). Our building scientists worked closely with our science and technology group and with external stakeholders such as K. Hovnanian Homes and Home Innovation Research Labs to understand and consider buried ducts. Under the new code requirements, builders can attain energy equivalency for ducts in conditioned space while maintaining ducts in existing ventilated attics. This enables them to have a substantial impact on a building’s energy efficiency, while making essentially minor changes to existing practices.
Looking ahead, Owens Corning building scientists are working with regulatory bodies around the U.S. to shape 2018-2019 building codes. Our team is helping organizations think holistically about energy efficiency and correct guidelines for insulation.
LEVERAGING OUR BUILDING SCIENCE EXPERTISE TO EDUCATE THE INDUSTRY
In addition to using building science to develop better products and systems, we use our expertise to educate the industry on ways to improve efficiency across the board and create comfortable structures. Our team uses education sessions to help engineers, builders, contractors, and homeowners look at the total build and provide suggestions on how to elevate their sustainability efforts.
We educate builders about solutions that they might otherwise overlook. For example, while most builders know that adding insulation helps energy efficiency, we teach them about the importance of air sealing – a technique that gives an automatic increase to the overall efficiency of a building.
We also often bring builders together for education purposes. In 2017, approximately 20 builders from around the country traveled to Granville, Ohio, for the second Building Genius Summit, where they learned both from Owens Corning and external speakers, as well as from each other. Topics included ways to raise the bar on performance of the homes they build, how to do it affordably, how to bring value to their homebuyers, and how to contribute to sustainability. Also in 2017, our building science team continued to work with the National Association of Home Builders (NAHB) to educate members about building durability and strategic insulation. Over the course of the year, our scientists attended many building clinic club meetings to discuss these topics and collaborate to achieve new standards for comfort, durability, affordability, and efficiency in home building.
We also look for opportunities to train architects on sustainability design. We sponsor training on the use of advanced hygrothermal tools such as WUFI and WUFI Passive. In addition, we train architects and building envelope consultants to design for durability, collaborating with national laboratories such as Oak Ridge in two-day courses. We trained more than 100 professionals in 2017, and in 2018, we will continue our focus on education.
PHOTO CREDIT:
Michael Todd | Jackson, Tennessee, U.S.
Yellow-throated bunting near Owens Corning’s plant in Yuhang, China
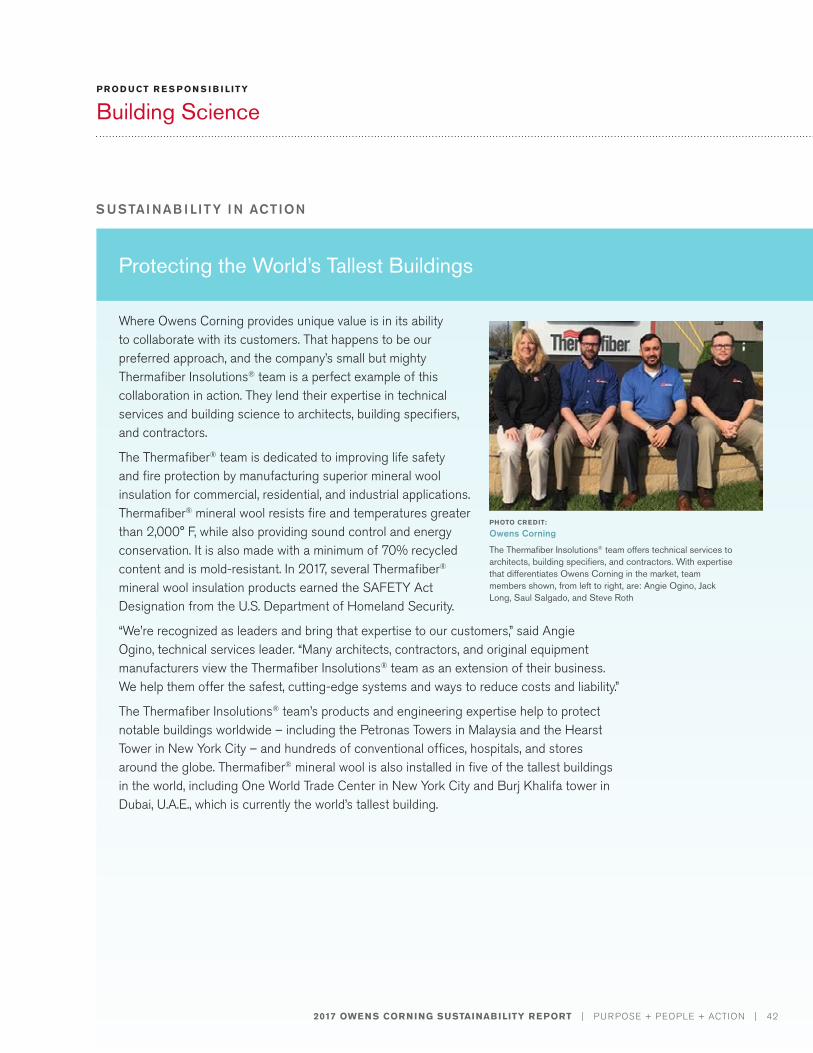
2017 OWENS CORNING SUSTAINABILITY REPORT | PURPOSE + PEOPLE + ACTION | 42
PR OD U CT R E S P ON S I B I L ITY
Building Science
Protecting the World’s Tallest Buildings
S USTAI NAB I LITY I N ACTION
Where Owens Corning provides unique value is in its ability to collaborate with its customers. That happens to be our preferred approach, and the company’s small but mighty Thermafiber Insolutions® team is a perfect example of this collaboration in action. They lend their expertise in technical services and building science to architects, building specifiers, and contractors.
The Thermafiber® team is dedicated to improving life safety and fire protection by manufacturing superior mineral wool insulation for commercial, residential, and industrial applications. Thermafiber® mineral wool resists fire and temperatures greater than 2,000° F, while also providing sound control and energy conservation. It is also made with a minimum of 70% recycled content and is mold-resistant. In 2017, several Thermafiber® mineral wool insulation products earned the SAFETY Act Designation from the U.S. Department of Homeland Security.
“We’re recognized as leaders and bring that expertise to our customers,” said Angie Ogino, technical services leader. “Many architects, contractors, and original equipment manufacturers view the Thermafiber Insolutions® team as an extension of their business. We help them offer the safest, cutting-edge systems and ways to reduce costs and liability.”
The Thermafiber Insolutions® team’s products and engineering expertise help to protect notable buildings worldwide – including the Petronas Towers in Malaysia and the Hearst Tower in New York City – and hundreds of conventional offices, hospitals, and stores around the globe. Thermafiber® mineral wool is also installed in five of the tallest buildings in the world, including One World Trade Center in New York City and Burj Khalifa tower in Dubai, U.A.E., which is currently the world’s tallest building.
PHOTO CREDIT:
Owens Corning
The Thermafiber Insolutions® team offers technical services to architects, building specifiers, and contractors. With expertise that differentiates Owens Corning in the market, team members shown, from left to right, are: Angie Ogino, Jack Long, Saul Salgado, and Steve Roth
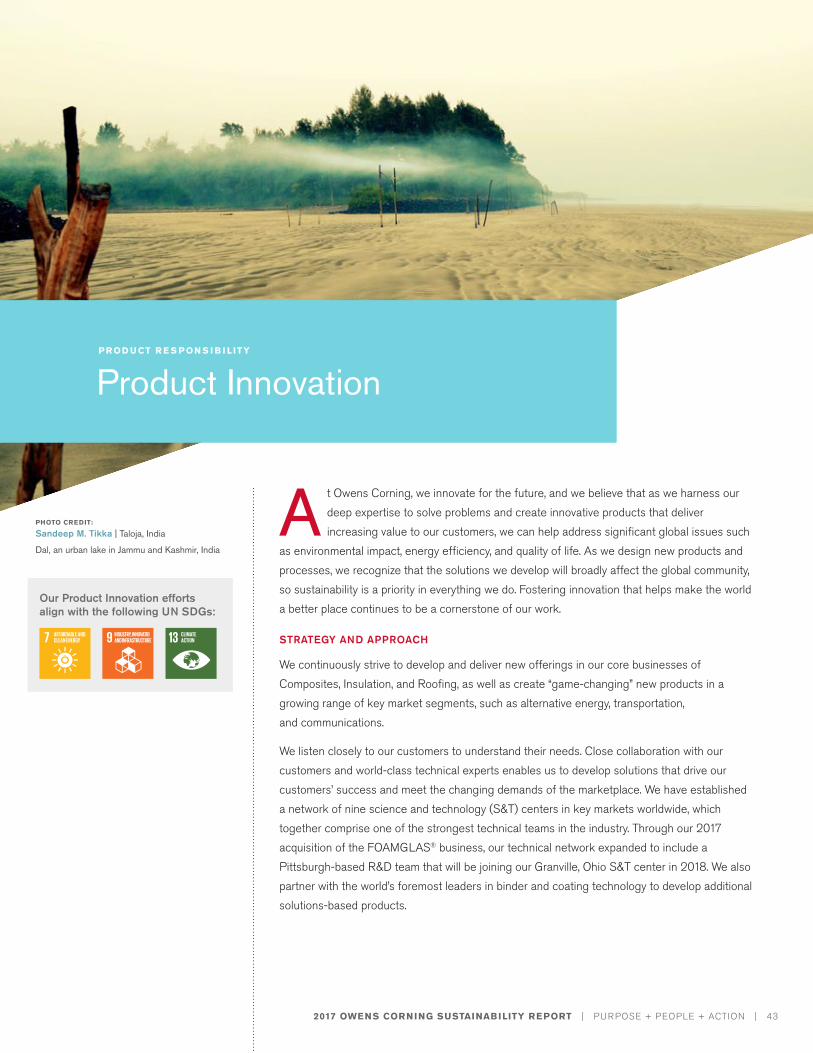
2017 OWENS CORNING SUSTAINABILITY REPORT | PURPOSE + PEOPLE + ACTION | 43
PHOTO CREDIT:
Sandeep M. Tikka | Taloja, India
Dal, an urban lake in Jammu and Kashmir, India
A t Owens Corning, we innovate for the future, and we believe that as we harness our deep expertise to solve problems and create innovative products that deliver increasing value to our customers, we can help address significant global issues such
as environmental impact, energy efficiency, and quality of life. As we design new products and processes, we recognize that the solutions we develop will broadly affect the global community, so sustainability is a priority in everything we do. Fostering innovation that helps make the world a better place continues to be a cornerstone of our work.
STRATEGY AND APPROACH
We continuously strive to develop and deliver new offerings in our core businesses of Composites, Insulation, and Roofing, as well as create “game-changing” new products in a growing range of key market segments, such as alternative energy, transportation, and communications.
We listen closely to our customers to understand their needs. Close collaboration with our customers and world-class technical experts enables us to develop solutions that drive our customers’ success and meet the changing demands of the marketplace. We have established a network of nine science and technology (S&T) centers in key markets worldwide, which together comprise one of the strongest technical teams in the industry. Through our 2017 acquisition of the FOAMGLAS® business, our technical network expanded to include a Pittsburgh-based R&D team that will be joining our Granville, Ohio S&T center in 2018. We also partner with the world’s foremost leaders in binder and coating technology to develop additional solutions-based products.
Our Product Innovation efforts align with the following UN SDGs:
PR OD U CT R E S P ON S I B I L ITY
Product Innovation
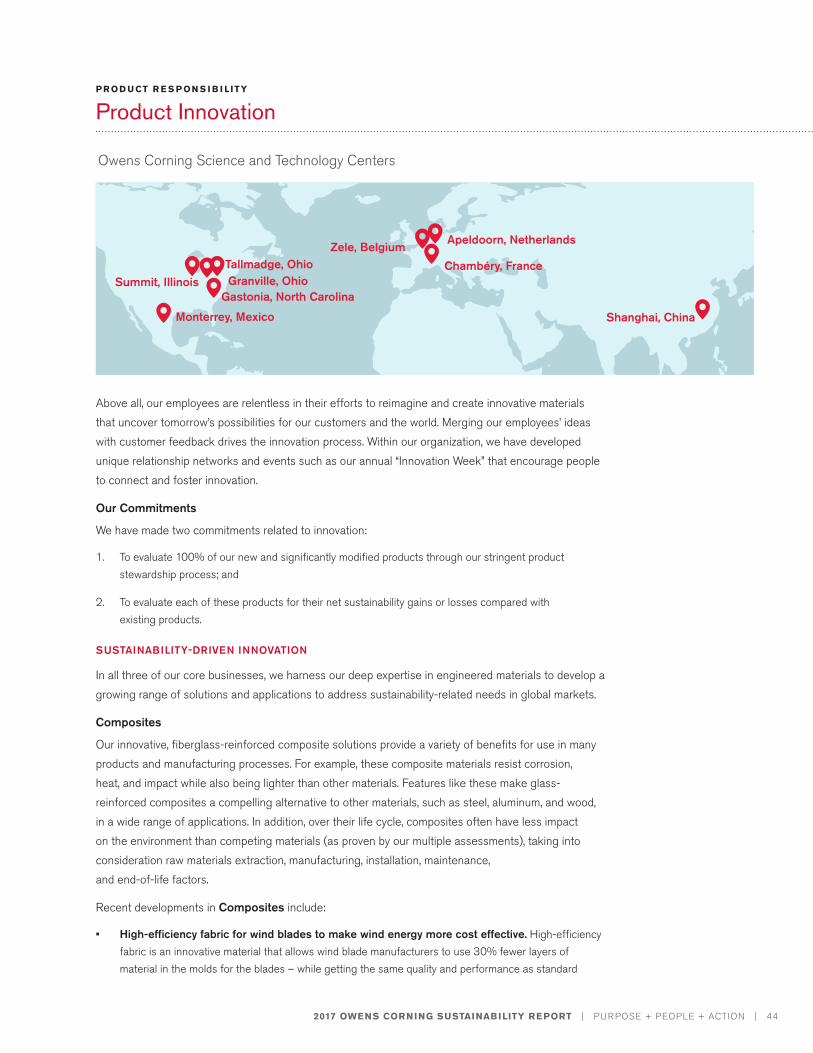
2017 OWENS CORNING SUSTAINABILITY REPORT | PURPOSE + PEOPLE + ACTION | 44
Above all, our employees are relentless in their efforts to reimagine and create innovative materials that uncover tomorrow’s possibilities for our customers and the world. Merging our employees’ ideas with customer feedback drives the innovation process. Within our organization, we have developed unique relationship networks and events such as our annual “Innovation Week” that encourage people to connect and foster innovation.
Our Commitments
We have made two commitments related to innovation:
1. To evaluate 100% of our new and significantly modified products through our stringent product stewardship process; and
2. To evaluate each of these products for their net sustainability gains or losses compared with existing products.
SUSTAINABILITY-DRIVEN INNOVATION
In all three of our core businesses, we harness our deep expertise in engineered materials to develop a growing range of solutions and applications to address sustainability-related needs in global markets.
Composites
Our innovative, fiberglass-reinforced composite solutions provide a variety of benefits for use in many products and manufacturing processes. For example, these composite materials resist corrosion, heat, and impact while also being lighter than other materials. Features like these make glass-reinforced composites a compelling alternative to other materials, such as steel, aluminum, and wood, in a wide range of applications. In addition, over their life cycle, composites often have less impact on the environment than competing materials (as proven by our multiple assessments), taking into consideration raw materials extraction, manufacturing, installation, maintenance, and end-of-life factors.
Recent developments in Composites include:
• High-efficiency fabric for wind blades to make wind energy more cost effective. High-efficiency fabric is an innovative material that allows wind blade manufacturers to use 30% fewer layers of material in the molds for the blades – while getting the same quality and performance as standard
PR OD U CT R E S P ON S I B I L ITY
Product Innovation
Owens Corning Science and Technology Centers
Chambéry, France
Shanghai, China
Zele, BelgiumTallmadge, Ohio
Summit, IllinoisGastonia, North Carolina
Monterrey, Mexico
Granville, Ohio
Apeldoorn, Netherlands
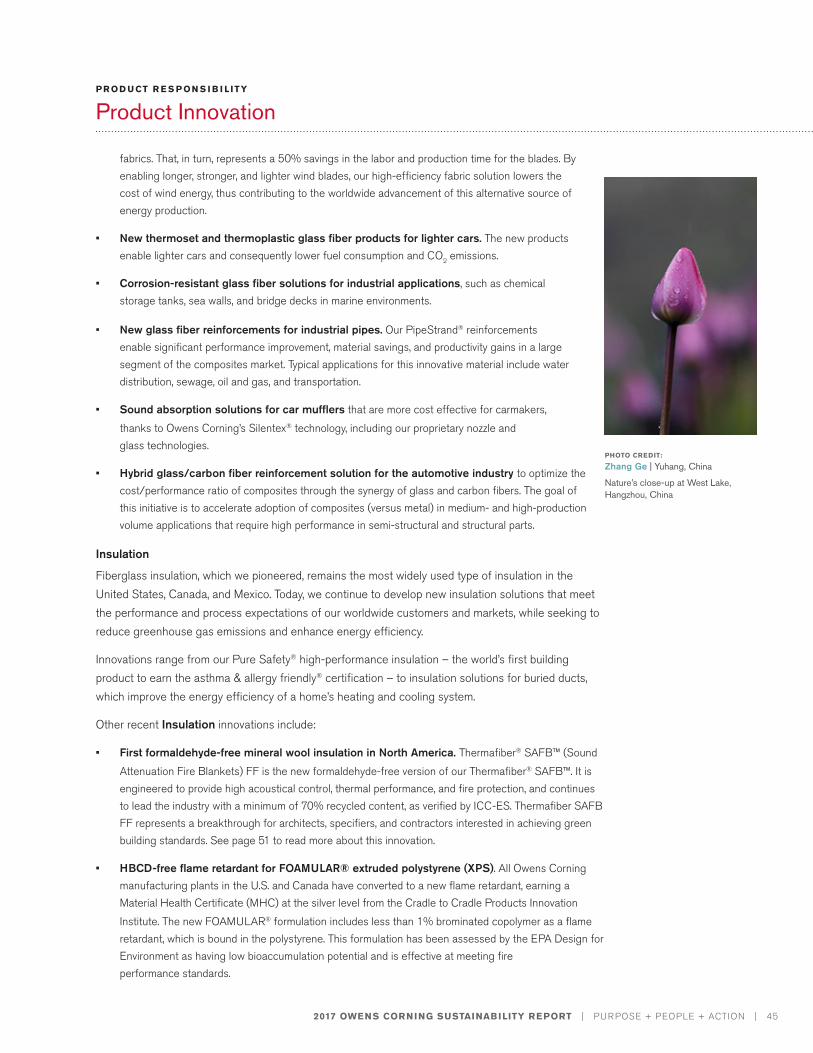
2017 OWENS CORNING SUSTAINABILITY REPORT | PURPOSE + PEOPLE + ACTION | 45
PR OD U CT R E S P ON S I B I L ITY
Product Innovation
fabrics. That, in turn, represents a 50% savings in the labor and production time for the blades. By enabling longer, stronger, and lighter wind blades, our high-efficiency fabric solution lowers the cost of wind energy, thus contributing to the worldwide advancement of this alternative source of energy production.
• New thermoset and thermoplastic glass fiber products for lighter cars. The new products enable lighter cars and consequently lower fuel consumption and CO2 emissions.
• Corrosion-resistant glass fiber solutions for industrial applications, such as chemical storage tanks, sea walls, and bridge decks in marine environments.
• New glass fiber reinforcements for industrial pipes. Our PipeStrand® reinforcements enable significant performance improvement, material savings, and productivity gains in a large segment of the composites market. Typical applications for this innovative material include water distribution, sewage, oil and gas, and transportation.
• Sound absorption solutions for car mufflers that are more cost effective for carmakers,
thanks to Owens Corning’s Silentex® technology, including our proprietary nozzle and glass technologies.
• Hybrid glass/carbon fiber reinforcement solution for the automotive industry to optimize the cost/performance ratio of composites through the synergy of glass and carbon fibers. The goal of this initiative is to accelerate adoption of composites (versus metal) in medium- and high-production volume applications that require high performance in semi-structural and structural parts.
Insulation
Fiberglass insulation, which we pioneered, remains the most widely used type of insulation in the United States, Canada, and Mexico. Today, we continue to develop new insulation solutions that meet the performance and process expectations of our worldwide customers and markets, while seeking to reduce greenhouse gas emissions and enhance energy efficiency.
Innovations range from our Pure Safety® high-performance insulation – the world’s first building product to earn the asthma & allergy friendly® certification – to insulation solutions for buried ducts, which improve the energy efficiency of a home’s heating and cooling system.
Other recent Insulation innovations include:
• First formaldehyde-free mineral wool insulation in North America. Thermafiber® SAFB™ (Sound
Attenuation Fire Blankets) FF is the new formaldehyde-free version of our Thermafiber® SAFB™. It is engineered to provide high acoustical control, thermal performance, and fire protection, and continues to lead the industry with a minimum of 70% recycled content, as verified by ICC-ES. Thermafiber SAFB FF represents a breakthrough for architects, specifiers, and contractors interested in achieving green building standards. See page 51 to read more about this innovation.
• HBCD-free flame retardant for FOAMULAR® extruded polystyrene (XPS). All Owens Corning manufacturing plants in the U.S. and Canada have converted to a new flame retardant, earning a Material Health Certificate (MHC) at the silver level from the Cradle to Cradle Products Innovation
Institute. The new FOAMULAR® formulation includes less than 1% brominated copolymer as a flame retardant, which is bound in the polystyrene. This formulation has been assessed by the EPA Design for Environment as having low bioaccumulation potential and is effective at meeting fire performance standards.
PHOTO CREDIT:
Zhang Ge | Yuhang, China
Nature’s close-up at West Lake, Hangzhou, China
2017 OWENS CORNING SUSTAINABILITY REPORT | PURPOSE + PEOPLE + ACTION | 46
PR OD U CT R E S P ON S I B I L ITY
Product Innovation
• First insulation products to be certified as made with 100% wind-powered electricity and reduced embodied carbon, in accordance with SCS Global Services’ certification protocol. These certified insulation products give commercial architects and specifiers, builders, and even homeowners the option of lower-carbon products to build greener structures. Read more on page 51.
Roofing
Our commitment to innovation allows us to meet the growing demand for longer-lasting, aesthetically attractive roofing products, as well as develop new solutions to enhance the sustainability of our products and their use.
Our Roofing milestones in 2017 include:
• Creating a powerful value proposition around the benefits of engineered synthetic underlayments vs. traditional organic products. Our message to contractors and the roofing market significantly increased the adoption of products that are more durable, faster to install, easier to use, and repel water. Ultimately, this shift will result in better-built residential roofs.
• Continuing to expand our offering of “cool roof” shingles to include darker colors and higher-end products. Using a highly reflective granule technology that reflects the sun’s rays, cool roof shingles help reduce energy use by keeping roofs cooler and reducing air conditioning energy levels. Some of
our cool roof solutions meet ENERGY STAR® requirements for solar reflectance.
• Enhancing our geosynthetic and protective packaging products to provide superior solutions for water management, agriculture, and the protection of high value raw materials. These products can serve as moisture barriers when used as covers, and as engineered liner solutions to contain liquids for
water conservation or groundwater pollution prevention.
• To expand recycling options, we are working on additional applications for end-of-use shingles.
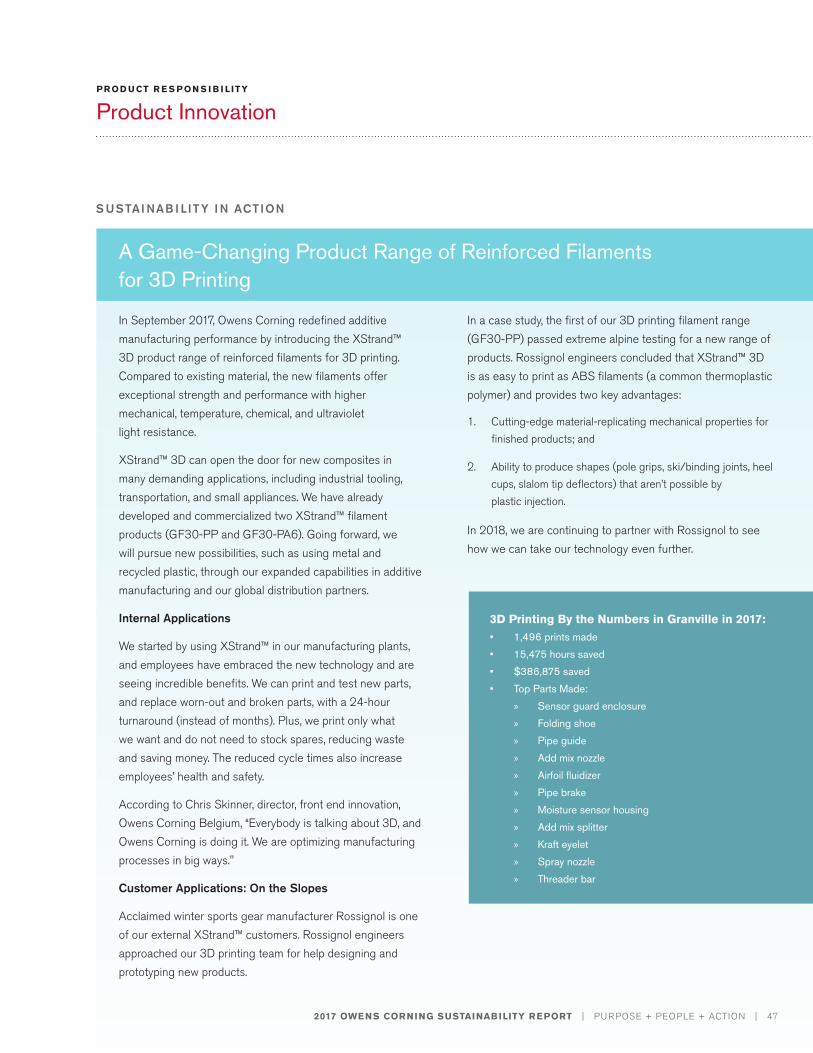
S USTAI NAB I LITY I N ACTION
2017 OWENS CORNING SUSTAINABILITY REPORT | PURPOSE + PEOPLE + ACTION | 47
A Game-Changing Product Range of Reinforced Filaments for 3D Printing
In September 2017, Owens Corning redefined additive manufacturing performance by introducing the XStrand™ 3D product range of reinforced filaments for 3D printing. Compared to existing material, the new filaments offer exceptional strength and performance with higher mechanical, temperature, chemical, and ultraviolet light resistance.
XStrand™ 3D can open the door for new composites in many demanding applications, including industrial tooling, transportation, and small appliances. We have already developed and commercialized two XStrand™ filament products (GF30-PP and GF30-PA6). Going forward, we will pursue new possibilities, such as using metal and recycled plastic, through our expanded capabilities in additive manufacturing and our global distribution partners.
Internal Applications
We started by using XStrand™ in our manufacturing plants, and employees have embraced the new technology and are seeing incredible benefits. We can print and test new parts, and replace worn-out and broken parts, with a 24-hour turnaround (instead of months). Plus, we print only what we want and do not need to stock spares, reducing waste and saving money. The reduced cycle times also increase employees’ health and safety.
According to Chris Skinner, director, front end innovation, Owens Corning Belgium, “Everybody is talking about 3D, and Owens Corning is doing it. We are optimizing manufacturing processes in big ways."
Customer Applications: On the Slopes
Acclaimed winter sports gear manufacturer Rossignol is one of our external XStrand™ customers. Rossignol engineers approached our 3D printing team for help designing and prototyping new products.
In a case study, the first of our 3D printing filament range (GF30-PP) passed extreme alpine testing for a new range of products. Rossignol engineers concluded that XStrand™ 3D is as easy to print as ABS filaments (a common thermoplastic polymer) and provides two key advantages:
1. Cutting-edge material-replicating mechanical properties for finished products; and
2. Ability to produce shapes (pole grips, ski/binding joints, heel cups, slalom tip deflectors) that aren’t possible by plastic injection.
In 2018, we are continuing to partner with Rossignol to see how we can take our technology even further.
PR OD U CT R E S P ON S I B I L ITY
Product Innovation
3D Printing By the Numbers in Granville in 2017:• 1,496 prints made
• 15,475 hours saved
• $386,875 saved
• Top Parts Made:
» Sensor guard enclosure
» Folding shoe
» Pipe guide
» Add mix nozzle
» Airfoil fluidizer
» Pipe brake
» Moisture sensor housing
» Add mix splitter
» Kraft eyelet
» Spray nozzle
» Threader bar
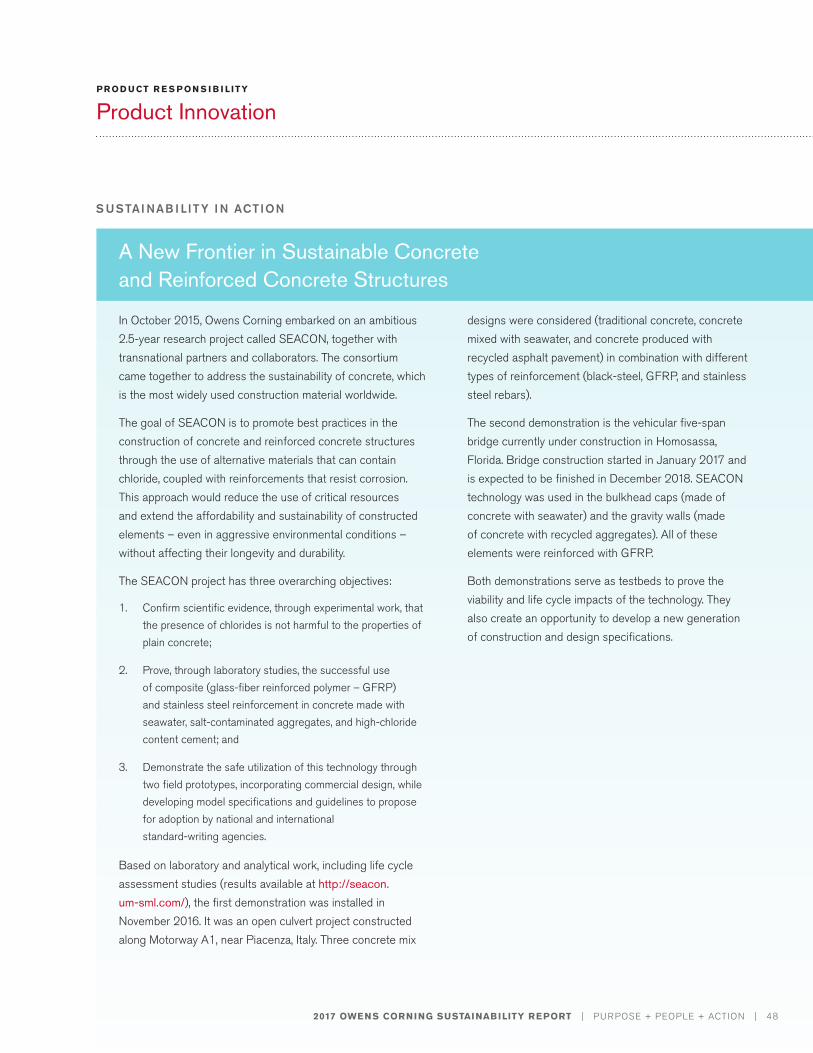
S USTAI NAB I LITY I N ACTION
2017 OWENS CORNING SUSTAINABILITY REPORT | PURPOSE + PEOPLE + ACTION | 48
A New Frontier in Sustainable Concrete and Reinforced Concrete Structures
In October 2015, Owens Corning embarked on an ambitious 2.5-year research project called SEACON, together with transnational partners and collaborators. The consortium came together to address the sustainability of concrete, which is the most widely used construction material worldwide.
The goal of SEACON is to promote best practices in the construction of concrete and reinforced concrete structures through the use of alternative materials that can contain chloride, coupled with reinforcements that resist corrosion. This approach would reduce the use of critical resources and extend the affordability and sustainability of constructed elements – even in aggressive environmental conditions – without affecting their longevity and durability.
The SEACON project has three overarching objectives:
1. Confirm scientific evidence, through experimental work, that the presence of chlorides is not harmful to the properties of plain concrete;
2. Prove, through laboratory studies, the successful use of composite (glass-fiber reinforced polymer – GFRP) and stainless steel reinforcement in concrete made with seawater, salt-contaminated aggregates, and high-chloride content cement; and
3. Demonstrate the safe utilization of this technology through two field prototypes, incorporating commercial design, while developing model specifications and guidelines to propose for adoption by national and international standard-writing agencies.
Based on laboratory and analytical work, including life cycle assessment studies (results available at http://seacon.um-sml.com/), the first demonstration was installed in November 2016. It was an open culvert project constructed along Motorway A1, near Piacenza, Italy. Three concrete mix
designs were considered (traditional concrete, concrete mixed with seawater, and concrete produced with recycled asphalt pavement) in combination with different types of reinforcement (black-steel, GFRP, and stainless steel rebars).
The second demonstration is the vehicular five-span bridge currently under construction in Homosassa, Florida. Bridge construction started in January 2017 and is expected to be finished in December 2018. SEACON technology was used in the bulkhead caps (made of concrete with seawater) and the gravity walls (made of concrete with recycled aggregates). All of these elements were reinforced with GFRP.
Both demonstrations serve as testbeds to prove the viability and life cycle impacts of the technology. They also create an opportunity to develop a new generation of construction and design specifications.
PR OD U CT R E S P ON S I B I L ITY
Product Innovation
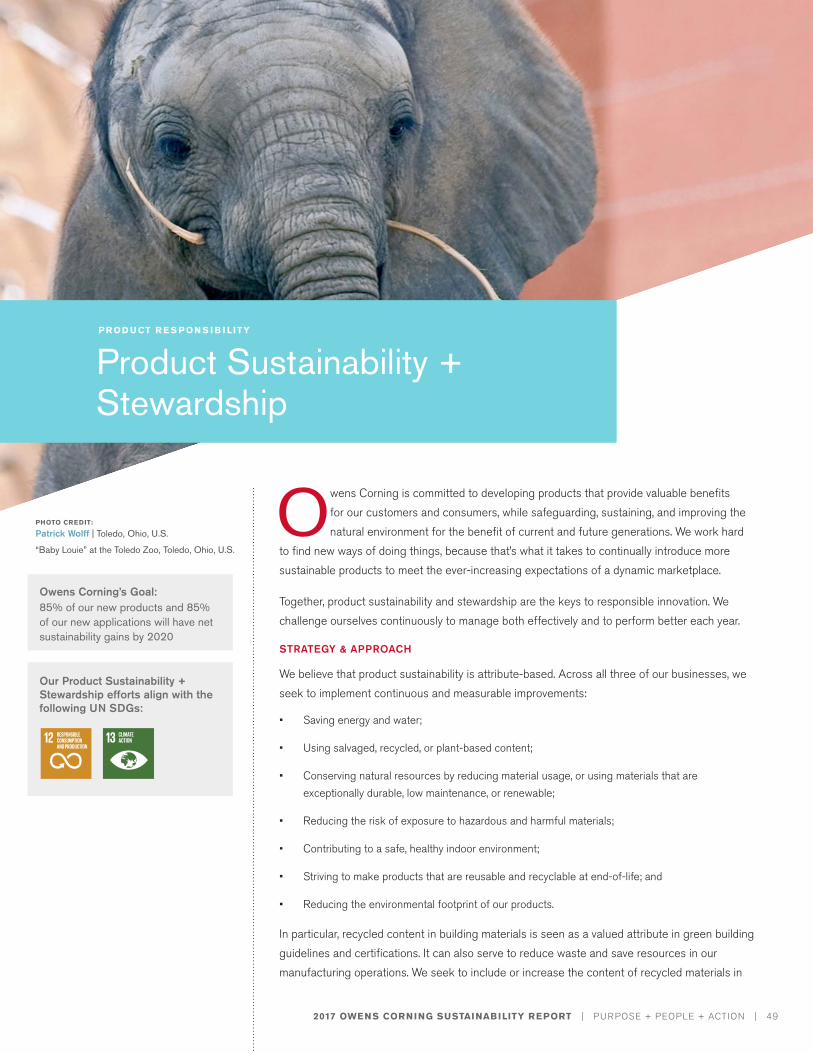
2017 OWENS CORNING SUSTAINABILITY REPORT | PURPOSE + PEOPLE + ACTION | 49
PHOTO CREDIT:
Patrick Wolff | Toledo, Ohio, U.S.
“Baby Louie” at the Toledo Zoo, Toledo, Ohio, U.S.
Owens Corning is committed to developing products that provide valuable benefits for our customers and consumers, while safeguarding, sustaining, and improving the natural environment for the benefit of current and future generations. We work hard
to find new ways of doing things, because that’s what it takes to continually introduce more sustainable products to meet the ever-increasing expectations of a dynamic marketplace.
Together, product sustainability and stewardship are the keys to responsible innovation. We challenge ourselves continuously to manage both effectively and to perform better each year.
STRATEGY & APPROACH
We believe that product sustainability is attribute-based. Across all three of our businesses, we seek to implement continuous and measurable improvements:
• Saving energy and water;
• Using salvaged, recycled, or plant-based content;
• Conserving natural resources by reducing material usage, or using materials that are exceptionally durable, low maintenance, or renewable;
• Reducing the risk of exposure to hazardous and harmful materials;
• Contributing to a safe, healthy indoor environment;
• Striving to make products that are reusable and recyclable at end-of-life; and
• Reducing the environmental footprint of our products.
In particular, recycled content in building materials is seen as a valued attribute in green building guidelines and certifications. It can also serve to reduce waste and save resources in our manufacturing operations. We seek to include or increase the content of recycled materials in
Owens Corning’s Goal:85% of our new products and 85% of our new applications will have net sustainability gains by 2020
Our Product Sustainability + Stewardship efforts align with the following UN SDGs:
PR OD U CT R E S P ON S I B I L ITY
Product Sustainability + Stewardship
2017 OWENS CORNING SUSTAINABILITY REPORT | PURPOSE + PEOPLE + ACTION | 50
PR OD U CT R E S P ON S I B I L ITY
Product Sustainability + Stewardship
our products and packaging either in initial design or through continuous improvement, validated by third-party verification bodies such as SCS Global Services and ICC-ES. We also offer documentation for green building programs such as LEED®, and promote the education of customers and consumers on the value of recycled content for reducing landfill waste, saving resources, and conserving energy.
We also focus on improving our education efforts and raising awareness of the urgency around addressing climate change and our efforts to continuously find new and better solutions. Through our annual Sustainability Summit and other approaches, we provide education for employees company-wide, as well as for customers and suppliers, on sustainability practices.
Building Transparency Around Environmental Impacts
As part of our 2020 goals related to product sustainability, we committed to evaluate, and be transparent about, our core products’ impacts throughout their life cycles. We have adopted the following two-part methodology to calculate and show the full cradle-to-grave environmental impacts of our core building products:
• Conduct a life cycle assessment (LCA) according to the ISO 14040, 14044, and 14025 standards, followed by an external, third-party review and verification;
• Develop an environmental product declaration (EPD) from the LCA, and implement continuous and measurable improvements related to those impacts.
Life Cycle Assessments (LCAs)
Our LCAs are comprehensive measurements of the environmental footprint of a product at all stages of its life cycle. This includes the extraction of raw material, continues through processing, manufacturing, and product use, and ends with disposal or recycling.
We have conducted full LCAs on 76% of our products, including fiberglass, mineral wool, and extruded polystyrene (XPS) foam insulation, as well as composite glass product offerings, which encompass reinforcements, non-woven mats, and technical fabrics.
In addition, we benefited from the acquisition of FOAMGLAS® manufacturer Pittsburgh Corning in 2017, which provided us with an expanded portfolio of products that were already covered by LCAs and EPDs.
Performing LCAs has identified many opportunities for improvement in our processes and products. We have also identified the high-impact raw materials, so we can work with suppliers to reduce their footprint, in turn having a positive impact on our product footprint. In 2018, we plan to update our LCAs on EcoTouch® Insulation, unbonded loosefill insulation, and FOAMULAR® XPS insulation products. We also promote and help our customers improve the sustainability of their products. We consistently provide life cycle inventory data for our products that are used to make finished goods by our customers, helping them achieve more precise LCAs and EPDs.
Owens Corning LCA practitioners are active members in the American Center for Life Cycle Assessment (ACLCA), and Owens Corning is an organizational member of ACLCA. The ACLCA is a nonprofit membership organization providing education, awareness, advocacy, and communications to build capacity and knowledge of environmental LCA.
2017 OWENS CORNING SUSTAINABILITY REPORT | PURPOSE + PEOPLE + ACTION | 51
PR OD U CT R E S P ON S I B I L ITY
Product Sustainability + Stewardship
Product Certifications & Disclosures
Owens Corning uses third-party organizations to test and certify product attributes and to disclose their environmental, health, and safety impacts. We issue Environmental Product Declarations (EPDs) for core building products, which disclose the products’ environmental impacts throughout their life cycle, in accordance with ISO 14025. We perform regular follow-up testing to maintain our certifications.
Some of our products have received the Living Product Challenge Imperative Certification, which “imagine products that function as elegantly as nature.” Our unbonded loosefill insulation, made in Mount Vernon, Ohio, and our EcoTouch® unfaced insulation, made in Santa Clara, California, both received certification in 2016. In 2017, this certification was expanded to cover all Owens Corning North America plants producing these two products.
In 2017, we launched the first formaldehyde-free Thermafiber® mineral wool insulation in North America. Formaldehyde-free Thermafiber® mineral wool insulation solutions represent a breakthrough for architects, specifiers, and contractors interested in achieving green building standards. In addition to being formaldehyde-free, the Thermafiber® solutions are manufactured to have a minimum of 70% recycled content.
This new product won BuildingGreen’s Top 10 Products for 2017. In addition, product transparency certifications were obtained, and it was added to the USDA’s BioPreferred catalog. These certifications help designers and specifiers make a more informative choice when it comes to product selection.
“The development of formaldehyde-free Thermafiber® mineral wool insulation is a great example of what’s possible when our R&D and sourcing teams work together to address sustainability issues,” said Edward Martine, research and development leader of the Owens Corning Science and Technology Center in Granville, Ohio. “We love mineral wool but not formaldehyde. Even a low amount of formaldehyde will eliminate you from some certifications. Our long-term goal is to eliminate formaldehyde from all our products.”
Owens Corning Launches First Products to Receive 'Made with 100% Wind-Powered Electricity' Certification
In 2017, Owens Corning launched the first insulation products to be certified as made with 100% wind-powered electricity and reduced embodied carbon, in accordance with SCS Global Services’ certification protocol. The SCS certification and these new certified products were made possible by the power purchase agreements Owens Corning signed in 2015, which enabled new wind capacity in Texas and Oklahoma. Both wind farms came online in late 2016 and have the potential to generate 1.1 million megawatt hours of electricity per year.
The first three types of commercial and residential insulation independently certified as made with wind-powered electricity are:
• EcoTouch® Insulation – 35% embodied carbon reduction
• Thermafiber® RainBarrier® Continuous Insulation – 20% embodied carbon reduction
• Unbonded Loosefill Insulation – 55% embodied carbon reduction
These certified insulation products give commercial architects and specifiers, builders, and even homeowners the option of lower-carbon products to build greener structures. Plus, they help architects design buildings with reduced life cycle impacts, which in turn helps them reach the recognized goals of the Architecture 2030 Challenge and U.S. Green Building Council’s LEED® certification.
S USTAI NAB I LITY I N ACTION
2017 OWENS CORNING SUSTAINABILITY REPORT | PURPOSE + PEOPLE + ACTION | 52
PR OD U CT R E S P ON S I B I L ITY
Product Sustainability + Stewardship
In 2017, several Thermafiber® mineral wool insulation products and their supporting design and installation services earned SAFETY Act Designation, retroactive to January 1, 2006, from the U.S. Department of Homeland Security. Use of these products and services provides building owners and professionals with liability protection in the event of an act of terrorism on their structure.
The purpose of the Support Anti-Terrorism by Fostering Effective Technologies Act, enacted in 2002, is to ensure that the threat of liability doesn’t prevent companies from developing and commercializing products that could save lives in the event of an act of terrorism. It restricts liability where qualified anti-terrorism technologies, or QATTs, have been used.
“Owens Corning is the first insulation manufacturer to be listed publicly with the Department of Homeland Security as having qualified technology carrying the SAFETY Act designation,” said Julian Francis, president, Insulation business. “This recognition and its powerful liability protection provide a strong and unique benefit to our customers, building owners, and the architects and contractors who design and build high-rise buildings.”
Owens Corning® Mineral Wool Insulation Earns SAFETY Act Designation
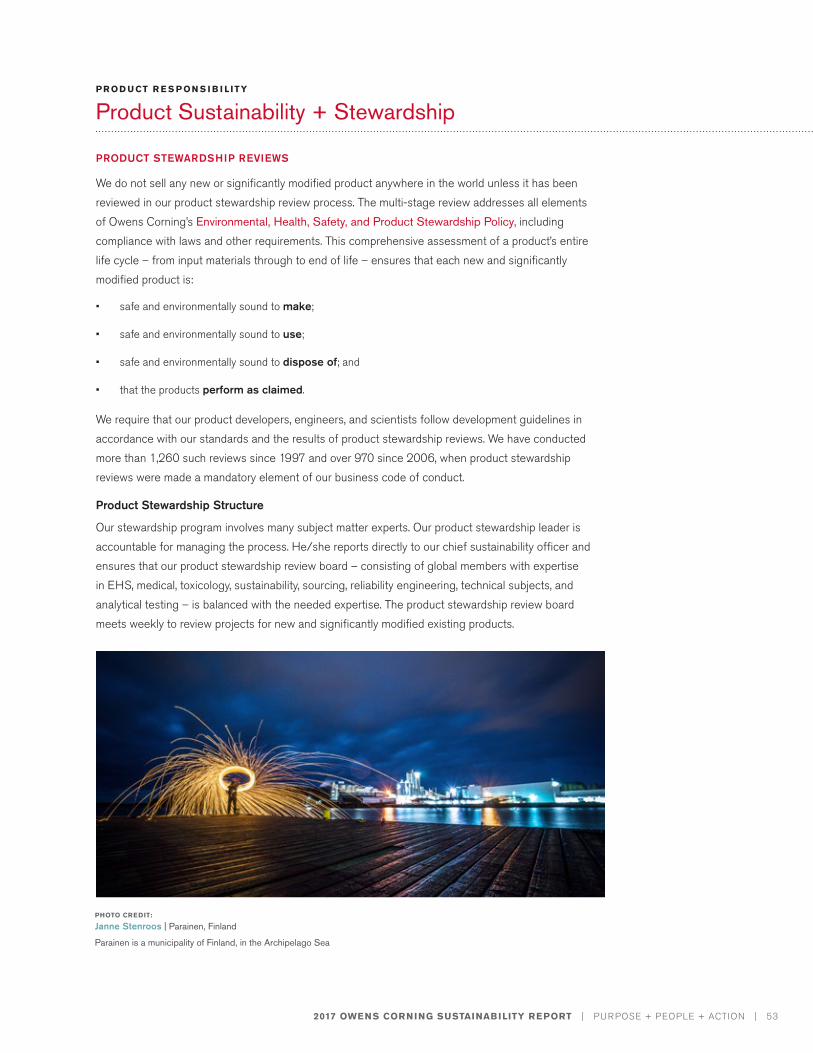
2017 OWENS CORNING SUSTAINABILITY REPORT | PURPOSE + PEOPLE + ACTION | 53
PR OD U CT R E S P ON S I B I L ITY
Product Sustainability + Stewardship
PRODUCT STEWARDSHIP REVIEWS
We do not sell any new or significantly modified product anywhere in the world unless it has been reviewed in our product stewardship review process. The multi-stage review addresses all elements of Owens Corning’s Environmental, Health, Safety, and Product Stewardship Policy, including compliance with laws and other requirements. This comprehensive assessment of a product’s entire life cycle – from input materials through to end of life – ensures that each new and significantly modified product is:
• safe and environmentally sound to make;
• safe and environmentally sound to use;
• safe and environmentally sound to dispose of; and
• that the products perform as claimed.
We require that our product developers, engineers, and scientists follow development guidelines in accordance with our standards and the results of product stewardship reviews. We have conducted more than 1,260 such reviews since 1997 and over 970 since 2006, when product stewardship reviews were made a mandatory element of our business code of conduct.
Product Stewardship Structure
Our stewardship program involves many subject matter experts. Our product stewardship leader is accountable for managing the process. He/she reports directly to our chief sustainability officer and ensures that our product stewardship review board – consisting of global members with expertise in EHS, medical, toxicology, sustainability, sourcing, reliability engineering, technical subjects, and analytical testing – is balanced with the needed expertise. The product stewardship review board meets weekly to review projects for new and significantly modified existing products.
PHOTO CREDIT:
Janne Stenroos | Parainen, Finland
Parainen is a municipality of Finland, in the Archipelago Sea
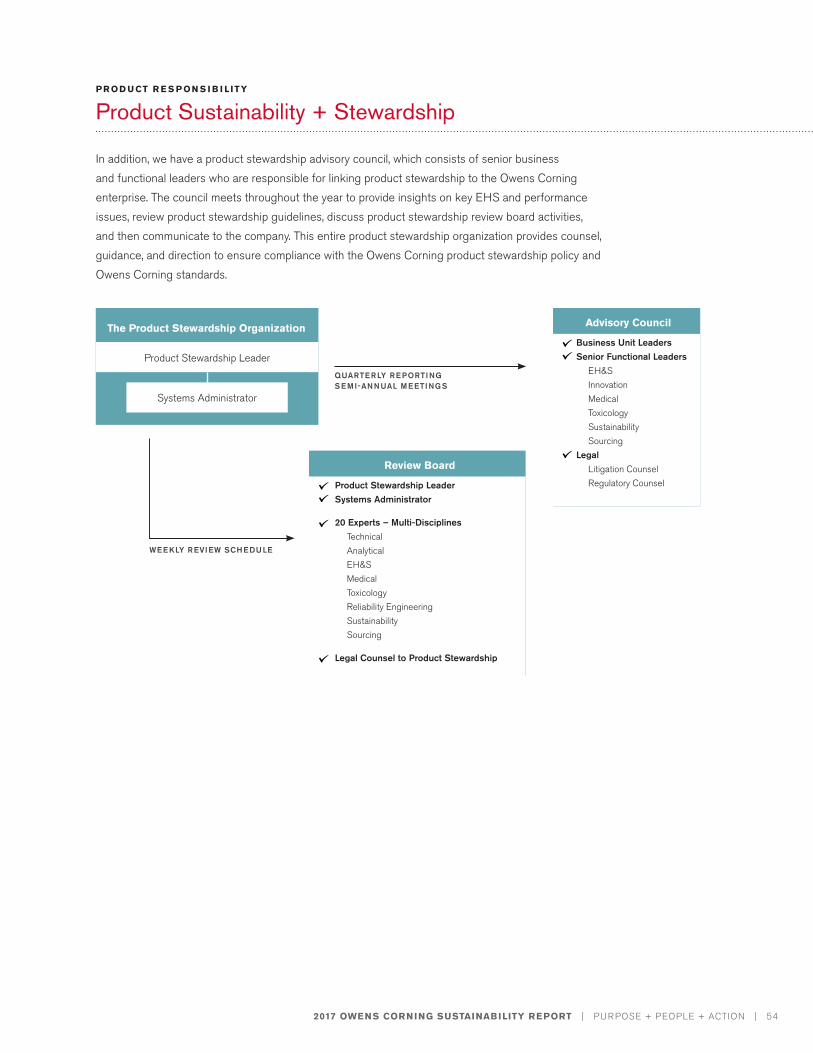
2017 OWENS CORNING SUSTAINABILITY REPORT | PURPOSE + PEOPLE + ACTION | 54
PR OD U CT R E S P ON S I B I L ITY
Product Sustainability + Stewardship
In addition, we have a product stewardship advisory council, which consists of senior business and functional leaders who are responsible for linking product stewardship to the Owens Corning enterprise. The council meets throughout the year to provide insights on key EHS and performance issues, review product stewardship guidelines, discuss product stewardship review board activities, and then communicate to the company. This entire product stewardship organization provides counsel, guidance, and direction to ensure compliance with the Owens Corning product stewardship policy and Owens Corning standards.
The Product Stewardship Organization
Product Stewardship Leader
Systems Administrator
Advisory Council
Business Unit LeadersSenior Functional Leaders
EH&SInnovationMedicalToxicologySustainabilitySourcing
LegalLitigation CounselRegulatory Counsel
Review Board
Product Stewardship LeaderSystems Administrator
20 Experts – Multi-DisciplinesTechnicalAnalyticalEH&SMedicalToxicologyReliability EngineeringSustainabilitySourcing
Legal Counsel to Product Stewardship
WEEKLY REVIEW SCHEDULE
QUARTERLY REPORTINGSEMI-ANNUAL MEETINGS
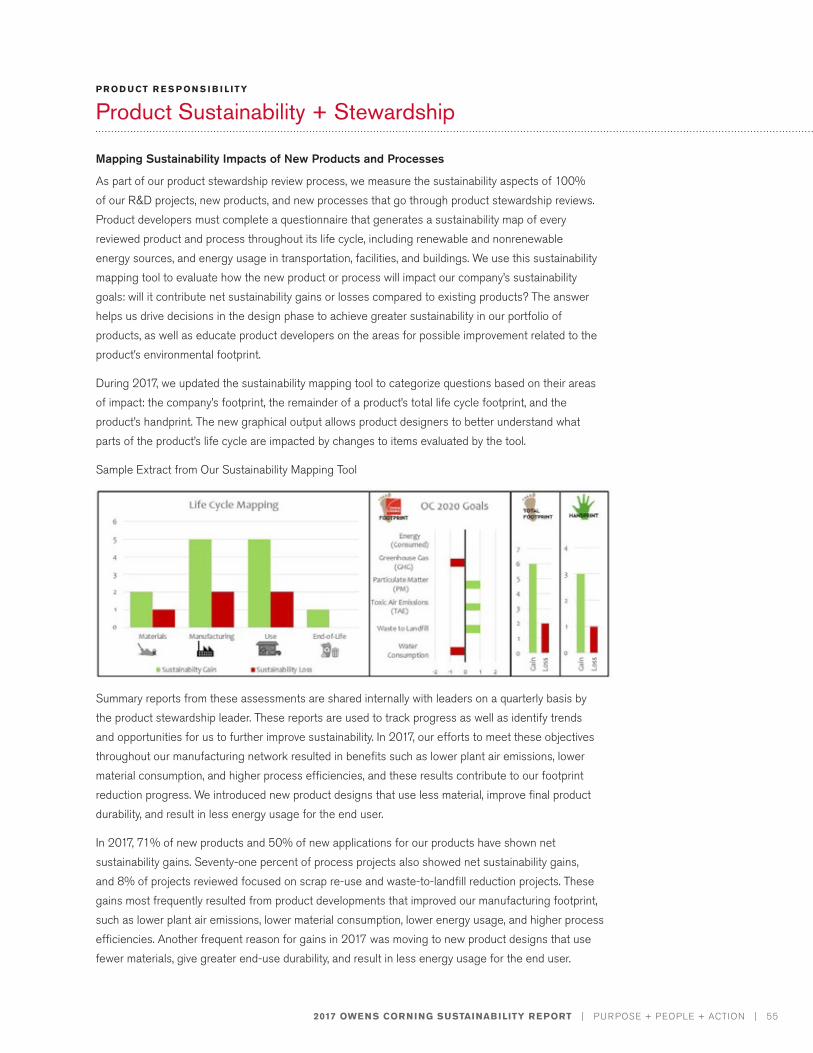
2017 OWENS CORNING SUSTAINABILITY REPORT | PURPOSE + PEOPLE + ACTION | 55
PR OD U CT R E S P ON S I B I L ITY
Product Sustainability + Stewardship
Mapping Sustainability Impacts of New Products and Processes
As part of our product stewardship review process, we measure the sustainability aspects of 100% of our R&D projects, new products, and new processes that go through product stewardship reviews. Product developers must complete a questionnaire that generates a sustainability map of every reviewed product and process throughout its life cycle, including renewable and nonrenewable energy sources, and energy usage in transportation, facilities, and buildings. We use this sustainability mapping tool to evaluate how the new product or process will impact our company’s sustainability goals: will it contribute net sustainability gains or losses compared to existing products? The answer helps us drive decisions in the design phase to achieve greater sustainability in our portfolio of products, as well as educate product developers on the areas for possible improvement related to the product’s environmental footprint.
During 2017, we updated the sustainability mapping tool to categorize questions based on their areas of impact: the company’s footprint, the remainder of a product’s total life cycle footprint, and the product’s handprint. The new graphical output allows product designers to better understand what parts of the product’s life cycle are impacted by changes to items evaluated by the tool.
Sample Extract from Our Sustainability Mapping Tool
Summary reports from these assessments are shared internally with leaders on a quarterly basis by the product stewardship leader. These reports are used to track progress as well as identify trends and opportunities for us to further improve sustainability. In 2017, our efforts to meet these objectives throughout our manufacturing network resulted in benefits such as lower plant air emissions, lower material consumption, and higher process efficiencies, and these results contribute to our footprint reduction progress. We introduced new product designs that use less material, improve final product durability, and result in less energy usage for the end user.
In 2017, 71% of new products and 50% of new applications for our products have shown net sustainability gains. Seventy-one percent of process projects also showed net sustainability gains, and 8% of projects reviewed focused on scrap re-use and waste-to-landfill reduction projects. These gains most frequently resulted from product developments that improved our manufacturing footprint, such as lower plant air emissions, lower material consumption, lower energy usage, and higher process efficiencies. Another frequent reason for gains in 2017 was moving to new product designs that use fewer materials, give greater end-use durability, and result in less energy usage for the end user.
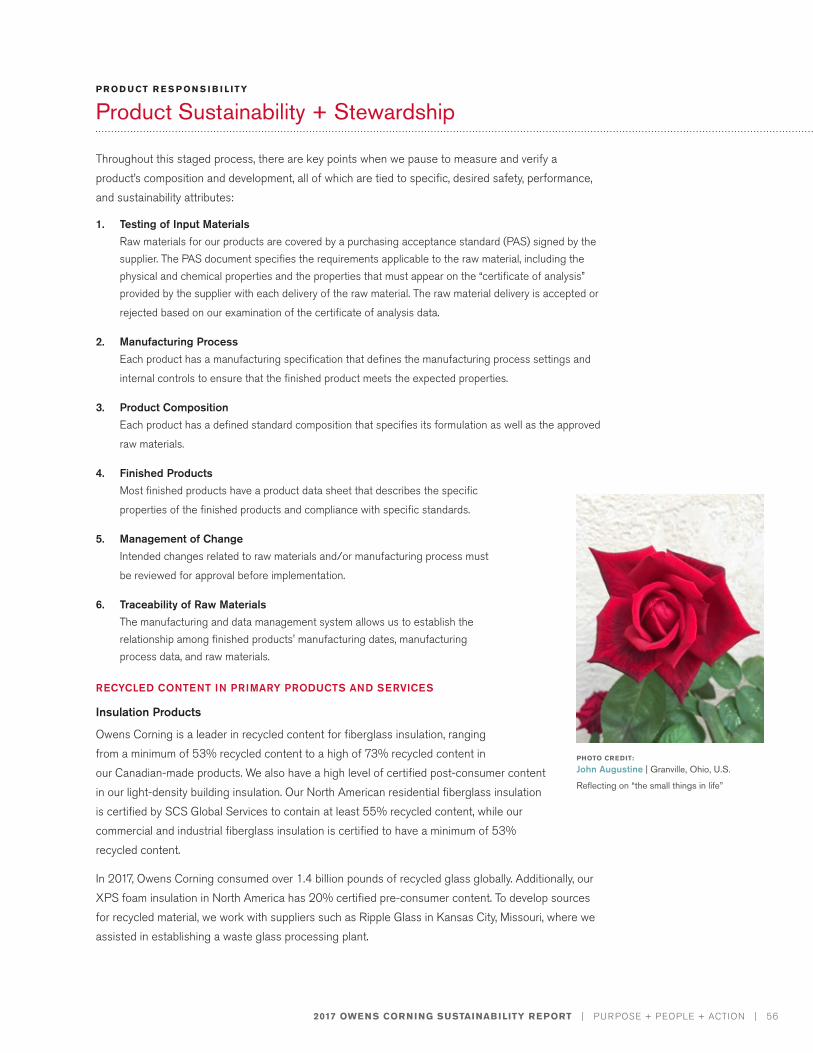
2017 OWENS CORNING SUSTAINABILITY REPORT | PURPOSE + PEOPLE + ACTION | 56
PR OD U CT R E S P ON S I B I L ITY
Product Sustainability + Stewardship
Throughout this staged process, there are key points when we pause to measure and verify a product’s composition and development, all of which are tied to specific, desired safety, performance, and sustainability attributes:
1. Testing of Input Materials Raw materials for our products are covered by a purchasing acceptance standard (PAS) signed by the supplier. The PAS document specifies the requirements applicable to the raw material, including the physical and chemical properties and the properties that must appear on the “certificate of analysis” provided by the supplier with each delivery of the raw material. The raw material delivery is accepted or
rejected based on our examination of the certificate of analysis data.
2. Manufacturing Process Each product has a manufacturing specification that defines the manufacturing process settings and
internal controls to ensure that the finished product meets the expected properties.
3. Product CompositionEach product has a defined standard composition that specifies its formulation as well as the approved
raw materials.
4. Finished ProductsMost finished products have a product data sheet that describes the specific
properties of the finished products and compliance with specific standards.
5. Management of ChangeIntended changes related to raw materials and/or manufacturing process must
be reviewed for approval before implementation.
6. Traceability of Raw MaterialsThe manufacturing and data management system allows us to establish the relationship among finished products' manufacturing dates, manufacturing process data, and raw materials.
RECYCLED CONTENT IN PRIMARY PRODUCTS AND SERVICES
Insulation Products
Owens Corning is a leader in recycled content for fiberglass insulation, ranging from a minimum of 53% recycled content to a high of 73% recycled content in our Canadian-made products. We also have a high level of certified post-consumer content in our light-density building insulation. Our North American residential fiberglass insulation is certified by SCS Global Services to contain at least 55% recycled content, while our commercial and industrial fiberglass insulation is certified to have a minimum of 53% recycled content.
In 2017, Owens Corning consumed over 1.4 billion pounds of recycled glass globally. Additionally, our XPS foam insulation in North America has 20% certified pre-consumer content. To develop sources for recycled material, we work with suppliers such as Ripple Glass in Kansas City, Missouri, where we assisted in establishing a waste glass processing plant.
PHOTO CREDIT:
John Augustine | Granville, Ohio, U.S.
Reflecting on “the small things in life”
2017 OWENS CORNING SUSTAINABILITY REPORT | PURPOSE + PEOPLE + ACTION | 57
PR OD U CT R E S P ON S I B I L ITY
Product Sustainability + Stewardship
In addition, our Thermafiber® mineral wool insulation is manufactured to have a minimum of 70% recycled content and is validated by ICC-ES.
Glass Recycling
We are one of the largest users of recycled glass in the world, using over 1 billion pounds annually of curbside consumer containers and pre-consumer recycled glass for our insulation business. Using recycled glass not only decreases community landfill waste, but also lowers our energy use associated with manufacturing insulation, because starting with raw materials such as sand requires more energy.
Although we strive for higher recycled-glass content in our insulation products, we realize that the supply of recycled glass is at risk. According to the U.S. Environmental Protection Agency and reported by the Glass Packaging Institute, only approximately 33% of all glass containers were recycled in 2014 (the last year for which such data have been published). In addition, numerous municipalities across the U.S. have removed glass from their curbside recycling programs, further threatening future cullet supply.
To help counteract these trends, Owens Corning works actively with other companies and organizations to support the glass recycling industry and the entire glass recycling supply chain. The Glass Recycling Coalition (GRC) and the North American Insulation Manufacturers Association (NAIMA) are two of our key partners. Through GRC, we are particularly focused on promoting glass recycling in Baltimore/Washington, D.C., the Carolinas, Florida, New York City, and Tennessee.
We also helped form a glass cullet task force, with the objectives of: (1) improving communication on end use of glass containers to make fiberglass, (2) increasing glass container recycling rates, (3) improving glass cullet quality, and (4) protecting current recycling programs at the state and local levels. In addition, Owens Corning participates in several educational and informational workshops, including those by the Closed Loop Fund and recycled glass processor Strategic Materials, to promote open dialogue and collaboration among stakeholders interested in glass recycling.
As a result of our efforts, and despite ongoing challenges in a number of communities across the U.S., we continue to increase our use of post-consumer bottle glass in North America. We believe the availability of high-quality recyclable glass is critical to the ongoing execution of our growth strategy. For more information on glass recycling, visit www.glassrecycles.org.
Strategic Partnership Yields 1 Billion Recycled Bottles
In the spring of 2017, Ripple Glass announced that 1 billion bottles have been recycled since Ripple began operations in 2009. Owens Corning’s Kansas City insulation plant is a significant recipient of the glass being recycled through Ripple’s operation, and according to Ripple, recycling 1 billion bottles saves enough electricity to power every home in the Kansas City area for 18 days.
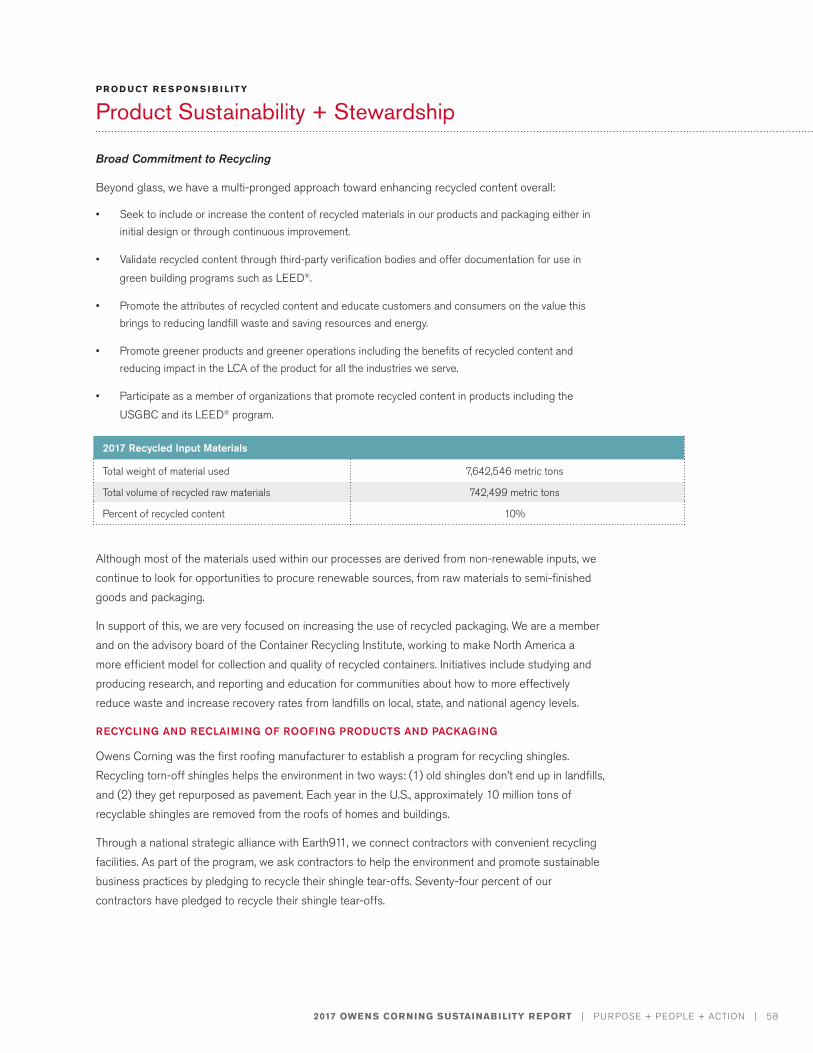
2017 OWENS CORNING SUSTAINABILITY REPORT | PURPOSE + PEOPLE + ACTION | 58
PR OD U CT R E S P ON S I B I L ITY
Product Sustainability + Stewardship
Broad Commitment to Recycling
Beyond glass, we have a multi-pronged approach toward enhancing recycled content overall:
• Seek to include or increase the content of recycled materials in our products and packaging either in initial design or through continuous improvement.
• Validate recycled content through third-party verification bodies and offer documentation for use in
green building programs such as LEED®.
• Promote the attributes of recycled content and educate customers and consumers on the value this brings to reducing landfill waste and saving resources and energy.
• Promote greener products and greener operations including the benefits of recycled content and reducing impact in the LCA of the product for all the industries we serve.
• Participate as a member of organizations that promote recycled content in products including the
USGBC and its LEED® program.
Although most of the materials used within our processes are derived from non-renewable inputs, we continue to look for opportunities to procure renewable sources, from raw materials to semi-finished goods and packaging.
In support of this, we are very focused on increasing the use of recycled packaging. We are a member and on the advisory board of the Container Recycling Institute, working to make North America a more efficient model for collection and quality of recycled containers. Initiatives include studying and producing research, and reporting and education for communities about how to more effectively reduce waste and increase recovery rates from landfills on local, state, and national agency levels.
RECYCLING AND RECLAIMING OF ROOFING PRODUCTS AND PACKAGING
Owens Corning was the first roofing manufacturer to establish a program for recycling shingles. Recycling torn-off shingles helps the environment in two ways: (1) old shingles don’t end up in landfills, and (2) they get repurposed as pavement. Each year in the U.S., approximately 10 million tons of recyclable shingles are removed from the roofs of homes and buildings.
Through a national strategic alliance with Earth911, we connect contractors with convenient recycling facilities. As part of the program, we ask contractors to help the environment and promote sustainable business practices by pledging to recycle their shingle tear-offs. Seventy-four percent of our contractors have pledged to recycle their shingle tear-offs.
2017 Recycled Input Materials
Total weight of material used 7,642,546 metric tons
Total volume of recycled raw materials 742,499 metric tons
Percent of recycled content 10%
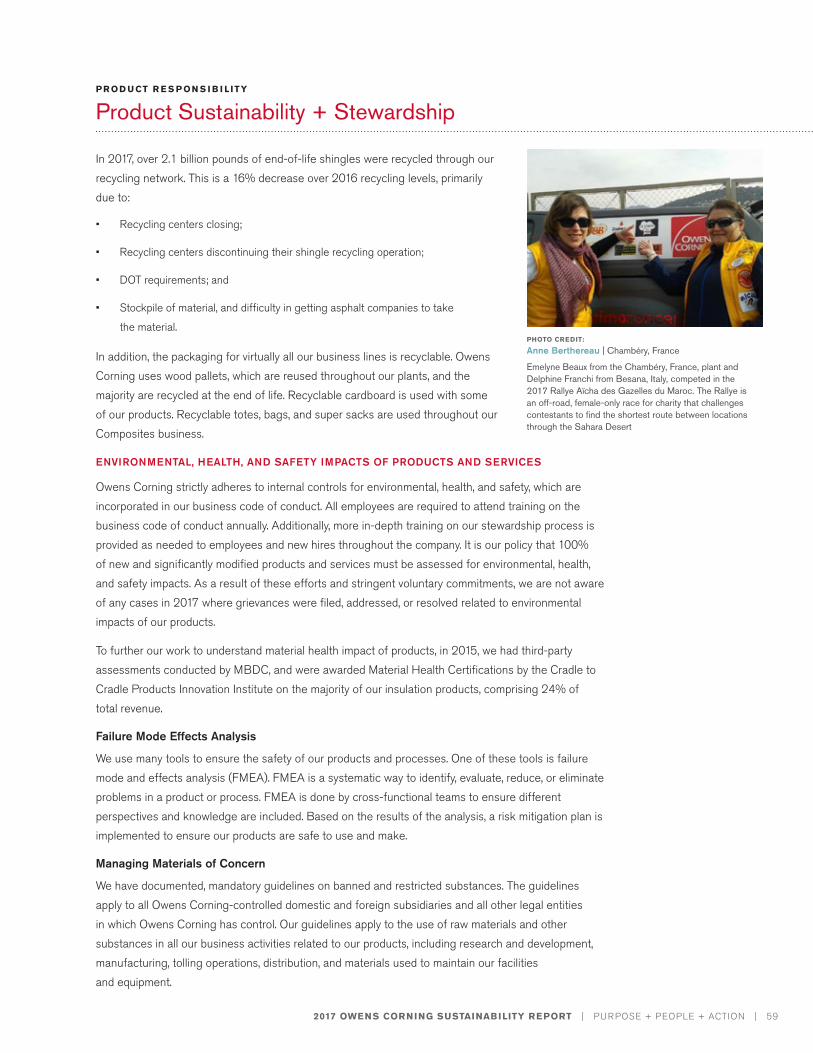
2017 OWENS CORNING SUSTAINABILITY REPORT | PURPOSE + PEOPLE + ACTION | 59
PR OD U CT R E S P ON S I B I L ITY
Product Sustainability + Stewardship
In 2017, over 2.1 billion pounds of end-of-life shingles were recycled through our recycling network. This is a 16% decrease over 2016 recycling levels, primarily due to:
• Recycling centers closing;
• Recycling centers discontinuing their shingle recycling operation;
• DOT requirements; and
• Stockpile of material, and difficulty in getting asphalt companies to take
the material.
In addition, the packaging for virtually all our business lines is recyclable. Owens Corning uses wood pallets, which are reused throughout our plants, and the majority are recycled at the end of life. Recyclable cardboard is used with some of our products. Recyclable totes, bags, and super sacks are used throughout our Composites business.
ENVIRONMENTAL, HEALTH, AND SAFETY IMPACTS OF PRODUCTS AND SERVICES
Owens Corning strictly adheres to internal controls for environmental, health, and safety, which are incorporated in our business code of conduct. All employees are required to attend training on the business code of conduct annually. Additionally, more in-depth training on our stewardship process is provided as needed to employees and new hires throughout the company. It is our policy that 100% of new and significantly modified products and services must be assessed for environmental, health, and safety impacts. As a result of these efforts and stringent voluntary commitments, we are not aware of any cases in 2017 where grievances were filed, addressed, or resolved related to environmental impacts of our products.
To further our work to understand material health impact of products, in 2015, we had third-party assessments conducted by MBDC, and were awarded Material Health Certifications by the Cradle to Cradle Products Innovation Institute on the majority of our insulation products, comprising 24% of total revenue.
Failure Mode Effects Analysis
We use many tools to ensure the safety of our products and processes. One of these tools is failure mode and effects analysis (FMEA). FMEA is a systematic way to identify, evaluate, reduce, or eliminate problems in a product or process. FMEA is done by cross-functional teams to ensure different perspectives and knowledge are included. Based on the results of the analysis, a risk mitigation plan is implemented to ensure our products are safe to use and make.
Managing Materials of Concern
We have documented, mandatory guidelines on banned and restricted substances. The guidelines apply to all Owens Corning-controlled domestic and foreign subsidiaries and all other legal entities in which Owens Corning has control. Our guidelines apply to the use of raw materials and other substances in all our business activities related to our products, including research and development, manufacturing, tolling operations, distribution, and materials used to maintain our facilities and equipment.
PHOTO CREDIT:
Anne Berthereau | Chambéry, France
Emelyne Beaux from the Chambéry, France, plant and Delphine Franchi from Besana, Italy, competed in the 2017 Rallye Aïcha des Gazelles du Maroc. The Rallye is an off-road, female-only race for charity that challenges contestants to find the shortest route between locations through the Sahara Desert
2017 OWENS CORNING SUSTAINABILITY REPORT | PURPOSE + PEOPLE + ACTION | 60
PR OD U CT R E S P ON S I B I L ITY
Product Sustainability + Stewardship
The guidelines are designed to control the use of chemicals, polymers, and other materials; to ensure compliance with laws and regulations in places where we sell our products; to avoid using materials that cannot be processed safely on our equipment; and to avoid using materials that are otherwise a concern. Some of our products contain ingredients that have been banned in some regions, usually on a timeline for discontinuance. Though we use comprehensive risk assessments to ensure all our products can be used without harm to people and the environment, we put into action an optimization plan whenever we learn of an ingredient ban or discontinuance requirement. Based on the optimization plan, we address the applicable product line and enable research and development to address material substitution.
Owens Corning also sells products that may contain ingredients that are the subject of stakeholder questions or which are prohibited by certain green building programs. Through our product sustainability team, optimization programs are developed.
Product and Service Information and Labeling
In accordance with our environmental, health, safety, and product stewardship policy, we provide information about all our products, their performance, and safe use.
Safe use of the product or service is required to be labeled. Product content information is included in fiberglass insulation product labeling and is included in EPDs. Component content and disposal information is included on MSDS, SDS, or safe use instruction sheets (SUIS).
We have conducted full cradle-to-grave LCAs and have issued EPDs on the following products: EcoTouch® Unfaced Fiberglas™ insulation; EcoTouch® Kraft-Faced Fiberglas™ insulation; unbonded loosefill; FOAMULAR® XPS insulation; EcoTouch® Foil-Faced Fiberglas™ insulation; EcoTouch® Flame Spread 25 insulation; Thermafiber® mineral wool insulation; Owens Corning™ asphalt shingles; Fiberglas™ pipe insulation; 700 Series Fiberglas™ Insulation; QuietR® duct board; EcoTouch® insulation for flexible duct; SOFTR® duct wrap; and EcoTouch® insulation for metal building. These products accounted for approximately 51% of 2017 revenues.
Prior to packaging being used in the marketplace, there is a thorough review by technical services, the law department, and each business unit to ensure compliance with all regulations and codes. Owens Corning had no significant incidents of noncompliance with regulations or voluntary codes concerning labeling of our products and material services in 2017.
Glass Fiber Safety
There is extensive research showing that Owens Corning glass and mineral wool fibers are safe to manufacture and use when recommended work practices are followed. Among the most recent developments supporting the safety of Owens Corning insulation glass wool products is the decision by the U.S. National Toxicology Program (NTP) to remove soluble glass wool fibers from its list of substances “reasonably anticipated to be a human carcinogen.” Its decision was released June 10, 2012, in its report to the U.S. Congress titled the 12th Report on Carcinogens. On November 18, 2011, soluble glass fibers were removed from the California Prop 65 list. Owens Corning mineral wool products were never listed by NTP or Prop 65. We perform regular composition audits to ensure the fibrous insulation products produced in our plants have the correct composition and are biosoluble. All composite glass is nonrespirable.
2017 OWENS CORNING SUSTAINABILITY REPORT | PURPOSE + PEOPLE + ACTION | 61
PR OD U CT R E S P ON S I B I L ITY
Product Sustainability + Stewardship
Owens Corning also has an internal product stewardship guideline on fibrous materials usage that states the company will not knowingly manufacture or use any fiber or fiber-containing material unless the fibers are shown to be nonrespirable or biosoluble, or unless use of the material generates insignificant exposure as shown by measurements in the manufacturing and end-use environments. Compliance with this guideline is verified during product stewardship reviews.
The safety of insulation wool fibers was first questioned in the 1980s when both glass and mineral wool insulation fibers were added to the International Agency for Research on Cancer’s list of possible carcinogens, following animal studies using an unusual, invasive exposure procedure never encountered in the normal use of insulation. However, the organization removed both glass and mineral wool fibers from its list of possible carcinogens in 2001.
Owens Corning continues to promote public understanding of insulation wool safety, and in 2016 re-launched its website, which makes inhalation studies, peer-reviewed scientific papers, animations, and a dissolution rate calculator available free online at fiberscience.owenscorning.com.
PHOTO CREDIT:
Nathalie Neyroz | Chambéry, France
“One flower, two bugs” during a walk to Mont Jovet (2,558 meters high, in the French Alps)
PHOTO CREDIT:
Owens Corning
An Owens Corning volunteer helps a student plant a tree during the 2017 Employee Day of Caring at Chase Elementary School in Toledo, Ohio
3Environmental ResponsibilityCLIMATE CHANGE
ENERGY
EMISSIONS
WATER
WASTE
PROTECTING B IODIVERSITY
ENVIRONMENTAL CONTROL
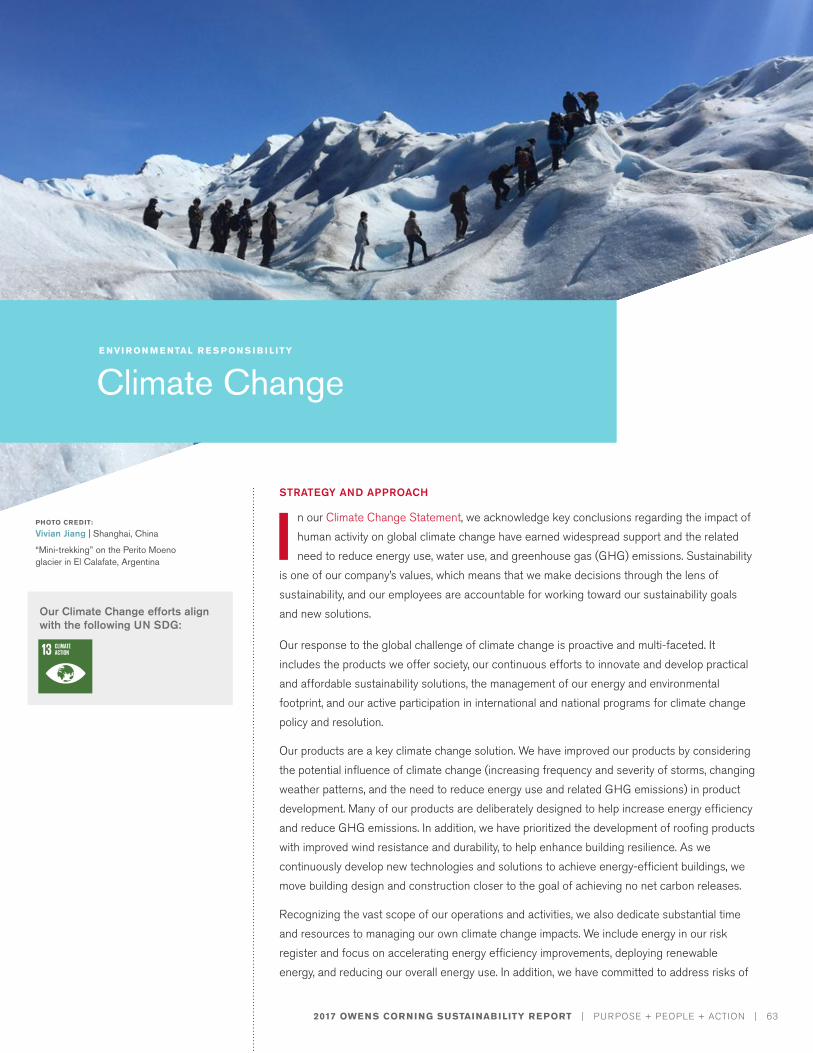
2017 OWENS CORNING SUSTAINABILITY REPORT | PURPOSE + PEOPLE + ACTION | 63
PHOTO CREDIT:
Vivian Jiang | Shanghai, China
“Mini-trekking” on the Perito Moeno glacier in El Calafate, Argentina
STRATEGY AND APPROACH
I n our Climate Change Statement, we acknowledge key conclusions regarding the impact of human activity on global climate change have earned widespread support and the related need to reduce energy use, water use, and greenhouse gas (GHG) emissions. Sustainability
is one of our company’s values, which means that we make decisions through the lens of sustainability, and our employees are accountable for working toward our sustainability goals and new solutions.
Our response to the global challenge of climate change is proactive and multi-faceted. It includes the products we offer society, our continuous efforts to innovate and develop practical and affordable sustainability solutions, the management of our energy and environmental footprint, and our active participation in international and national programs for climate change policy and resolution.
Our products are a key climate change solution. We have improved our products by considering the potential influence of climate change (increasing frequency and severity of storms, changing weather patterns, and the need to reduce energy use and related GHG emissions) in product development. Many of our products are deliberately designed to help increase energy efficiency and reduce GHG emissions. In addition, we have prioritized the development of roofing products with improved wind resistance and durability, to help enhance building resilience. As we continuously develop new technologies and solutions to achieve energy-efficient buildings, we move building design and construction closer to the goal of achieving no net carbon releases.
Recognizing the vast scope of our operations and activities, we also dedicate substantial time and resources to managing our own climate change impacts. We include energy in our risk register and focus on accelerating energy efficiency improvements, deploying renewable energy, and reducing our overall energy use. In addition, we have committed to address risks of
E NVI R ON M E NTAL R E S P ON S I B I L ITY
Climate Change
Our Climate Change efforts align with the following UN SDG:
2017 OWENS CORNING SUSTAINABILITY REPORT | PURPOSE + PEOPLE + ACTION | 64
E NVI R ON M E NTAL R E S P ON S I B I L ITY
Climate Change
water shortages and perform life cycle assessments (LCA) to continue to reduce our footprint and develop our handprint.
Renewable energy is a strategic focus of ours. We actively look for opportunities to expand our portfolio and have designated a cross-functional team of internal and external resources to thoroughly evaluate all potential opportunities – both boutique onsite renewable programs and large offsite installations.
Our company also focuses on reducing GHG emissions related to our operations and activities. Our GHG reduction goal (see Emissions) is informed by science-based methodologies that are designed to reduce carbon emissions enough to limit global warming to less than 2° C above pre-industrial levels, which is consistent with the Paris Agreement.
Several aspects of our long-term strategy are also influenced by climate change. For example, we have moved from a mindset of one to three years of power supply to 15 to 20 years of access to renewable energy in a cost-effective manner. We include offsite renewable programs in our energy analysis and portfolio, and impending water shortages in water-stressed areas are now part of our evaluation of suppliers and customers. In addition, our R&D portfolio is guided by our sustainability mapping tool and our focus on ultimately becoming a net positive company.
2017 RENEWABLE ENERGY HIGHLIGHTS
Over the past several years, while investigating opportunities to expand our renewable energy portfolio, we realized that to succeed, we would need to support the development of large renewable energy projects through long-term power purchase agreements. Therefore, we have diligently pursued contracts with renewable energy developers, like wind developers, to supply our renewable energy needs and support the growth of wind power.
In 2015, Owens Corning signed two agreements for a total of 250 megawatts of new wind capacity to be developed in Texas and Oklahoma. Both wind farms came online in late 2016 and can generate 1.1 million MWh of electricity per year. For every MWh of renewable electricity generated, the company receives one renewable energy credit (REC). It then applies the RECs toward the manufacture of more sustainable products. The impact of these purchases is reflected in our 2017 GHG accounting (see Emissions).
In May 2017, Owens Corning’s Fairburn, Georgia, plant became home to an onsite renewable installation. The solar panel project produces 1 megawatt of renewable electricity to power the grid through the utility company. Pursuant to the contract, Owens Corning receives RECs (see Energy).
We are constantly seeking opportunities to further expand our renewable energy portfolio around the world.
Owens Corning’s Stance on the Paris Agreement
The U.S. decision to withdraw from the Paris Agreement does not change Owens Corning’s commitment to achieve its GHG emission reduction goals. Our emissions targets remain aligned with the Paris Agreement.
Owens Corning’s sustainability goals and dedication to the environment were established long before the December 2015 adoption of the Paris Agreement, and will continue long after the future effective date of the U.S. withdrawal from the agreement. Our 17,000 employees worldwide will continue to work hard to meet aggressive sustainability goals, including those that address climate change and climate change risks.
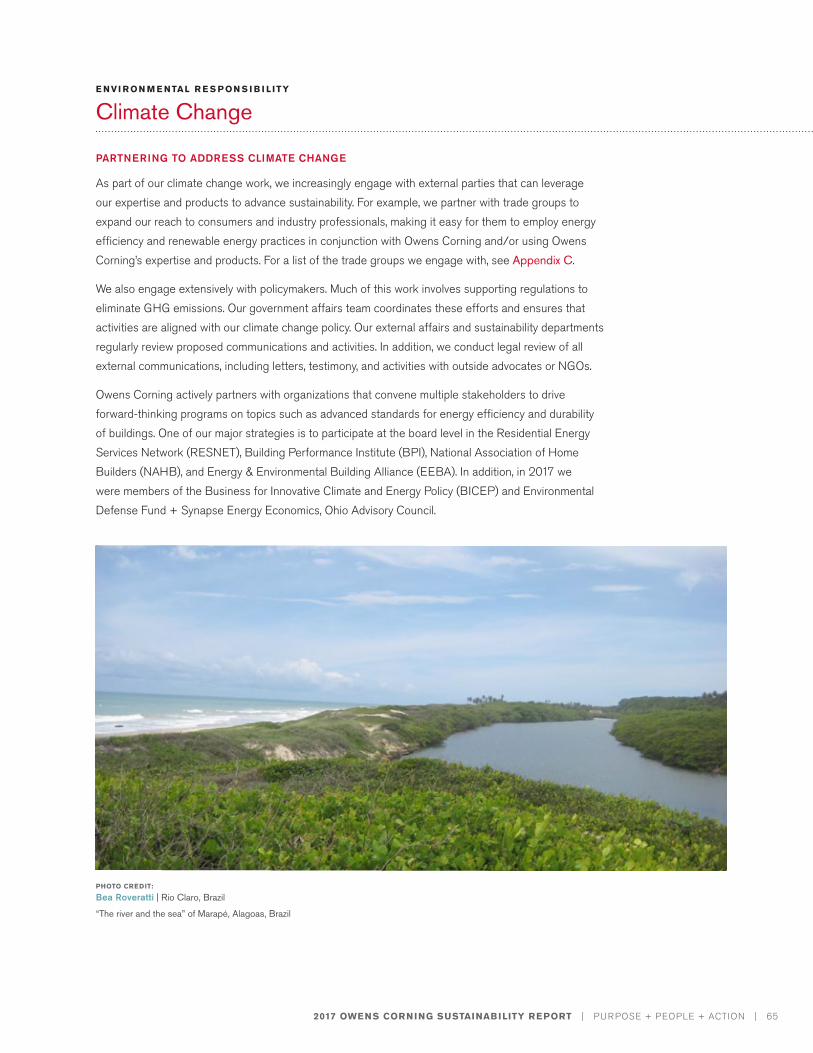
2017 OWENS CORNING SUSTAINABILITY REPORT | PURPOSE + PEOPLE + ACTION | 65
E NVI R ON M E NTAL R E S P ON S I B I L ITY
Climate Change
PARTNERING TO ADDRESS CLIMATE CHANGE
As part of our climate change work, we increasingly engage with external parties that can leverage our expertise and products to advance sustainability. For example, we partner with trade groups to expand our reach to consumers and industry professionals, making it easy for them to employ energy efficiency and renewable energy practices in conjunction with Owens Corning and/or using Owens Corning’s expertise and products. For a list of the trade groups we engage with, see Appendix C.
We also engage extensively with policymakers. Much of this work involves supporting regulations to eliminate GHG emissions. Our government affairs team coordinates these efforts and ensures that activities are aligned with our climate change policy. Our external affairs and sustainability departments regularly review proposed communications and activities. In addition, we conduct legal review of all external communications, including letters, testimony, and activities with outside advocates or NGOs.
Owens Corning actively partners with organizations that convene multiple stakeholders to drive forward-thinking programs on topics such as advanced standards for energy efficiency and durability of buildings. One of our major strategies is to participate at the board level in the Residential Energy Services Network (RESNET), Building Performance Institute (BPI), National Association of Home Builders (NAHB), and Energy & Environmental Building Alliance (EEBA). In addition, in 2017 we were members of the Business for Innovative Climate and Energy Policy (BICEP) and Environmental Defense Fund + Synapse Energy Economics, Ohio Advisory Council.
PHOTO CREDIT:
Bea Roveratti | Rio Claro, Brazil
“The river and the sea” of Marapé, Alagoas, Brazil
2017 OWENS CORNING SUSTAINABILITY REPORT | PURPOSE + PEOPLE + ACTION | 66
Owens Corning’s Goal:
PHOTO CREDIT:
Jacob Ritter | Toledo, Ohio, U.S.
Night sky in Ouray, Colorado, U.S.
Our Energy efforts align with the following UN SDGs:
Reduce primary energy intensity by 20% vs. 2010 baseline (global)
Reduce consumed energy intensity
A t Owens Corning, we are passionate about understanding the impact of our operations on the environment, such as the energy we use as a glass manufacturing company. To mitigate this impact, we follow a holistic approach to energy management.
STRATEGY AND APPROACH
Our strategy for energy management starts with our ongoing development of energy-saving products across all our business (see Product Sustainability & Stewardship for more details). We also remain dedicated to implementing energy-use reduction programs throughout our operations around the world.
We periodically review and report our performance, goals, and targets to ensure we have the necessary systems in place for tracking and monitoring our performance against our key energy-related indicators. For example, we issue a monthly energy intensity report for all plants with significant energy use, and are currently in the process of automating this effort to enable reporting of energy intensity across all our plants globally. We also disclose our environmental performance on external platforms, including this report, and assess our position relative to other companies. Public disclosure enables stakeholders to comment or provide feedback for further review and action.
Every Owens Corning facility has a designated energy leader who engages in energy management projects and activities, including identifying opportunities for further improvement and leading the implementation. In addition, each business has a full-time energy program manager or engineer to conduct assessments, facilitate kaizen activities, develop energy projects, and provide technical support. Several of our plants with medium and high energy usage also have an energy team that meets monthly.
E NVI R ON M E NTAL R E S P ON S I B I L ITY
Energy
The energy data in this chapter were independently assured to a high level by SCS Global Services. For more information or to see the verification statement, please go to page 205 in the About the Report section.
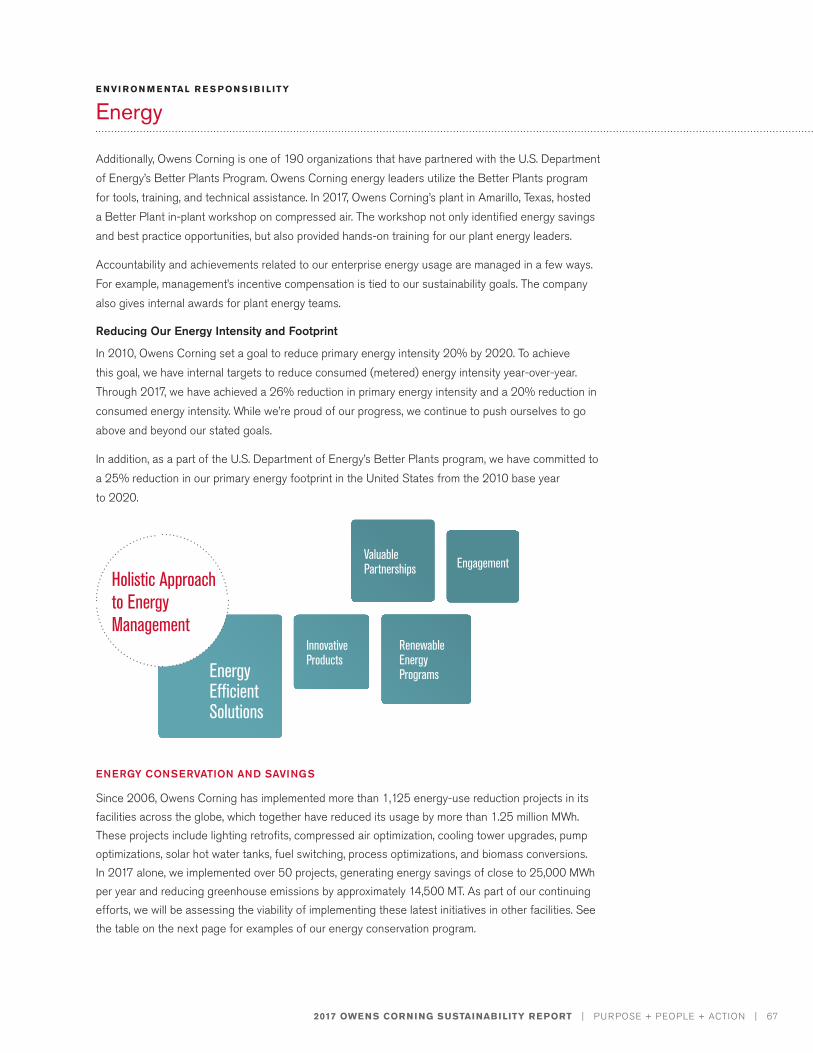
2017 OWENS CORNING SUSTAINABILITY REPORT | PURPOSE + PEOPLE + ACTION | 67
E NVI R ON M E NTAL R E S P ON S I B I L ITY
Energy
Additionally, Owens Corning is one of 190 organizations that have partnered with the U.S. Department of Energy’s Better Plants Program. Owens Corning energy leaders utilize the Better Plants program for tools, training, and technical assistance. In 2017, Owens Corning’s plant in Amarillo, Texas, hosted a Better Plant in-plant workshop on compressed air. The workshop not only identified energy savings and best practice opportunities, but also provided hands-on training for our plant energy leaders.
Accountability and achievements related to our enterprise energy usage are managed in a few ways. For example, management’s incentive compensation is tied to our sustainability goals. The company also gives internal awards for plant energy teams.
Reducing Our Energy Intensity and Footprint
In 2010, Owens Corning set a goal to reduce primary energy intensity 20% by 2020. To achieve this goal, we have internal targets to reduce consumed (metered) energy intensity year-over-year. Through 2017, we have achieved a 26% reduction in primary energy intensity and a 20% reduction in consumed energy intensity. While we’re proud of our progress, we continue to push ourselves to go above and beyond our stated goals.
In addition, as a part of the U.S. Department of Energy’s Better Plants program, we have committed to a 25% reduction in our primary energy footprint in the United States from the 2010 base year to 2020.
ENERGY CONSERVATION AND SAVINGS
Since 2006, Owens Corning has implemented more than 1,125 energy-use reduction projects in its facilities across the globe, which together have reduced its usage by more than 1.25 million MWh. These projects include lighting retrofits, compressed air optimization, cooling tower upgrades, pump optimizations, solar hot water tanks, fuel switching, process optimizations, and biomass conversions. In 2017 alone, we implemented over 50 projects, generating energy savings of close to 25,000 MWh per year and reducing greenhouse emissions by approximately 14,500 MT. As part of our continuing efforts, we will be assessing the viability of implementing these latest initiatives in other facilities. See the table on the next page for examples of our energy conservation program.
Energy Efficient Solutions
Renewable Energy Programs
EngagementValuable Partnerships
Innovative Products
Holistic Approach to Energy Management
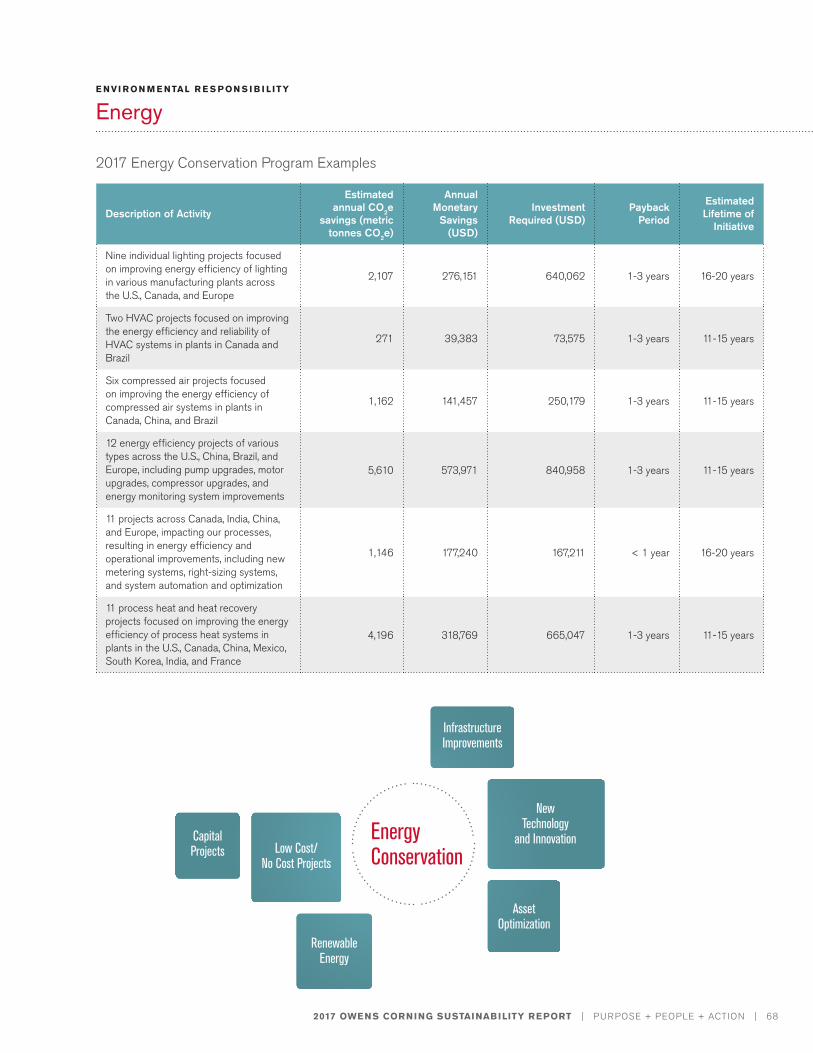
2017 OWENS CORNING SUSTAINABILITY REPORT | PURPOSE + PEOPLE + ACTION | 68
E NVI R ON M E NTAL R E S P ON S I B I L ITY
Energy
Description of Activity
Estimated annual CO2e
savings (metric tonnes CO2e)
Annual Monetary
Savings (USD)
Investment Required (USD)
Payback Period
Estimated Lifetime of
Initiative
Nine individual lighting projects focused on improving energy efficiency of lighting in various manufacturing plants across the U.S., Canada, and Europe
2,107 276,151 640,062 1-3 years 16-20 years
Two HVAC projects focused on improving the energy efficiency and reliability of HVAC systems in plants in Canada and Brazil
271 39,383 73,575 1-3 years 11-15 years
Six compressed air projects focused on improving the energy efficiency of compressed air systems in plants in Canada, China, and Brazil
1,162 141,457 250,179 1-3 years 11-15 years
12 energy efficiency projects of various types across the U.S., China, Brazil, and Europe, including pump upgrades, motor upgrades, compressor upgrades, and energy monitoring system improvements
5,610 573,971 840,958 1-3 years 11-15 years
11 projects across Canada, India, China, and Europe, impacting our processes, resulting in energy efficiency and operational improvements, including new metering systems, right-sizing systems, and system automation and optimization
1,146 177,240 167,211 < 1 year 16-20 years
11 process heat and heat recovery projects focused on improving the energy efficiency of process heat systems in plants in the U.S., Canada, China, Mexico, South Korea, India, and France
4,196 318,769 665,047 1-3 years 11-15 years
Capital Projects Low Cost/
No Cost Projects
Renewable Energy
New Technology
and Innovation
Infrastructure Improvements
Asset Optimization
EnergyConservation
2017 Energy Conservation Program Examples
S USTAI NAB I LITY I N ACTION
2017 OWENS CORNING SUSTAINABILITY REPORT | PURPOSE + PEOPLE + ACTION | 69
E NVI R ON M E NTAL R E S P ON S I B I L ITY
Energy
We recognize that manufacturing energy-intensive products heightens the need to reduce energy use, which, in turn, shrinks Owens Corning’s environmental footprint. Our employees understand this too and work hard to find innovative ways to save energy and engage utility companies and other partners. Our Guelph, Ontario, plant is an example.
For the past 10 years, the Guelph energy team has searched for ways to cut energy use. The team meets regularly with the local utility, Guelph Hydro, to discuss the plant’s operating needs, ways to reduce energy use, and the utility’s rebates and rate structure. This collaboration has paid off. When the plant’s electric demands fell in 2016, the team knew they qualified for a rate reduction, which saves approximately $1 million annually.
Being recognized by, and collaborating with, utility companies and other partners is part of the story for our plants, but internal recognition is also important. We celebrate plant employees who excel through efforts that improve operations, save money, and improve Owens Corning’s environmental performance. The Composites business runs the “Energy Team Challenge” in its plants every year. The team from the Guelph plant, in addition to teams from Taloja and Chambéry, won awards in 2017.
Energy Savings Generated by Our Dedicated Employees
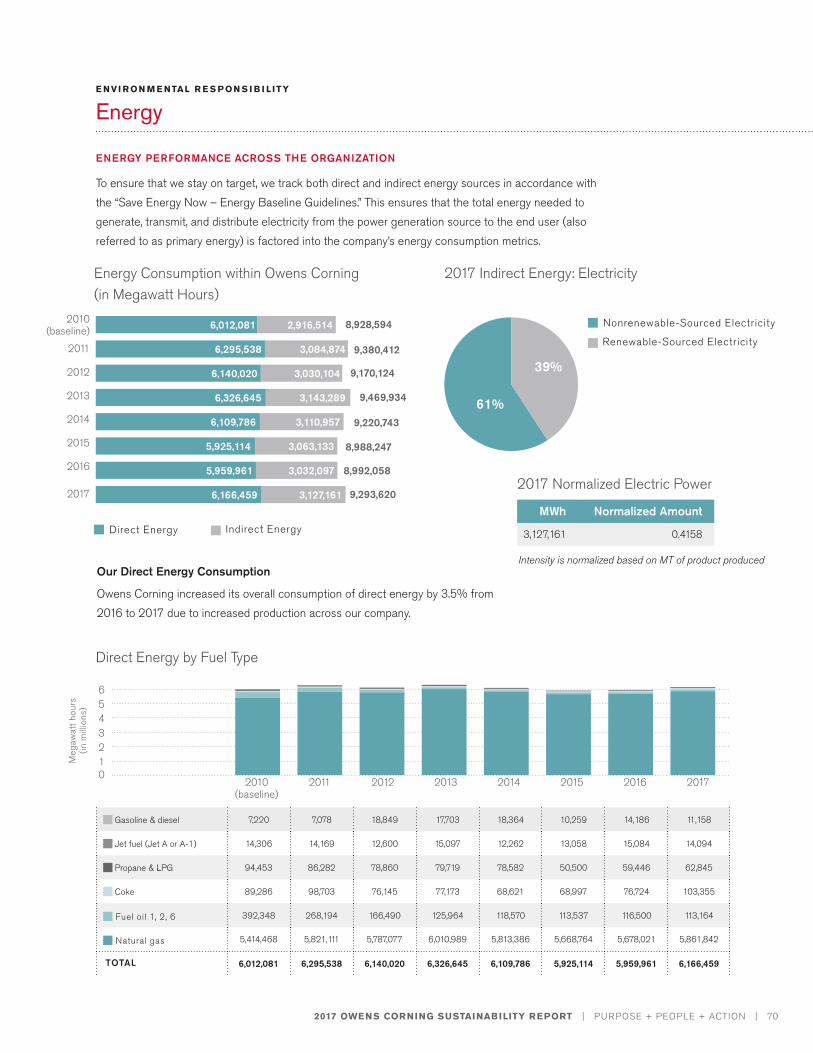
2017 OWENS CORNING SUSTAINABILITY REPORT | PURPOSE + PEOPLE + ACTION | 70
E NVI R ON M E NTAL R E S P ON S I B I L ITY
Energy
ENERGY PERFORMANCE ACROSS THE ORGANIZATION
To ensure that we stay on target, we track both direct and indirect energy sources in accordance with the “Save Energy Now – Energy Baseline Guidelines.” This ensures that the total energy needed to generate, transmit, and distribute electricity from the power generation source to the end user (also referred to as primary energy) is factored into the company’s energy consumption metrics.
Our Direct Energy Consumption
Owens Corning increased its overall consumption of direct energy by 3.5% from 2016 to 2017 due to increased production across our company.
6,012,081
6,295,538
6,140,020
6,326,645
6,109,786
5,925,114
5,959,961
6,166,459
3,063,133
3,032,097
3,127,161
3,143,289
3,110,957
3,084,874
3,030,104
2,916,5142010 (baseline)
2012
2011
2013
2014
2015
2016
2017
Energy Consumption within Owens Corning(in Megawatt Hours)
Direct Energy by Fuel Type
2017 Indirect Energy: Electricity
61%
39%
Nonrenewable-Sourced Electricity
Renewable-Sourced Electricity
Direct Energy Indirect Energy
MWh Normalized Amount
3,127,161 0.4158
Intensity is normalized based on MT of product produced
2017 Normalized Electric Power
Gasoline & diesel 7,220 7,078 18,849 17,703 18,364 10,259 14,186 11,158
Jet fuel (Jet A or A-1) 14,306 14,169 12,600 15,097 12,262 13,058 15,084 14,094
Propane & LPG 94,453 86,282 78,860 79,719 78,582 50,500 59,446 62,845
Coke 89,286 98,703 76,145 77,173 68,621 68,997 76,724 103,355
Fuel oil 1, 2, 6 392,348 268,194 166,490 125,964 118,570 113,537 116,500 113,164
Natural gas 5,414,468 5,821,111 5,787,077 6,010,989 5,813,386 5,668,764 5,678,021 5,861,842
TOTAL 6,012,081 6,295,538 6,140,020 6,326,645 6,109,786 5,925,114 5,959,961 6,166,459
0123456
Meg
awat
t hou
rs
(in m
illio
ns)
2012 2013 2014 2015 2016 20172010 (baseline)
2011
8,928,594
9,380,412
9,170,124
9,469,934
9,220,743
8,988,247
8,992,058
9,293,620
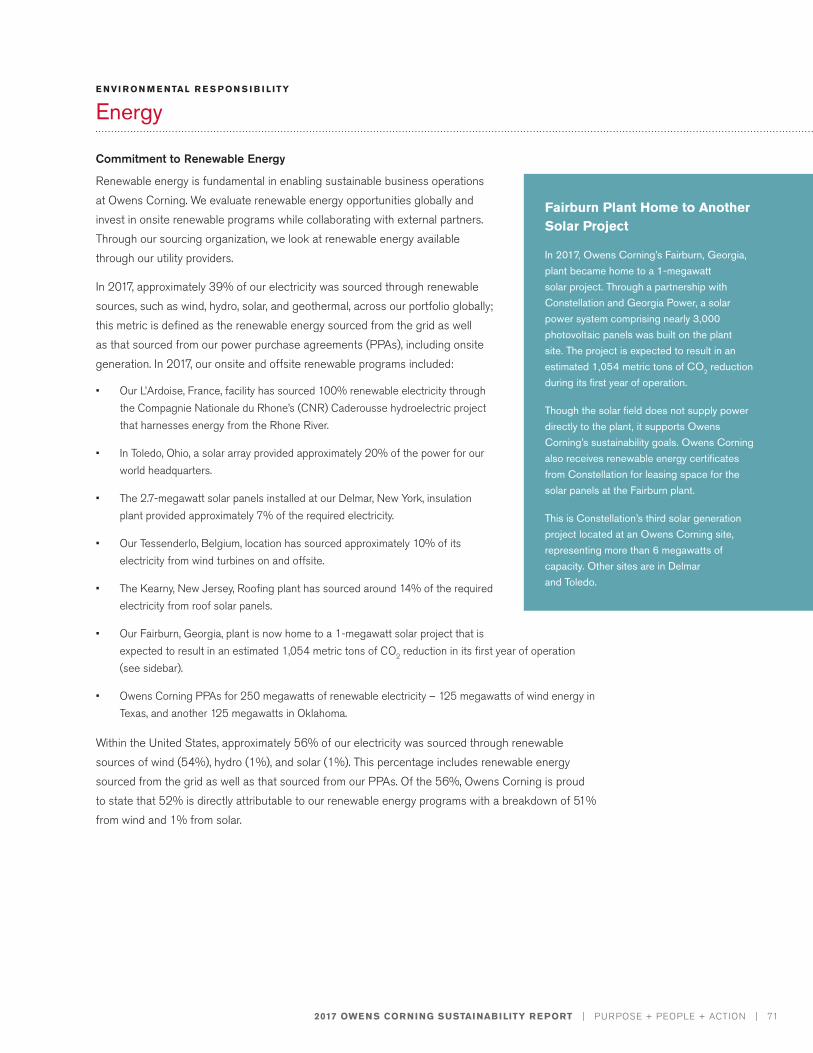
2017 OWENS CORNING SUSTAINABILITY REPORT | PURPOSE + PEOPLE + ACTION | 71
E NVI R ON M E NTAL R E S P ON S I B I L ITY
Energy
Commitment to Renewable Energy
Renewable energy is fundamental in enabling sustainable business operations at Owens Corning. We evaluate renewable energy opportunities globally and invest in onsite renewable programs while collaborating with external partners. Through our sourcing organization, we look at renewable energy available through our utility providers.
In 2017, approximately 39% of our electricity was sourced through renewable sources, such as wind, hydro, solar, and geothermal, across our portfolio globally; this metric is defined as the renewable energy sourced from the grid as well as that sourced from our power purchase agreements (PPAs), including onsite generation. In 2017, our onsite and offsite renewable programs included:
• Our L’Ardoise, France, facility has sourced 100% renewable electricity through the Compagnie Nationale du Rhone’s (CNR) Caderousse hydroelectric project that harnesses energy from the Rhone River.
• In Toledo, Ohio, a solar array provided approximately 20% of the power for our world headquarters.
• The 2.7-megawatt solar panels installed at our Delmar, New York, insulation plant provided approximately 7% of the required electricity.
• Our Tessenderlo, Belgium, location has sourced approximately 10% of its electricity from wind turbines on and offsite.
• The Kearny, New Jersey, Roofing plant has sourced around 14% of the required electricity from roof solar panels.
• Our Fairburn, Georgia, plant is now home to a 1-megawatt solar project that is expected to result in an estimated 1,054 metric tons of CO2 reduction in its first year of operation (see sidebar).
• Owens Corning PPAs for 250 megawatts of renewable electricity – 125 megawatts of wind energy in Texas, and another 125 megawatts in Oklahoma.
Within the United States, approximately 56% of our electricity was sourced through renewable sources of wind (54%), hydro (1%), and solar (1%). This percentage includes renewable energy sourced from the grid as well as that sourced from our PPAs. Of the 56%, Owens Corning is proud to state that 52% is directly attributable to our renewable energy programs with a breakdown of 51% from wind and 1% from solar.
Fairburn Plant Home to Another Solar Project
In 2017, Owens Corning’s Fairburn, Georgia, plant became home to a 1-megawatt solar project. Through a partnership with Constellation and Georgia Power, a solar power system comprising nearly 3,000 photovoltaic panels was built on the plant site. The project is expected to result in an estimated 1,054 metric tons of CO2 reduction during its first year of operation.
Though the solar field does not supply power directly to the plant, it supports Owens Corning’s sustainability goals. Owens Corning also receives renewable energy certificates from Constellation for leasing space for the solar panels at the Fairburn plant.
This is Constellation’s third solar generation project located at an Owens Corning site, representing more than 6 megawatts of capacity. Other sites are in Delmar and Toledo.
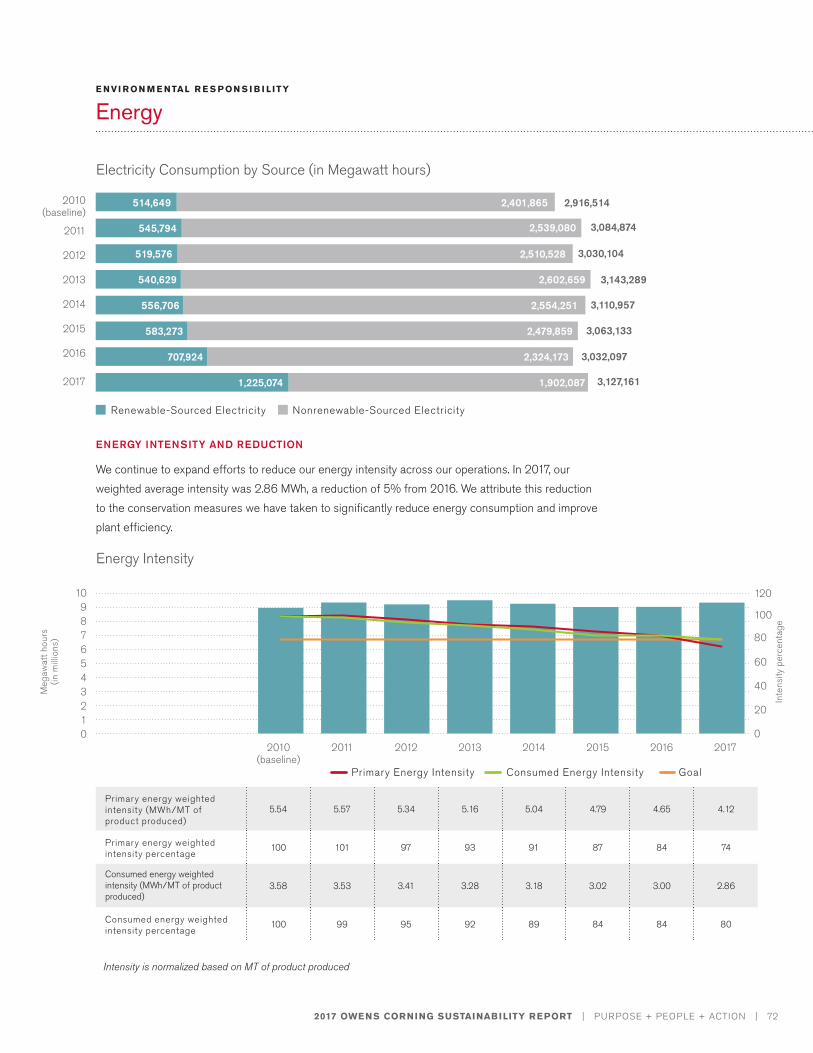
2017 OWENS CORNING SUSTAINABILITY REPORT | PURPOSE + PEOPLE + ACTION | 72
E NVI R ON M E NTAL R E S P ON S I B I L ITY
Energy
ENERGY INTENSITY AND REDUCTION
We continue to expand efforts to reduce our energy intensity across our operations. In 2017, our weighted average intensity was 2.86 MWh, a reduction of 5% from 2016. We attribute this reduction to the conservation measures we have taken to significantly reduce energy consumption and improve plant efficiency.
2010 (baseline)
2012
2011
2013
2014
2015
2016
2017
514,649
545,794
519,576
540,629
556,706
583,273
707,924
1,225,074 1,902,087
2,479,859
2,324,173
2,554,251
2,602,659
2,510,528
2,401,865 2,916,514
3,084,874
3,030,104
3,143,289
3,110,957
3,063,133
3,032,097
3,127,161
2,539,080
Electricity Consumption by Source (in Megawatt hours)
Energy Intensity
0123456789
10 120
100
80
60
40
20
0
Primary energy weighted intensity (MWh/MT of product produced)
5.54 5.57 5.34 5.16 5.04 4.79 4.65 4.12
Primary energy weighted intensity percentage
100 101 97 93 91 87 84 74
Consumed energy weighted intensity (MWh/MT of product produced)
3.58 3.53 3.41 3.28 3.18 3.02 3.00 2.86
Consumed energy weighted intensity percentage
100 99 95 92 89 84 84 80
Primary Energy Intensity Consumed Energy Intensity Goal
2012 2013 2014 2015 2016 20172010 (baseline)
2011
Intensity is normalized based on MT of product produced
Inte
nsity
per
cent
age
Renewable-Sourced Electricity Nonrenewable-Sourced Electricity
Meg
awat
t hou
rs
(in m
illio
ns)
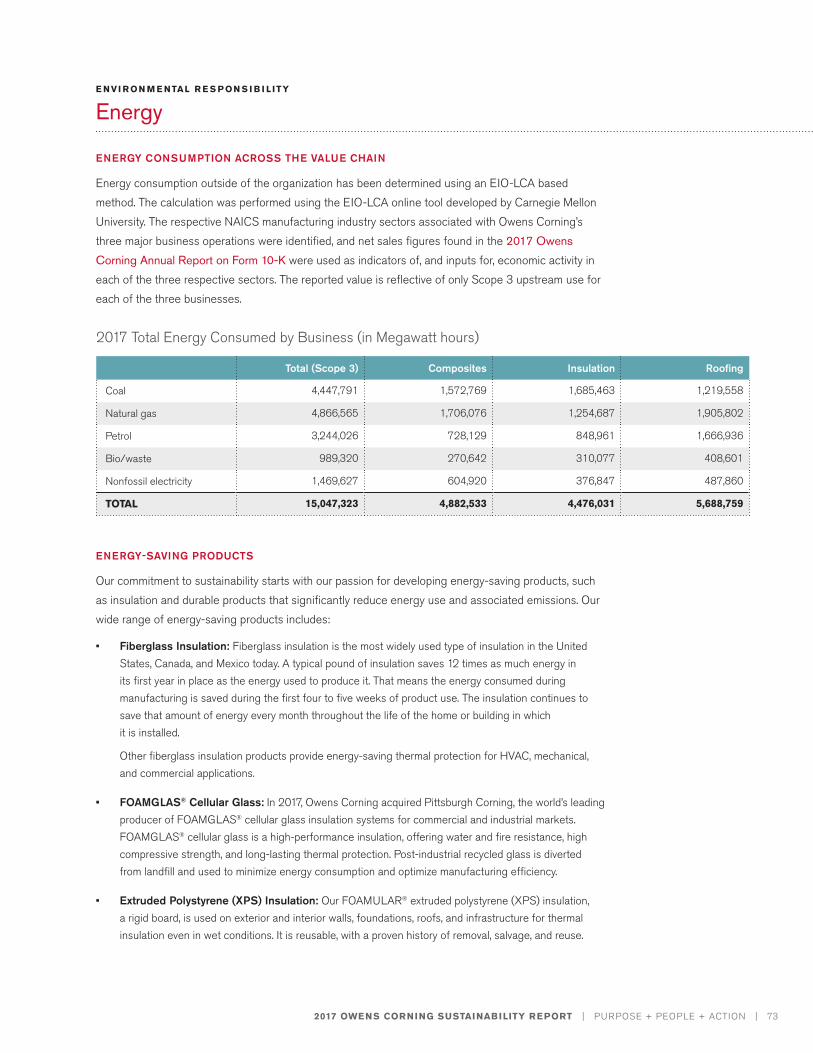
2017 OWENS CORNING SUSTAINABILITY REPORT | PURPOSE + PEOPLE + ACTION | 73
ENERGY CONSUMPTION ACROSS THE VALUE CHAIN
Energy consumption outside of the organization has been determined using an EIO-LCA based method. The calculation was performed using the EIO-LCA online tool developed by Carnegie Mellon University. The respective NAICS manufacturing industry sectors associated with Owens Corning’s three major business operations were identified, and net sales figures found in the 2017 Owens Corning Annual Report on Form 10-K were used as indicators of, and inputs for, economic activity in each of the three respective sectors. The reported value is reflective of only Scope 3 upstream use for each of the three businesses.
ENERGY-SAVING PRODUCTS
Our commitment to sustainability starts with our passion for developing energy-saving products, such as insulation and durable products that significantly reduce energy use and associated emissions. Our wide range of energy-saving products includes:
• Fiberglass Insulation: Fiberglass insulation is the most widely used type of insulation in the United States, Canada, and Mexico today. A typical pound of insulation saves 12 times as much energy in its first year in place as the energy used to produce it. That means the energy consumed during manufacturing is saved during the first four to five weeks of product use. The insulation continues to save that amount of energy every month throughout the life of the home or building in which it is installed.
Other fiberglass insulation products provide energy-saving thermal protection for HVAC, mechanical, and commercial applications.
• FOAMGLAS® Cellular Glass: In 2017, Owens Corning acquired Pittsburgh Corning, the world’s leading producer of FOAMGLAS® cellular glass insulation systems for commercial and industrial markets. FOAMGLAS® cellular glass is a high-performance insulation, offering water and fire resistance, high compressive strength, and long-lasting thermal protection. Post-industrial recycled glass is diverted from landfill and used to minimize energy consumption and optimize manufacturing efficiency.
• Extruded Polystyrene (XPS) Insulation: Our FOAMULAR® extruded polystyrene (XPS) insulation, a rigid board, is used on exterior and interior walls, foundations, roofs, and infrastructure for thermal insulation even in wet conditions. It is reusable, with a proven history of removal, salvage, and reuse.
E NVI R ON M E NTAL R E S P ON S I B I L ITY
Energy
Total (Scope 3) Composites Insulation Roofing
Coal 4,447,791 1,572,769 1,685,463 1,219,558
Natural gas 4,866,565 1,706,076 1,254,687 1,905,802
Petrol 3,244,026 728,129 848,961 1,666,936
Bio/waste 989,320 270,642 310,077 408,601
Nonfossil electricity 1,469,627 604,920 376,847 487,860
TOTAL 15,047,323 4,882,533 4,476,031 5,688,759
2017 Total Energy Consumed by Business (in Megawatt hours)
Intensity is normalized based on MT of product produced
2017 OWENS CORNING SUSTAINABILITY REPORT | PURPOSE + PEOPLE + ACTION | 74
• Mineral Wool Insulation: Thermafiber® insulation was acquired by Owens Corning in 2013 to
complement our portfolio of energy-saving products. Thermafiber® insulation is used in commercial and residential buildings and can also deliver fire containment with its high-temperature durability.
• Cool Roof Shingles: Our wide color range of “cool roof” shingles uses a highly reflective granule technology that bounces back the sun’s rays, helping keep roofs cooler to reduce air conditioning
energy levels. These shingles meet EPA ENERGY STAR® requirements for solar reflectance of .25, the fraction of solar energy reflected by the roof.
• Composites: Glass-reinforced composites can be light, insulating, and corrosion-, impact-, and heat-resistant, and are used to replace steel, aluminum, wood, and other materials. Fiberglass as a reinforcement provides for lighter weight while delivering comparable or better strength than other materials such as steel. Lighter weight means more fuel efficiency in all forms of transportation. With increasingly higher-strength technology, composites have also provided more efficiency and greater economy for wind energy turbines using longer, lighter, and more productive blades at lower wind speeds.
For some applications, glass fiber composites also have been shown to have less impact on the environment through comparison of the life cycle assessment of specific parts made from steel and aluminum. The life cycle assessment takes into consideration the raw materials extraction, manufacturing, installation, maintenance, and end of life of composite parts vs. other materials.
E NVI R ON M E NTAL R E S P ON S I B I L ITY
Energy
See Appendix B for additional energy data
PHOTO CREDIT:
Zhang Ying | Nanjing, China
Dali Yunnan, China
2017 OWENS CORNING SUSTAINABILITY REPORT | PURPOSE + PEOPLE + ACTION | 75
Owens Corning’s Goal:
PHOTO CREDIT:
Ken Saunders | Toronto, Ontario, Canada
“Seed of the future in my backyard"
Reduce greenhouse gas intensity by 50% by 2020 vs. 2010 baseline
Reduce toxic air emissions intensity by 75% by 2020 vs. 2010 baseline
Reduce PM2.5 emissions intensity by 15% by 2020 vs. 2010 baseline
Our Emissions efforts align with the following UN SDGs:
Owens Corning seeks to be a leader in safeguarding, sustaining, and improving the environment for the benefit of current and future generations. We believe that the impact of human activity on global climate change is an ongoing challenge, requiring
the reduction of greenhouse gas emissions (GHG) around the world.
STRATEGY AND APPROACH
Owens Corning is committed to helping our businesses, our customers, and the world increase energy efficiency and reduce GHG emissions. We are well-positioned with technical skills and processes in place in our operations to reduce our own energy use and emissions by being more energy efficient and increasing our use of renewable energy. In addition, we offer innovative solutions that enable energy efficiency in the construction, transportation, and renewable energy markets.
Our sustainability leadership team collaborates with internal and external stakeholders to enhance engagement opportunities, create large-scale footprint reduction programs, and enable supplier initiatives to review priorities and discuss plans. Through these reviews, we ensure the development of a sustainable business that benefits all our stakeholders.
We use Schneider Electric Resource Advisor to track environmental data at the plant level. The data are normalized on a unit of production basis to evaluate variations and potential areas of risk. If risks are identified, mitigation plans are developed. The plant-level environmental data are then aggregated at a business unit and corporate level. Every plant, business unit, and corporate organization are provided footprint files for comparisons and the ability to track against their goals.
E NVI R ON M E NTAL R E S P ON S I B I L ITY
Emissions
The scope 1 and scope 2 data in this chapter were independently assured to a high level by SCS Global Services. Other emissions data in the chapter were independently assured to a moderate level by SCS Global Services. For more information or to see the verification statement, please go to page 205 in the About the Report section.
2017 OWENS CORNING SUSTAINABILITY REPORT | PURPOSE + PEOPLE + ACTION | 76
We measure performance against our environmental sustainability goals on a periodic basis, depending on risk and availability of data. For example, energy is measured monthly while toxic air emissions are measured less frequently.
Targeting 50% GHG Emissions Reduction by 2020
We are committed to reducing our footprint and have established 2020 GHG emissions goals using 2010 data as the baseline. We follow the World Resources Institute (WRI) GHG protocol to account for Scope 1, 2, and 3 emissions.
After achieving a 34% reduction in GHG emissions in 2014 (compared with the 2010 baseline), Owens Corning raised its 2020 reduction goal in 2015 from 20% to 50%. In 2017, we achieved a 48% reduction from our base year. Through energy efficiency efforts and formulation improvements in the blowing agent we use in XPS foam insulation, we were able to show significant reductions from 2010 to 2017. From 2016 to 2017, we showed a year-over-year improvement of 14%, which is directly related to our investment in renewable energy.
DEVELOPMENT OF CLEANER AND GREENER PROCESSES FOR
PRODUCT MANUFACTURING
Our focus has always been on achieving intensity goals rather than absolute goals, as absolute measurements tend to vary widely based on business volumes and market conditions. We have achieved our intensity goals by developing lower GHG foam blowing agents and decreasing our fossil fuels and natural gas usage.
In our endeavor to address climate change issues, we are continuing to develop greener solutions while maximizing our renewable energy usage. Owens Corning has annual internal targets to ensure progress toward our 2020 goals. Our roadmap for emission reductions is based on the following short- and long-term strategies:
Short-term Strategies
• Conversion of the blowing agent used in manufacturing our foam products to reduce GHG emissions;
• Creation of residential builders’ guide detailing the process to build net-zero energy homes in all climate zones, and engagement with builders and architects to provide building science solutions for beyond-code energy efficiency; and
• Development of our sustainability mapping tool, which was designed to evaluate how a new product or process will impact the company’s sustainability goals and to drive decisions in the design phase that will lead to a portfolio of more sustainable products.
Long-term Strategies
• Continue to evaluate renewable energy opportunities on a global basis including longer-term agreements to support the addition of renewable energy to the grid. Our research and development portfolio is guided by our sustainability mapping tool and our focus to ultimately be a net positive
company. Innovation and sustainability are key drivers of our long-term strategy.
E NVI R ON M E NTAL R E S P ON S I B I L ITY
Emissions
PHOTO CREDIT:
Troy Zimmerman | Granville, Ohio, U.S.
Sunset at Vanderbilt Beach in Naples, Florida, U.S.
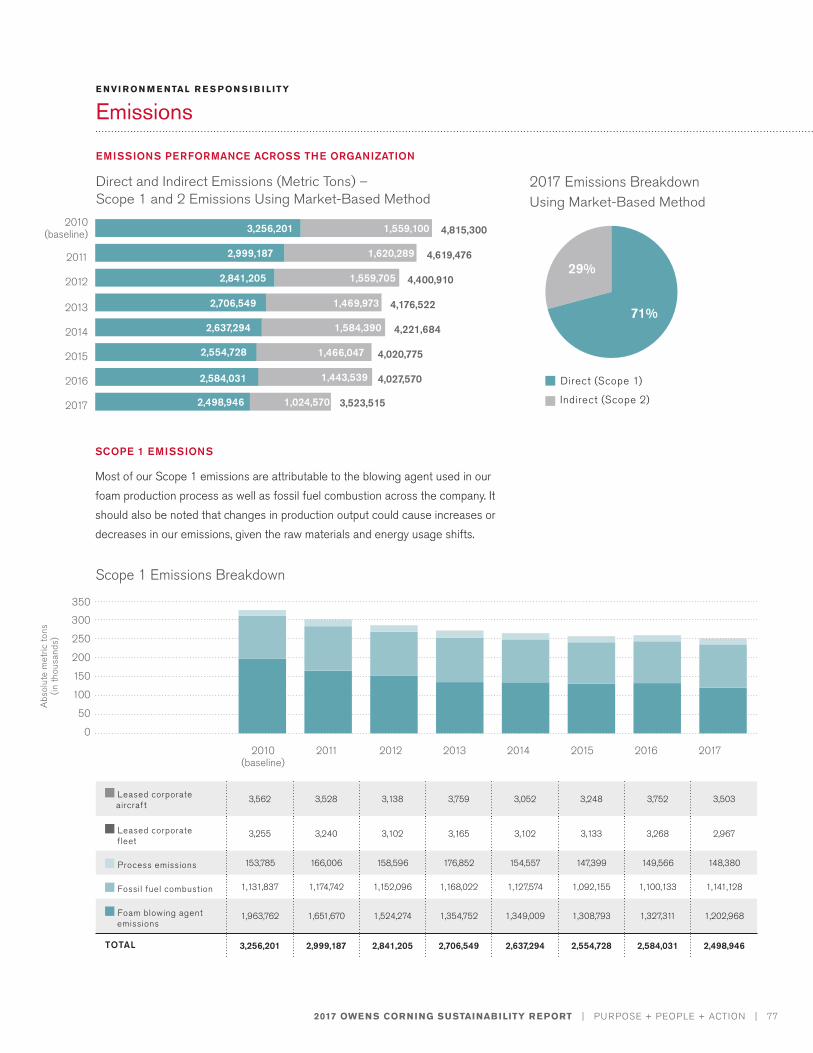
2017 OWENS CORNING SUSTAINABILITY REPORT | PURPOSE + PEOPLE + ACTION | 77
EMISSIONS PERFORMANCE ACROSS THE ORGANIZATION
E NVI R ON M E NTAL R E S P ON S I B I L ITY
Emissions
Direct and Indirect Emissions (Metric Tons) – Scope 1 and 2 Emissions Using Market-Based Method
2010 (baseline)
2012
2011
2013
2014
2015
2016
2017
Scope 1 Emissions Breakdown
2017 Emissions BreakdownUsing Market-Based Method
2,498,946
3,256,201
2,999,187
2,841,205
2,706,549
1,559,705
1,469,973
1,620,289
1,559,100
2,584,031
2,554,728
2,637,294 1,584,390
1,466,047
1,443,539
1,024,570
4,020,775
4,221,684
4,176,522
4,400,910
4,619,476
4,815,300
4,027,570
3,523,515
SCOPE 1 EMISSIONS
Most of our Scope 1 emissions are attributable to the blowing agent used in our foam production process as well as fossil fuel combustion across the company. It should also be noted that changes in production output could cause increases or decreases in our emissions, given the raw materials and energy usage shifts.
29%
71%
Direct (Scope 1)
Indirect (Scope 2)
Leased corporate aircraft
3,562 3,528 3,138 3,759 3,052 3,248 3,752 3,503
Leased corporate fleet
3,255 3,240 3,102 3,165 3,102 3,133 3,268 2,967
Process emissions 153,785 166,006 158,596 176,852 154,557 147,399 149,566 148,380
Fossil fuel combustion 1,131,837 1,174,742 1,152,096 1,168,022 1,127,574 1,092,155 1,100,133 1,141,128
Foam blowing agent emissions
1,963,762 1,651,670 1,524,274 1,354,752 1,349,009 1,308,793 1,327,311 1,202,968
TOTAL 3,256,201 2,999,187 2,841,205 2,706,549 2,637,294 2,554,728 2,584,031 2,498,946
0
50
100
150
200
250
300
350
Abs
olut
e m
etric
tons
(in
thou
sand
s)
2012 2013 2014 2015 2016 20172010 (baseline)
2011
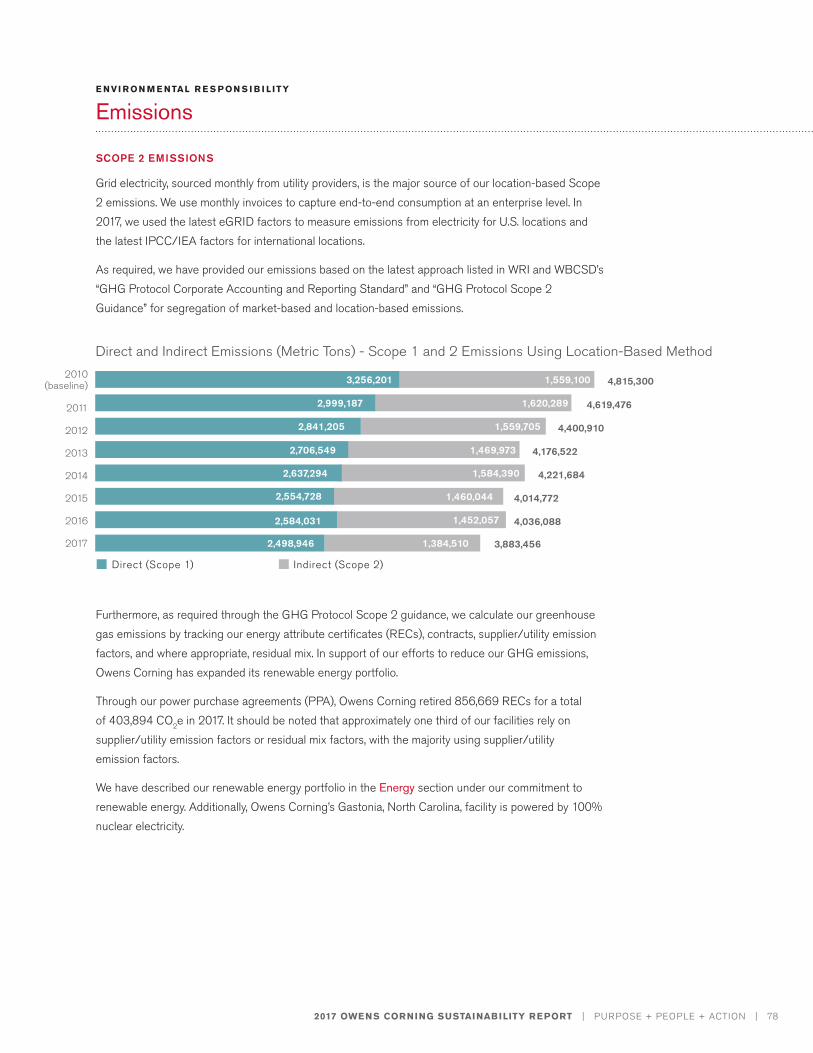
2017 OWENS CORNING SUSTAINABILITY REPORT | PURPOSE + PEOPLE + ACTION | 78
E NVI R ON M E NTAL R E S P ON S I B I L ITY
Emissions
SCOPE 2 EMISSIONS
Grid electricity, sourced monthly from utility providers, is the major source of our location-based Scope 2 emissions. We use monthly invoices to capture end-to-end consumption at an enterprise level. In 2017, we used the latest eGRID factors to measure emissions from electricity for U.S. locations and the latest IPCC/IEA factors for international locations.
As required, we have provided our emissions based on the latest approach listed in WRI and WBCSD’s “GHG Protocol Corporate Accounting and Reporting Standard” and “GHG Protocol Scope 2 Guidance” for segregation of market-based and location-based emissions.
Furthermore, as required through the GHG Protocol Scope 2 guidance, we calculate our greenhouse gas emissions by tracking our energy attribute certificates (RECs), contracts, supplier/utility emission factors, and where appropriate, residual mix. In support of our efforts to reduce our GHG emissions, Owens Corning has expanded its renewable energy portfolio.
Through our power purchase agreements (PPA), Owens Corning retired 856,669 RECs for a total of 403,894 CO2e in 2017. It should be noted that approximately one third of our facilities rely on supplier/utility emission factors or residual mix factors, with the majority using supplier/utility emission factors.
We have described our renewable energy portfolio in the Energy section under our commitment to renewable energy. Additionally, Owens Corning’s Gastonia, North Carolina, facility is powered by 100% nuclear electricity.
2010 (baseline)
2012
2011
2013
2014
2015
2016
2017
Direct and Indirect Emissions (Metric Tons) - Scope 1 and 2 Emissions Using Location-Based Method
2,498,946
3,256,201
2,999,187
2,841,205
2,706,549
1,559,705
1,469,973
1,620,289
1,559,100
2,584,031
2,554,728
2,637,294 1,584,390
1,460,044
1,452,057
1,384,510
4,014,772
4,221,684
4,176,522
4,400,910
4,619,476
4,815,300
4,036,088
3,883,456
Direct (Scope 1) Indirect (Scope 2)
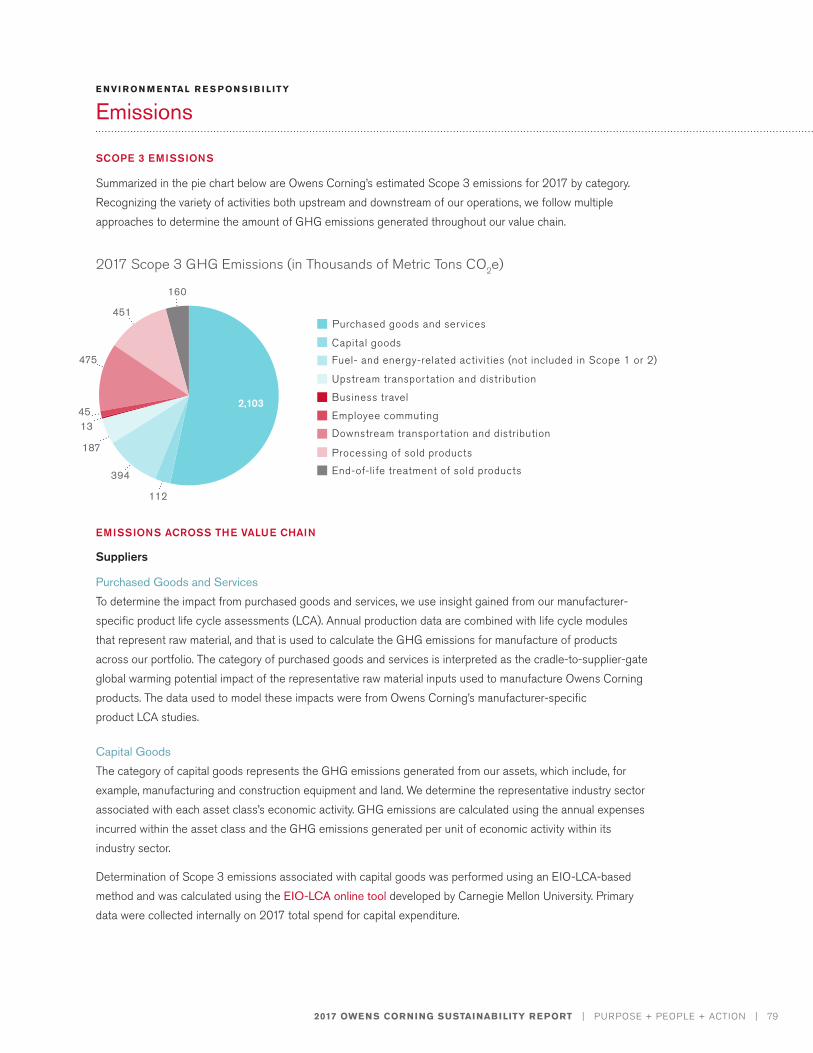
2017 OWENS CORNING SUSTAINABILITY REPORT | PURPOSE + PEOPLE + ACTION | 79
SCOPE 3 EMISSIONS
Summarized in the pie chart below are Owens Corning’s estimated Scope 3 emissions for 2017 by category. Recognizing the variety of activities both upstream and downstream of our operations, we follow multiple approaches to determine the amount of GHG emissions generated throughout our value chain.
EMISSIONS ACROSS THE VALUE CHAIN
Suppliers
Purchased Goods and ServicesTo determine the impact from purchased goods and services, we use insight gained from our manufacturer-specific product life cycle assessments (LCA). Annual production data are combined with life cycle modules that represent raw material, and that is used to calculate the GHG emissions for manufacture of products across our portfolio. The category of purchased goods and services is interpreted as the cradle-to-supplier-gate global warming potential impact of the representative raw material inputs used to manufacture Owens Corning products. The data used to model these impacts were from Owens Corning’s manufacturer-specific product LCA studies.
Capital GoodsThe category of capital goods represents the GHG emissions generated from our assets, which include, for example, manufacturing and construction equipment and land. We determine the representative industry sector associated with each asset class’s economic activity. GHG emissions are calculated using the annual expenses incurred within the asset class and the GHG emissions generated per unit of economic activity within its industry sector.
Determination of Scope 3 emissions associated with capital goods was performed using an EIO-LCA-based method and was calculated using the EIO-LCA online tool developed by Carnegie Mellon University. Primary data were collected internally on 2017 total spend for capital expenditure.
E NVI R ON M E NTAL R E S P ON S I B I L ITY
Emissions
Purchased goods and services
Capital goodsFuel- and energy-related activities (not included in Scope 1 or 2)
Upstream transportation and distribution
Business travel
Employee commuting
Downstream transportation and distribution
Processing of sold products
End-of-life treatment of sold products
2017 Scope 3 GHG Emissions (in Thousands of Metric Tons CO2e)
2,103
160
451
475
4513
187
394
112
2017 OWENS CORNING SUSTAINABILITY REPORT | PURPOSE + PEOPLE + ACTION | 80
Fuel- and Energy-Related Activities In fuel- and energy-related activities, we aim to quantify the GHG emissions that occur both upstream and downstream of electricity generation. Upstream emissions, which are cradle-to-generation in scope, include those from activities required to generate electricity such as the extraction, processing, and transportation of fuels. Downstream emissions, which are generation-to-consumption, include those produced from additional electricity generation that is needed to compensate for line losses that occur during transmission and distribution.
In our calculation for Scope 3 GHG emissions for fuel- and energy-related activities, upstream impacts were determined using life cycle impact assessment factors, calculated using geographic-specific unit processes for high voltage production from ecoinvent v3.4 and combined with emission rate data from U.S. EPA’s eGRID for U.S. facilities, and IEA for non-U.S facilities. For U.S. facilities, data for downstream transmission and distribution line losses were calculated using eGRID. For non-U.S. facilities, we used IEA datasets for the calculation.
Upstream Transportation and DistributionWe recognize that transportation is a significant source of GHG emissions when sourcing raw materials for product manufacturing as well as in the distribution of finished goods. Using data from our sourcing and logistic analysts, we determine the annual costs associated with each major transportation mode. After determining the GHG emissions per unit of economic activity within the unique industry sector representing each transportation mode, we can estimate the GHG emissions generated from the upstream and downstream transportation of materials.
Primary data were collected internally from Owens Corning logistic analysts for 2017 total spend associated with the inbound transportation of all purchased materials. We categorized spend data and calculated the total spend for each of the three transportation modes (truck, water, and passenger ground).
Business TravelRental car mileage and commercial air travel miles and emissions were received from our travel vendor. For employee vehicle reimbursement related to business mileage, Owens Corning utilized an extract of miles from our travel system and determined emissions based on a standard emission rate provided by the U.S. EPA Greenhouse Gas Emissions from a Typical Passenger Vehicle guide.
Employee CommutingOwens Corning used a simplified version of the Scope 3 GHG Protocol’s average-data method to calculate employee commuting emissions. We again used the U.S. EPA’s guide to determine an estimate of grams of CO2 per mile, and used the average number of days worked per year to estimate employee commuting. This did not take into account telecommuting, public transportation, carpooling, business travel days that would be accounted for separately, or other methods of commuting.
E NVI R ON M E NTAL R E S P ON S I B I L ITY
Emissions
PHOTO CREDIT:
Hao Yang | Yuhang, China
Bird makes itself at home at Xiamen University in China
2017 OWENS CORNING SUSTAINABILITY REPORT | PURPOSE + PEOPLE + ACTION | 81
E NVI R ON M E NTAL R E S P ON S I B I L ITY
Emissions
Downstream Transportation and DistributionPrimary data were collected internally from Owens Corning logistic analysts for annual total spend associated with the outbound distribution and transportation of finished goods. Transportation spend data were allocated entirely to truck transportation as the mode of distribution for a more conservative approximation. Total transportation spend was used as the indicator of economic activity and used as the input in the EIO-LCA online tool.
Processing of Sold ProductsMany of our products do not require additional processing or energy sources to perform their function; these include our asphalt roofing shingles as well as our wide range of insulation solutions. Additional downstream processing, however, is common with intermediate products such as our reinforcement glass fiber, which is often used in reinforced plastic composites. To determine the GHG emissions from this category, we correlate the revenue generated from our Composites business to the GHG emissions of industry sectors that represent our glass-fiber reinforced plastic (GFRP) customers.
Scope 3 emissions were calculated and determined for Owens Corning’s Composites business only, which primarily manufactures intermediate products, using the eiolca.net tool.
End-of-Life (EoL) Treatment of Sold ProductsWhile asphalt roofing shingles and GFRP materials have increasingly more innovative applications for recycling at their end of life, we recognize that the end-of-life of insulation products is, more often than not, waste to landfill. Scope 3 EoL emissions were determined for Owens Corning insulation manufacturing operations, and, more specifically, only for fiberglass and XPS insulation. We determine the impact of this category by calculating the GHG emissions generated when all the glass wool and XPS foam produced by our North American facilities for 2017 is sent to landfill.
EoL emission factors were determined from cradle-to-grave EPDs, and the LCAs upon which they are based, on Owens Corning fiberglass insulation and XPS insulation. The third-party verified LCAs were internally conducted for these products in 2012 and 2013, respectively. These factors were used in conjunction with 2017 production volumes for these two insulation materials to determine the Scope 3 emissions when the production volume quantities are disposed as waste to landfill.
Customers
Buildings contribute about 40% of GHG emissions in the world today, so they are an essential target for reducing emissions. Given that building and construction is one of our main customer industries, we monitor qualitatively and quantitatively the GHG emissions from buildings in relation to their energy efficiency. Our commitment to sustainability starts with energy-saving products such as insulation and air-sealing products. We estimate that our insulation produced in North America in 2017 reduced GHG emissions for homeowners by approximately 9.6 million metric tons a year and 577 million metric tons over a 60-year building life. A typical pound of insulation saves 12 times as much energy in its first year of use as the energy used to produce it. That means the energy consumed during manufacturing is saved during the first four to five weeks of product use.
Our glass fiber composites contribute to light-weighting of vehicles for better fuel efficiency, better efficiency of wind turbines, and lower embodied energy than competing materials over the life of the part. We collaborate with customers to conduct LCAs for their products as well.
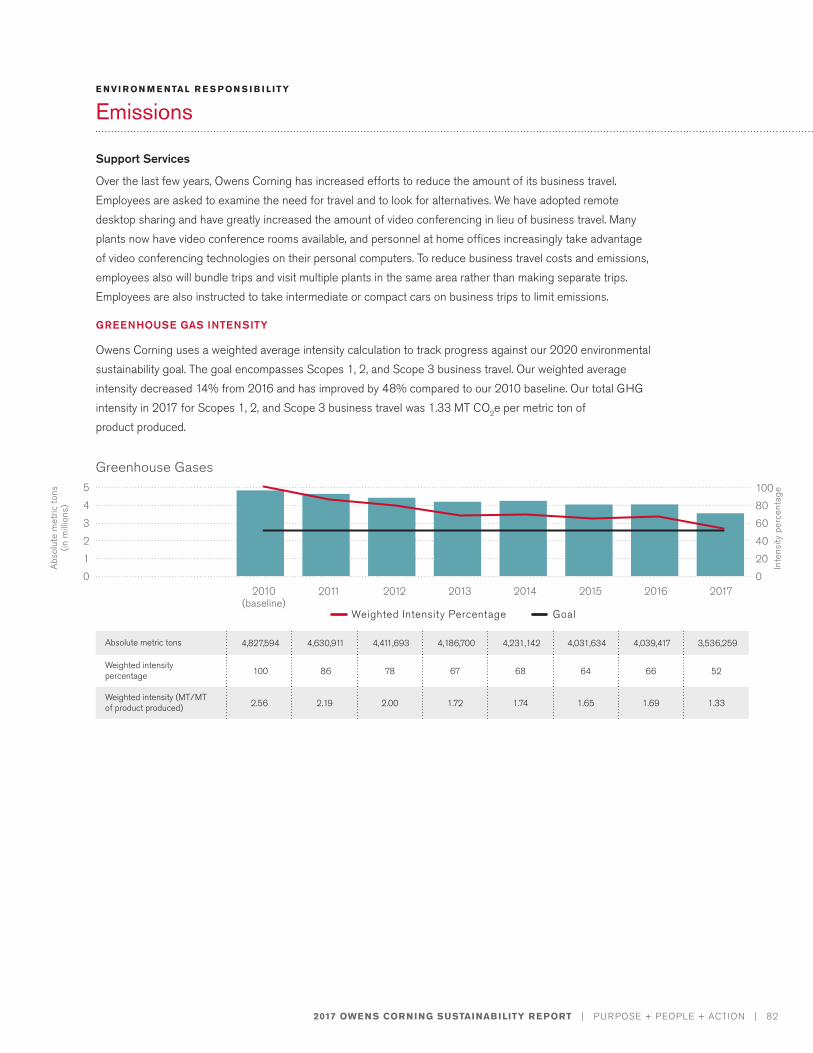
2017 OWENS CORNING SUSTAINABILITY REPORT | PURPOSE + PEOPLE + ACTION | 82
Support Services
Over the last few years, Owens Corning has increased efforts to reduce the amount of its business travel. Employees are asked to examine the need for travel and to look for alternatives. We have adopted remote desktop sharing and have greatly increased the amount of video conferencing in lieu of business travel. Many plants now have video conference rooms available, and personnel at home offices increasingly take advantage of video conferencing technologies on their personal computers. To reduce business travel costs and emissions, employees also will bundle trips and visit multiple plants in the same area rather than making separate trips. Employees are also instructed to take intermediate or compact cars on business trips to limit emissions.
GREENHOUSE GAS INTENSITY
Owens Corning uses a weighted average intensity calculation to track progress against our 2020 environmental sustainability goal. The goal encompasses Scopes 1, 2, and Scope 3 business travel. Our weighted average intensity decreased 14% from 2016 and has improved by 48% compared to our 2010 baseline. Our total GHG intensity in 2017 for Scopes 1, 2, and Scope 3 business travel was 1.33 MT CO2e per metric ton of product produced.
E NVI R ON M E NTAL R E S P ON S I B I L ITY
Emissions
Absolute metric tons 4,827,594 4,630,911 4,411,693 4,186,700 4,231,142 4,031,634 4,039,417 3,536,259
Weighted intensity percentage 100 86 78 67 68 64 66 52
Weighted intensity (MT/MT of product produced) 2.56 2.19 2.00 1.72 1.74 1.65 1.69 1.33
0 0
201
2 40
3 60
4 80
5 100
Abs
olut
e m
etric
tons
(in
mill
ions
)
2012 2013 2014 2015 2016 20172010 (baseline)
2011
Weighted Intensity Percentage Goal
Greenhouse Gases
Inte
nsity
per
cent
age
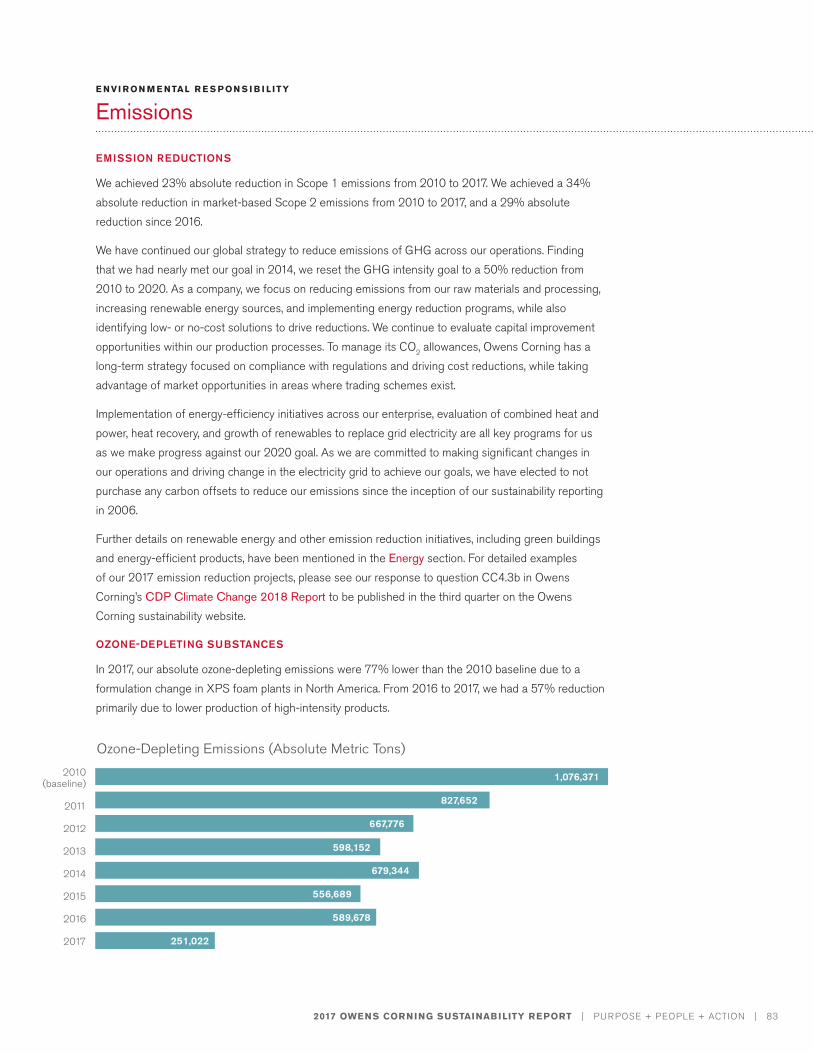
2017 OWENS CORNING SUSTAINABILITY REPORT | PURPOSE + PEOPLE + ACTION | 83
E NVI R ON M E NTAL R E S P ON S I B I L ITY
Emissions
EMISSION REDUCTIONS
We achieved 23% absolute reduction in Scope 1 emissions from 2010 to 2017. We achieved a 34% absolute reduction in market-based Scope 2 emissions from 2010 to 2017, and a 29% absolute reduction since 2016.
We have continued our global strategy to reduce emissions of GHG across our operations. Finding that we had nearly met our goal in 2014, we reset the GHG intensity goal to a 50% reduction from 2010 to 2020. As a company, we focus on reducing emissions from our raw materials and processing, increasing renewable energy sources, and implementing energy reduction programs, while also identifying low- or no-cost solutions to drive reductions. We continue to evaluate capital improvement opportunities within our production processes. To manage its CO2 allowances, Owens Corning has a long-term strategy focused on compliance with regulations and driving cost reductions, while taking advantage of market opportunities in areas where trading schemes exist.
Implementation of energy-efficiency initiatives across our enterprise, evaluation of combined heat and power, heat recovery, and growth of renewables to replace grid electricity are all key programs for us as we make progress against our 2020 goal. As we are committed to making significant changes in our operations and driving change in the electricity grid to achieve our goals, we have elected to not purchase any carbon offsets to reduce our emissions since the inception of our sustainability reporting in 2006.
Further details on renewable energy and other emission reduction initiatives, including green buildings and energy-efficient products, have been mentioned in the Energy section. For detailed examples of our 2017 emission reduction projects, please see our response to question CC4.3b in Owens Corning’s CDP Climate Change 2018 Report to be published in the third quarter on the Owens Corning sustainability website.
OZONE-DEPLETING SUBSTANCES
In 2017, our absolute ozone-depleting emissions were 77% lower than the 2010 baseline due to a formulation change in XPS foam plants in North America. From 2016 to 2017, we had a 57% reduction primarily due to lower production of high-intensity products.
2010 (baseline)
2012
2011
2013
2014
2015
2016
2017
Ozone-Depleting Emissions (Absolute Metric Tons)
1,076,371
827,652
667,776
598,152
679,344
556,689
589,678
251,022
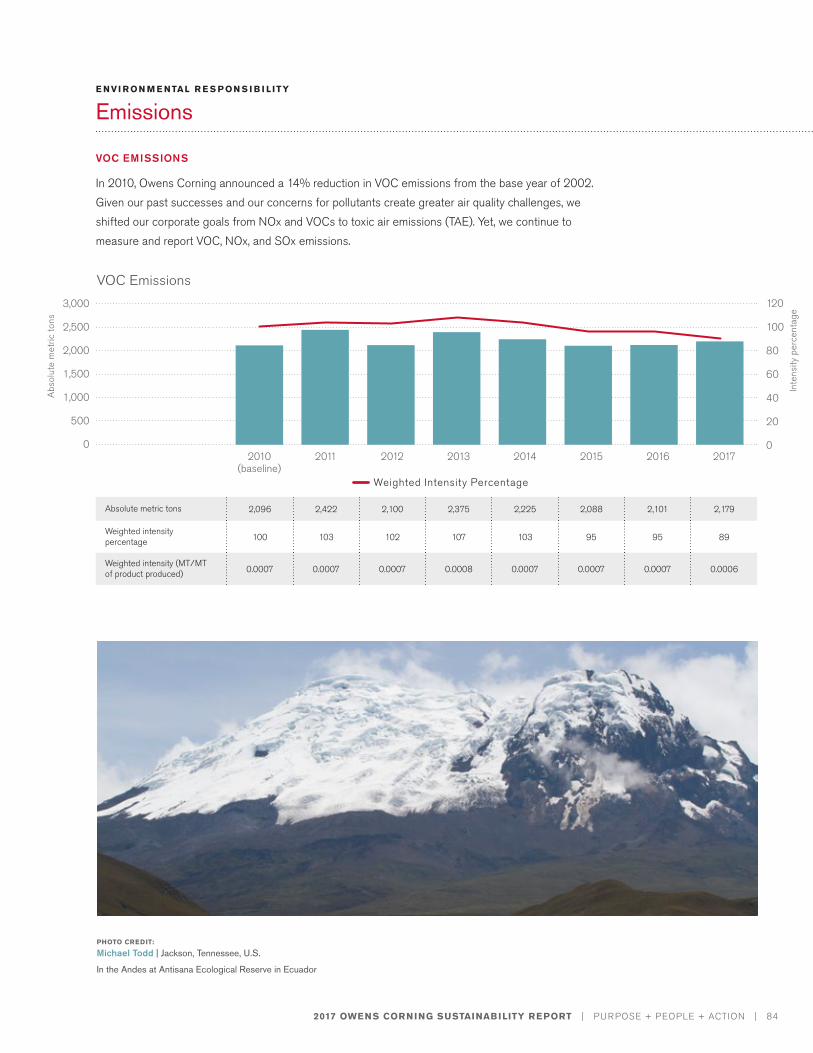
2017 OWENS CORNING SUSTAINABILITY REPORT | PURPOSE + PEOPLE + ACTION | 84
VOC EMISSIONS
In 2010, Owens Corning announced a 14% reduction in VOC emissions from the base year of 2002. Given our past successes and our concerns for pollutants create greater air quality challenges, we shifted our corporate goals from NOx and VOCs to toxic air emissions (TAE). Yet, we continue to measure and report VOC, NOx, and SOx emissions.
E NVI R ON M E NTAL R E S P ON S I B I L ITY
Emissions
PHOTO CREDIT:
Michael Todd | Jackson, Tennessee, U.S.
In the Andes at Antisana Ecological Reserve in Ecuador
Absolute metric tons 2,096 2,422 2,100 2,375 2,225 2,088 2,101 2,179
Weighted intensity percentage 100 103 102 107 103 95 95 89
Weighted intensity (MT/MT of product produced) 0.0007 0.0007 0.0007 0.0008 0.0007 0.0007 0.0007 0.0006
2012 2013 2014 2015 2016 20172010 (baseline)
2011
Weighted Intensity Percentage
0 0
20
1,000
500
1,500
40
2,000
60
2,500
80
3,000
100
120
VOC Emissions
A
bsol
ute
met
ric to
ns
Inte
nsity
per
cent
age
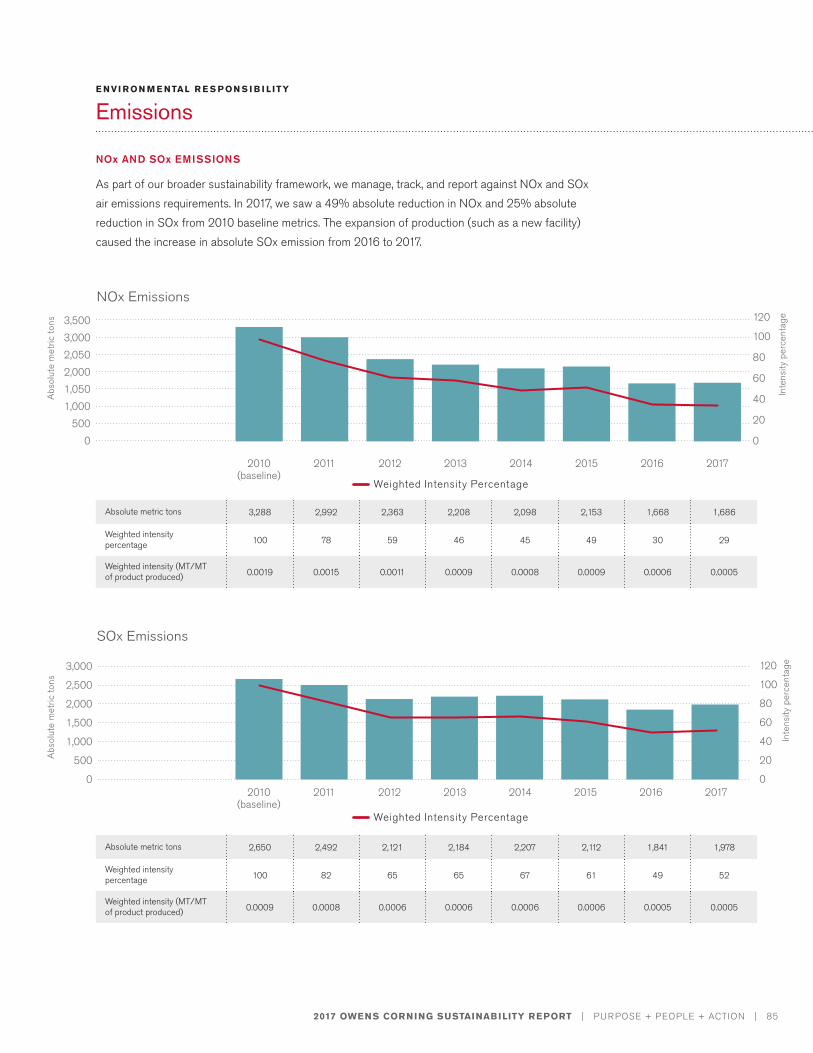
2017 OWENS CORNING SUSTAINABILITY REPORT | PURPOSE + PEOPLE + ACTION | 85
E NVI R ON M E NTAL R E S P ON S I B I L ITY
Emissions
NOx AND SOx EMISSIONS
As part of our broader sustainability framework, we manage, track, and report against NOx and SOx air emissions requirements. In 2017, we saw a 49% absolute reduction in NOx and 25% absolute reduction in SOx from 2010 baseline metrics. The expansion of production (such as a new facility) caused the increase in absolute SOx emission from 2016 to 2017.
0
500
1,000
1,500
2,000
2,500
3,000
0500
1,0001,0502,0002,0503,0003,500
0
0
20
20
40
40
60
60
80
80
100
100
120
120
NOx Emissions
SOx Emissions
Absolute metric tons 3,288 2,992 2,363 2,208 2,098 2,153 1,668 1,686
Weighted intensity percentage 100 78 59 46 45 49 30 29
Weighted intensity (MT/MT of product produced) 0.0019 0.0015 0.0011 0.0009 0.0008 0.0009 0.0006 0.0005
Absolute metric tons 2,650 2,492 2,121 2,184 2,207 2,112 1,841 1,978
Weighted intensity percentage 100 82 65 65 67 61 49 52
Weighted intensity (MT/MT of product produced) 0.0009 0.0008 0.0006 0.0006 0.0006 0.0006 0.0005 0.0005
2012
2012
2013
2013
2014
2014
2015
2015
2016
2016
2017
2017
2010 (baseline)
2010 (baseline)
2011
2011
Weighted Intensity Percentage
Weighted Intensity Percentage
A
bsol
ute
met
ric to
ns
Inte
nsity
per
cent
age
A
bsol
ute
met
ric to
ns
Inte
nsity
per
cent
age
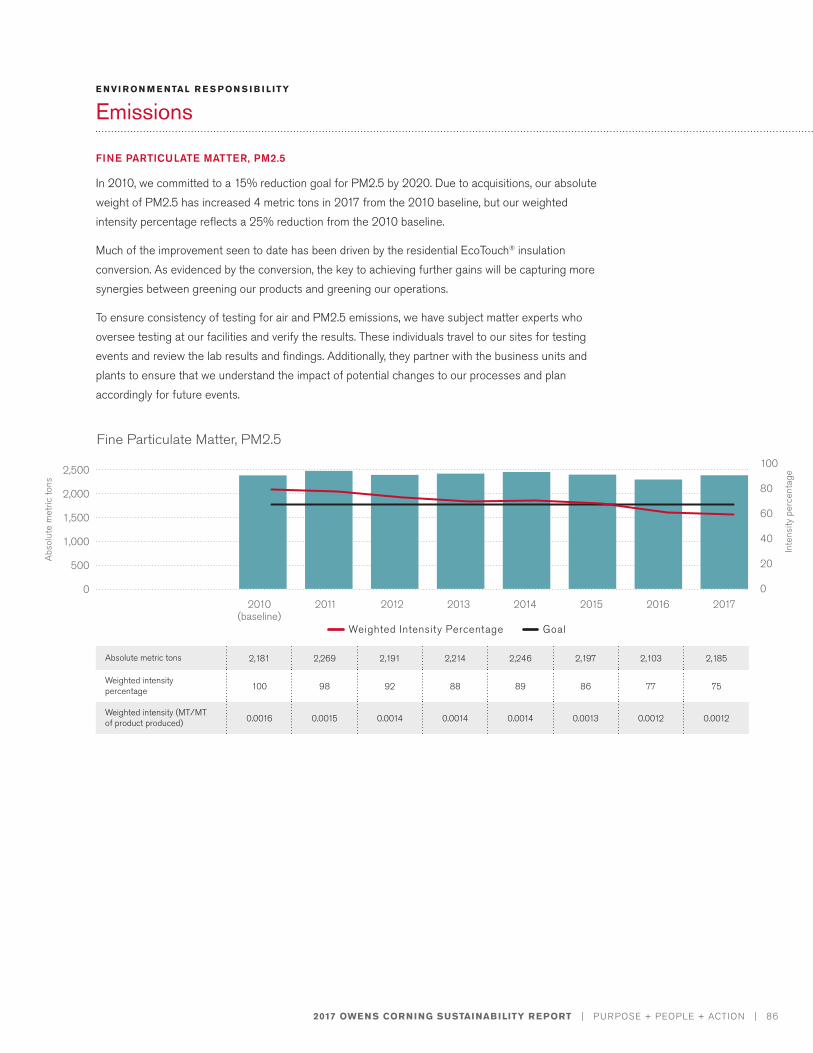
2017 OWENS CORNING SUSTAINABILITY REPORT | PURPOSE + PEOPLE + ACTION | 86
E NVI R ON M E NTAL R E S P ON S I B I L ITY
Emissions
FINE PARTICULATE MATTER, PM2.5
In 2010, we committed to a 15% reduction goal for PM2.5 by 2020. Due to acquisitions, our absolute weight of PM2.5 has increased 4 metric tons in 2017 from the 2010 baseline, but our weighted intensity percentage reflects a 25% reduction from the 2010 baseline.
Much of the improvement seen to date has been driven by the residential EcoTouch® insulation conversion. As evidenced by the conversion, the key to achieving further gains will be capturing more synergies between greening our products and greening our operations.
To ensure consistency of testing for air and PM2.5 emissions, we have subject matter experts who oversee testing at our facilities and verify the results. These individuals travel to our sites for testing events and review the lab results and findings. Additionally, they partner with the business units and plants to ensure that we understand the impact of potential changes to our processes and plan accordingly for future events.
Inte
nsity
per
cent
age
Absolute metric tons 2,181 2,269 2,191 2,214 2,246 2,197 2,103 2,185
Weighted intensity percentage 100 98 92 88 89 86 77 75
Weighted intensity (MT/MT of product produced) 0.0016 0.0015 0.0014 0.0014 0.0014 0.0013 0.0012 0.0012
0
1,000
500
1,500
2,000
2,500
2012 2013 2014 2015 2016 20172010 (baseline)
2011
Weighted Intensity Percentage Goal
0
20
40
60
80
100
Fine Particulate Matter, PM2.5
A
bsol
ute
met
ric to
ns
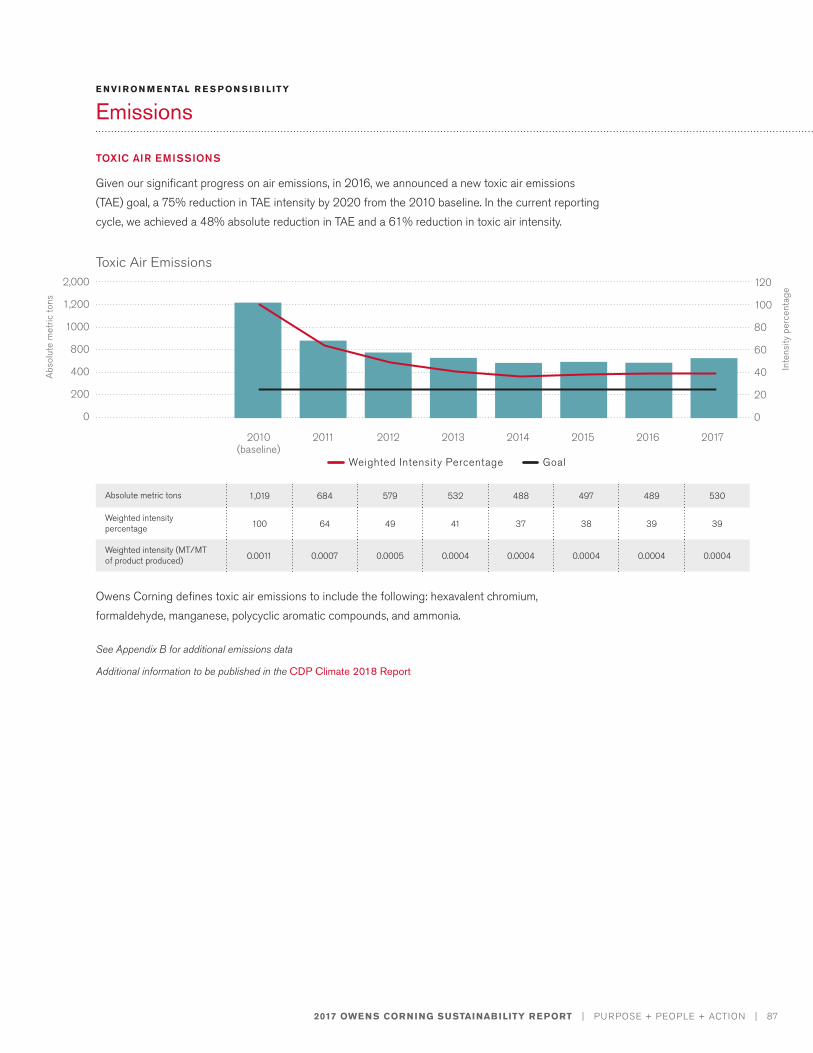
2017 OWENS CORNING SUSTAINABILITY REPORT | PURPOSE + PEOPLE + ACTION | 87
E NVI R ON M E NTAL R E S P ON S I B I L ITY
Emissions
TOXIC AIR EMISSIONS
Given our significant progress on air emissions, in 2016, we announced a new toxic air emissions (TAE) goal, a 75% reduction in TAE intensity by 2020 from the 2010 baseline. In the current reporting cycle, we achieved a 48% absolute reduction in TAE and a 61% reduction in toxic air intensity.
Inte
nsity
per
cent
age
A
bsol
ute
met
ric to
ns
Absolute metric tons 1,019 684 579 532 488 497 489 530
Weighted intensity percentage 100 64 49 41 37 38 39 39
Weighted intensity (MT/MT of product produced) 0.0011 0.0007 0.0005 0.0004 0.0004 0.0004 0.0004 0.0004
2012 2013 2014 2015 2016 20172010 (baseline)
2011
Weighted Intensity Percentage Goal
0
400
200
800
1000
1,200
2,000
0
20
40
60
80
100
120
Owens Corning defines toxic air emissions to include the following: hexavalent chromium, formaldehyde, manganese, polycyclic aromatic compounds, and ammonia.
See Appendix B for additional emissions data
Additional information to be published in the CDP Climate 2018 Report
Toxic Air Emissions
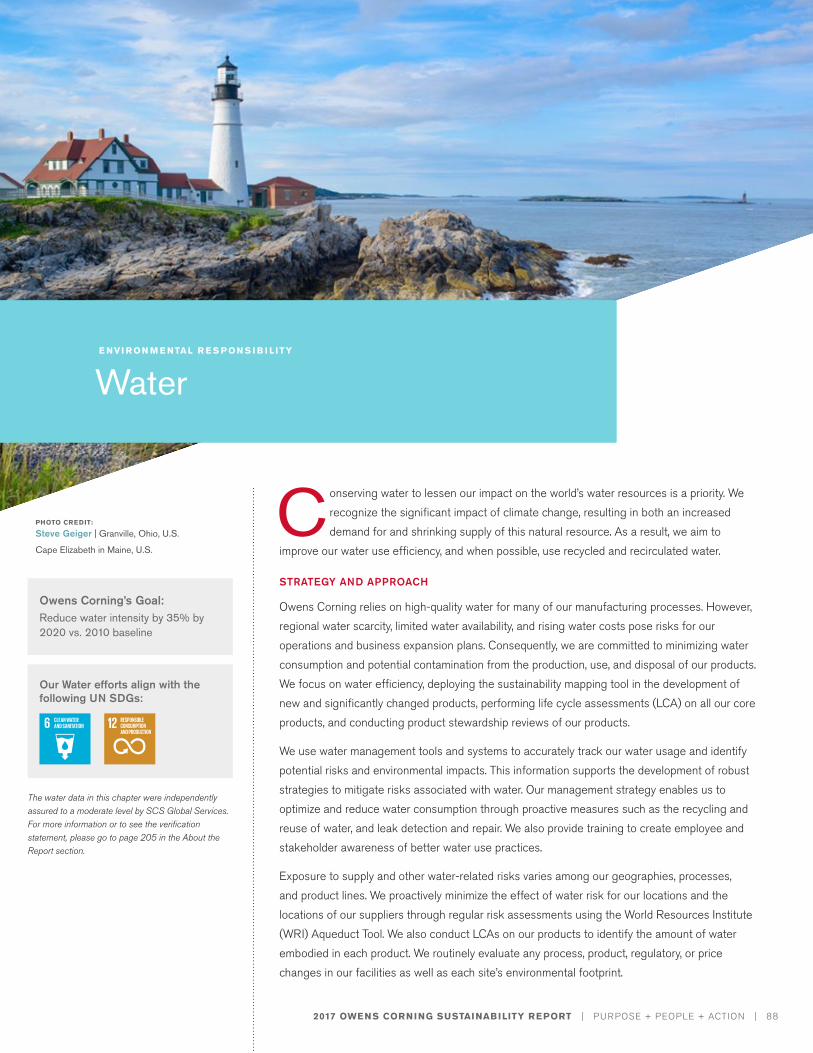
2017 OWENS CORNING SUSTAINABILITY REPORT | PURPOSE + PEOPLE + ACTION | 88
PHOTO CREDIT:
Steve Geiger | Granville, Ohio, U.S.
Cape Elizabeth in Maine, U.S.
Owens Corning’s Goal:Reduce water intensity by 35% by 2020 vs. 2010 baseline
Our Water efforts align with the following UN SDGs:
C onserving water to lessen our impact on the world’s water resources is a priority. We recognize the significant impact of climate change, resulting in both an increased demand for and shrinking supply of this natural resource. As a result, we aim to
improve our water use efficiency, and when possible, use recycled and recirculated water.
STRATEGY AND APPROACH
Owens Corning relies on high-quality water for many of our manufacturing processes. However, regional water scarcity, limited water availability, and rising water costs pose risks for our operations and business expansion plans. Consequently, we are committed to minimizing water consumption and potential contamination from the production, use, and disposal of our products. We focus on water efficiency, deploying the sustainability mapping tool in the development of new and significantly changed products, performing life cycle assessments (LCA) on all our core products, and conducting product stewardship reviews of our products.
We use water management tools and systems to accurately track our water usage and identify potential risks and environmental impacts. This information supports the development of robust strategies to mitigate risks associated with water. Our management strategy enables us to optimize and reduce water consumption through proactive measures such as the recycling and reuse of water, and leak detection and repair. We also provide training to create employee and stakeholder awareness of better water use practices.
Exposure to supply and other water-related risks varies among our geographies, processes, and product lines. We proactively minimize the effect of water risk for our locations and the locations of our suppliers through regular risk assessments using the World Resources Institute (WRI) Aqueduct Tool. We also conduct LCAs on our products to identify the amount of water embodied in each product. We routinely evaluate any process, product, regulatory, or price changes in our facilities as well as each site’s environmental footprint.
E NVI R ON M E NTAL R E S P ON S I B I L ITY
Water
The water data in this chapter were independently assured to a moderate level by SCS Global Services. For more information or to see the verification statement, please go to page 205 in the About the Report section.
2017 OWENS CORNING SUSTAINABILITY REPORT | PURPOSE + PEOPLE + ACTION | 89
E NVI R ON M E NTAL R E S P ON S I B I L ITY
Water
Our water conservation initiatives include reusing and recycling effluent water in facilities located in both water-stressed and non-stressed areas. Since 2010, we have considerably increased our water recirculation and recycling percentages. In keeping with our environmental policies and guidelines, we ensure that all our facilities meet or exceed requirements for release of effluents — and we implement reduction targets that go beyond regulatory compliance.
Our facilities comply with national, state, and local regulations and permits regarding water withdrawals and wastewater discharges. We have deployed advanced water treatment systems at our top three water-discharging facilities to ensure that the facilities’ discharge water is a higher quality than dictated by their permit levels. These initiatives have helped reduce our total water discharge by more than 1 million cubic meters per year from 2010 levels. Moreover, several of our facilities have achieved a zero-discharge level (other than water discharged for irrigation).
Water use, water discharge, and recycled and recirculated water are tracked monthly at the site level. Most of our data come from invoices and meter readings and are supplemented by calculations based on process knowledge and production levels. All sites are expected to follow our detailed water governance documentation to ensure standardization and accuracy.
Partnering with stakeholders at both local and broader levels helps us continually optimize water usage and reduce consumption and waste water. We consider stakeholder engagement critical to mitigating any future conflicts and we work to establish positive relationships with the communities in which we operate. We proactively engage with local stakeholders on an as-needed basis as well as during new builds.
Reducing Water Intensity
Owens Corning continues to pursue opportunities to reduce water usage across its global locations, targeting a 35% water intensity reduction by 2020 (using 2010 as the base year). In 2017, we surpassed our goal with a 41% reduction against the baseline year.
WATER WITHDRAWAL BY SOURCE
We source water for our operations from municipal water supplies, onsite wells, storm water, and from offsite water bodies and third parties. In 2017, we consumed a total of 11,033,336 cubic meters of water, a 9% absolute reduction compared with 2010. From 2016 to 2017, our absolute water withdrawal increased due to increased production, but our water use intensity decreased by 8%. More than 50% of the water we used in 2017 was taken from municipal water supplies.
Risk Assessment
We leverage the WRI Aqueduct Water Risk Mapping Tool to screen our sites and suppliers for high baseline water supply stress, 2025 projections for water supply stress changes, and frequency of drought, as well as upstream water quality. We combine the tool with internal knowledge in our facilities located in high-water-stress areas. In 2016, the top 87% of our supplier spend was analyzed for risk and impact. Annual self-assessments are also conducted by suppliers, and the results of the assessments are sent to us, including whether suppliers are setting goals to reduce water usage. The results of our 2016 analysis indicated that less than 2% of our segmented suppliers are in areas with high water stress.
The baseline water-stress index value from the WRI Aqueduct Tool is used to estimate current and future water availability at local levels. The index value is compared with the company’s projected water demand based on operational changes. We have developed water management plans to optimize water efficiency at facilities in water-stressed regions with high water demand.
In 2017, for the sixth straight year, we performed a footprint analysis of water-stressed areas. We identified eight of our facilities as high water risk. This number accounts for about 7% of our active manufacturing facilities and 2% of our total water use. Risks identified include flooding, declining quality and quantity; however, at this time we do not anticipate substantive impacts associated with any water risks.
Read more in our CDP Water 2018 Report, which will be published in the third quarter on our sustainability website.
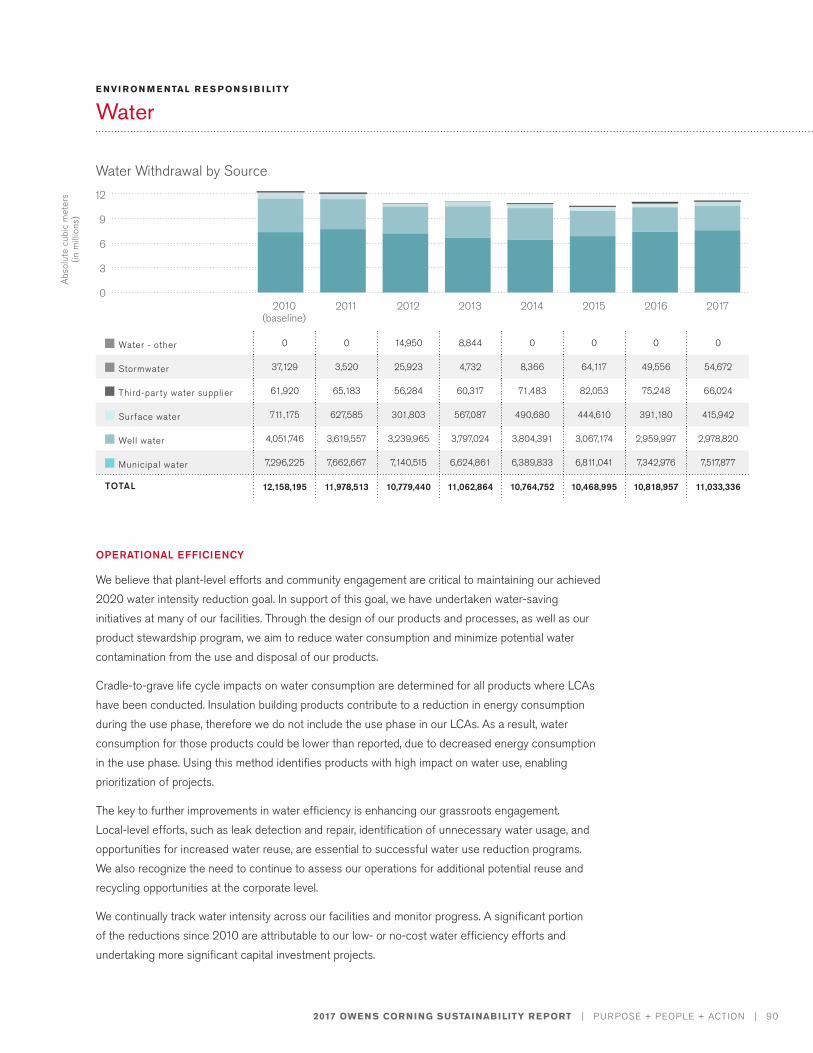
2017 OWENS CORNING SUSTAINABILITY REPORT | PURPOSE + PEOPLE + ACTION | 90
E NVI R ON M E NTAL R E S P ON S I B I L ITY
Water
OPERATIONAL EFFICIENCY
We believe that plant-level efforts and community engagement are critical to maintaining our achieved 2020 water intensity reduction goal. In support of this goal, we have undertaken water-saving initiatives at many of our facilities. Through the design of our products and processes, as well as our product stewardship program, we aim to reduce water consumption and minimize potential water contamination from the use and disposal of our products.
Cradle-to-grave life cycle impacts on water consumption are determined for all products where LCAs have been conducted. Insulation building products contribute to a reduction in energy consumption during the use phase, therefore we do not include the use phase in our LCAs. As a result, water consumption for those products could be lower than reported, due to decreased energy consumption in the use phase. Using this method identifies products with high impact on water use, enabling prioritization of projects.
The key to further improvements in water efficiency is enhancing our grassroots engagement. Local-level efforts, such as leak detection and repair, identification of unnecessary water usage, and opportunities for increased water reuse, are essential to successful water use reduction programs. We also recognize the need to continue to assess our operations for additional potential reuse and recycling opportunities at the corporate level.
We continually track water intensity across our facilities and monitor progress. A significant portion of the reductions since 2010 are attributable to our low- or no-cost water efficiency efforts and undertaking more significant capital investment projects.
12
9
6
3
0
Abs
olut
e cu
bic
met
ers
(in
mill
ions
)
Water - other 0 0 14,950 8,844 0 0 0 0
Stormwater 37,129 3,520 25,923 4,732 8,366 64,117 49,556 54,672
Third-party water supplier 61,920 65,183 56,284 60,317 71,483 82,053 75,248 66,024
Surface water 711,175 627,585 301,803 567,087 490,680 444,610 391,180 415,942
Well water 4,051,746 3,619,557 3,239,965 3,797,024 3,804,391 3,067,174 2,959,997 2,978,820
Municipal water 7,296,225 7,662,667 7,140,515 6,624,861 6,389,833 6,811,041 7,342,976 7,517,877
TOTAL 12,158,195 11,978,513 10,779,440 11,062,864 10,764,752 10,468,995 10,818,957 11,033,336
Water Withdrawal by Source
2012 2013 2014 2015 2016 20172010 (baseline)
2011
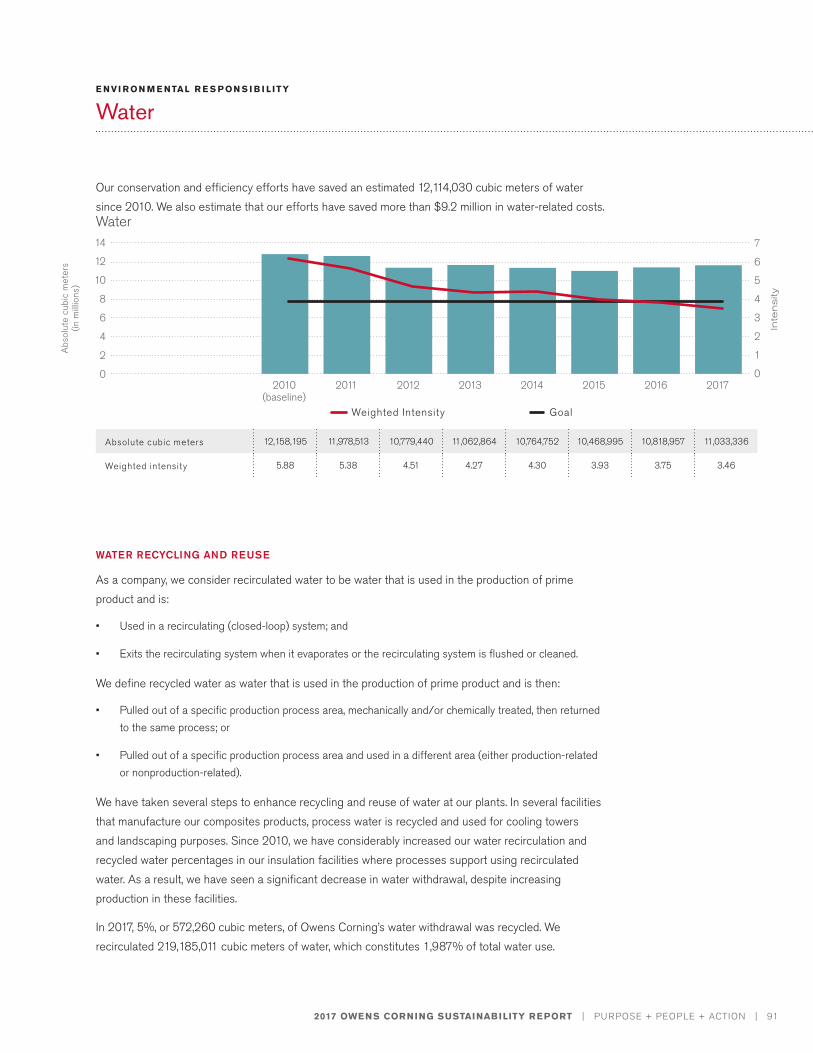
2017 OWENS CORNING SUSTAINABILITY REPORT | PURPOSE + PEOPLE + ACTION | 91
E NVI R ON M E NTAL R E S P ON S I B I L ITY
Water
Our conservation and efficiency efforts have saved an estimated 12,114,030 cubic meters of water since 2010. We also estimate that our efforts have saved more than $9.2 million in water-related costs.
WATER RECYCLING AND REUSE
As a company, we consider recirculated water to be water that is used in the production of prime product and is:
• Used in a recirculating (closed-loop) system; and
• Exits the recirculating system when it evaporates or the recirculating system is flushed or cleaned.
We define recycled water as water that is used in the production of prime product and is then:
• Pulled out of a specific production process area, mechanically and/or chemically treated, then returned to the same process; or
• Pulled out of a specific production process area and used in a different area (either production-related or nonproduction-related).
We have taken several steps to enhance recycling and reuse of water at our plants. In several facilities that manufacture our composites products, process water is recycled and used for cooling towers and landscaping purposes. Since 2010, we have considerably increased our water recirculation and recycled water percentages in our insulation facilities where processes support using recirculated water. As a result, we have seen a significant decrease in water withdrawal, despite increasing production in these facilities.
In 2017, 5%, or 572,260 cubic meters, of Owens Corning’s water withdrawal was recycled. We recirculated 219,185,011 cubic meters of water, which constitutes 1,987% of total water use.
7
6
5
4
3
2
1
0
Inte
nsity8
10
12
14
6
4
2
0
Abs
olut
e cu
bic
met
ers
(in m
illio
ns)
Absolute cubic meters 12,158,195 11,978,513 10,779,440 11,062,864 10,764,752 10,468,995 10,818,957 11,033,336
Weighted intensity 5.88 5.38 4.51 4.27 4.30 3.93 3.75 3.46
2012 2013 2014 2015 2016 20172010 (baseline)
2011
Weighted Intensity Goal
Water
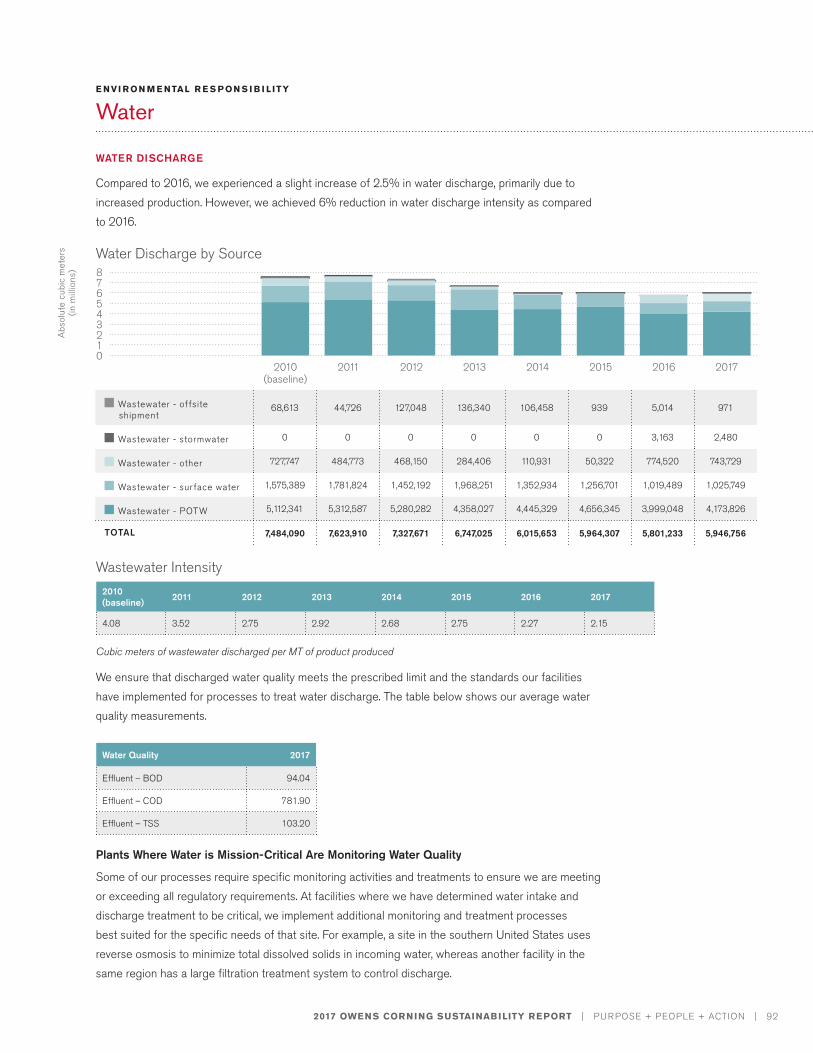
2017 OWENS CORNING SUSTAINABILITY REPORT | PURPOSE + PEOPLE + ACTION | 92
E NVI R ON M E NTAL R E S P ON S I B I L ITY
Water
WATER DISCHARGE
Compared to 2016, we experienced a slight increase of 2.5% in water discharge, primarily due to increased production. However, we achieved 6% reduction in water discharge intensity as compared to 2016.
We ensure that discharged water quality meets the prescribed limit and the standards our facilities have implemented for processes to treat water discharge. The table below shows our average water quality measurements.
Plants Where Water is Mission-Critical Are Monitoring Water Quality
Some of our processes require specific monitoring activities and treatments to ensure we are meeting or exceeding all regulatory requirements. At facilities where we have determined water intake and discharge treatment to be critical, we implement additional monitoring and treatment processes best suited for the specific needs of that site. For example, a site in the southern United States uses reverse osmosis to minimize total dissolved solids in incoming water, whereas another facility in the same region has a large filtration treatment system to control discharge.
2012 2013 2014 2015 2016 20172010 (baseline)
2011
Wastewater - offsite shipment
68,613 44,726 127,048 136,340 106,458 939 5,014 971
Wastewater - stormwater 0 0 0 0 0 0 3,163 2,480
Wastewater - other 727,747 484,773 468,150 284,406 110,931 50,322 774,520 743,729
Wastewater - surface water 1,575,389 1,781,824 1,452,192 1,968,251 1,352,934 1,256,701 1,019,489 1,025,749
Wastewater - POTW 5,112,341 5,312,587 5,280,282 4,358,027 4,445,329 4,656,345 3,999,048 4,173,826
TOTAL 7,484,090 7,623,910 7,327,671 6,747,025 6,015,653 5,964,307 5,801,233 5,946,756
45678
3210
Abs
olut
e cu
bic
met
ers
(in m
illio
ns)
Water Discharge by Source
Wastewater Intensity2010 (baseline) 2011 2012 2013 2014 2015 2016 2017
4.08 3.52 2.75 2.92 2.68 2.75 2.27 2.15
Water Quality 2017
Effluent – BOD 94.04
Effluent – COD 781.90
Effluent – TSS 103.20
Cubic meters of wastewater discharged per MT of product produced
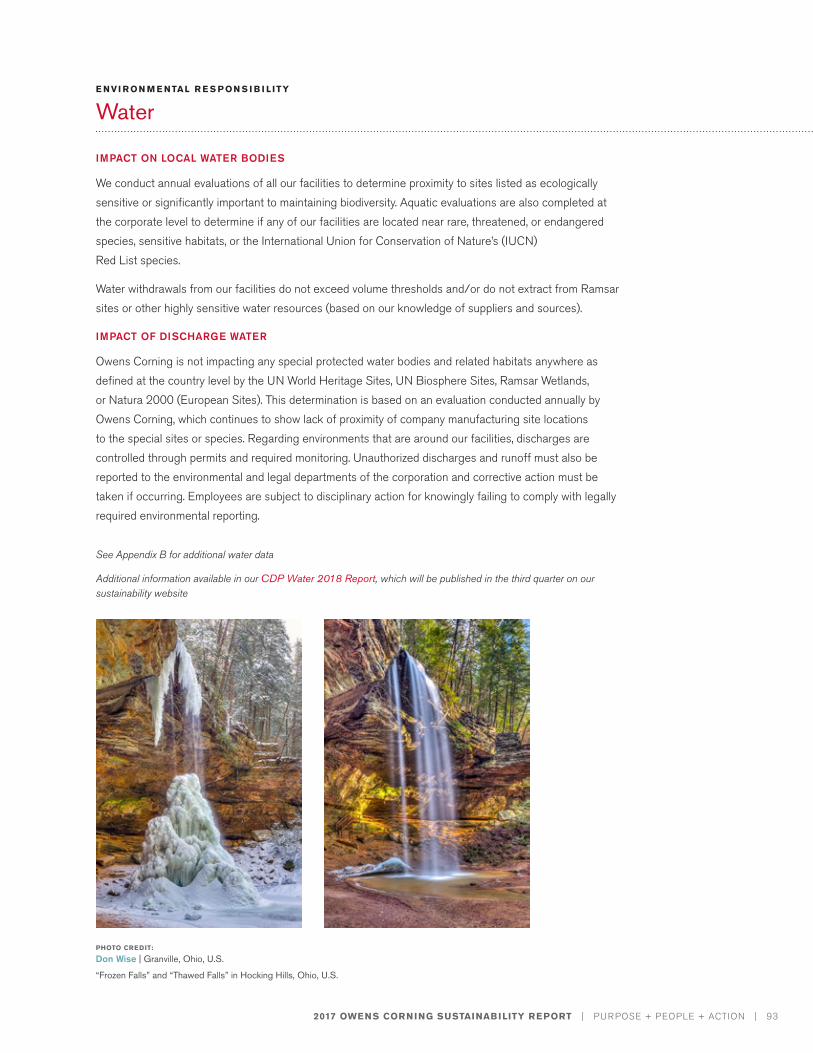
2017 OWENS CORNING SUSTAINABILITY REPORT | PURPOSE + PEOPLE + ACTION | 93
E NVI R ON M E NTAL R E S P ON S I B I L ITY
Water
IMPACT ON LOCAL WATER BODIES
We conduct annual evaluations of all our facilities to determine proximity to sites listed as ecologically sensitive or significantly important to maintaining biodiversity. Aquatic evaluations are also completed at the corporate level to determine if any of our facilities are located near rare, threatened, or endangered species, sensitive habitats, or the International Union for Conservation of Nature’s (IUCN) Red List species.
Water withdrawals from our facilities do not exceed volume thresholds and/or do not extract from Ramsar sites or other highly sensitive water resources (based on our knowledge of suppliers and sources).
IMPACT OF DISCHARGE WATER
Owens Corning is not impacting any special protected water bodies and related habitats anywhere as defined at the country level by the UN World Heritage Sites, UN Biosphere Sites, Ramsar Wetlands, or Natura 2000 (European Sites). This determination is based on an evaluation conducted annually by Owens Corning, which continues to show lack of proximity of company manufacturing site locations to the special sites or species. Regarding environments that are around our facilities, discharges are controlled through permits and required monitoring. Unauthorized discharges and runoff must also be reported to the environmental and legal departments of the corporation and corrective action must be taken if occurring. Employees are subject to disciplinary action for knowingly failing to comply with legally required environmental reporting.
See Appendix B for additional water data
Additional information available in our CDP Water 2018 Report, which will be published in the third quarter on our sustainability website
PHOTO CREDIT:
Don Wise | Granville, Ohio, U.S.
“Frozen Falls” and “Thawed Falls” in Hocking Hills, Ohio, U.S.
2017 OWENS CORNING SUSTAINABILITY REPORT | PURPOSE + PEOPLE + ACTION | 94
PHOTO CREDIT:
Katy Eisenstein | Toledo, Ohio, U.S.
In the Butterfly House at Put-in-Bay, Ohio, U.S.
Owens Corning’s Goal:Reduce waste-to-landfill intensity by 70% by 2020 vs. 2010 baseline
Our Waste efforts align with the following UN SDG:
W aste management is a high priority at Owens Corning, beginning with the operational efficiency of our production processes and extending to how we use, reuse, repurpose, recycle, and dispose of materials generated from our facilities.
We are focused on becoming zero waste to landfill (WTL), and we continuously look for beneficial uses for our byproducts and other waste materials.
STRATEGY AND APPROACH
As part of our waste management plan and our journey to achieve zero waste, we are continually looking for alternatives to using landfills and for solutions to minimize waste through source reduction and reuse/recycle techniques. During the initial design phase and through continuous improvement efforts, we seek to increase the percentage of recycled content in our products and packaging materials. We have established ourselves as one of the largest users of recycled glass in the world by using more than 1 billion pounds annually. Our collaboration with other companies reinforces our commitment to better waste management by enabling us to increase the recycling of glass containers and factory waste. By sourcing recycled glass, we have significantly reduced community landfill waste as well as reduced our energy usage in manufacturing insulation.
Our waste reduction strategy also focuses on reducing waste during the complete life cycle of our products. We have established a product stewardship review process, which is conducted at various stages, including design, development, test market, manufacture, and distribution, to conserve resources and prevent waste through our business operations.
We ensure that we meet all the regulatory requirements related to waste, and we implement reduction efforts beyond compliance. We conduct periodic assessments to ensure compliance with internal and external standards, guidelines, and laws.
E NVI R ON M E NTAL R E S P ON S I B I L ITY
Waste
The waste data in this chapter were independently assured to a moderate level by SCS Global Services. For more information or to see the verification statement, please go to page 205 in the About the Report section.
2017 OWENS CORNING SUSTAINABILITY REPORT | PURPOSE + PEOPLE + ACTION | 95
E NVI R ON M E NTAL R E S P ON S I B I L ITY
Waste
Pursuing Our Waste Reduction Agenda
From 2002 to 2012, we achieved a 35% reduction in our waste-to-landfill intensity. In 2010, we set a new baseline and established a goal to reduce our WTL intensity by 70% by 2020. Making progress toward this goal has been one of our biggest sustainability challenges. We are currently at only a 4% reduction in WTL intensity compared with the 2010 baseline, even though our diverted waste is 48% of the total waste in 2017. Nonetheless, our long-term goal remains at zero WTL.
In response to this challenge, our businesses are continually seeking opportunities to reduce waste at the facility level and their performance is being reported at the enterprise level. To achieve our targets, we conduct periodic reviews to assess the progress and take necessary corrective actions. We have appointed a global WTL leader, Michele Mazza, within the sustainability organization to drive WTL reductions and foster relationships with internal and external stakeholders. Additionally, the Composites organization has identified a leader to specifically lead, prioritize, and track waste reduction efforts across the Composites business.
Owens Corning continues to evaluate and improve upon the methods and mechanisms being used to track all waste streams that are ultimately landfilled, recycled, or reused. When waste management or recycler invoices are available, those are utilized for data reporting; otherwise, we rely on onsite weigh scales, or in the absence of scales, we rely on calculated estimates to determine the weights of our shipments. We depend on the final disposition of the material for metrics. As a company, we not only focus on WTL intensity but also our WTL diversion rate.
While we remain committed to our goals, we do not currently have a direct line of sight to the 70% goal even with the known internal and external opportunities to recycle, reuse, and reduce waste going to the landfill. As an organization, we will continue to pursue opportunities to meet our zero WTL goal with passion and vigor.
WASTE MANAGEMENT INITIATIVES
Following the announcement of our first set of sustainability goals in 2006, Owens Corning plants began actively pursuing and engaging in waste reduction efforts. Their efforts furthered the recycling of many of our packaging materials, cardboard, paper, plastic, poly, totes, and metals, but had limited success in identifying recycling outlets and alternative applications for their plant’s process waste streams. Shortly after the establishment of Owens Corning’s second set of sustainability goals in 2010, it became evident that we would need designated resources focused on waste reduction to help us move toward our ultimate goal of zero waste.
Understanding our waste data was a critical catalyst for both our plants and corporate facilities. This knowledge helped focus our efforts and justify the need for resources across our businesses that could identify and develop both internal and external solutions for our process waste streams. With this network of resources and a centralized contact for waste reduction initiatives, we are now able to regularly share ideas, waste reduction best practices, and recycling outlets across our network of plants, businesses, and research and development.
2017 OWENS CORNING SUSTAINABILITY REPORT | PURPOSE + PEOPLE + ACTION | 96
E NVI R ON M E NTAL R E S P ON S I B I L ITY
Waste
Improved communication and plant engagement have created opportunities:
• An outlet previously used exclusively to repurpose off-spec shingles from Owens Corning’s roofing plants began also repurposing off-spec insulation.
• The program above prompted one of our insulation plants to find yet another local outlet for insulation in 2017.
• All our U.S. roofing and non-wovens plants now are able to send byproducts to an outside manufacturer for reuse. This outlet was previously limited to just a few roofing plants.
• In 2017, one of our composites plants identified yet another new outlet for non-wovens scrap.
• One of our composites plants identified an outlet that has enabled repurposing of off-spec materials from our U.S. and European manufacturing plants into alternative end-use applications across Asia Pacific.
• Following an Owens Corning networking function, our Mexico City plant is now taking advantage of a recycling outlet shared with its sister plant in Tlaxcala, Mexico.
• A recycling outlet for composite byproducts from one of our Canadian plants is now taking materials from Tlaxcala, Mexico, and Amarillo, Texas.
• One of our mineral wool plants identified several external end-use applications for raw material “fines” that are not able to be used in the manufacturing process.
In addition to expanding upon existing programs, Owens Corning teams are pursuing waste reduction initiatives at multiple levels and across various functional areas:
• In 2016, Owens Corning’s composite reinforcements plant in Rio Claro, Brazil, installed a second shredder to process byproducts from its operations, resulting in a 52% increase in materials being repurposed.
• One of Owens Corning’s mineral wool plants has been working with Waste Hub, an engineering/marketing firm, to develop a process that will not only reduce WTL, but also turn two of their waste streams into revenue-generating products. Implementation of this program is planned for mid-2018.
• The Composites business has formed a cross-functional team called the “Material Revolution,” the purpose of which is to help identify, prioritize, and drive waste reduction, reuse, and repurpose efforts across the business.
• We have recently executed an agreement with a recycler that has an end-use application that could potentially re-use nearly all the composite byproducts generated by our Jackson, Tennessee, and Amarillo, Texas, plants. Implementation of this program is planned for mid-2018.
• Owens Corning’s Sourcing group has actively engaged the support of our waste management partners to identify and deliver WTL reduction opportunities.
PHOTO CREDIT:
Michael Todd | Jackson, Tennessee, U.S.
“Sparkling Violetear, a gem among hummingbirds,” as seen near Bogota, Columbia
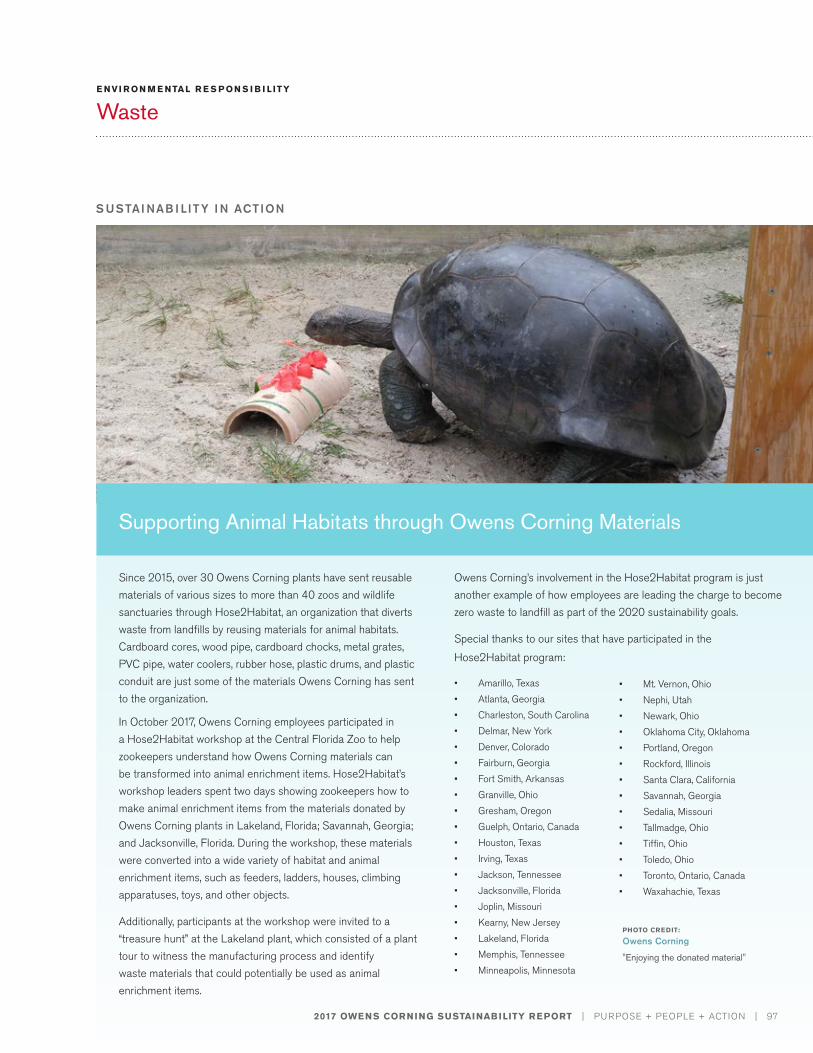
S USTAI NAB I LITY I N ACTION
2017 OWENS CORNING SUSTAINABILITY REPORT | PURPOSE + PEOPLE + ACTION | 97
Supporting Animal Habitats through Owens Corning Materials
Since 2015, over 30 Owens Corning plants have sent reusable materials of various sizes to more than 40 zoos and wildlife sanctuaries through Hose2Habitat, an organization that diverts waste from landfills by reusing materials for animal habitats. Cardboard cores, wood pipe, cardboard chocks, metal grates, PVC pipe, water coolers, rubber hose, plastic drums, and plastic conduit are just some of the materials Owens Corning has sent to the organization.
In October 2017, Owens Corning employees participated in a Hose2Habitat workshop at the Central Florida Zoo to help zookeepers understand how Owens Corning materials can be transformed into animal enrichment items. Hose2Habitat’s workshop leaders spent two days showing zookeepers how to make animal enrichment items from the materials donated by Owens Corning plants in Lakeland, Florida; Savannah, Georgia; and Jacksonville, Florida. During the workshop, these materials were converted into a wide variety of habitat and animal enrichment items, such as feeders, ladders, houses, climbing apparatuses, toys, and other objects.
Additionally, participants at the workshop were invited to a “treasure hunt” at the Lakeland plant, which consisted of a plant tour to witness the manufacturing process and identify waste materials that could potentially be used as animal enrichment items.
Owens Corning’s involvement in the Hose2Habitat program is just another example of how employees are leading the charge to become zero waste to landfill as part of the 2020 sustainability goals.
Special thanks to our sites that have participated in the
Hose2Habitat program:
• Amarillo, Texas• Atlanta, Georgia• Charleston, South Carolina• Delmar, New York• Denver, Colorado• Fairburn, Georgia• Fort Smith, Arkansas• Granville, Ohio• Gresham, Oregon• Guelph, Ontario, Canada• Houston, Texas• Irving, Texas• Jackson, Tennessee• Jacksonville, Florida• Joplin, Missouri• Kearny, New Jersey• Lakeland, Florida• Memphis, Tennessee• Minneapolis, Minnesota
E NVI R ON M E NTAL R E S P ON S I B I L ITY
Waste
• Mt. Vernon, Ohio• Nephi, Utah• Newark, Ohio• Oklahoma City, Oklahoma• Portland, Oregon• Rockford, Illinois• Santa Clara, California• Savannah, Georgia• Sedalia, Missouri• Tallmadge, Ohio• Tiffin, Ohio• Toledo, Ohio• Toronto, Ontario, Canada• Waxahachie, Texas
PHOTO CREDIT:
Owens Corning
"Enjoying the donated material"
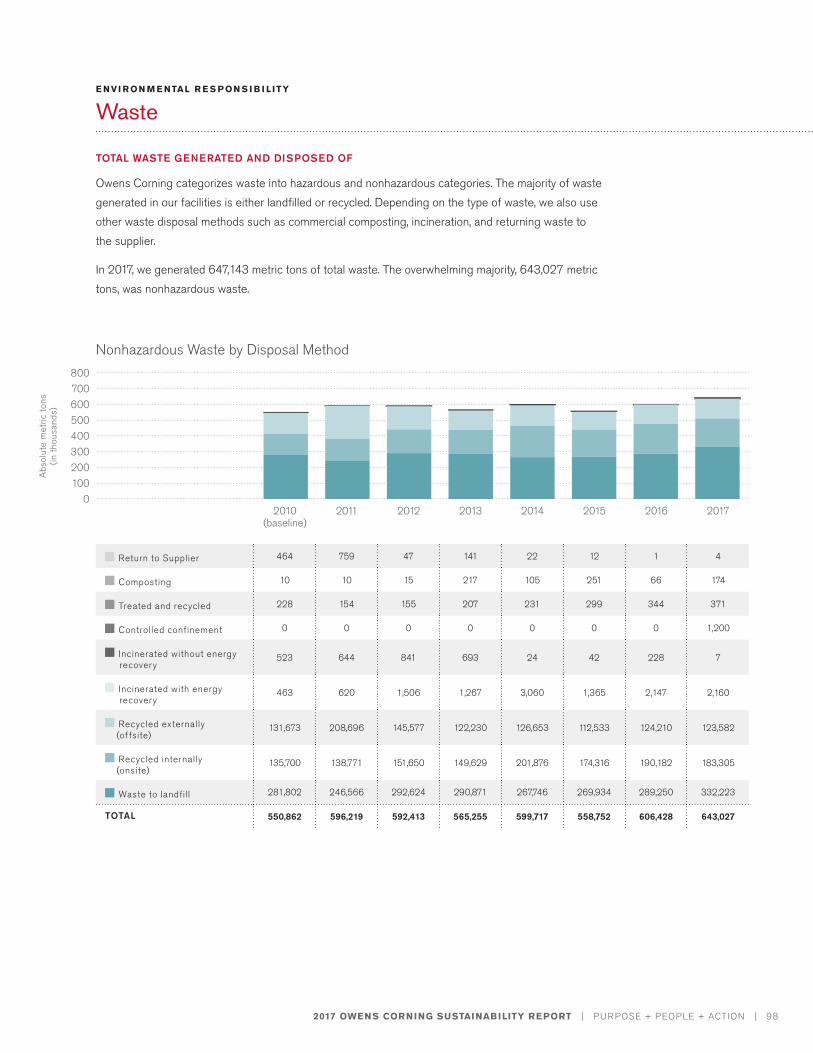
2017 OWENS CORNING SUSTAINABILITY REPORT | PURPOSE + PEOPLE + ACTION | 98
TOTAL WASTE GENERATED AND DISPOSED OF
Owens Corning categorizes waste into hazardous and nonhazardous categories. The majority of waste generated in our facilities is either landfilled or recycled. Depending on the type of waste, we also use other waste disposal methods such as commercial composting, incineration, and returning waste to the supplier.
In 2017, we generated 647,143 metric tons of total waste. The overwhelming majority, 643,027 metric tons, was nonhazardous waste.
E NVI R ON M E NTAL R E S P ON S I B I L ITY
Waste
Return to Supplier 464 759 47 141 22 12 1 4
Composting 10 10 15 217 105 251 66 174
Treated and recycled 228 154 155 207 231 299 344 371
Controlled confinement 0 0 0 0 0 0 0 1,200
Incinerated without energy recovery
523 644 841 693 24 42 228 7
Incinerated with energy recovery
463 620 1,506 1,267 3,060 1,365 2,147 2,160
Recycled externally (offsite)
131,673 208,696 145,577 122,230 126,653 112,533 124,210 123,582
Recycled internally (onsite)
135,700 138,771 151,650 149,629 201,876 174,316 190,182 183,305
Waste to landfill 281,802 246,566 292,624 290,871 267,746 269,934 289,250 332,223
TOTAL 550,862 596,219 592,413 565,255 599,717 558,752 606,428 643,027
400500600700800
300200100
0
Abs
olut
e m
etric
tons
(in
thou
sand
s)
Nonhazardous Waste by Disposal Method
2012 2013 2014 2015 2016 20172010 (baseline)
2011
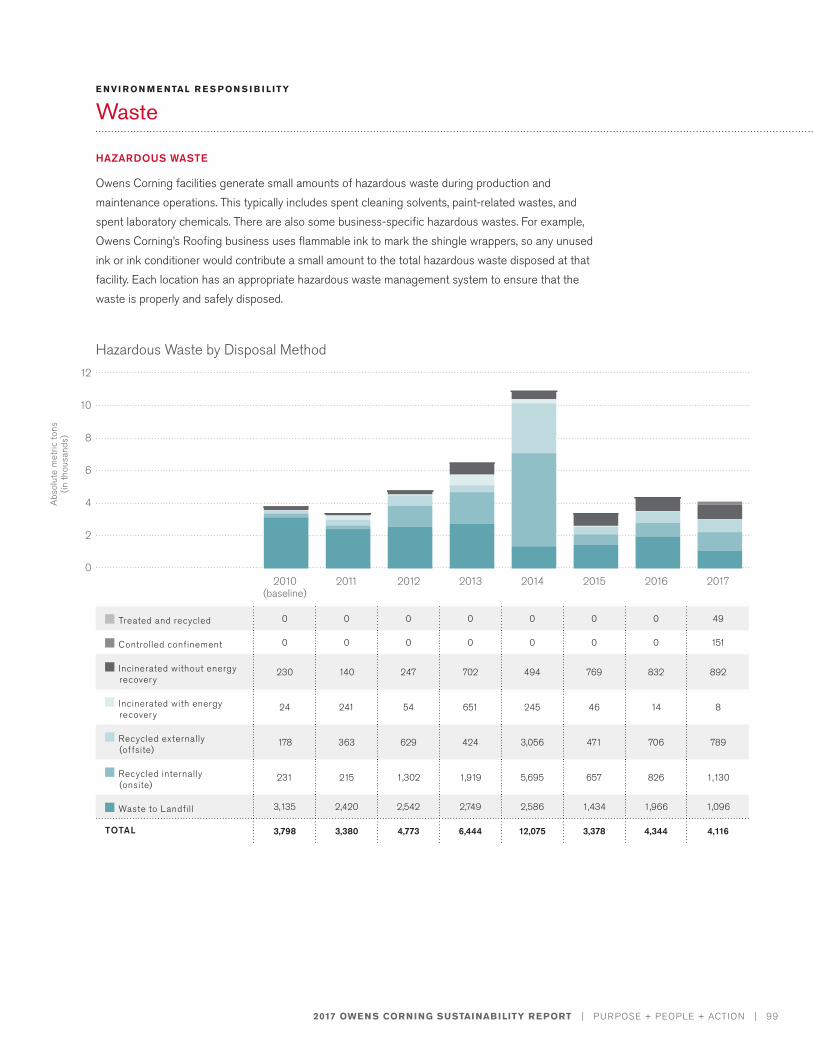
2017 OWENS CORNING SUSTAINABILITY REPORT | PURPOSE + PEOPLE + ACTION | 99
E NVI R ON M E NTAL R E S P ON S I B I L ITY
Waste
HAZARDOUS WASTE
Owens Corning facilities generate small amounts of hazardous waste during production and maintenance operations. This typically includes spent cleaning solvents, paint-related wastes, and spent laboratory chemicals. There are also some business-specific hazardous wastes. For example, Owens Corning’s Roofing business uses flammable ink to mark the shingle wrappers, so any unused ink or ink conditioner would contribute a small amount to the total hazardous waste disposed at that facility. Each location has an appropriate hazardous waste management system to ensure that the waste is properly and safely disposed.
Treated and recycled 0 0 0 0 0 0 0 49
Controlled confinement 0 0 0 0 0 0 0 151
Incinerated without energy recovery
230 140 247 702 494 769 832 892
Incinerated with energy recovery
24 241 54 651 245 46 14 8
Recycled externally (offsite)
178 363 629 424 3,056 471 706 789
Recycled internally (onsite)
231 215 1,302 1,919 5,695 657 826 1,130
Waste to Landfill 3,135 2,420 2,542 2,749 2,586 1,434 1,966 1,096
TOTAL 3,798 3,380 4,773 6,444 12,075 3,378 4,344 4,116
10
12
8
6
4
2
0
Abs
olut
e m
etric
tons
(in
thou
sand
s)
Hazardous Waste by Disposal Method
2012 2013 2014 2015 2016 20172010 (baseline)
2011
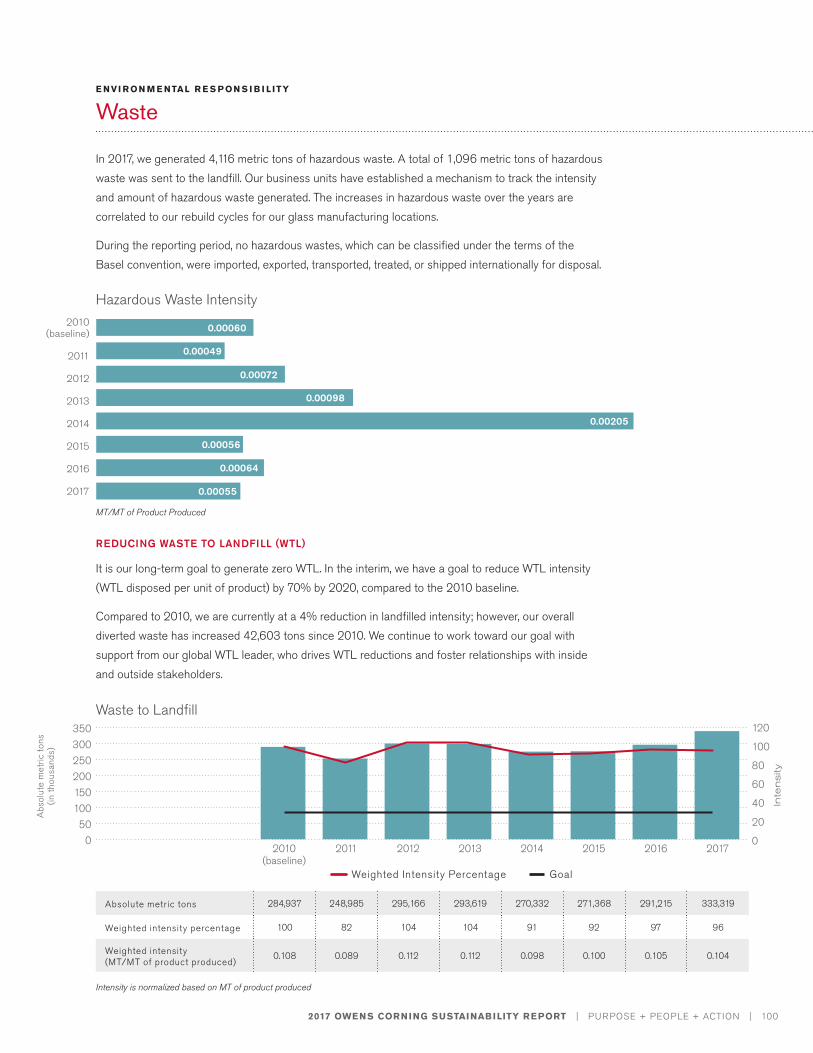
2017 OWENS CORNING SUSTAINABILITY REPORT | PURPOSE + PEOPLE + ACTION | 100
E NVI R ON M E NTAL R E S P ON S I B I L ITY
Waste
In 2017, we generated 4,116 metric tons of hazardous waste. A total of 1,096 metric tons of hazardous waste was sent to the landfill. Our business units have established a mechanism to track the intensity and amount of hazardous waste generated. The increases in hazardous waste over the years are correlated to our rebuild cycles for our glass manufacturing locations.
During the reporting period, no hazardous wastes, which can be classified under the terms of the Basel convention, were imported, exported, transported, treated, or shipped internationally for disposal.
REDUCING WASTE TO LANDFILL (WTL)
It is our long-term goal to generate zero WTL. In the interim, we have a goal to reduce WTL intensity (WTL disposed per unit of product) by 70% by 2020, compared to the 2010 baseline.
Compared to 2010, we are currently at a 4% reduction in landfilled intensity; however, our overall diverted waste has increased 42,603 tons since 2010. We continue to work toward our goal with support from our global WTL leader, who drives WTL reductions and foster relationships with inside and outside stakeholders.
2010 (baseline)
2012
2011
2013
2014
2015
2016
2017
0.00060
0.00049
0.00072
0.00098
0.00205
0.00056
0.00055
0.00064
Hazardous Waste Intensity
Waste to Landfill
300350
25020015010050
0
Abs
olut
e m
etric
tons
(in
thou
sand
s)
120
100
80
60
40
20
0
Inte
nsity
Absolute metric tons 284,937 248,985 295,166 293,619 270,332 271,368 291,215 333,319
Weighted intensity percentage 100 82 104 104 91 92 97 96
Weighted intensity (MT/MT of product produced)
0.108 0.089 0.112 0.112 0.098 0.100 0.105 0.104
2012 2013 2014 2015 2016 20172010 (baseline)
2011
Weighted Intensity Percentage Goal
Intensity is normalized based on MT of product produced
MT/MT of Product Produced
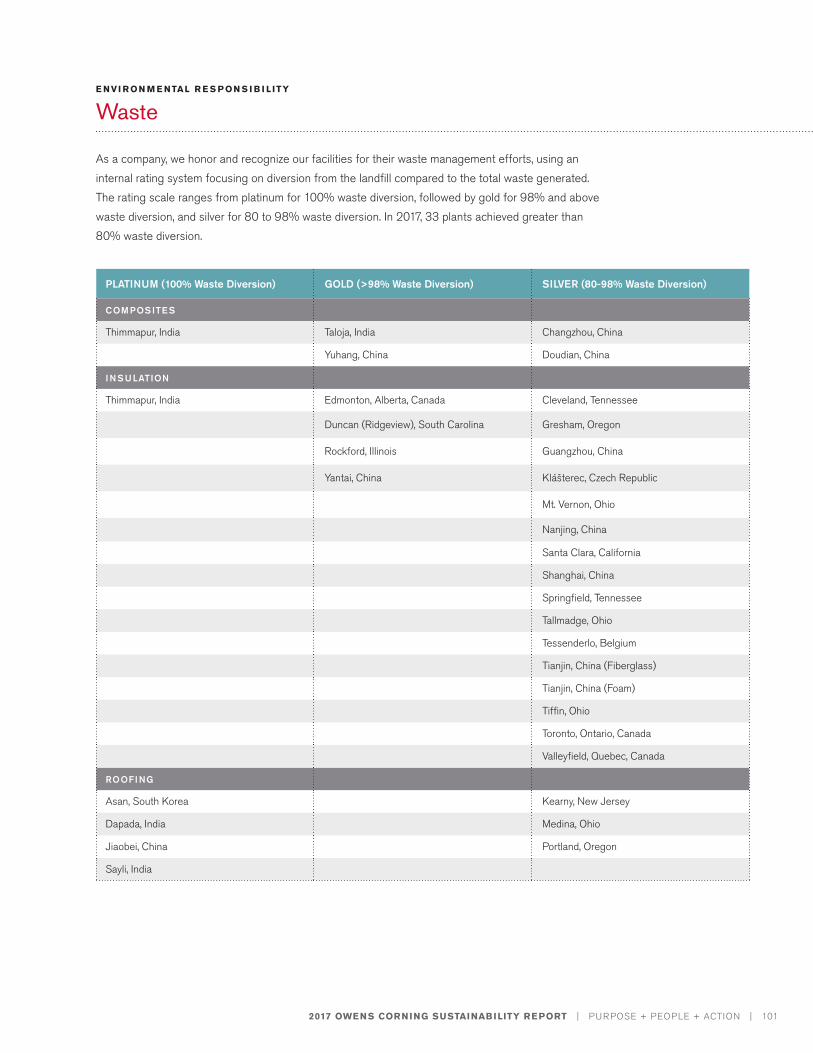
2017 OWENS CORNING SUSTAINABILITY REPORT | PURPOSE + PEOPLE + ACTION | 101
As a company, we honor and recognize our facilities for their waste management efforts, using an internal rating system focusing on diversion from the landfill compared to the total waste generated. The rating scale ranges from platinum for 100% waste diversion, followed by gold for 98% and above waste diversion, and silver for 80 to 98% waste diversion. In 2017, 33 plants achieved greater than 80% waste diversion.
E NVI R ON M E NTAL R E S P ON S I B I L ITY
Waste
PLATINUM (100% Waste Diversion) GOLD (>98% Waste Diversion) SILVER (80-98% Waste Diversion)
COMPOSITES
Thimmapur, India Taloja, India Changzhou, China
Yuhang, China Doudian, China
INSULATION
Thimmapur, India Edmonton, Alberta, Canada Cleveland, Tennessee
Duncan (Ridgeview), South Carolina Gresham, Oregon
Rockford, Illinois Guangzhou, China
Yantai, China Klášterec, Czech Republic
Mt. Vernon, Ohio
Nanjing, China
Santa Clara, California
Shanghai, China
Springfield, Tennessee
Tallmadge, Ohio
Tessenderlo, Belgium
Tianjin, China (Fiberglass)
Tianjin, China (Foam)
Tiffin, Ohio
Toronto, Ontario, Canada
Valleyfield, Quebec, Canada
ROOFING
Asan, South Korea Kearny, New Jersey
Dapada, India Medina, Ohio
Jiaobei, China Portland, Oregon
Sayli, India
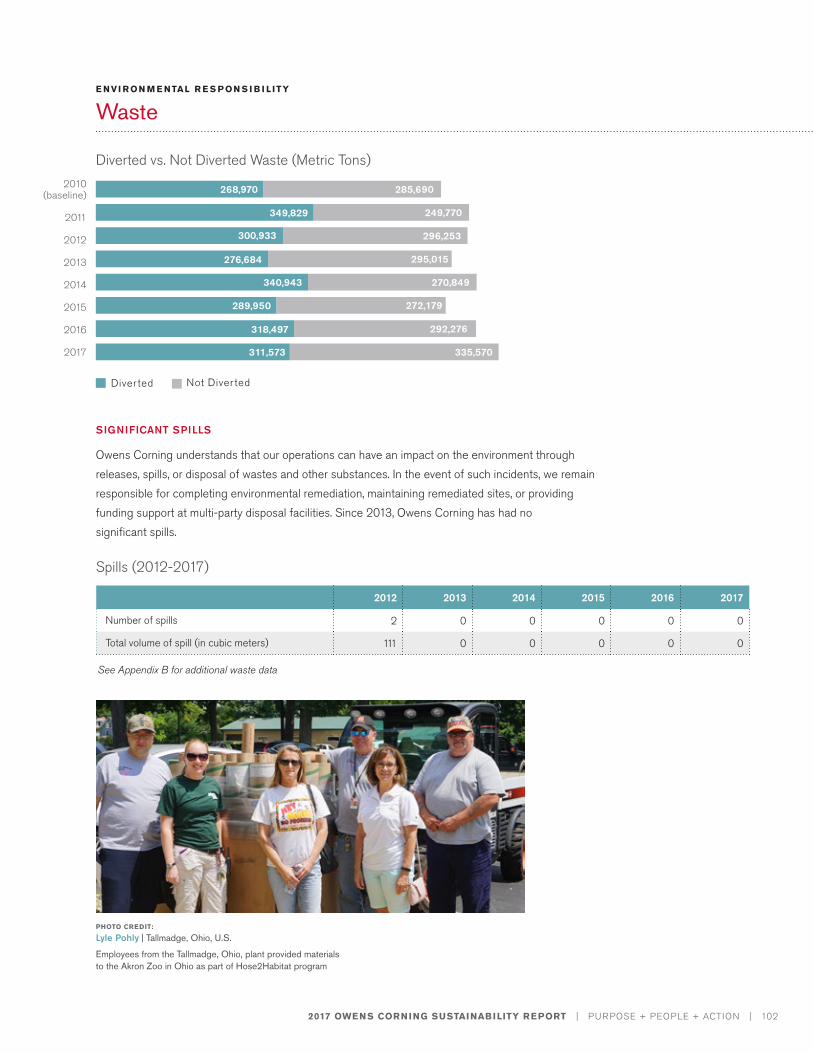
2017 OWENS CORNING SUSTAINABILITY REPORT | PURPOSE + PEOPLE + ACTION | 102
E NVI R ON M E NTAL R E S P ON S I B I L ITY
Waste
2010 (baseline)
2012
2011
2013
2014
2015
2016
2017
SIGNIFICANT SPILLS
Owens Corning understands that our operations can have an impact on the environment through releases, spills, or disposal of wastes and other substances. In the event of such incidents, we remain responsible for completing environmental remediation, maintaining remediated sites, or providing funding support at multi-party disposal facilities. Since 2013, Owens Corning has had no significant spills.
Spills (2012-2017)
2012 2013 2014 2015 2016 2017
Number of spills 2 0 0 0 0 0
Total volume of spill (in cubic meters) 111 0 0 0 0 0
PHOTO CREDIT:
Lyle Pohly | Tallmadge, Ohio, U.S.
Employees from the Tallmadge, Ohio, plant provided materials to the Akron Zoo in Ohio as part of Hose2Habitat program
See Appendix B for additional waste data
285,690268,970
349,829 249,770
300,933 296,253
276,684 295,015
340,943 270,849
289,950 272,179
318,497 292,276
311,573 335,570
Diverted vs. Not Diverted Waste (Metric Tons)
Diverted Not Diverted
S USTAI NAB I LITY I N ACTION
2017 OWENS CORNING SUSTAINABILITY REPORT | PURPOSE + PEOPLE + ACTION | 103
E NVI R ON M E NTAL R E S P ON S I B I L ITY
Waste
Composites Business' Approach to Reducing Waste Globally
Within the Composites business, a key premise of its sustainability mission is to significantly reduce the amount of glass directed to landfills, with a vision that Composites should be a source of ever-reusable material. To achieve this goal, the business developed Material Revolution – a comprehensive approach to minimizing waste and efficiently using resources.
This program is supported by four key workstreams:
• Reduction: Eliminating waste at its source
• Reuse: Processing waste to reintroduce as input
• Recycle: Using waste in its current form (in commercial applications)
• Returning: Implementing eco-friendly processes to return waste to the earth
In 2017, the Material Revolution team focused on developing an automated process that enables the business to easily track and quantify material waste in its manufacturing process, with the goal of reducing the quantity of that byproduct which ends up in a landfill. The business also appointed technical fabrics transformation leader Beth Dufresne, as project leader for its zero WTL commitments. In this role, Beth has been charged with coordinating these efforts and accelerating progress. She is also establishing a governance structure for Material Revolution to support business engagement and cross-functional excellence in execution of this vision.
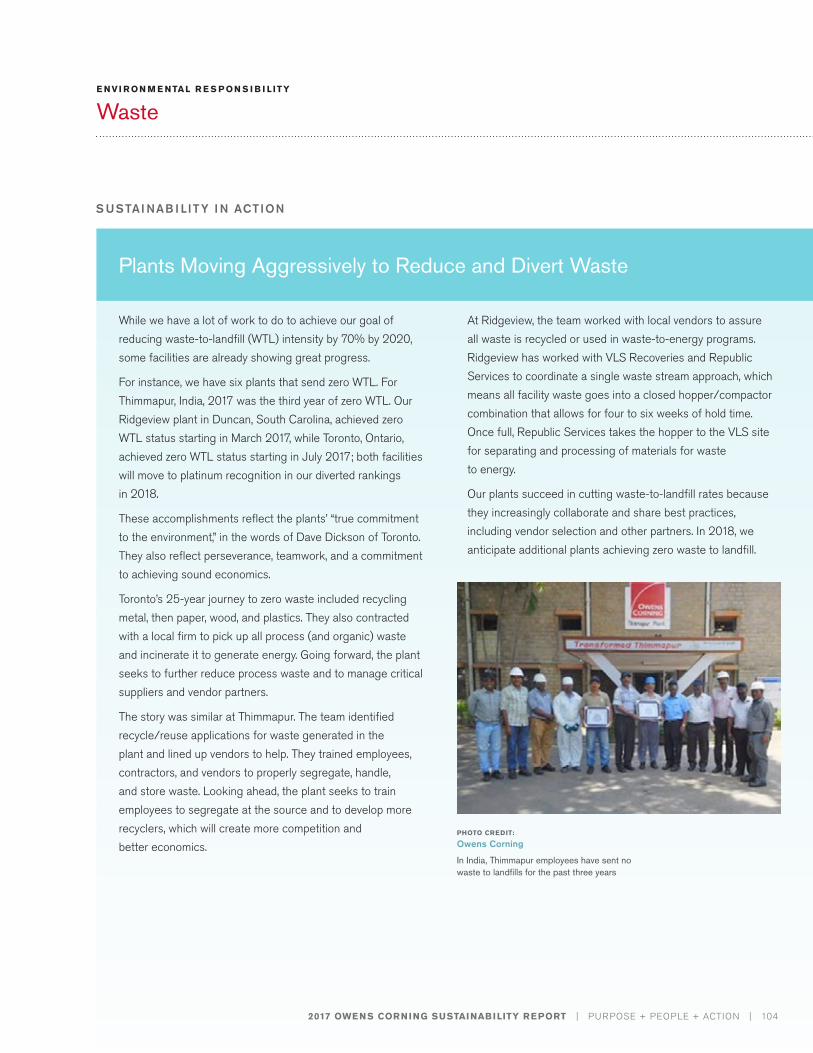
S USTAI NAB I LITY I N ACTION
2017 OWENS CORNING SUSTAINABILITY REPORT | PURPOSE + PEOPLE + ACTION | 104
E NVI R ON M E NTAL R E S P ON S I B I L ITY
Waste
While we have a lot of work to do to achieve our goal of reducing waste-to-landfill (WTL) intensity by 70% by 2020, some facilities are already showing great progress.
For instance, we have six plants that send zero WTL. For Thimmapur, India, 2017 was the third year of zero WTL. Our Ridgeview plant in Duncan, South Carolina, achieved zero WTL status starting in March 2017, while Toronto, Ontario, achieved zero WTL status starting in July 2017; both facilities will move to platinum recognition in our diverted rankings in 2018.
These accomplishments reflect the plants’ “true commitment to the environment,” in the words of Dave Dickson of Toronto. They also reflect perseverance, teamwork, and a commitment to achieving sound economics.
Toronto’s 25-year journey to zero waste included recycling metal, then paper, wood, and plastics. They also contracted with a local firm to pick up all process (and organic) waste and incinerate it to generate energy. Going forward, the plant seeks to further reduce process waste and to manage critical suppliers and vendor partners.
The story was similar at Thimmapur. The team identified recycle/reuse applications for waste generated in the plant and lined up vendors to help. They trained employees, contractors, and vendors to properly segregate, handle, and store waste. Looking ahead, the plant seeks to train employees to segregate at the source and to develop more recyclers, which will create more competition and better economics.
At Ridgeview, the team worked with local vendors to assure all waste is recycled or used in waste-to-energy programs. Ridgeview has worked with VLS Recoveries and Republic Services to coordinate a single waste stream approach, which means all facility waste goes into a closed hopper/compactor combination that allows for four to six weeks of hold time. Once full, Republic Services takes the hopper to the VLS site for separating and processing of materials for waste to energy.
Our plants succeed in cutting waste-to-landfill rates because they increasingly collaborate and share best practices, including vendor selection and other partners. In 2018, we anticipate additional plants achieving zero waste to landfill.
Plants Moving Aggressively to Reduce and Divert Waste
PHOTO CREDIT:
Owens Corning
In India, Thimmapur employees have sent no waste to landfills for the past three years
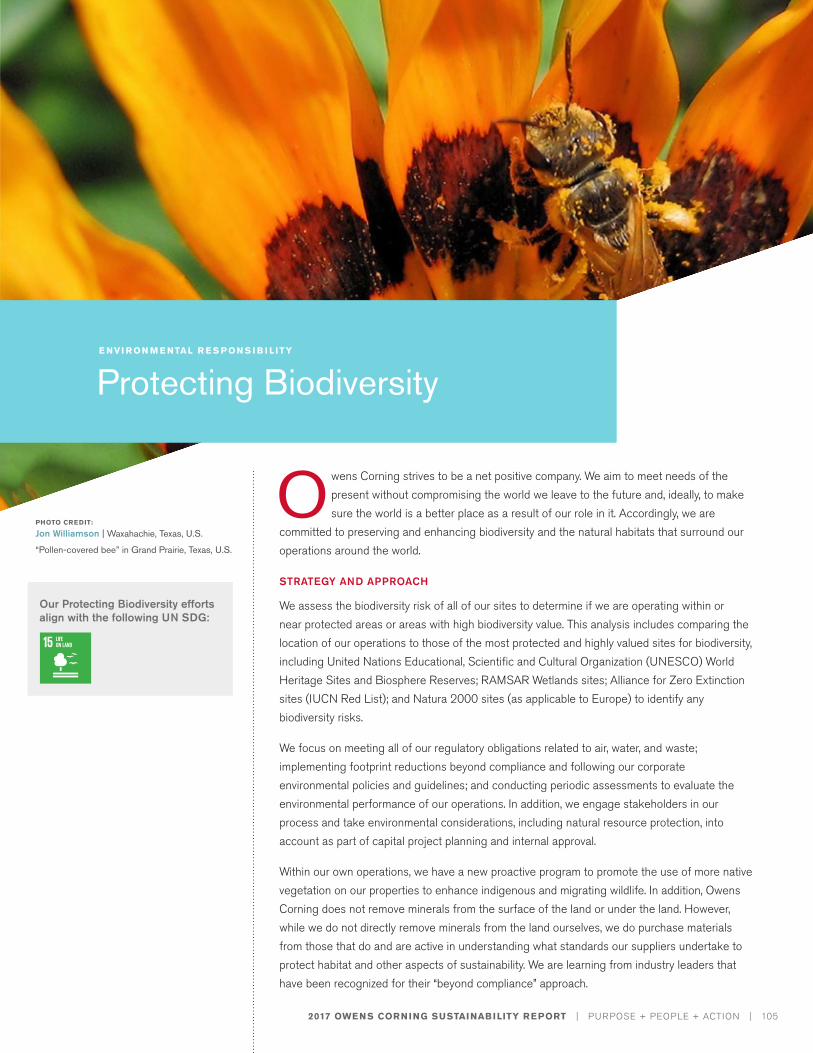
2017 OWENS CORNING SUSTAINABILITY REPORT | PURPOSE + PEOPLE + ACTION | 105
PHOTO CREDIT:
Jon Williamson | Waxahachie, Texas, U.S.
“Pollen-covered bee” in Grand Prairie, Texas, U.S.
E NVI R ON M E NTAL R E S P ON S I B I L ITY
Protecting Biodiversity
O wens Corning strives to be a net positive company. We aim to meet needs of the present without compromising the world we leave to the future and, ideally, to make sure the world is a better place as a result of our role in it. Accordingly, we are
committed to preserving and enhancing biodiversity and the natural habitats that surround our operations around the world.
STRATEGY AND APPROACH
We assess the biodiversity risk of all of our sites to determine if we are operating within or near protected areas or areas with high biodiversity value. This analysis includes comparing the location of our operations to those of the most protected and highly valued sites for biodiversity, including United Nations Educational, Scientific and Cultural Organization (UNESCO) World Heritage Sites and Biosphere Reserves; RAMSAR Wetlands sites; Alliance for Zero Extinction sites (IUCN Red List); and Natura 2000 sites (as applicable to Europe) to identify any biodiversity risks.
We focus on meeting all of our regulatory obligations related to air, water, and waste; implementing footprint reductions beyond compliance and following our corporate environmental policies and guidelines; and conducting periodic assessments to evaluate the environmental performance of our operations. In addition, we engage stakeholders in our process and take environmental considerations, including natural resource protection, into account as part of capital project planning and internal approval.
Within our own operations, we have a new proactive program to promote the use of more native vegetation on our properties to enhance indigenous and migrating wildlife. In addition, Owens Corning does not remove minerals from the surface of the land or under the land. However, while we do not directly remove minerals from the land ourselves, we do purchase materials from those that do and are active in understanding what standards our suppliers undertake to protect habitat and other aspects of sustainability. We are learning from industry leaders that have been recognized for their “beyond compliance” approach.
Our Protecting Biodiversity efforts align with the following UN SDG:
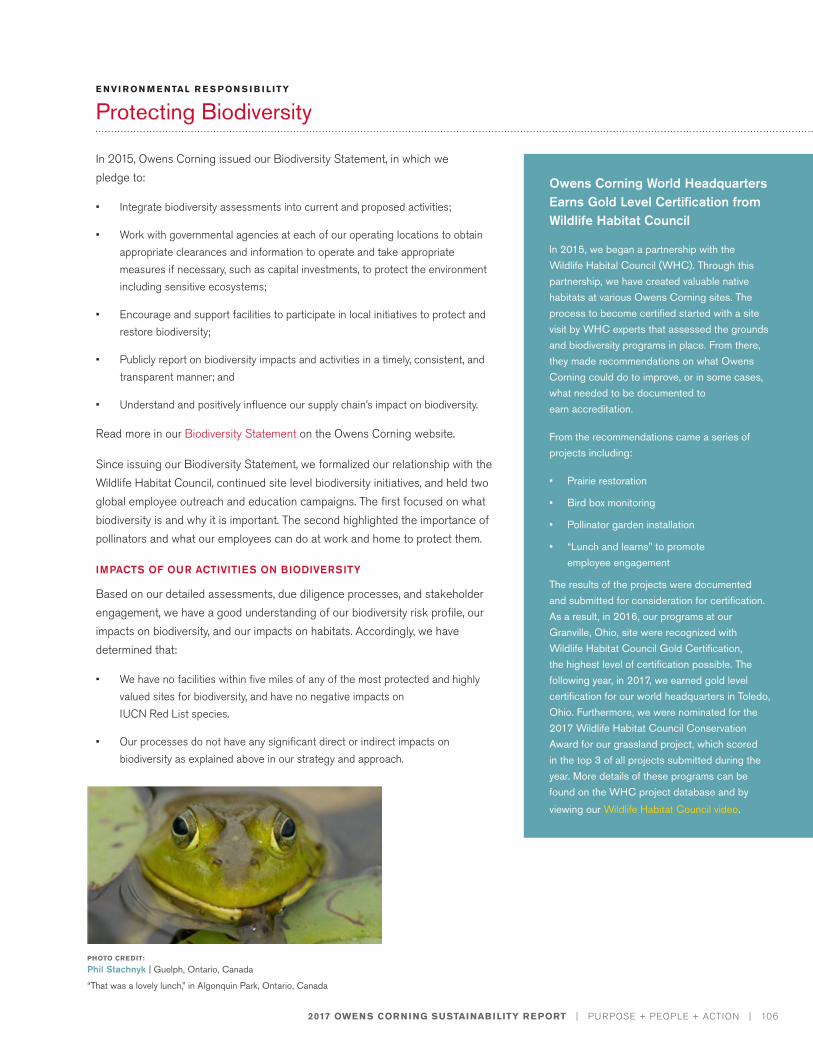
2017 OWENS CORNING SUSTAINABILITY REPORT | PURPOSE + PEOPLE + ACTION | 106
E NVI R ON M E NTAL R E S P ON S I B I L ITY
Protecting Biodiversity
In 2015, Owens Corning issued our Biodiversity Statement, in which we pledge to:
• Integrate biodiversity assessments into current and proposed activities;
• Work with governmental agencies at each of our operating locations to obtain appropriate clearances and information to operate and take appropriate measures if necessary, such as capital investments, to protect the environment including sensitive ecosystems;
• Encourage and support facilities to participate in local initiatives to protect and restore biodiversity;
• Publicly report on biodiversity impacts and activities in a timely, consistent, and transparent manner; and
• Understand and positively influence our supply chain’s impact on biodiversity.
Read more in our Biodiversity Statement on the Owens Corning website.
Since issuing our Biodiversity Statement, we formalized our relationship with the Wildlife Habitat Council, continued site level biodiversity initiatives, and held two global employee outreach and education campaigns. The first focused on what biodiversity is and why it is important. The second highlighted the importance of pollinators and what our employees can do at work and home to protect them.
IMPACTS OF OUR ACTIVITIES ON BIODIVERSITY
Based on our detailed assessments, due diligence processes, and stakeholder engagement, we have a good understanding of our biodiversity risk profile, our impacts on biodiversity, and our impacts on habitats. Accordingly, we have determined that:
• We have no facilities within five miles of any of the most protected and highly valued sites for biodiversity, and have no negative impacts on IUCN Red List species.
• Our processes do not have any significant direct or indirect impacts on biodiversity as explained above in our strategy and approach.
Owens Corning World Headquarters Earns Gold Level Certification from Wildlife Habitat Council
In 2015, we began a partnership with the Wildlife Habital Council (WHC). Through this partnership, we have created valuable native habitats at various Owens Corning sites. The process to become certified started with a site visit by WHC experts that assessed the grounds and biodiversity programs in place. From there, they made recommendations on what Owens Corning could do to improve, or in some cases, what needed to be documented to earn accreditation.
From the recommendations came a series of projects including:
• Prairie restoration
• Bird box monitoring
• Pollinator garden installation
• “Lunch and learns” to promote employee engagement
The results of the projects were documented and submitted for consideration for certification. As a result, in 2016, our programs at our Granville, Ohio, site were recognized with Wildlife Habitat Council Gold Certification, the highest level of certification possible. The following year, in 2017, we earned gold level certification for our world headquarters in Toledo, Ohio. Furthermore, we were nominated for the 2017 Wildlife Habitat Council Conservation Award for our grassland project, which scored in the top 3 of all projects submitted during the year. More details of these programs can be found on the WHC project database and by
viewing our Wildlife Habitat Council video.
PHOTO CREDIT:
Phil Stachnyk | Guelph, Ontario, Canada
“That was a lovely lunch,” in Algonquin Park, Ontario, Canada
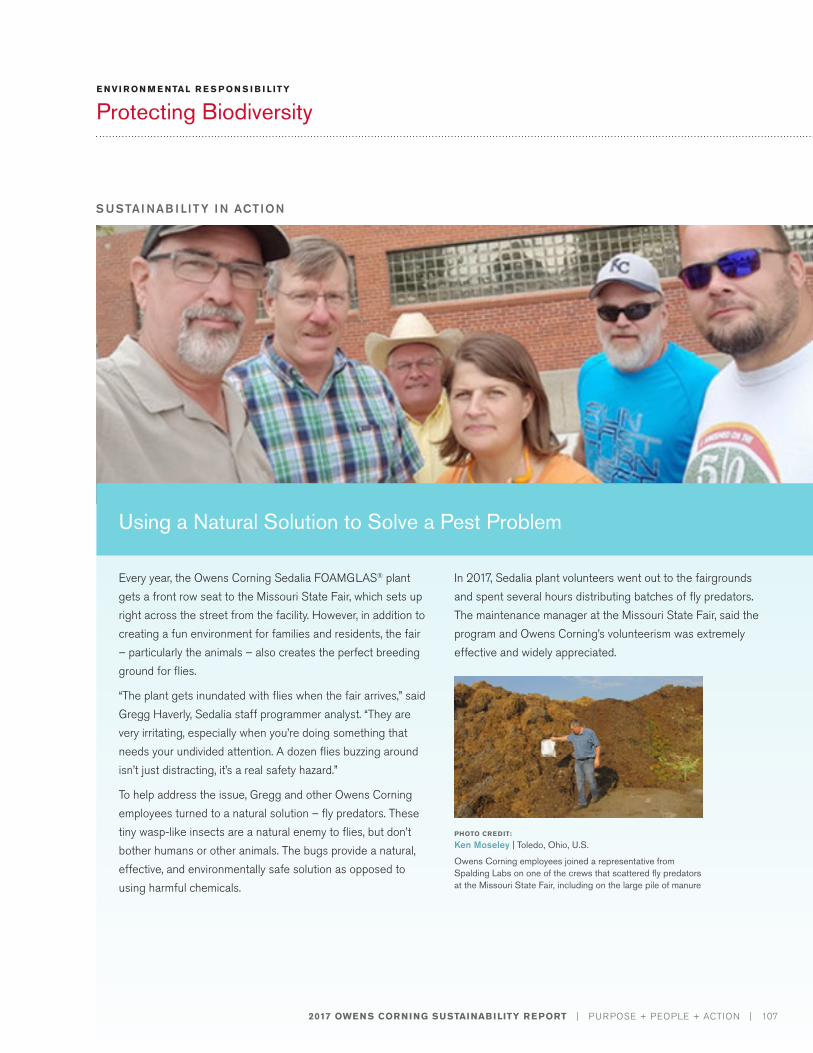
S USTAI NAB I LITY I N ACTION
2017 OWENS CORNING SUSTAINABILITY REPORT | PURPOSE + PEOPLE + ACTION | 107
E NVI R ON M E NTAL R E S P ON S I B I L ITY
Protecting Biodiversity
Using a Natural Solution to Solve a Pest Problem
Every year, the Owens Corning Sedalia FOAMGLAS® plant gets a front row seat to the Missouri State Fair, which sets up right across the street from the facility. However, in addition to creating a fun environment for families and residents, the fair – particularly the animals – also creates the perfect breeding ground for flies.
“The plant gets inundated with flies when the fair arrives,” said Gregg Haverly, Sedalia staff programmer analyst. “They are very irritating, especially when you’re doing something that needs your undivided attention. A dozen flies buzzing around isn’t just distracting, it’s a real safety hazard.”
To help address the issue, Gregg and other Owens Corning employees turned to a natural solution – fly predators. These tiny wasp-like insects are a natural enemy to flies, but don’t bother humans or other animals. The bugs provide a natural, effective, and environmentally safe solution as opposed to using harmful chemicals.
In 2017, Sedalia plant volunteers went out to the fairgrounds and spent several hours distributing batches of fly predators. The maintenance manager at the Missouri State Fair, said the program and Owens Corning’s volunteerism was extremely effective and widely appreciated.
PHOTO CREDIT:
Ken Moseley | Toledo, Ohio, U.S.
Owens Corning employees joined a representative from Spalding Labs on one of the crews that scattered fly predators at the Missouri State Fair, including on the large pile of manure
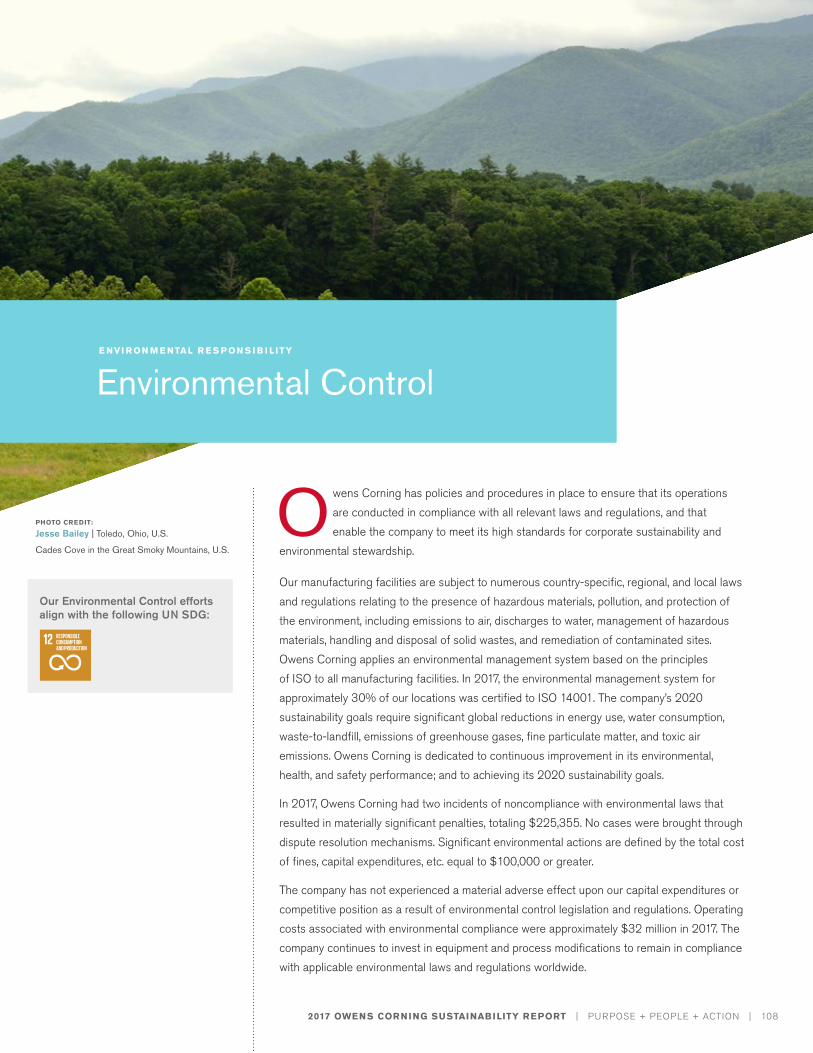
2017 OWENS CORNING SUSTAINABILITY REPORT | PURPOSE + PEOPLE + ACTION | 108
PHOTO CREDIT:
Jesse Bailey | Toledo, Ohio, U.S.
Cades Cove in the Great Smoky Mountains, U.S.
O wens Corning has policies and procedures in place to ensure that its operations are conducted in compliance with all relevant laws and regulations, and that enable the company to meet its high standards for corporate sustainability and
environmental stewardship.
Our manufacturing facilities are subject to numerous country-specific, regional, and local laws and regulations relating to the presence of hazardous materials, pollution, and protection of the environment, including emissions to air, discharges to water, management of hazardous materials, handling and disposal of solid wastes, and remediation of contaminated sites. Owens Corning applies an environmental management system based on the principles of ISO to all manufacturing facilities. In 2017, the environmental management system for approximately 30% of our locations was certified to ISO 14001. The company’s 2020 sustainability goals require significant global reductions in energy use, water consumption, waste-to-landfill, emissions of greenhouse gases, fine particulate matter, and toxic air emissions. Owens Corning is dedicated to continuous improvement in its environmental, health, and safety performance; and to achieving its 2020 sustainability goals.
In 2017, Owens Corning had two incidents of noncompliance with environmental laws that resulted in materially significant penalties, totaling $225,355. No cases were brought through dispute resolution mechanisms. Significant environmental actions are defined by the total cost of fines, capital expenditures, etc. equal to $100,000 or greater.
The company has not experienced a material adverse effect upon our capital expenditures or competitive position as a result of environmental control legislation and regulations. Operating costs associated with environmental compliance were approximately $32 million in 2017. The company continues to invest in equipment and process modifications to remain in compliance with applicable environmental laws and regulations worldwide.
E NVI R ON M E NTAL R E S P ON S I B I L ITY
Environmental Control
Our Environmental Control efforts align with the following UN SDG:
2017 OWENS CORNING SUSTAINABILITY REPORT | PURPOSE + PEOPLE + ACTION | 109
Regulatory activities of particular importance to our operations include those addressing air pollution, water pollution, waste disposal, and chemical control. The company expects passage and implementation of new laws and regulations specifically addressing climate change, toxic air emissions, ozone forming emissions, and fine particulate matter during the next two to five years. New air pollution regulations could impact our ability to expand production or construct new facilities in certain regions of North America. However, based on information known to the company, including the nature of our manufacturing operations and associated air emissions, at this time we do not expect any of these new laws, regulations, or activities to have a material adverse effect on our results of current operations, financial condition, or long-term liquidity. On December 31, 2017, the company had an accrual totaling $15 million for these costs. Changes in required remediation procedures or timing of those procedures at existing legacy sites, or discovery of contamination at additional sites, could result in material increases to the company’s environmental obligations.
Owens Corning is involved in remedial response activities and is responsible for environmental remediation at a number of sites, including certain currently owned or formerly owned plants. These responsibilities arise under a number of laws, including, but not limited to, the Federal Resource Conservation and Recovery Act (RCRA), and similar state or local laws pertaining to the management and remediation of hazardous materials and petroleum. The company has also been named a potentially responsible party under the United States Federal Superfund law, or state equivalents, at a number of disposal sites. The company became involved in these sites as a result of government action or in connection with business acquisitions. At the end of 2017, the company was involved with a total of 19 sites worldwide, including seven Superfund sites and 13 owned or formerly owned sites. None of the liabilities for these sites are individually significant to the company.
Owens Corning’s environmental management system (EMS) is designed to assist in achieving the Environmental, Health, Safety, and Product Stewardship Policy. The EMS is a collection of policies and procedures to manage environmental performance in a facility, including compliance, footprint reduction, and management systems. The system is a framework for setting and reviewing environmental objectives and targets and focuses environmental improvement programs. All facilities globally are required to implement the system, track progress, and perform self-audits.
Our EMS includes the following elements:
• A - Policy
• B - Environmental Aspects and Impacts
• C - Applicable Requirements
• D - Objectives, Targets, and Action Plans
• E - Structure Responsibility and Accountability
• F - Training and Competency
• G - Establishing Communication, Participation, Procedure, and Consultation
• H - Management System Manual
E NVI R ON M E NTAL R E S P ON S I B I L ITY
Environmental Control
• I - Document Control
• J - Operational Control and Management of Change
• K - Executing Recurring and One Time Tasks
• L - Emergency Preparedness and Response
• M - Performance to Legal and Other Requirements
• N - Nonconformities, Corrective Actions
• O - Record Management
• P - Auditing
• Q - Management Review
PHOTO CREDIT:
Gianfranco Romano | Besana, Italy
“Under the Rainbow” at the Crown Fountain in Chicago, Illinois, U.S.
4Social ResponsibilityEMPLOYEE EXPER IENCE
HUMAN R IGHTS
HEALTHY LIVING
LIVING SAFELY
COMMUNITY IMPACT
2017 OWENS CORNING SUSTAINABILITY REPORT | PURPOSE + PEOPLE + ACTION | 111
PHOTO CREDIT:
Michael Todd | Jackson, Tennessee, U.S.
"Bohemian Waxwings" in Sault Ste. Marie, Michigan, U.S.
Our Employee Experience efforts align with the following UN SDGs:
Our success as a company depends on our ability to attract, engage, and retain the most talented and highest-performing employees. By creating an environment where the most outstanding talent in the world feels welcomed, respected, and valued for
who they are and their contributions, we can harness the energy and power of our diversity.
We believe that diversity and inclusion are everyone’s responsibility, and a critical part of our overall employee experience. We offer challenging and impactful opportunities that lead to bright careers in an environment where all people, regardless of personal attributes, can thrive. When our employees enjoy coming to work every day and are proud to work at Owens Corning, they make a material difference for our customers. We care deeply about our people and support lifelong learning to help them reach their full potential through a variety of training and development programs that are tailored to the individual’s goals. Our investment in our employees is our greatest return, and we’re proud to make it a top priority.
STRATEGY AND APPROACH
Our success as a business is driven by our ability to attract, engage, and retain the most talented and highest-performing employees. We align our talent management strategy, recruiting approach, and employee development process and programs with our business strategy, but we also work hard to provide an environment where people feel supported, comfortable, happy, and healthy. These elements make for a great work environment and employee experience.
Diversity and inclusion are also major components of our employee experience efforts. All employees should come to work every day feeling comfortable and knowing they have an equal opportunity to grow and succeed based on their performance, regardless of individual differences.
S OCIAL R E S P ON S I B I L ITY
Employee Experience
Owens Corning’s Goal:Average 13 hours of training per employee for development purposes
The social data in this chapter marked with a + sign were independently assured to a moderate level by SCS Global Services. For more information or to see the verification statement, please go to page 205 in the About the Report section.
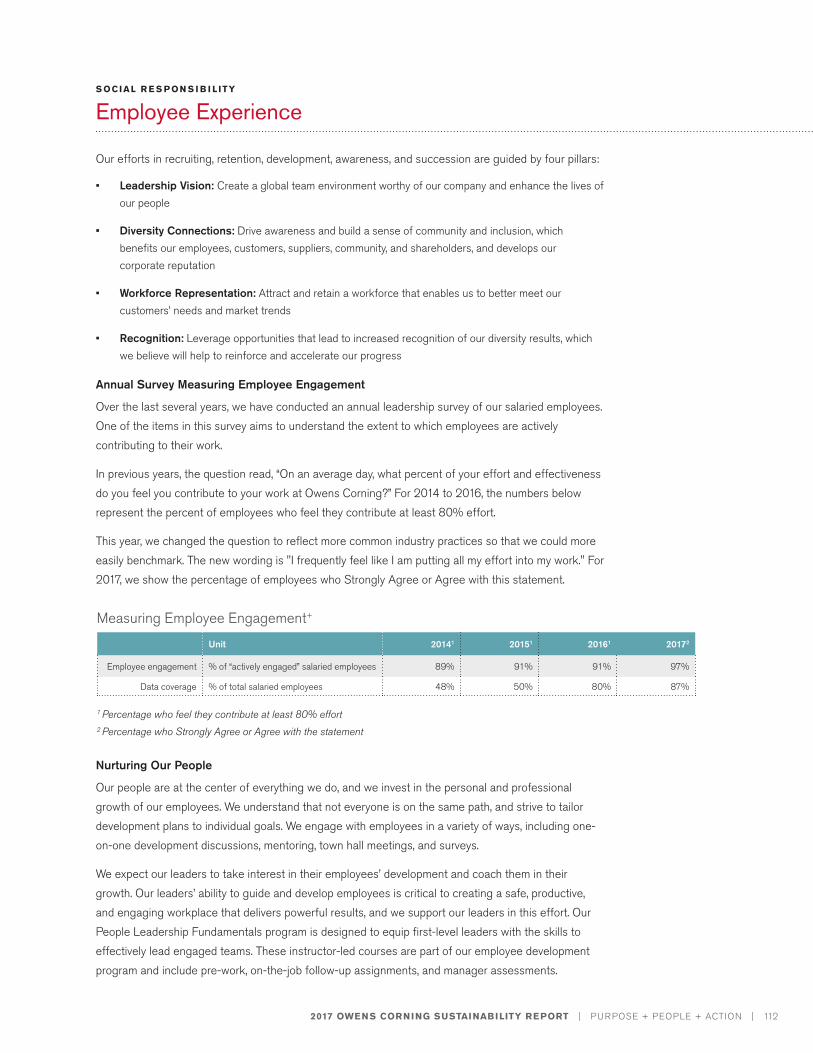
2017 OWENS CORNING SUSTAINABILITY REPORT | PURPOSE + PEOPLE + ACTION | 112
Our efforts in recruiting, retention, development, awareness, and succession are guided by four pillars:
• Leadership Vision: Create a global team environment worthy of our company and enhance the lives of our people
• Diversity Connections: Drive awareness and build a sense of community and inclusion, which benefits our employees, customers, suppliers, community, and shareholders, and develops our corporate reputation
• Workforce Representation: Attract and retain a workforce that enables us to better meet our customers’ needs and market trends
• Recognition: Leverage opportunities that lead to increased recognition of our diversity results, which we believe will help to reinforce and accelerate our progress
Annual Survey Measuring Employee Engagement
Over the last several years, we have conducted an annual leadership survey of our salaried employees. One of the items in this survey aims to understand the extent to which employees are actively contributing to their work.
In previous years, the question read, “On an average day, what percent of your effort and effectiveness do you feel you contribute to your work at Owens Corning?” For 2014 to 2016, the numbers below represent the percent of employees who feel they contribute at least 80% effort.
This year, we changed the question to reflect more common industry practices so that we could more easily benchmark. The new wording is "I frequently feel like I am putting all my effort into my work." For 2017, we show the percentage of employees who Strongly Agree or Agree with this statement.
Nurturing Our People
Our people are at the center of everything we do, and we invest in the personal and professional growth of our employees. We understand that not everyone is on the same path, and strive to tailor development plans to individual goals. We engage with employees in a variety of ways, including one-on-one development discussions, mentoring, town hall meetings, and surveys.
We expect our leaders to take interest in their employees’ development and coach them in their growth. Our leaders’ ability to guide and develop employees is critical to creating a safe, productive, and engaging workplace that delivers powerful results, and we support our leaders in this effort. Our People Leadership Fundamentals program is designed to equip first-level leaders with the skills to effectively lead engaged teams. These instructor-led courses are part of our employee development program and include pre-work, on-the-job follow-up assignments, and manager assessments.
S OCIAL R E S P ON S I B I L ITY
Employee Experience
Unit 20141 20151 20161 20172
Employee engagement % of “actively engaged” salaried employees 89% 91% 91% 97%
Data coverage % of total salaried employees 48% 50% 80% 87%
1 Percentage who feel they contribute at least 80% effort2 Percentage who Strongly Agree or Agree with the statement
Measuring Employee Engagement+
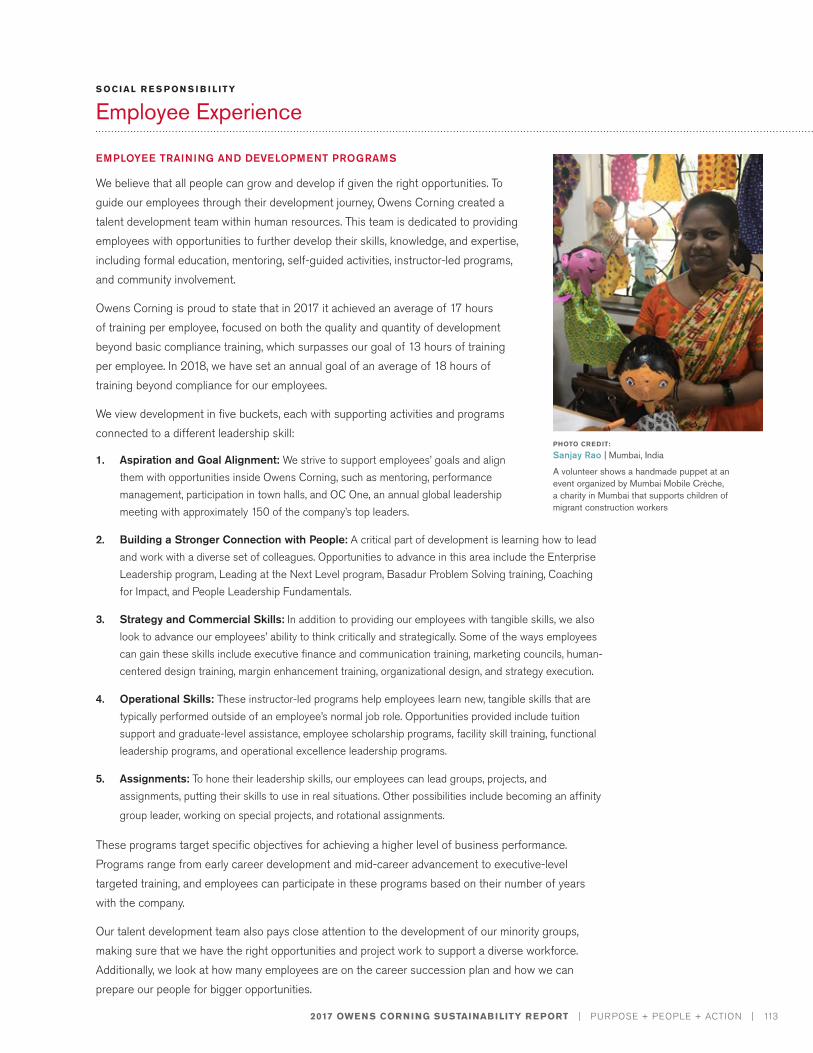
2017 OWENS CORNING SUSTAINABILITY REPORT | PURPOSE + PEOPLE + ACTION | 113
EMPLOYEE TRAINING AND DEVELOPMENT PROGRAMS
We believe that all people can grow and develop if given the right opportunities. To guide our employees through their development journey, Owens Corning created a talent development team within human resources. This team is dedicated to providing employees with opportunities to further develop their skills, knowledge, and expertise, including formal education, mentoring, self-guided activities, instructor-led programs, and community involvement.
Owens Corning is proud to state that in 2017 it achieved an average of 17 hours of training per employee, focused on both the quality and quantity of development beyond basic compliance training, which surpasses our goal of 13 hours of training per employee. In 2018, we have set an annual goal of an average of 18 hours of training beyond compliance for our employees.
We view development in five buckets, each with supporting activities and programs connected to a different leadership skill:
1. Aspiration and Goal Alignment: We strive to support employees’ goals and align them with opportunities inside Owens Corning, such as mentoring, performance management, participation in town halls, and OC One, an annual global leadership meeting with approximately 150 of the company’s top leaders.
2. Building a Stronger Connection with People: A critical part of development is learning how to lead and work with a diverse set of colleagues. Opportunities to advance in this area include the Enterprise Leadership program, Leading at the Next Level program, Basadur Problem Solving training, Coaching for Impact, and People Leadership Fundamentals.
3. Strategy and Commercial Skills: In addition to providing our employees with tangible skills, we also look to advance our employees’ ability to think critically and strategically. Some of the ways employees can gain these skills include executive finance and communication training, marketing councils, human-centered design training, margin enhancement training, organizational design, and strategy execution.
4. Operational Skills: These instructor-led programs help employees learn new, tangible skills that are typically performed outside of an employee’s normal job role. Opportunities provided include tuition support and graduate-level assistance, employee scholarship programs, facility skill training, functional leadership programs, and operational excellence leadership programs.
5. Assignments: To hone their leadership skills, our employees can lead groups, projects, and assignments, putting their skills to use in real situations. Other possibilities include becoming an affinity
group leader, working on special projects, and rotational assignments.
These programs target specific objectives for achieving a higher level of business performance. Programs range from early career development and mid-career advancement to executive-level targeted training, and employees can participate in these programs based on their number of years with the company.
Our talent development team also pays close attention to the development of our minority groups, making sure that we have the right opportunities and project work to support a diverse workforce. Additionally, we look at how many employees are on the career succession plan and how we can prepare our people for bigger opportunities.
S OCIAL R E S P ON S I B I L ITY
Employee Experience
PHOTO CREDIT:
Sanjay Rao | Mumbai, India
A volunteer shows a handmade puppet at an event organized by Mumbai Mobile Crèche, a charity in Mumbai that supports children of migrant construction workers
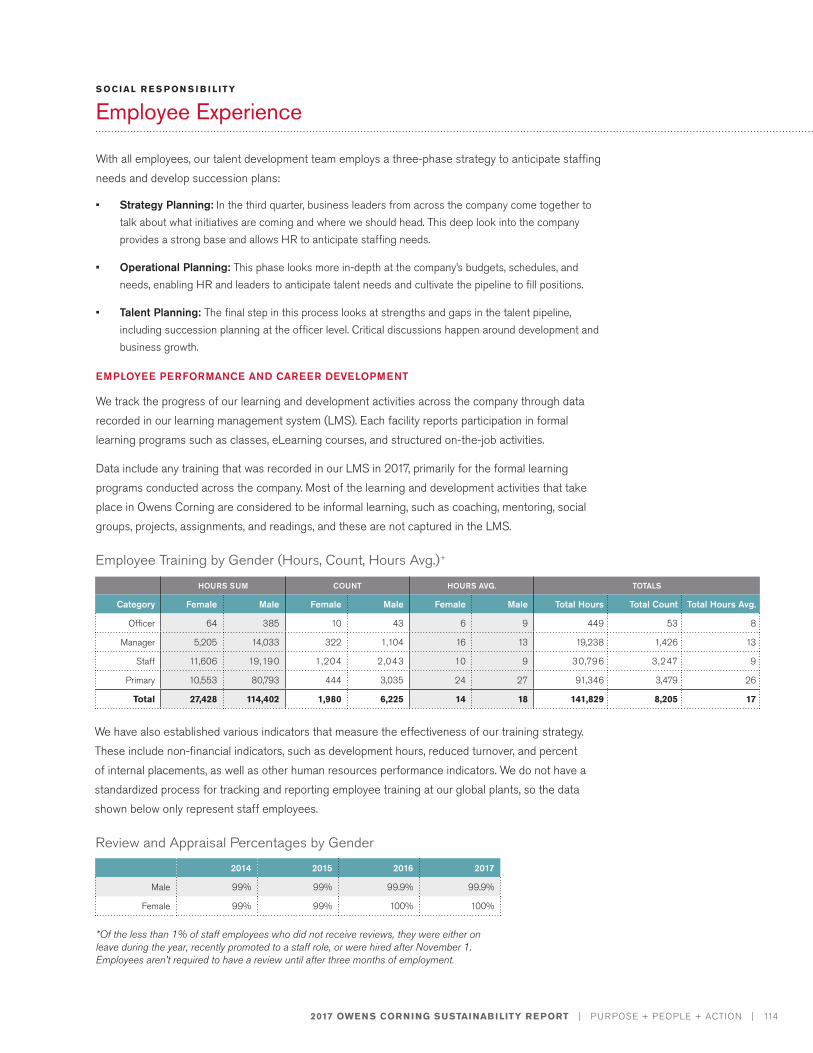
2017 OWENS CORNING SUSTAINABILITY REPORT | PURPOSE + PEOPLE + ACTION | 114
With all employees, our talent development team employs a three-phase strategy to anticipate staffing needs and develop succession plans:
• Strategy Planning: In the third quarter, business leaders from across the company come together to talk about what initiatives are coming and where we should head. This deep look into the company provides a strong base and allows HR to anticipate staffing needs.
• Operational Planning: This phase looks more in-depth at the company’s budgets, schedules, and needs, enabling HR and leaders to anticipate talent needs and cultivate the pipeline to fill positions.
• Talent Planning: The final step in this process looks at strengths and gaps in the talent pipeline, including succession planning at the officer level. Critical discussions happen around development and business growth.
EMPLOYEE PERFORMANCE AND CAREER DEVELOPMENT
We track the progress of our learning and development activities across the company through data recorded in our learning management system (LMS). Each facility reports participation in formal learning programs such as classes, eLearning courses, and structured on-the-job activities.
Data include any training that was recorded in our LMS in 2017, primarily for the formal learning programs conducted across the company. Most of the learning and development activities that take place in Owens Corning are considered to be informal learning, such as coaching, mentoring, social groups, projects, assignments, and readings, and these are not captured in the LMS.
S OCIAL R E S P ON S I B I L ITY
Employee Experience
HOURS SUM COUNT HOURS AVG. TOTALS
Category Female Male Female Male Female Male Total Hours Total Count Total Hours Avg.
Officer 64 385 10 43 6 9 449 53 8
Manager 5,205 14,033 322 1,104 16 13 19,238 1,426 13
Staff 11,606 19,190 1,204 2,043 10 9 30,796 3,247 9
Primary 10,553 80,793 444 3,035 24 27 91,346 3,479 26
Total 27,428 114,402 1,980 6,225 14 18 141,829 8,205 17
Employee Training by Gender (Hours, Count, Hours Avg.)+
We have also established various indicators that measure the effectiveness of our training strategy. These include non-financial indicators, such as development hours, reduced turnover, and percent of internal placements, as well as other human resources performance indicators. We do not have a standardized process for tracking and reporting employee training at our global plants, so the data shown below only represent staff employees.
2014 2015 2016 2017
Male 99% 99% 99.9% 99.9%
Female 99% 99% 100% 100%
Review and Appraisal Percentages by Gender
*Of the less than 1% of staff employees who did not receive reviews, they were either on leave during the year, recently promoted to a staff role, or were hired after November 1. Employees aren’t required to have a review until after three months of employment.
S USTAI NAB I LITY I N ACTION
2017 OWENS CORNING SUSTAINABILITY REPORT | PURPOSE + PEOPLE + ACTION | 115
S OCIAL R E S P ON S I B I L ITY
Employee Experience
In 2017, Owens Corning acquired Pittsburgh Corning, including its five plants and roughly 900 employees. Within the first week of acquisition, leaders from across our company went to the plants to meet the new employees and assess existing processes and procedures. Upon arrival, the team found that working conditions, particularly safety conditions, were not up to Owens Corning standards. In fact, the injury rate at Pittsburgh Corning prior to acquisition was approximately 12 times that of Owens Corning.
To immediately address safety concerns, we brought in over 40 EHS professionals from other Owens Corning facilities to support the former Pittsburgh Corning plants. During this time, the EHS teams worked with plant employees to implement new safety requirements and navigate changing expectations. This collaboration also allowed us to showcase Owens Corning’s culture to our newest employees and reinforce our commitment to our people. During their first week with the company, we were also able to quickly address existing issues that were contributing to an unsafe work environment.
“Taking these steps was pretty significant in demonstrating to employees that safety really is first,” said Cole Foley, EHS director for the Insulation business.
As a result of our timely and efficient safety integration, the new plants' injury rates were reduced by almost 80% in the second half of 2017, and we expect to see these results improve further in 2018.
Accelerating Safety Progress in FOAMGLAS® Plants
2017 OWENS CORNING SUSTAINABILITY REPORT | PURPOSE + PEOPLE + ACTION | 116
AFFINITY GROUPS
Diversity is a core characteristic of our company, and we take great pride in providing an inclusive environment for all employees regardless of gender, beliefs, sexual orientation, race, or religion. To foster an inclusive culture, we have created five affinity groups, which support our increasingly diverse workforce, drive employee engagement, and create internal and external connections.
• African American Resource Group (AARG) – to advance excellence through attracting, acclimating, retaining, and accelerating career growth, thus enhancing Owens Corning’s business performance while leveraging the strength of a diverse workforce.
• Gay, Lesbian, Bisexual, Transgender & Advocates (GLBTA) – to achieve a work environment that is inclusive and safe, where people feel they can be fully engaged to create and problem-solve to their maximum potential and can be confident in a work environment where they will be fairly evaluated.
• Owens Corning Multi-Cultural Network (OCMN) – to fundamentally enhance the ability of the people within Owens Corning to understand, embrace, and leverage the multicultural differences that exist across our global organization.
• Women’s Information Network (WIN) – to attract, retain, and develop outstanding women through professional development, personal development, and community involvement.
• Connections – to enrich the lives of our employees by partnering with those in career transition, while fostering personal and professional growth and promoting community involvement to attract and retain top talent.
Each group has an executive sponsor, leader, and co-leader, and involvement and engagement among employees are increasing at both the regional and international levels. In 2017, our affinity groups continued to focus their efforts on specific areas. Significant accomplishments by our groups include:
• WIN expanded to additional U.S. plant locations, as well as internationally, including two facilities in Europe and one in India. Additionally, two locations in Latin America are in the process of starting up WIN chapters. The expansion of this group is a testament to our focus on gender equality, efforts around the issue, and momentum that has built up over the years.
• GLBTA developed a compelling campaign to help employees understand scenarios, emotions, and struggles that colleagues may be facing. Through video testimonials, employees learned how to better engage their colleagues with sensitivity and understanding.
• AARG created development opportunities and programs focused on professional and personal development that will help African Americans accelerate their careers at Owens Corning.
Moving forward, these groups will continue to provide focused programming in their areas of impact to support the diverse groups they represent, working to help increase awareness and understanding across the company.
S OCIAL R E S P ON S I B I L ITY
Employee Experience
S USTAI NAB I LITY I N ACTION
2017 OWENS CORNING SUSTAINABILITY REPORT | PURPOSE + PEOPLE + ACTION | 117
S OCIAL R E S P ON S I B I L ITY
Employee Experience
In 2017, the GLBTA affinity group developed a powerful video campaign, OpenUp, to support those who may be faced with an LGBTQ issue, increase awareness among employees, and provide resources to help those affected by these issues.
“The goal of this series was to create feelings of acceptance, compassion, and solidarity,” explained Raymond Gaytan, senior financial analyst and chair of GLBTA. “An affirming and supportive environment is of immeasurable value to anyone in the LGBTQ community. We believe that by sharing these stories we can create positive learning experiences, establish deeper connections, and form a sense of respect for everyone’s journey.”
OpenUp was a three-part series, featuring employees from Brussels, Belgium; Gastonia, North Carolina; and Toledo, Ohio. The employees shared their experiences of being LGBTQ allies, coming out, having LGBTQ children, and more.
In one of the videos, Emma Rozand, European credit manager, talked about what being an LGBTQ ally means. She believes allies can play an important role in helping create inclusive, safe environments so people can be their authentic selves. “You can spend your whole lifetime not being yourself. At the end of the day, everyone deserves the right to be themselves,” Emma explained.
Fostering a Culture of Understanding and Acceptance
Owens Corning Receives a Perfect Score of 100% on the Corporate Equality Index (CEI)
For the 14th straight year, Owens Corning received a perfect score of 100% on the Corporate Equality Index (CEI), a national benchmarking survey and report on corporate policies and practices related to LGBT workplace equality, administered by the Human Rights Campaign Foundation. Businesses were evaluated on LGBT-related policies and practices including workplace nondiscrimination protections, transgender-inclusive healthcare benefits, competency programs, and public engagement with the LGBT community. Satisfying all CEI’s criteria resulted in a 100% ranking and the designation as a Best Place to Work for LGBT Equality.
S USTAI NAB I LITY I N ACTION
2017 OWENS CORNING SUSTAINABILITY REPORT | PURPOSE + PEOPLE + ACTION | 118
Owens Corning understands that diversity and inclusion are vital to our long-term success and growth, and the company is gaining momentum in its efforts to promote gender diversity.
2017 marked the second year of the company-wide unconscious bias training initiative, with a focus on challenging personal unconscious gender biases to help create a “gender smart” workplace. Once again led by consultant Kathleen Nalty, employees learned how to recognize unconscious gender biases in the way they express themselves and interact with others at Owens Corning and in the outside world.
Kathleen outlined five concepts in “Unconscious Bias 2.0” that are impacted by gender bias:
• Covering: The act of individuals hiding their social identities at work in order to be successful
• Work and life integration: The struggle of men, women, parents, and non-parents alike to balance work and personal lives
• Job qualification: An unconscious bias where men are more likely than women to apply for jobs, raises, or promotions when 100% of applicant criteria is not met
• Likeability: Studies show that women must be “likeable” to appear confident
• Seat at the table: Women speak up to 75% less in
meetings than men
In breakout groups, employees shared their experiences surrounding diversity of thought. The breakout groups also focused on strengthening employee self-confidence and developing remedies for issues caused by gender bias. Some examples included:
• Encouraging specific action steps when providing feedback, both to coworkers and the organization;
• Surveying Owens Corning employees on “covering” to raise awareness of this concept and identify how the company can help; and
• Benchmarking what peer companies offer employees to improve work/life balance to identify opportunities
for Owens Corning.
Based on recommendations from the breakout groups, a “Gender Smart Resource Guide” was created for employees to reference.
While this training was held at our world headquarters, employees and contractors around the globe were able to participate by video conference.
Unconscious Bias Training 2.0
S OCIAL R E S P ON S I B I L ITY
Employee Experience
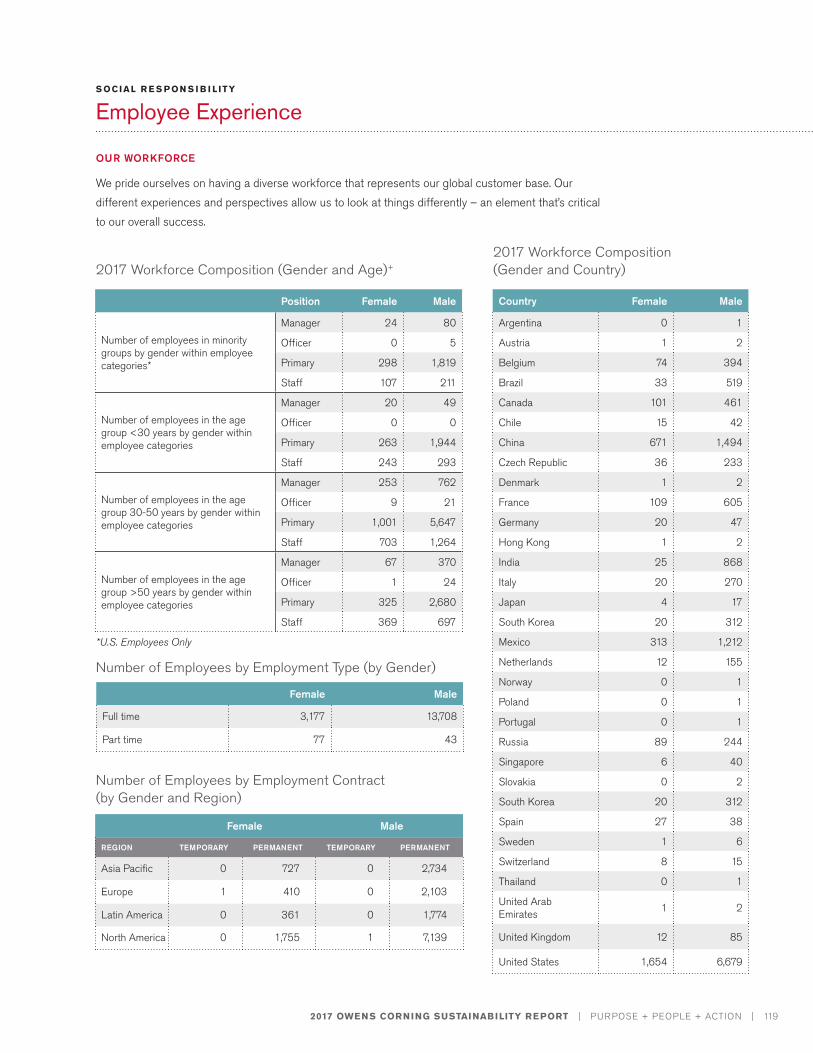
2017 OWENS CORNING SUSTAINABILITY REPORT | PURPOSE + PEOPLE + ACTION | 119
OUR WORKFORCE
We pride ourselves on having a diverse workforce that represents our global customer base. Our different experiences and perspectives allow us to look at things differently – an element that’s critical to our overall success.
S OCIAL R E S P ON S I B I L ITY
Employee Experience
Position Female Male
Number of employees in minority groups by gender within employee categories*
Manager 24 80
Officer 0 5
Primary 298 1,819
Staff 107 211
Number of employees in the age group <30 years by gender within employee categories
Manager 20 49
Officer 0 0
Primary 263 1,944
Staff 243 293
Number of employees in the age group 30-50 years by gender within employee categories
Manager 253 762
Officer 9 21
Primary 1,001 5,647
Staff 703 1,264
Number of employees in the age group >50 years by gender within employee categories
Manager 67 370
Officer 1 24
Primary 325 2,680
Staff 369 697
Country Female Male
Argentina 0 1
Austria 1 2
Belgium 74 394
Brazil 33 519
Canada 101 461
Chile 15 42
China 671 1,494
Czech Republic 36 233
Denmark 1 2
France 109 605
Germany 20 47
Hong Kong 1 2
India 25 868
Italy 20 270
Japan 4 17
South Korea 20 312
Mexico 313 1,212
Netherlands 12 155
Norway 0 1
Poland 0 1
Portugal 0 1
Russia 89 244
Singapore 6 40
Slovakia 0 2
South Korea 20 312
Spain 27 38
Sweden 1 6
Switzerland 8 15
Thailand 0 1
United Arab Emirates 1 2
United Kingdom 12 85
United States 1,654 6,679
Female Male
Full time 3,177 13,708
Part time 77 43
Female Male
REGION TEMPORARY PERMANENT TEMPORARY PERMANENT
Asia Pacific 0 727 0 2,734
Europe 1 410 0 2,103
Latin America 0 361 0 1,774
North America 0 1,755 1 7,139
2017 Workforce Composition (Gender and Age)+
Number of Employees by Employment Type (by Gender)
Number of Employees by Employment Contract (by Gender and Region)
2017 Workforce Composition (Gender and Country)
*U.S. Employees Only
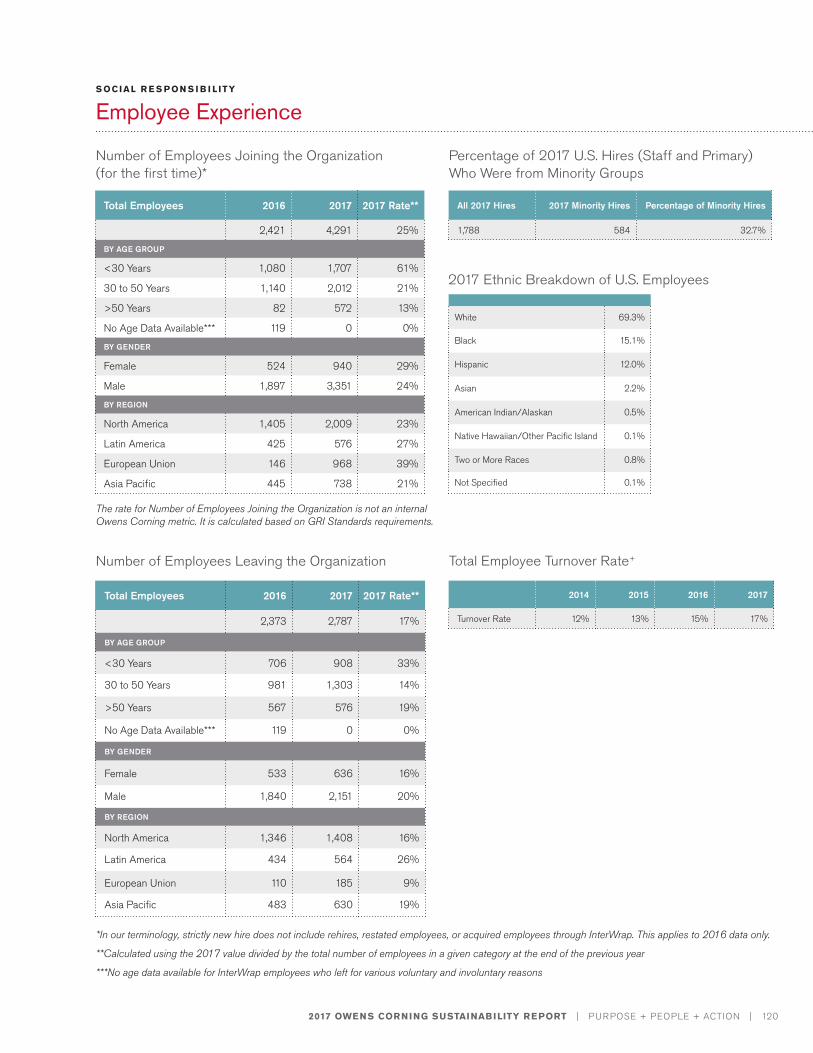
2017 OWENS CORNING SUSTAINABILITY REPORT | PURPOSE + PEOPLE + ACTION | 120
S OCIAL R E S P ON S I B I L ITY
Employee Experience
*In our terminology, strictly new hire does not include rehires, restated employees, or acquired employees through InterWrap. This applies to 2016 data only.
**Calculated using the 2017 value divided by the total number of employees in a given category at the end of the previous year
***No age data available for InterWrap employees who left for various voluntary and involuntary reasons
The rate for Number of Employees Joining the Organization is not an internal Owens Corning metric. It is calculated based on GRI Standards requirements.
Total Employees 2016 2017 2017 Rate**
2,421 4,291 25%
BY AGE GROUP
<30 Years 1,080 1,707 61%
30 to 50 Years 1,140 2,012 21%
>50 Years 82 572 13%
No Age Data Available*** 119 0 0%
BY GENDER
Female 524 940 29%
Male 1,897 3,351 24%
BY REGION
North America 1,405 2,009 23%
Latin America 425 576 27%
European Union 146 968 39%
Asia Pacific 445 738 21%
All 2017 Hires 2017 Minority Hires Percentage of Minority Hires
1,788 584 32.7%
2014 2015 2016 2017
Turnover Rate 12% 13% 15% 17%
Total Employees 2016 2017 2017 Rate**
2,373 2,787 17%
BY AGE GROUP
<30 Years 706 908 33%
30 to 50 Years 981 1,303 14%
>50 Years 567 576 19%
No Age Data Available*** 119 0 0%
BY GENDER
Female 533 636 16%
Male 1,840 2,151 20%
BY REGION
North America 1,346 1,408 16%
Latin America 434 564 26%
European Union 110 185 9%
Asia Pacific 483 630 19%
Number of Employees Joining the Organization (for the first time)*
Percentage of 2017 U.S. Hires (Staff and Primary) Who Were from Minority Groups
Total Employee Turnover Rate+
2017 Ethnic Breakdown of U.S. Employees
Number of Employees Leaving the Organization
White 69.3%
Black 15.1%
Hispanic 12.0%
Asian 2.2%
American Indian/Alaskan 0.5%
Native Hawaiian/Other Pacific Island 0.1%
Two or More Races 0.8%
Not Specified 0.1%
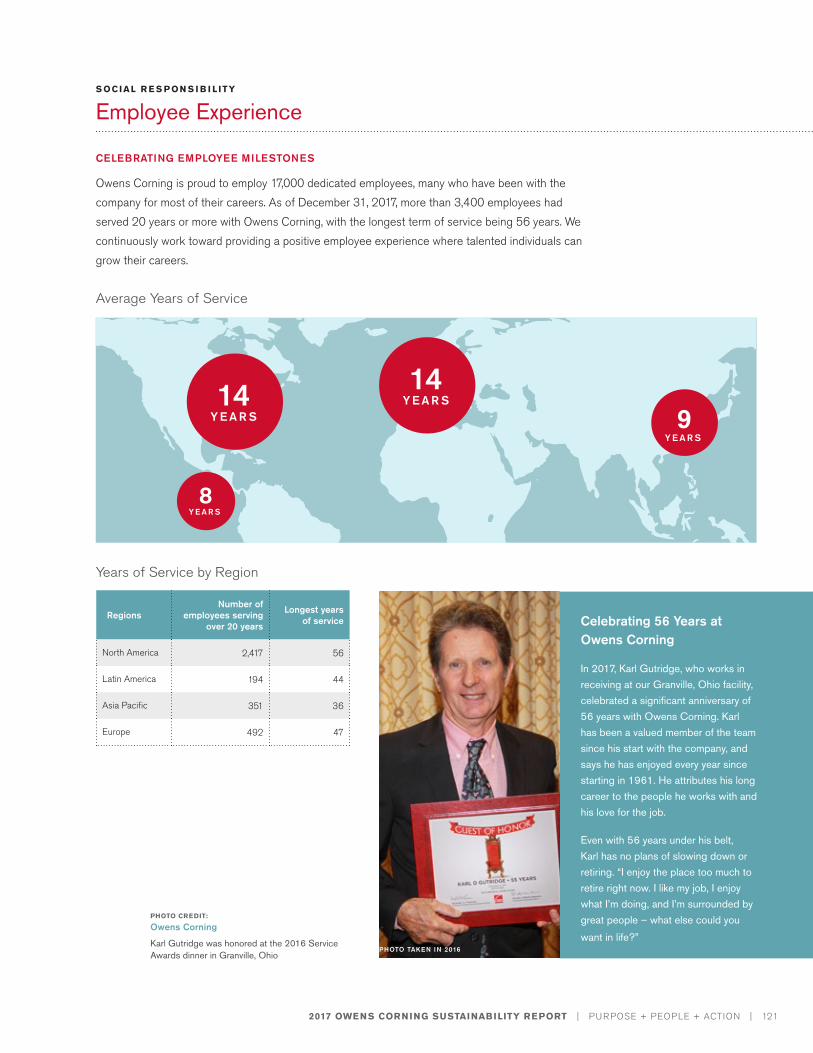
2017 OWENS CORNING SUSTAINABILITY REPORT | PURPOSE + PEOPLE + ACTION | 121
CELEBRATING EMPLOYEE MILESTONES
Owens Corning is proud to employ 17,000 dedicated employees, many who have been with the company for most of their careers. As of December 31, 2017, more than 3,400 employees had served 20 years or more with Owens Corning, with the longest term of service being 56 years. We continuously work toward providing a positive employee experience where talented individuals can grow their careers.
S OCIAL R E S P ON S I B I L ITY
Employee Experience
Celebrating 56 Years at Owens Corning
In 2017, Karl Gutridge, who works in receiving at our Granville, Ohio facility, celebrated a significant anniversary of 56 years with Owens Corning. Karl has been a valued member of the team since his start with the company, and says he has enjoyed every year since starting in 1961. He attributes his long career to the people he works with and his love for the job.
Even with 56 years under his belt, Karl has no plans of slowing down or retiring. “I enjoy the place too much to retire right now. I like my job, I enjoy what I’m doing, and I’m surrounded by great people – what else could you
want in life?”
PHOTO CREDIT:
Owens Corning
Karl Gutridge was honored at the 2016 Service Awards dinner in Granville, Ohio
RegionsNumber of
employees serving over 20 years
Longest years of service
North America 2,417 56
Latin America 194 44
Asia Pacific 351 36
Europe 492 47
Average Years of Service
Years of Service by Region
14 14
8
9
Y E A R S
Y E A R S
Y E A R SY E A R S
PHOTO TAKEN IN 2016
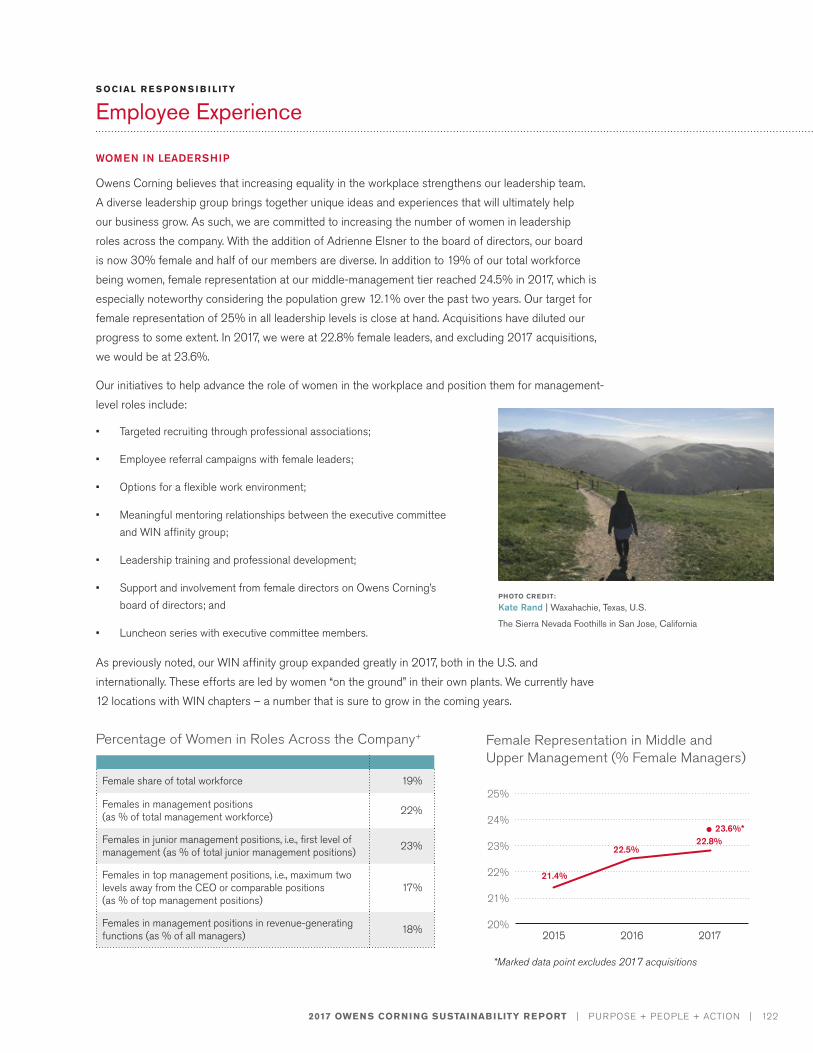
2017 OWENS CORNING SUSTAINABILITY REPORT | PURPOSE + PEOPLE + ACTION | 122
WOMEN IN LEADERSHIP
Owens Corning believes that increasing equality in the workplace strengthens our leadership team. A diverse leadership group brings together unique ideas and experiences that will ultimately help our business grow. As such, we are committed to increasing the number of women in leadership roles across the company. With the addition of Adrienne Elsner to the board of directors, our board is now 30% female and half of our members are diverse. In addition to 19% of our total workforce being women, female representation at our middle-management tier reached 24.5% in 2017, which is especially noteworthy considering the population grew 12.1% over the past two years. Our target for female representation of 25% in all leadership levels is close at hand. Acquisitions have diluted our progress to some extent. In 2017, we were at 22.8% female leaders, and excluding 2017 acquisitions, we would be at 23.6%.
Our initiatives to help advance the role of women in the workplace and position them for management-level roles include:
• Targeted recruiting through professional associations;
• Employee referral campaigns with female leaders;
• Options for a flexible work environment;
• Meaningful mentoring relationships between the executive committee and WIN affinity group;
• Leadership training and professional development;
• Support and involvement from female directors on Owens Corning’s board of directors; and
• Luncheon series with executive committee members.
As previously noted, our WIN affinity group expanded greatly in 2017, both in the U.S. and internationally. These efforts are led by women “on the ground” in their own plants. We currently have 12 locations with WIN chapters – a number that is sure to grow in the coming years.
S OCIAL R E S P ON S I B I L ITY
Employee Experience
*Marked data point excludes 2017 acquisitions
Female Representation in Middle and Upper Management (% Female Managers)
25%
24%
23%
22%
21%
20%2015 2016 20172015 2016 2017
21.4%
22.5%22.8%
23.6%*
Female share of total workforce 19%
Females in management positions (as % of total management workforce) 22%
Females in junior management positions, i.e., first level of management (as % of total junior management positions) 23%
Females in top management positions, i.e., maximum two levels away from the CEO or comparable positions (as % of top management positions)
17%
Females in management positions in revenue-generating functions (as % of all managers) 18%
Percentage of Women in Roles Across the Company+
PHOTO CREDIT:
Kate Rand | Waxahachie, Texas, U.S.
The Sierra Nevada Foothills in San Jose, California
S USTAI NAB I LITY I N ACTION
2017 OWENS CORNING SUSTAINABILITY REPORT | PURPOSE + PEOPLE + ACTION | 123
S OCIAL R E S P ON S I B I L ITY
Employee Experience
When the LPGA Tour came to Toledo in July 2017, Owens Corning co-sponsored the inaugural Marathon Classic Women’s Summit. Approximately 400 women, including many Owens Corning employees, attended the event, which raised $50,000 for Toledo-area children’s charities.
Women at the event heard inspirational speakers tell personal stories about the importance of pursuing their dreams while keeping balance in their busy lives. Speakers included news anchor and breast cancer survivor Amy Robach; professional golfer Cheyenne Woods; and U.S. military veteran and double amputee Dan Nevins. Nevins came at the invitation of Owens Corning’s Toledo chapter of the Women’s Information Network (WIN) affinity group, and even spoke to Owens Corning employees at the Toledo office before the event. He relayed his story and a message of perseverance, positivity, and flexibility in the path to success.
Kelly Miller, Owens Corning talent lead, appreciated speakers’ comments on the importance of prioritizing and putting things in perspective. “The speakers made me realize that sometimes it’s important to take some time for myself. I spend most of my time focused on work, my two kids, my husband, and other responsibilities, but I also need to take care of my personal needs. This day allowed me to reflect on my priorities and seek balance.”
Sponsoring a Day of Balance and Growth for Women
2017 OWENS CORNING SUSTAINABILITY REPORT | PURPOSE + PEOPLE + ACTION | 124
SUMMARY OF COMPENSATION AND BENEFITS
We strive to effectively use all elements of compensation to align employees with the goals and objectives of the company and to reinforce the behaviors necessary to achieve success.
Compensation at Owens Corning is designed to be competitive in the local labor market. Base salaries are determined by job responsibility level and are targeted at the market average of companies with whom we compete for talent. Base pay rates are reviewed and updated annually to ensure we are providing fair wages.
In addition to their base pay, salaried employees are eligible to receive additional cash incentives based on the year-end company results and their individual performance. EBIT targets by business and a consolidated corporate target compile the corporate component, while the individual component is based on each employee’s annual performance. This plan leads to a competitive structure, supports our business goals, and results in above-average total cash compensation when the business does well. Our people are the reason we succeed, so it’s only right that they are rewarded when we meet business targets.
In the United States, our compensation team has thoroughly analyzed all current and approved – but not yet enacted – minimum wage increases, and we are currently paying our people at or above all established minimum wage requirements. For Owens Corning, minimum wages are generally not relevant because the majority of our entry-level positions require more advanced skills or knowledge than jobs at which the minimum wage rate would typically apply.
Equal Remuneration
At Owens Corning, we are committed to providing all employees, regardless of gender, with equal remuneration for work of equal value. We reward both individual and collective contributions to our company’s success though base and variable pay. Equal remuneration is a key element of a truly diverse and inclusive environment, and we are dedicated to ensuring equal treatment for all employees.
A consistent philosophy in the design, application, and administration of total compensation programs globally ensures equitable treatment for all employees independent of gender, age, or ethnicity. Employees receive compensation from the company that is proportionate to the impact of role and contribution the individual makes, ensuring fairness in our programs.
Benefits
Employees worldwide have access to employee assistance programs tailored for their country, including mental care and work/life resources. Benefits for U.S. employees include a variety of healthcare options, healthy living resources, preventative care, vacation, life and disability insurance, and work/life benefits. We also offer adoption assistance and family leave programs. Our employee assistance program provides counselors who can help employees with many challenges including child and elder care, stress management, and financial coaching. U.S. employees are provided with benefits starting on their first day of work, with a range of options allowing them to choose coverage based on individual needs.
For more information on employee benefits, visit: https://jobs.owenscorningcareers.com/benefits
S OCIAL R E S P ON S I B I L ITY
Employee Experience
2017 OWENS CORNING SUSTAINABILITY REPORT | PURPOSE + PEOPLE + ACTION | 125
Scholarships
Employees who have worked at Owens Corning for at least one year are eligible to apply for the Owens Corning Employee Scholarship for a higher education degree. Recipients are selected based on manager recommendations, statement of career goals, demonstrated leadership, and past academic performance.
Succession Planning
During our annual talent review, we analyze a variety of metrics designed to assess the quality of our succession planning process. Examples of topics we explore during the formal talent evaluation process include:
• What capabilities are required in the future that we do not have today? Is it possible to grow these capabilities internally?
• Are there any retention concerns?
• What is the existing talent pipeline?
Our employees’ readiness for future roles and experiences within the organization is evaluated as part of this process. In tandem, a plan is developed for the growth of our employees to ensure the next steps are in place for their development.
Transition Assistance Programs
We look to help employees through every level of their career, from entry level to retirement. Owens Corning offers onsite retirement planning workshops to help employees prepare for life after work. In addition, career transition support for full-time global, salaried, separated employees may be authorized by the HR leader on an individual basis. Over the past three years, Owens Corning has studied our retirement program to ensure we are using the right approach. Based on this study, we are actively looking at different policies and ways we can improve our support for the transition to retirement.
Owens Corning partners with Right Management, which offers a variety of career transition programs. Individuals benefit from a personalized approach to career transition with flexible access, state-of-the-art technology, and connections to critical resources. Career transition assistance is not available for employees who were terminated for cause, such as gross misconduct, dishonesty, or violation of our business conduct policy.
Owens Corning grants up to 12 weeks of leave as specified by the Family and Medical Leave Act (FMLA). An additional leave of absence for personal reasons may be granted without pay when approved by the appropriate management. Maximum leave for personal reasons shall not exceed 60 days, unless approved by the business unit/process area vice president of human resources. Personal reasons could include education, family issues, etc.
As parental leave varies in accordance with both local laws and customs across the areas where we operate, Owens Corning is unable to track retention rates of employees coming back from parental leave.
S OCIAL R E S P ON S I B I L ITY
Employee Experience
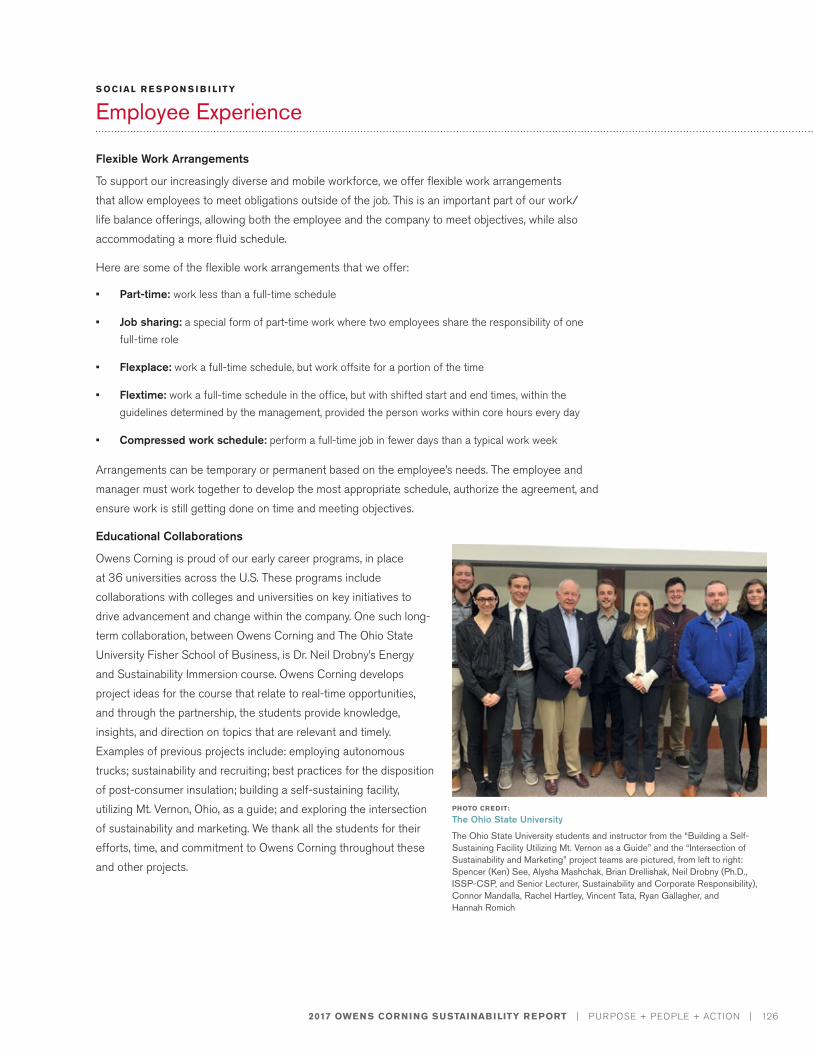
2017 OWENS CORNING SUSTAINABILITY REPORT | PURPOSE + PEOPLE + ACTION | 126
Flexible Work Arrangements
To support our increasingly diverse and mobile workforce, we offer flexible work arrangements that allow employees to meet obligations outside of the job. This is an important part of our work/life balance offerings, allowing both the employee and the company to meet objectives, while also accommodating a more fluid schedule.
Here are some of the flexible work arrangements that we offer:
• Part-time: work less than a full-time schedule
• Job sharing: a special form of part-time work where two employees share the responsibility of one full-time role
• Flexplace: work a full-time schedule, but work offsite for a portion of the time
• Flextime: work a full-time schedule in the office, but with shifted start and end times, within the guidelines determined by the management, provided the person works within core hours every day
• Compressed work schedule: perform a full-time job in fewer days than a typical work week
Arrangements can be temporary or permanent based on the employee’s needs. The employee and manager must work together to develop the most appropriate schedule, authorize the agreement, and ensure work is still getting done on time and meeting objectives.
Educational Collaborations
Owens Corning is proud of our early career programs, in place at 36 universities across the U.S. These programs include collaborations with colleges and universities on key initiatives to drive advancement and change within the company. One such long-term collaboration, between Owens Corning and The Ohio State University Fisher School of Business, is Dr. Neil Drobny’s Energy and Sustainability Immersion course. Owens Corning develops project ideas for the course that relate to real-time opportunities, and through the partnership, the students provide knowledge, insights, and direction on topics that are relevant and timely. Examples of previous projects include: employing autonomous trucks; sustainability and recruiting; best practices for the disposition of post-consumer insulation; building a self-sustaining facility, utilizing Mt. Vernon, Ohio, as a guide; and exploring the intersection of sustainability and marketing. We thank all the students for their efforts, time, and commitment to Owens Corning throughout these and other projects.
S OCIAL R E S P ON S I B I L ITY
Employee Experience
PHOTO CREDIT:
The Ohio State University
The Ohio State University students and instructor from the “Building a Self-Sustaining Facility Utilizing Mt. Vernon as a Guide” and the “Intersection of Sustainability and Marketing” project teams are pictured, from left to right: Spencer (Ken) See, Alysha Mashchak, Brian Drellishak, Neil Drobny (Ph.D., ISSP-CSP, and Senior Lecturer, Sustainability and Corporate Responsibility), Connor Mandalla, Rachel Hartley, Vincent Tata, Ryan Gallagher, and Hannah Romich
2017 OWENS CORNING SUSTAINABILITY REPORT | PURPOSE + PEOPLE + ACTION | 127
LABOR RELATIONS
Approximately 64% of our employees are covered by collective bargaining agreements. This includes relationships with unions, work councils, and employee associations around the world.
The specific language and scope of our labor agreements vary from site to site. All are structured to recognize the importance jointly placed upon health and safety as a guiding principle and core value of both Owens Corning and our workers. In all our facilities, employees are trained to understand, appreciate, and mitigate risk in the interest of their own safety and health, the safety and health of those around them, and of the organization overall. This work touches and involves every employee of Owens Corning globally.
Notice Periods for Operations Changes
Owens Corning prides itself on being a good corporate citizen and respects the rights of its employees, including the rights to exercise freedom of association and collective bargaining. We partner with suppliers who maintain the same philosophy.
The company has a variety of methods that it uses to ensure that workers are kept informed of operations changes, including the global intranet site, email communications, and leadership meetings with team members to communicate news.
Owens Corning provides at least the minimum notice required, which varies by local legislation and collective bargaining agreements in the regions where we operate.
In many jurisdictions, our union and self-represented employees enjoy similar notice periods because of strong employee relations and labor practices, as well as applicable regulations.
S OCIAL R E S P ON S I B I L ITY
Employee Experience
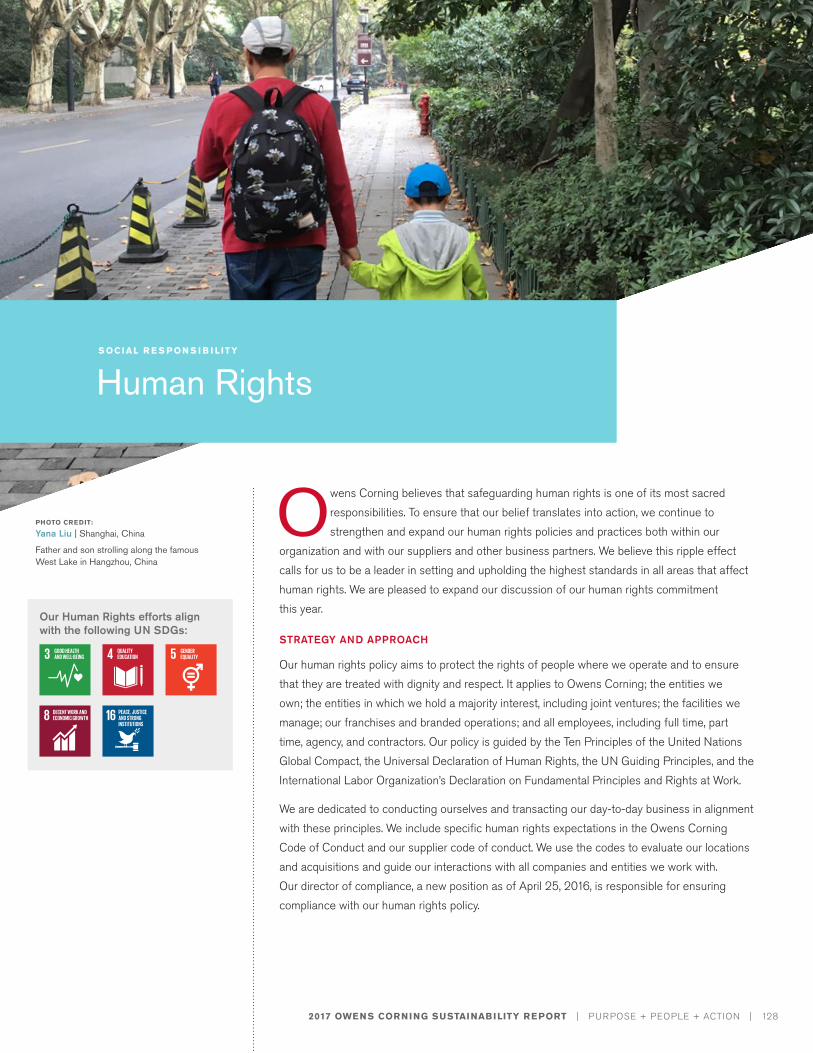
2017 OWENS CORNING SUSTAINABILITY REPORT | PURPOSE + PEOPLE + ACTION | 128
Our Human Rights efforts align with the following UN SDGs:
PHOTO CREDIT:
Yana Liu | Shanghai, China
Father and son strolling along the famous West Lake in Hangzhou, China
Owens Corning believes that safeguarding human rights is one of its most sacred responsibilities. To ensure that our belief translates into action, we continue to strengthen and expand our human rights policies and practices both within our
organization and with our suppliers and other business partners. We believe this ripple effect calls for us to be a leader in setting and upholding the highest standards in all areas that affect human rights. We are pleased to expand our discussion of our human rights commitment this year.
STRATEGY AND APPROACH
Our human rights policy aims to protect the rights of people where we operate and to ensure that they are treated with dignity and respect. It applies to Owens Corning; the entities we own; the entities in which we hold a majority interest, including joint ventures; the facilities we manage; our franchises and branded operations; and all employees, including full time, part time, agency, and contractors. Our policy is guided by the Ten Principles of the United Nations Global Compact, the Universal Declaration of Human Rights, the UN Guiding Principles, and the International Labor Organization’s Declaration on Fundamental Principles and Rights at Work.
We are dedicated to conducting ourselves and transacting our day-to-day business in alignment with these principles. We include specific human rights expectations in the Owens Corning Code of Conduct and our supplier code of conduct. We use the codes to evaluate our locations and acquisitions and guide our interactions with all companies and entities we work with. Our director of compliance, a new position as of April 25, 2016, is responsible for ensuring compliance with our human rights policy.
S OCIAL R E S P ON S I B I L ITY
Human Rights
2017 OWENS CORNING SUSTAINABILITY REPORT | PURPOSE + PEOPLE + ACTION | 129
In addition, Owens Corning’s policies are based on the following definitions:
• Owens Corning defines “child labor” as work or service extracted from anyone under the age of 16, the minimum age for employment in that country, or the age for completing compulsory education in that country, whichever is higher.
• Owens Corning defines “forced labor” as any work or service not voluntarily performed and extracted from an individual under the menace of penalty and/or subject to unduly burdensome conditions such as, but not limited to, the surrender of government-issued identification, passports, or work permits, or any other limitations inhibiting the employee’s free will with respect to work.
• Owens Corning defines “convict labor” as any labor performed by a legally convicted person on or outside of prison grounds.
• The definitions of “slave labor” and “bonded labor” as defined by Owens Corning are reflected in the Supplementary Convention on the Abolition of Slavery, the Slave Trade, and Institutions and Practices Similar to Slavery under Articles 1 and 7.
Our Policy: Stronger and More Inclusive
In 2016, we revised our human rights policy to be more inclusive, by enhancing existing policies and expanding our coverage of human rights issues. For example, our enhanced policy more fully defines our strong position against forced or compulsory labor, including slavery and human trafficking. It also explains our commitment to working with and encouraging our suppliers, customers, and other business relationships to uphold the principles in the policy and to adopt similar policies within their businesses.
Our human rights policy details our commitments in the following areas:
• Nondiscrimination and equal opportunity, including providing employment and advancement opportunities to individuals based on merit, qualifications, and abilities, and not tolerating acts of discrimination
• No use of child labor in our operations and not knowingly engaging with a supplier or distributor or entering into a joint venture with an organization that directly or indirectly does so
• Indigenous peoples/traditional/land rights, based on the principles of ILO Convention No. 169 of Indigenous and Tribal Peoples
• No use of forced labor in our operations and not knowingly engaging with a supplier or distributor or entering into a joint venture with an organization that directly or indirectly does so; commitment to disclose information regarding our efforts to eradicate slavery and human trafficking from our direct supply chain and internal operations
• Compliance with U.S. Securities and Exchange Commission rules on disclosing any use of conflict minerals and not tolerating the use of raw materials that directly or indirectly contribute to armed
conflict or human rights abuses in any of our products
• Employment standards, compensation, and working conditions, including training managers and employees, and providing support mechanisms for grievances and dispute resolution
• Freedom of association and collective bargaining
S OCIAL R E S P ON S I B I L ITY
Human Rights
2017 OWENS CORNING SUSTAINABILITY REPORT | PURPOSE + PEOPLE + ACTION | 130
• Safety, health, environmental, and product stewardship in the workplace, in the community, and for our products
• Workplace security, including maintaining a workplace free from violence, harassment, intimidation, and other unsafe or disruptive conditions due to internal and external threats
• Nonharassment – we are committed to creating a work environment free from harassment or any kind of conduct that threatens, intimidates, or coerces another person
• Privacy for employees and stakeholders, including being committed to collecting, processing, and transferring personal data responsibly worldwide
• Commitment to being proactive in the communities in which we live and work, and encouraging employee involvement with community organizations and foundations
• Commitment to sharing our policies and progress under a framework for compliance that includes training, continuous improvement processes, follow-up, and annual reporting
Our policies are made available to employees via the intranet (“Code of Conduct & Policies”) and are also posted on our website. We have them available in 12 languages to ensure understanding and compliance. Each of our facilities is asked to display materials highlighting these policies.
In addition to the human rights policy, related policies and documents available for reference include:
• Owens Corning Code of Conduct
• Supplier Code of Conduct
• Statement on Slavery and Human Trafficking
• Equal Opportunity Policy
• Nonharassment Policy
• Environmental, Health, Safety, and Product Stewardship Policy
• Data Privacy Policy
TRAINING EMPLOYEES ON HUMAN RIGHTS
We consider our human rights policy and code of conduct extensions of our corporate values, and 100% compliance is an expectation of employment at Owens Corning.
All staff employees are given our policies upon hire and are provided refresher training, as needed. Following the course, employees are required to certify their compliance and are given an opportunity to disclose any nonconformance. Special attention is given to personnel in key groups such as environmental, safety, and security teams. In addition, managers are expected to lead by example. Our hope and expectations are that these policies are incorporated into the way all employees work every day, with customers, colleagues, suppliers, and the public.
S OCIAL R E S P ON S I B I L ITY
Human Rights
PHOTO CREDIT:
Li Han | Nanjing, China
“Yellow” and “Red solo” at Nanjing, China, plant
2017 OWENS CORNING SUSTAINABILITY REPORT | PURPOSE + PEOPLE + ACTION | 131
The following data underscore the priority we place on training our employees on our human rights policy:
• We have devoted approximately 5,940 hours to this training for 5,402 employees, which is approximately 31% of our total employees.
• 24% of security personnel, including those employed by third-party organizations, have received formal training on our updated policies.
• In 2016 through early 2018, approximately 1,623 employees from the businesses we acquired were trained on our code of conduct and human rights requirements. We typically conduct training within six months following an acquisition.
Other Actions to Support Our Policy
Several companywide initiatives underway are supporting our commitment to a strong Human Rights Policy, including the following:
• We implemented a single pay platform globally as of January 1, 2018. This new pay system enables us to better enforce minimum wage and hour standards throughout our worldwide operations.
• We conducted a study to ensure we provide a minimum wage at or above standard for U.S. employees.
• We are undertaking studies on pay equity by gender. These studies are in addition to the diversity studies required by our government contractor classification under Affirmative Action. We intend to conduct pay equity studies every two years and address any concerns.
UPHOLDING HIGH STANDARDS FOR SUPPLIERS
We seek business partners who share our commitment to human rights. We expect our suppliers, customers, and other business relationships to uphold the principles in our human rights policy and to adopt similar policies within their businesses. We also expect our partners to act according to these principles in their own business relationships.
Our supplier code of conduct is aligned with our human rights policy, and details expectations for any organization or entity that directly provides goods and/or services to Owens Corning. Current content covers our response to new legislation about human trafficking and conflict minerals, as well as our drive to become industry leaders in responsible sourcing.
We use the supplier code of conduct as a reference point in the sourcing selection process. We also use it to measure performance in our supplier reviews and risk assessments as well as to train suppliers. Our sourcing and supply chain leaders take the lead for this proactive and practical approach for managing human rights issues among our suppliers.
For more information on Supply Chain Sustainability, see page 160.
REVIEWING AND ASSESSING IMPACT
While we are confident in the components of our human rights policy and can point to facilities that we consider models of treating others with fairness and respect, we continue to look for ways to strengthen the implementation of our policy, verify compliance, and address gaps when needed. Toward this goal, we developed a more rigorous compliance and assessment framework and monitoring mechanism in late 2016 to correspond with the revised policy. We provided additional training on audit and monitoring issues, and began implementation of the revised framework in 2017, which will continue in 2018.
S OCIAL R E S P ON S I B I L ITY
Human Rights
2017 OWENS CORNING SUSTAINABILITY REPORT | PURPOSE + PEOPLE + ACTION | 132
Here are some highlights of our progress to date:
• We have revised our audit processes to include on-the-ground visual observations for several elements of the policy. We began them on a trial basis during environmental and safety audits that were already part of our process. When questions arise, we seek to resolve them immediately.
» Thirteen sites were assessed in 2017, which included all three Owens Corning business units (Composites, Insulation, and Roofing) and represented each region of the world with production facilities including North America, Europe, and Asia Pacific. All sites had some type of mitigation plan in the areas of safety and health. Findings that are identified are categorized by risk. High risk findings are tracked to completion in a corporate findings repository. All risk findings are required to be closed.
• We identified country locations where risk of forced or compulsory labor is prevalent according to U.S. State Department and EIRIS data. We mapped both our top segmented suppliers and our own locations to identify the number of locations in higher-risk countries. This information provides a basis for continued monitoring for compliance both in evaluating supplier risk and within our own operations.
• No cases of forced or compulsory labor were identified or reported in 2017. Also, no human rights risks were discovered that required remediation in 2017.
• As a company, we have identified women, LGBTQ, and minority populations as additional vulnerable groups that should be addressed, and we have created affinity groups to address the specific risks and needs of these populations.
• We conduct annual human rights assessments via a survey for our key suppliers, which comprise 87% of our spending.
• Our human rights policy has become part of our due diligence playbook for potential acquisitions, which are a key element of our growth strategy. This process involves reviewing labor and human rights policies and practices and assessing risks, including evaluating any potential impacts on vulnerable populations such as tribal lands/indigenous people.
A LEARNING ORGANIZATION: GROWING AND EVOLVING
We consider ourselves a “learning organization,” dedicated to continually evolving and growing. As with all elements that contribute to our sustainability, we continue to look for ways to improve our human rights policy, not only in response to changes in laws or regulations but also at any time we feel we can create better safeguards for the health and well-being of the people we impact. And we will continue to devote the resources necessary for effective follow-through. Consistent with our commitment to build market-leading businesses that are global in scope, human in scale, we desire to be a strong, positive influence on our markets and our stakeholders, and our human rights efforts are critical to creating a future that enriches us all.
S OCIAL R E S P ON S I B I L ITY
Human Rights
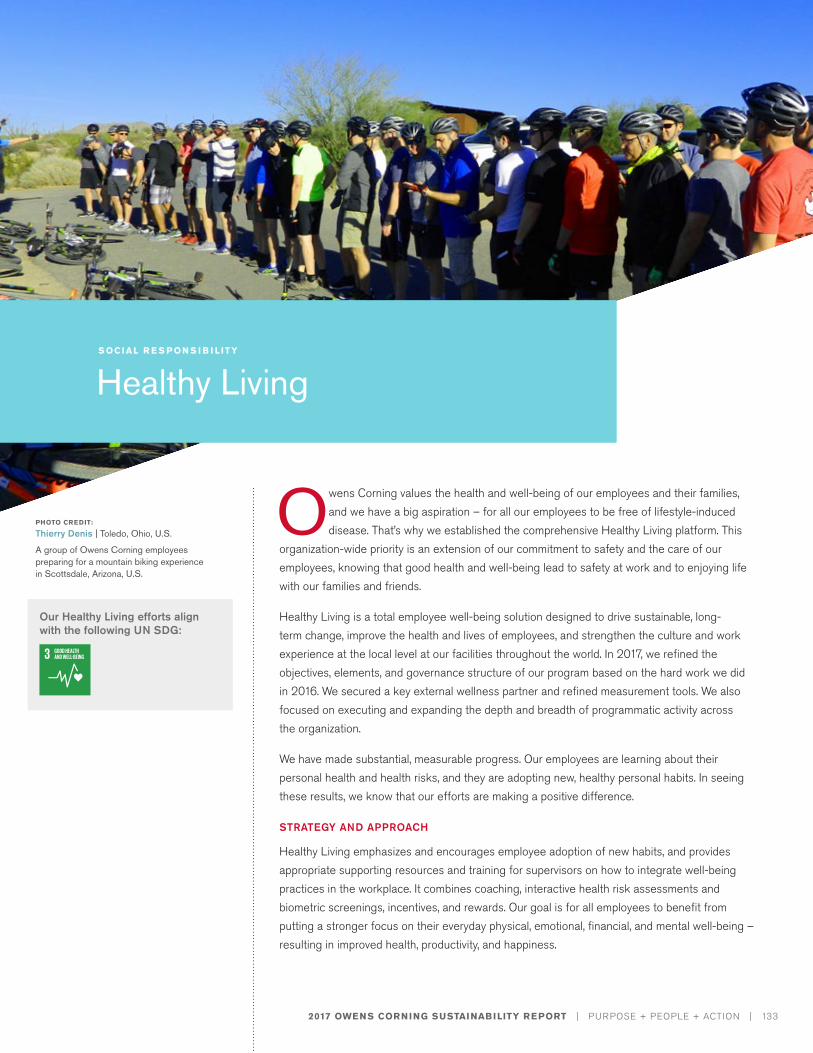
2017 OWENS CORNING SUSTAINABILITY REPORT | PURPOSE + PEOPLE + ACTION | 133
PHOTO CREDIT:
Thierry Denis | Toledo, Ohio, U.S.
A group of Owens Corning employees preparing for a mountain biking experience in Scottsdale, Arizona, U.S.
Owens Corning values the health and well-being of our employees and their families, and we have a big aspiration – for all our employees to be free of lifestyle-induced disease. That’s why we established the comprehensive Healthy Living platform. This
organization-wide priority is an extension of our commitment to safety and the care of our employees, knowing that good health and well-being lead to safety at work and to enjoying life with our families and friends.
Healthy Living is a total employee well-being solution designed to drive sustainable, long-term change, improve the health and lives of employees, and strengthen the culture and work experience at the local level at our facilities throughout the world. In 2017, we refined the objectives, elements, and governance structure of our program based on the hard work we did in 2016. We secured a key external wellness partner and refined measurement tools. We also focused on executing and expanding the depth and breadth of programmatic activity across the organization.
We have made substantial, measurable progress. Our employees are learning about their personal health and health risks, and they are adopting new, healthy personal habits. In seeing these results, we know that our efforts are making a positive difference.
STRATEGY AND APPROACH
Healthy Living emphasizes and encourages employee adoption of new habits, and provides appropriate supporting resources and training for supervisors on how to integrate well-being practices in the workplace. It combines coaching, interactive health risk assessments and biometric screenings, incentives, and rewards. Our goal is for all employees to benefit from putting a stronger focus on their everyday physical, emotional, financial, and mental well-being – resulting in improved health, productivity, and happiness.
S OCIAL R E S P ON S I B I L ITY
Healthy Living
Our Healthy Living efforts align with the following UN SDG:
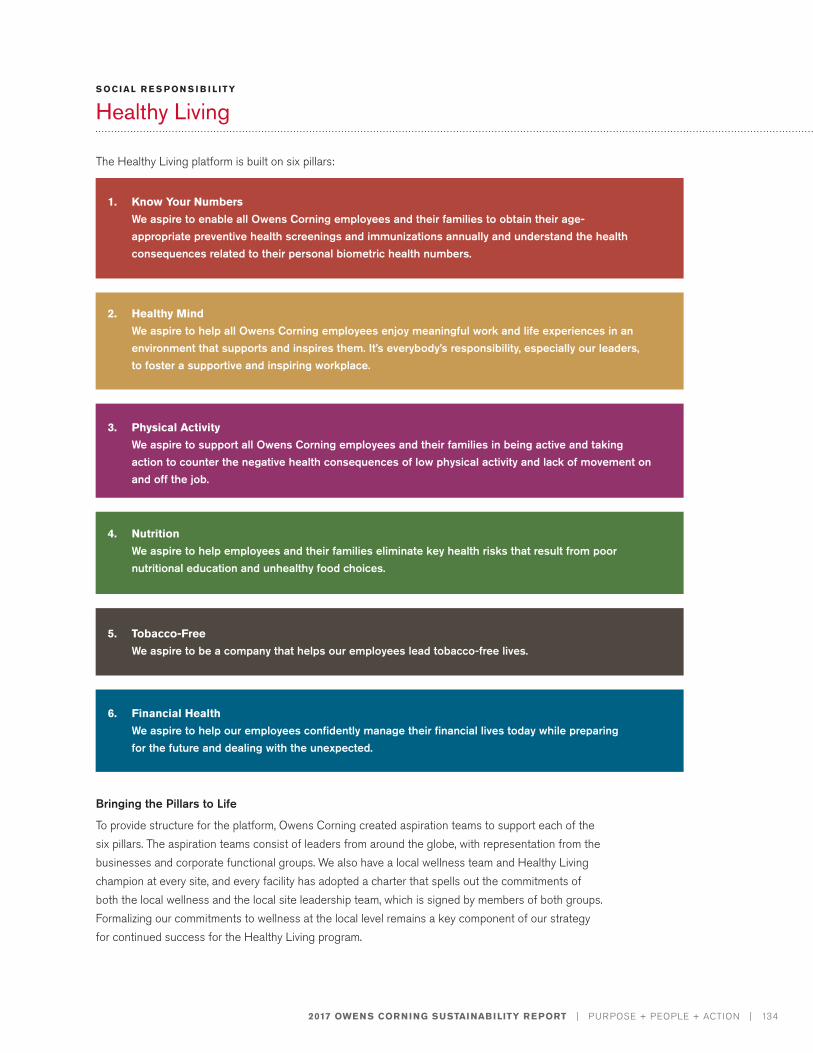
2017 OWENS CORNING SUSTAINABILITY REPORT | PURPOSE + PEOPLE + ACTION | 134
S OCIAL R E S P ON S I B I L ITY
Healthy Living
The Healthy Living platform is built on six pillars:
Bringing the Pillars to Life
To provide structure for the platform, Owens Corning created aspiration teams to support each of the six pillars. The aspiration teams consist of leaders from around the globe, with representation from the businesses and corporate functional groups. We also have a local wellness team and Healthy Living champion at every site, and every facility has adopted a charter that spells out the commitments of both the local wellness and the local site leadership team, which is signed by members of both groups. Formalizing our commitments to wellness at the local level remains a key component of our strategy for continued success for the Healthy Living program.
1. Know Your NumbersWe aspire to enable all Owens Corning employees and their families to obtain their age-appropriate preventive health screenings and immunizations annually and understand the health consequences related to their personal biometric health numbers.
2. Healthy MindWe aspire to help all Owens Corning employees enjoy meaningful work and life experiences in an environment that supports and inspires them. It’s everybody’s responsibility, especially our leaders, to foster a supportive and inspiring workplace.
3. Physical ActivityWe aspire to support all Owens Corning employees and their families in being active and taking action to counter the negative health consequences of low physical activity and lack of movement on and off the job.
4. NutritionWe aspire to help employees and their families eliminate key health risks that result from poor nutritional education and unhealthy food choices.
5. Tobacco-FreeWe aspire to be a company that helps our employees lead tobacco-free lives.
6. Financial HealthWe aspire to help our employees confidently manage their financial lives today while preparing for the future and dealing with the unexpected.
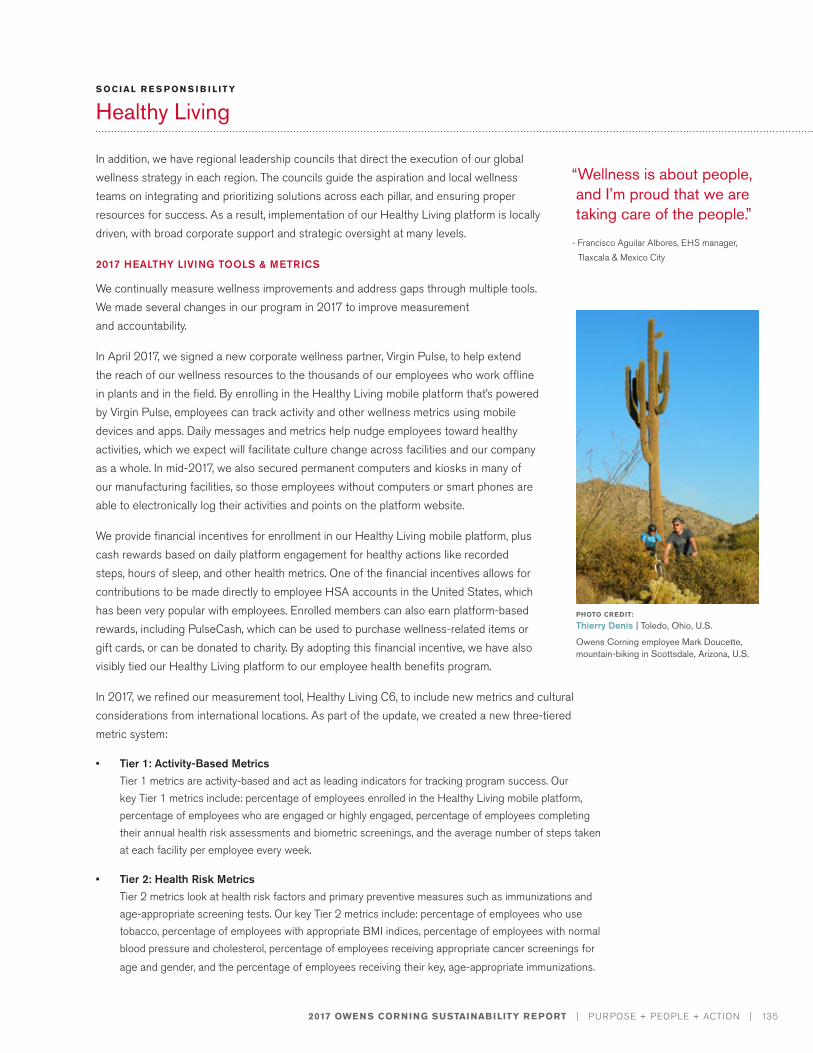
2017 OWENS CORNING SUSTAINABILITY REPORT | PURPOSE + PEOPLE + ACTION | 135
In addition, we have regional leadership councils that direct the execution of our global wellness strategy in each region. The councils guide the aspiration and local wellness teams on integrating and prioritizing solutions across each pillar, and ensuring proper resources for success. As a result, implementation of our Healthy Living platform is locally driven, with broad corporate support and strategic oversight at many levels.
2017 HEALTHY LIVING TOOLS & METRICS
We continually measure wellness improvements and address gaps through multiple tools. We made several changes in our program in 2017 to improve measurement and accountability.
In April 2017, we signed a new corporate wellness partner, Virgin Pulse, to help extend the reach of our wellness resources to the thousands of our employees who work offline in plants and in the field. By enrolling in the Healthy Living mobile platform that’s powered by Virgin Pulse, employees can track activity and other wellness metrics using mobile devices and apps. Daily messages and metrics help nudge employees toward healthy activities, which we expect will facilitate culture change across facilities and our company as a whole. In mid-2017, we also secured permanent computers and kiosks in many of our manufacturing facilities, so those employees without computers or smart phones are able to electronically log their activities and points on the platform website.
We provide financial incentives for enrollment in our Healthy Living mobile platform, plus cash rewards based on daily platform engagement for healthy actions like recorded steps, hours of sleep, and other health metrics. One of the financial incentives allows for contributions to be made directly to employee HSA accounts in the United States, which has been very popular with employees. Enrolled members can also earn platform-based rewards, including PulseCash, which can be used to purchase wellness-related items or gift cards, or can be donated to charity. By adopting this financial incentive, we have also visibly tied our Healthy Living platform to our employee health benefits program.
In 2017, we refined our measurement tool, Healthy Living C6, to include new metrics and cultural considerations from international locations. As part of the update, we created a new three-tiered metric system:
• Tier 1: Activity-Based MetricsTier 1 metrics are activity-based and act as leading indicators for tracking program success. Our key Tier 1 metrics include: percentage of employees enrolled in the Healthy Living mobile platform, percentage of employees who are engaged or highly engaged, percentage of employees completing their annual health risk assessments and biometric screenings, and the average number of steps taken at each facility per employee every week.
• Tier 2: Health Risk MetricsTier 2 metrics look at health risk factors and primary preventive measures such as immunizations and age-appropriate screening tests. Our key Tier 2 metrics include: percentage of employees who use tobacco, percentage of employees with appropriate BMI indices, percentage of employees with normal blood pressure and cholesterol, percentage of employees receiving appropriate cancer screenings for
age and gender, and the percentage of employees receiving their key, age-appropriate immunizations.
S OCIAL R E S P ON S I B I L ITY
Healthy Living
“Wellness is about people, and I’m proud that we are taking care of the people.”
- Francisco Aguilar Albores, EHS manager, Tlaxcala & Mexico City
PHOTO CREDIT:
Thierry Denis | Toledo, Ohio, U.S.
Owens Corning employee Mark Doucette, mountain-biking in Scottsdale, Arizona, U.S.
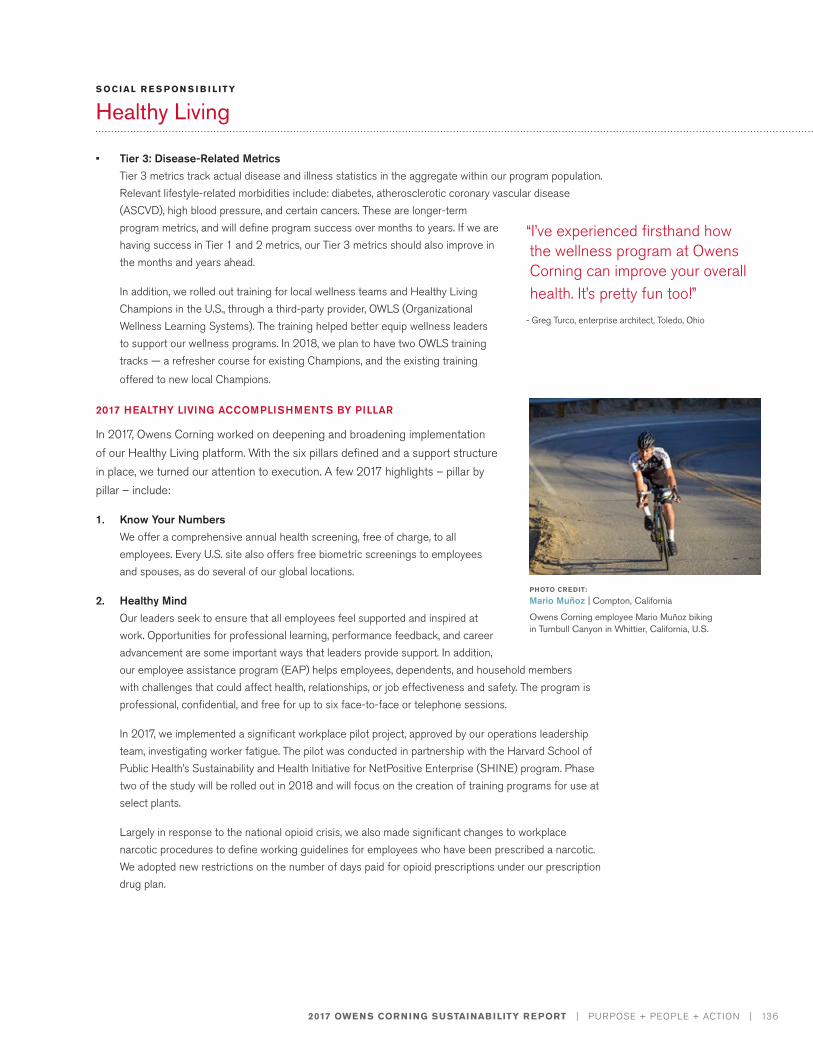
2017 OWENS CORNING SUSTAINABILITY REPORT | PURPOSE + PEOPLE + ACTION | 136
• Tier 3: Disease-Related Metrics Tier 3 metrics track actual disease and illness statistics in the aggregate within our program population. Relevant lifestyle-related morbidities include: diabetes, atherosclerotic coronary vascular disease (ASCVD), high blood pressure, and certain cancers. These are longer-term program metrics, and will define program success over months to years. If we are having success in Tier 1 and 2 metrics, our Tier 3 metrics should also improve in the months and years ahead.
In addition, we rolled out training for local wellness teams and Healthy Living Champions in the U.S., through a third-party provider, OWLS (Organizational Wellness Learning Systems). The training helped better equip wellness leaders to support our wellness programs. In 2018, we plan to have two OWLS training tracks — a refresher course for existing Champions, and the existing training
offered to new local Champions.
2017 HEALTHY LIVING ACCOMPLISHMENTS BY PILLAR
In 2017, Owens Corning worked on deepening and broadening implementation of our Healthy Living platform. With the six pillars defined and a support structure in place, we turned our attention to execution. A few 2017 highlights – pillar by pillar – include:
1. Know Your NumbersWe offer a comprehensive annual health screening, free of charge, to all employees. Every U.S. site also offers free biometric screenings to employees and spouses, as do several of our global locations.
2. Healthy MindOur leaders seek to ensure that all employees feel supported and inspired at work. Opportunities for professional learning, performance feedback, and career advancement are some important ways that leaders provide support. In addition, our employee assistance program (EAP) helps employees, dependents, and household members with challenges that could affect health, relationships, or job effectiveness and safety. The program is professional, confidential, and free for up to six face-to-face or telephone sessions.
In 2017, we implemented a significant workplace pilot project, approved by our operations leadership team, investigating worker fatigue. The pilot was conducted in partnership with the Harvard School of Public Health’s Sustainability and Health Initiative for NetPositive Enterprise (SHINE) program. Phase two of the study will be rolled out in 2018 and will focus on the creation of training programs for use at select plants.
Largely in response to the national opioid crisis, we also made significant changes to workplace narcotic procedures to define working guidelines for employees who have been prescribed a narcotic. We adopted new restrictions on the number of days paid for opioid prescriptions under our prescription drug plan.
S OCIAL R E S P ON S I B I L ITY
Healthy Living
“I’ve experienced firsthand how the wellness program at Owens Corning can improve your overall health. It’s pretty fun too!”
- Greg Turco, enterprise architect, Toledo, Ohio
PHOTO CREDIT:
Mario Muñoz | Compton, California
Owens Corning employee Mario Muñoz biking in Turnbull Canyon in Whittier, California, U.S.
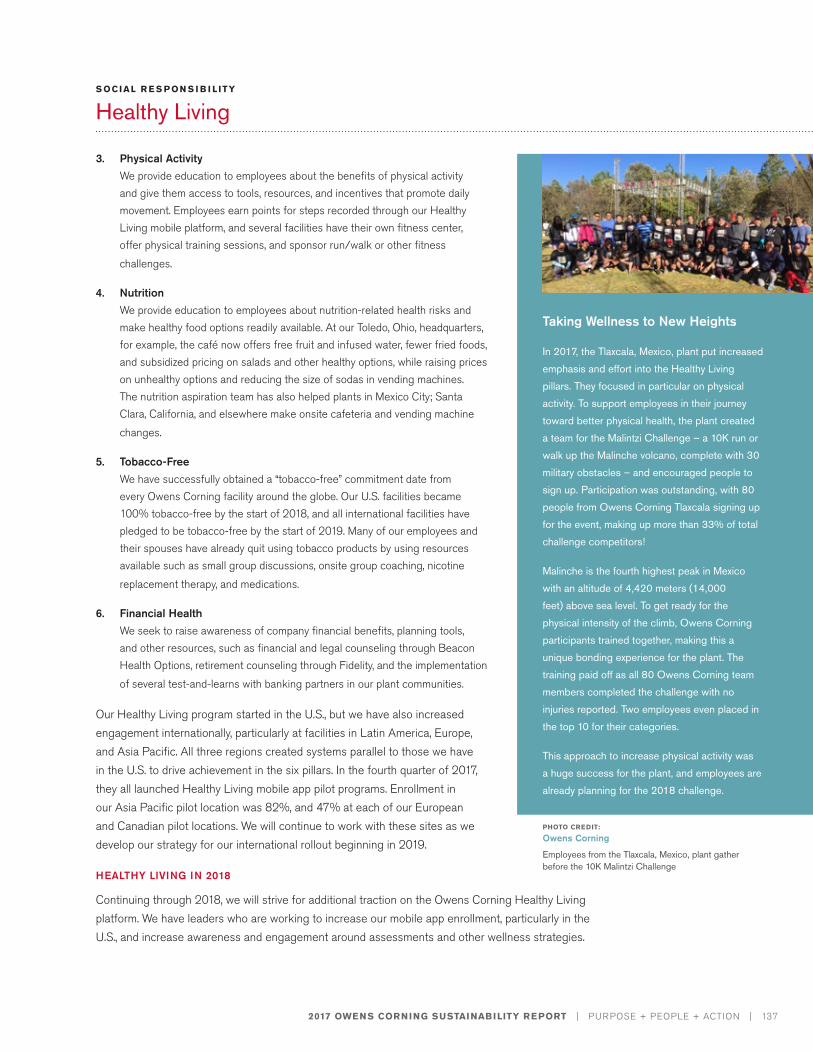
2017 OWENS CORNING SUSTAINABILITY REPORT | PURPOSE + PEOPLE + ACTION | 137
3. Physical ActivityWe provide education to employees about the benefits of physical activity and give them access to tools, resources, and incentives that promote daily movement. Employees earn points for steps recorded through our Healthy Living mobile platform, and several facilities have their own fitness center, offer physical training sessions, and sponsor run/walk or other fitness
challenges.
4. NutritionWe provide education to employees about nutrition-related health risks and make healthy food options readily available. At our Toledo, Ohio, headquarters, for example, the café now offers free fruit and infused water, fewer fried foods, and subsidized pricing on salads and other healthy options, while raising prices on unhealthy options and reducing the size of sodas in vending machines. The nutrition aspiration team has also helped plants in Mexico City; Santa Clara, California, and elsewhere make onsite cafeteria and vending machine
changes.
5. Tobacco-FreeWe have successfully obtained a “tobacco-free” commitment date from every Owens Corning facility around the globe. Our U.S. facilities became 100% tobacco-free by the start of 2018, and all international facilities have pledged to be tobacco-free by the start of 2019. Many of our employees and their spouses have already quit using tobacco products by using resources available such as small group discussions, onsite group coaching, nicotine
replacement therapy, and medications.
6. Financial HealthWe seek to raise awareness of company financial benefits, planning tools, and other resources, such as financial and legal counseling through Beacon Health Options, retirement counseling through Fidelity, and the implementation
of several test-and-learns with banking partners in our plant communities.
Our Healthy Living program started in the U.S., but we have also increased engagement internationally, particularly at facilities in Latin America, Europe, and Asia Pacific. All three regions created systems parallel to those we have in the U.S. to drive achievement in the six pillars. In the fourth quarter of 2017, they all launched Healthy Living mobile app pilot programs. Enrollment in our Asia Pacific pilot location was 82%, and 47% at each of our European and Canadian pilot locations. We will continue to work with these sites as we develop our strategy for our international rollout beginning in 2019.
HEALTHY LIVING IN 2018
Continuing through 2018, we will strive for additional traction on the Owens Corning Healthy Living platform. We have leaders who are working to increase our mobile app enrollment, particularly in the U.S., and increase awareness and engagement around assessments and other wellness strategies.
S OCIAL R E S P ON S I B I L ITY
Healthy Living
Taking Wellness to New Heights
In 2017, the Tlaxcala, Mexico, plant put increased
emphasis and effort into the Healthy Living
pillars. They focused in particular on physical
activity. To support employees in their journey
toward better physical health, the plant created
a team for the Malintzi Challenge – a 10K run or
walk up the Malinche volcano, complete with 30
military obstacles – and encouraged people to
sign up. Participation was outstanding, with 80
people from Owens Corning Tlaxcala signing up
for the event, making up more than 33% of total
challenge competitors!
Malinche is the fourth highest peak in Mexico
with an altitude of 4,420 meters (14,000
feet) above sea level. To get ready for the
physical intensity of the climb, Owens Corning
participants trained together, making this a
unique bonding experience for the plant. The
training paid off as all 80 Owens Corning team
members completed the challenge with no
injuries reported. Two employees even placed in
the top 10 for their categories.
This approach to increase physical activity was
a huge success for the plant, and employees are
already planning for the 2018 challenge.
PHOTO CREDIT:
Owens Corning
Employees from the Tlaxcala, Mexico, plant gather before the 10K Malintzi Challenge
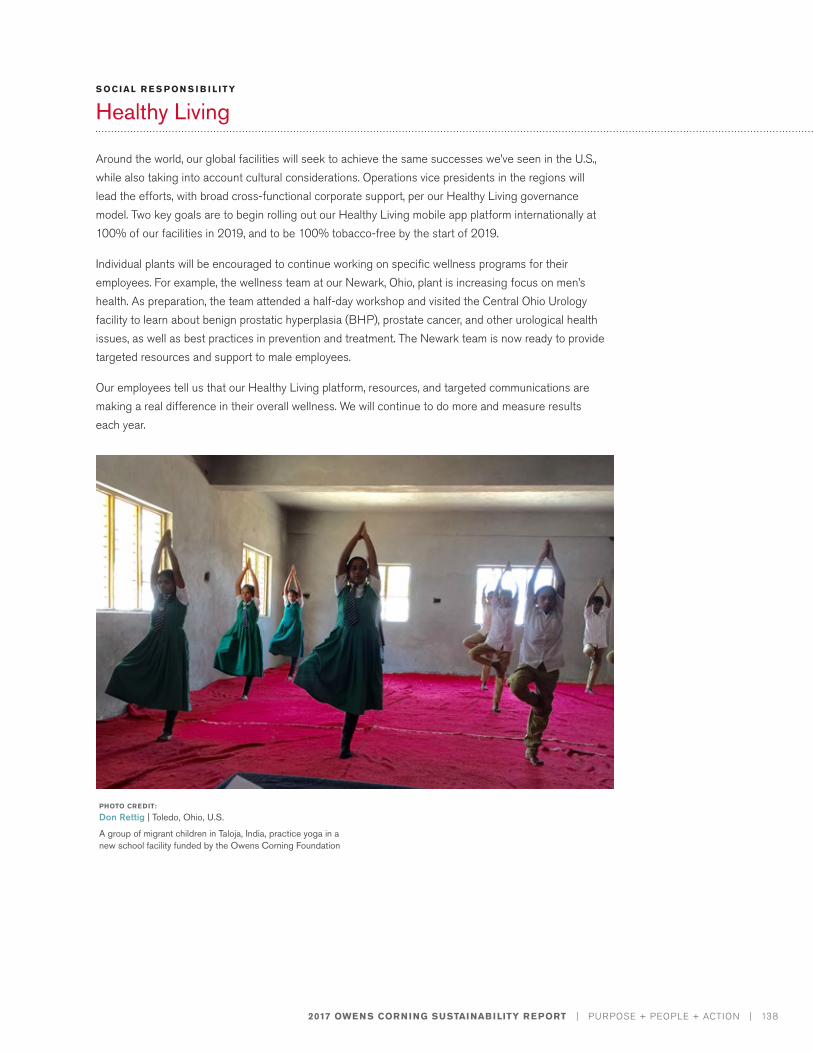
2017 OWENS CORNING SUSTAINABILITY REPORT | PURPOSE + PEOPLE + ACTION | 138
Around the world, our global facilities will seek to achieve the same successes we’ve seen in the U.S., while also taking into account cultural considerations. Operations vice presidents in the regions will lead the efforts, with broad cross-functional corporate support, per our Healthy Living governance model. Two key goals are to begin rolling out our Healthy Living mobile app platform internationally at 100% of our facilities in 2019, and to be 100% tobacco-free by the start of 2019.
Individual plants will be encouraged to continue working on specific wellness programs for their employees. For example, the wellness team at our Newark, Ohio, plant is increasing focus on men’s health. As preparation, the team attended a half-day workshop and visited the Central Ohio Urology facility to learn about benign prostatic hyperplasia (BHP), prostate cancer, and other urological health issues, as well as best practices in prevention and treatment. The Newark team is now ready to provide targeted resources and support to male employees.
Our employees tell us that our Healthy Living platform, resources, and targeted communications are making a real difference in their overall wellness. We will continue to do more and measure results each year.
S OCIAL R E S P ON S I B I L ITY
Healthy Living
PHOTO CREDIT:
Don Rettig | Toledo, Ohio, U.S.
A group of migrant children in Taloja, India, practice yoga in a new school facility funded by the Owens Corning Foundation
S USTAI NAB I LITY I N ACTION
2017 OWENS CORNING SUSTAINABILITY REPORT | PURPOSE + PEOPLE + ACTION | 139
S OCIAL R E S P ON S I B I L ITY
Healthy Living
Health Clinics at Our Workplaces
Easy access and quality are very important when it comes to health care. Improving access to quality health care is a national priority and one that we are addressing with our employees through a partnership with ProMedica health system, headquartered in Toledo, Ohio.
In February 2016, we opened our first onsite clinic at our Toledo headquarters, staffed by our ProMedica partners. The project was enthusiastically received by our employees and their spouses, and many of them have now become regular patients of our clinic’s ProMedica doctor.
Following this successful launch, we opened two additional clinics in January 2018 serving our employees and spouses in the mid-Ohio region. Now, 2,000 of our employees have access to healthcare clinics at their workplace – 1,000 at our headquarters, 600 at our Newark facility, and 400 at our Granville facility. ProMedica runs the health clinics Monday through Friday, 8 a.m. to 5 p.m. and offers a full range of health services. Employees learn about our health clinics at Open Houses and through other communications. And, most important, they are taking advantage of the onsite services.
“ProMedica is really making an impact and creating a very positive buzz in the plant,” said John P. Goodman, RN COHN-S/CM at the Newark plant. “Right after they opened, a maintenance worker visited the onsite certified nurse practitioner with a very serious health problem, and she was able to take care of his health issue on the spot. He was very thankful and impressed, and immediately began to share his experience with his co-workers. After learning about his experience, everyone at the plant wants to know more about this new service.”
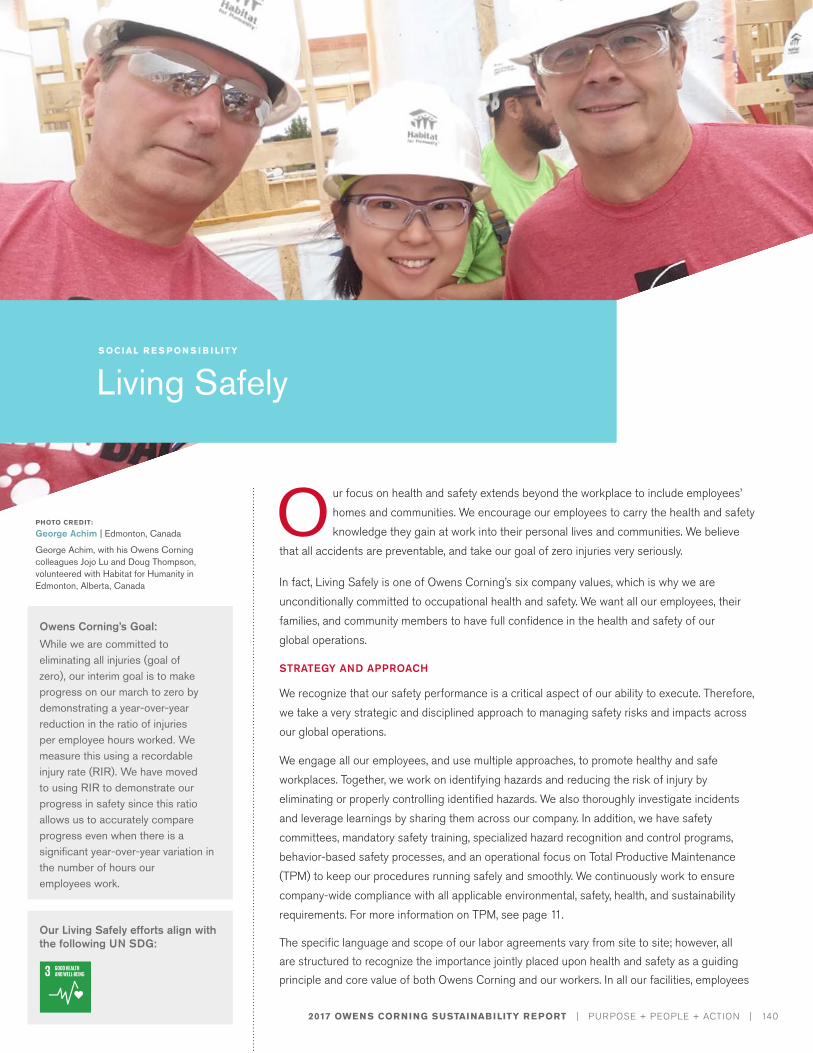
2017 OWENS CORNING SUSTAINABILITY REPORT | PURPOSE + PEOPLE + ACTION | 140
PHOTO CREDIT:
George Achim | Edmonton, Canada
George Achim, with his Owens Corning colleagues Jojo Lu and Doug Thompson, volunteered with Habitat for Humanity in Edmonton, Alberta, Canada
O ur focus on health and safety extends beyond the workplace to include employees’ homes and communities. We encourage our employees to carry the health and safety knowledge they gain at work into their personal lives and communities. We believe
that all accidents are preventable, and take our goal of zero injuries very seriously.
In fact, Living Safely is one of Owens Corning’s six company values, which is why we are unconditionally committed to occupational health and safety. We want all our employees, their families, and community members to have full confidence in the health and safety of our global operations.
STRATEGY AND APPROACH
We recognize that our safety performance is a critical aspect of our ability to execute. Therefore, we take a very strategic and disciplined approach to managing safety risks and impacts across our global operations.
We engage all our employees, and use multiple approaches, to promote healthy and safe workplaces. Together, we work on identifying hazards and reducing the risk of injury by eliminating or properly controlling identified hazards. We also thoroughly investigate incidents and leverage learnings by sharing them across our company. In addition, we have safety committees, mandatory safety training, specialized hazard recognition and control programs, behavior-based safety processes, and an operational focus on Total Productive Maintenance (TPM) to keep our procedures running safely and smoothly. We continuously work to ensure company-wide compliance with all applicable environmental, safety, health, and sustainability requirements. For more information on TPM, see page 11.
The specific language and scope of our labor agreements vary from site to site; however, all are structured to recognize the importance jointly placed upon health and safety as a guiding principle and core value of both Owens Corning and our workers. In all our facilities, employees
S OCIAL R E S P ON S I B I L ITY
Living Safely
Our Living Safely efforts align with the following UN SDG:
Owens Corning’s Goal:While we are committed to eliminating all injuries (goal of zero), our interim goal is to make progress on our march to zero by demonstrating a year-over-year reduction in the ratio of injuries per employee hours worked. We measure this using a recordable injury rate (RIR). We have moved to using RIR to demonstrate our progress in safety since this ratio allows us to accurately compare progress even when there is a significant year-over-year variation in the number of hours our employees work.
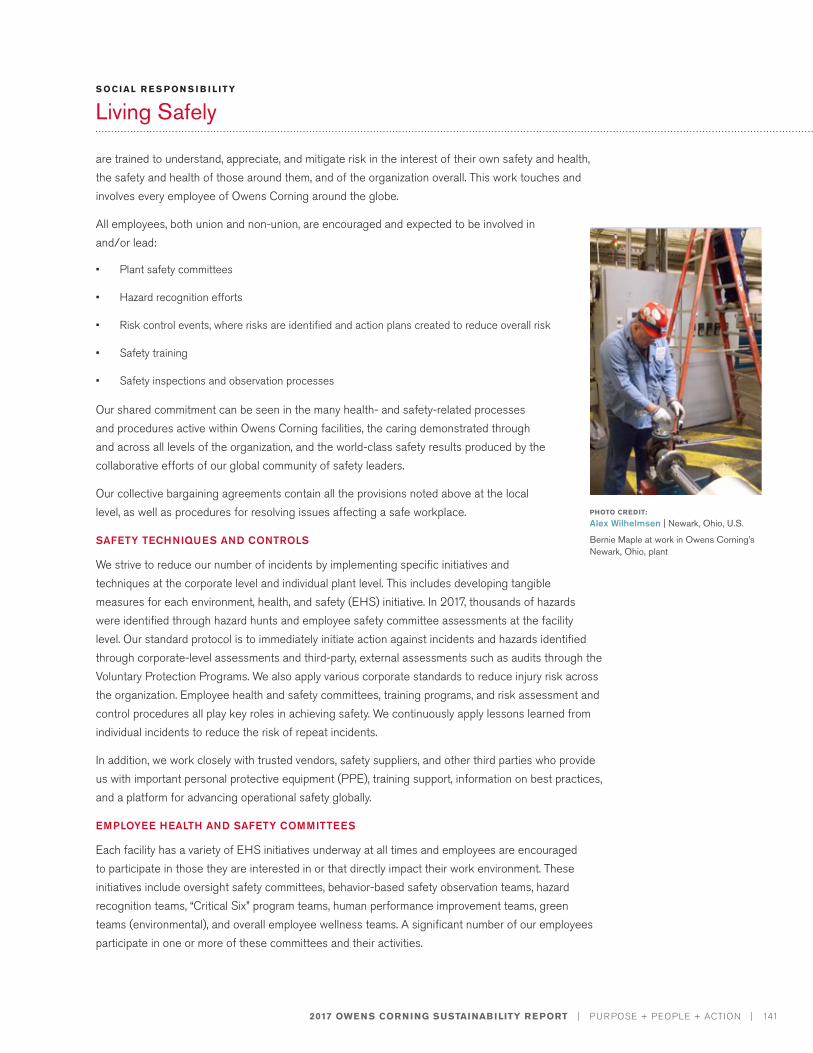
2017 OWENS CORNING SUSTAINABILITY REPORT | PURPOSE + PEOPLE + ACTION | 141
S OCIAL R E S P ON S I B I L ITY
Living Safely
are trained to understand, appreciate, and mitigate risk in the interest of their own safety and health, the safety and health of those around them, and of the organization overall. This work touches and involves every employee of Owens Corning around the globe.
All employees, both union and non-union, are encouraged and expected to be involved in and/or lead:
• Plant safety committees
• Hazard recognition efforts
• Risk control events, where risks are identified and action plans created to reduce overall risk
• Safety training
• Safety inspections and observation processes
Our shared commitment can be seen in the many health- and safety-related processes and procedures active within Owens Corning facilities, the caring demonstrated through and across all levels of the organization, and the world-class safety results produced by the collaborative efforts of our global community of safety leaders.
Our collective bargaining agreements contain all the provisions noted above at the local level, as well as procedures for resolving issues affecting a safe workplace.
SAFETY TECHNIQUES AND CONTROLS
We strive to reduce our number of incidents by implementing specific initiatives and techniques at the corporate level and individual plant level. This includes developing tangible measures for each environment, health, and safety (EHS) initiative. In 2017, thousands of hazards were identified through hazard hunts and employee safety committee assessments at the facility level. Our standard protocol is to immediately initiate action against incidents and hazards identified through corporate-level assessments and third-party, external assessments such as audits through the Voluntary Protection Programs. We also apply various corporate standards to reduce injury risk across the organization. Employee health and safety committees, training programs, and risk assessment and control procedures all play key roles in achieving safety. We continuously apply lessons learned from individual incidents to reduce the risk of repeat incidents.
In addition, we work closely with trusted vendors, safety suppliers, and other third parties who provide us with important personal protective equipment (PPE), training support, information on best practices, and a platform for advancing operational safety globally.
EMPLOYEE HEALTH AND SAFETY COMMITTEES
Each facility has a variety of EHS initiatives underway at all times and employees are encouraged to participate in those they are interested in or that directly impact their work environment. These initiatives include oversight safety committees, behavior-based safety observation teams, hazard recognition teams, “Critical Six” program teams, human performance improvement teams, green teams (environmental), and overall employee wellness teams. A significant number of our employees participate in one or more of these committees and their activities.
PHOTO CREDIT:
Alex Wilhelmsen | Newark, Ohio, U.S.
Bernie Maple at work in Owens Corning’s Newark, Ohio, plant
2017 OWENS CORNING SUSTAINABILITY REPORT | PURPOSE + PEOPLE + ACTION | 142
S OCIAL R E S P ON S I B I L ITY
Living Safely
TRAINING PROGRAMS
All Owens Corning facilities conduct several types of EHS training on a regular basis and develop an annual training matrix to ensure that all employees receive that training. Through our global corporate intranet, our facilities use a common web-based training platform for standard training modules. This system is fully integrated with our talent management system and provides the ability to customize learning plans for individuals. All the training is competency-based.
Safety training begins with new-hire training and continues regularly throughout the employee’s tenure with daily safety huddles, scheduled monthly sessions, and annual refresher courses. For major programs, training is designed and deployed by corporate-level safety leadership with support and input from plant or other relevant personnel. We also work with capable business partners to provide specialized training, such as driving safety training for our sales personnel and PPE support training for our facilities. As an example, in 2017, over 400 sales personnel completed mandatory driving safety training from an outside vendor. Attendance is tracked to ensure 100% compliance.
For our global EHS professionals involved with our safety programs, we provide advanced safety training. Our EHS Skill Building LiveMeeting events are one-hour sessions that allow our EHS leaders to gain additional, practical, state-of-the-art knowledge on specific EHS topics.
In addition, we offer EHS training sessions at our Granville, Ohio, facility and at other facilities worldwide. Participants receive in-depth training on diverse topics, including the Critical Six, proper fall protection strategies, ergonomics, human performance improvement, incident investigation, and ways to conduct effective presentations.
We are particularly proud of our two certification-based training programs: Hazard Recognition Control (HRC) and TPM. Under our HRC program, employees learn what we define as “acceptable” risk (based on leading indicator metrics), plus specific techniques to identify hazards, quantify risk, and develop effective corrective actions to minimize or eliminate hazards. In 2017, we expanded the reach of our new HRC Version 2.0, raising the bar on safety training. We currently have more than 800 employees globally who have achieved HRC certification.
Our TPM program is a comprehensive methodology for achieving zero accidents, zero defects, and zero losses (waste) in our plants. The methodology also focuses on developing our people to take ownership for their machines and processes, in turn ensuring that basic operating conditions are safe, stable, and predictable.
Notably, we hold our contractors to the same high standards and monitoring as we do our own employees. Therefore, we expect contractors to conduct appropriate safety training for their employees. We conduct behavior-based observations and walk-through inspections or audits to ensure that contractors’ employees help to maintain the health and safety of our workplaces.
We have very mature and consistent processes for prequalifying and measuring contractor performance associated with large-scale projects within our facilities and for contractors that we
A Strategic Focus on Serious Injuries and Fatalities
In 2017, we initiated an effort to specifically focus on reducing the risk of serious injuries and fatalities (SIF) within our operations, primarily associated with nonroutine tasks and maintenance activities by employees and contractors. Included in these efforts is the updating of our Critical Six to leverage all the learning that has taken place since they were developed and to create new SIF standards where needed. Additionally, we are pursuing promising technology that can be integrated into new processes and equipment, as well as retrofitted into existing equipment, with the
ultimate goal of “SIF-proofing” our operations.
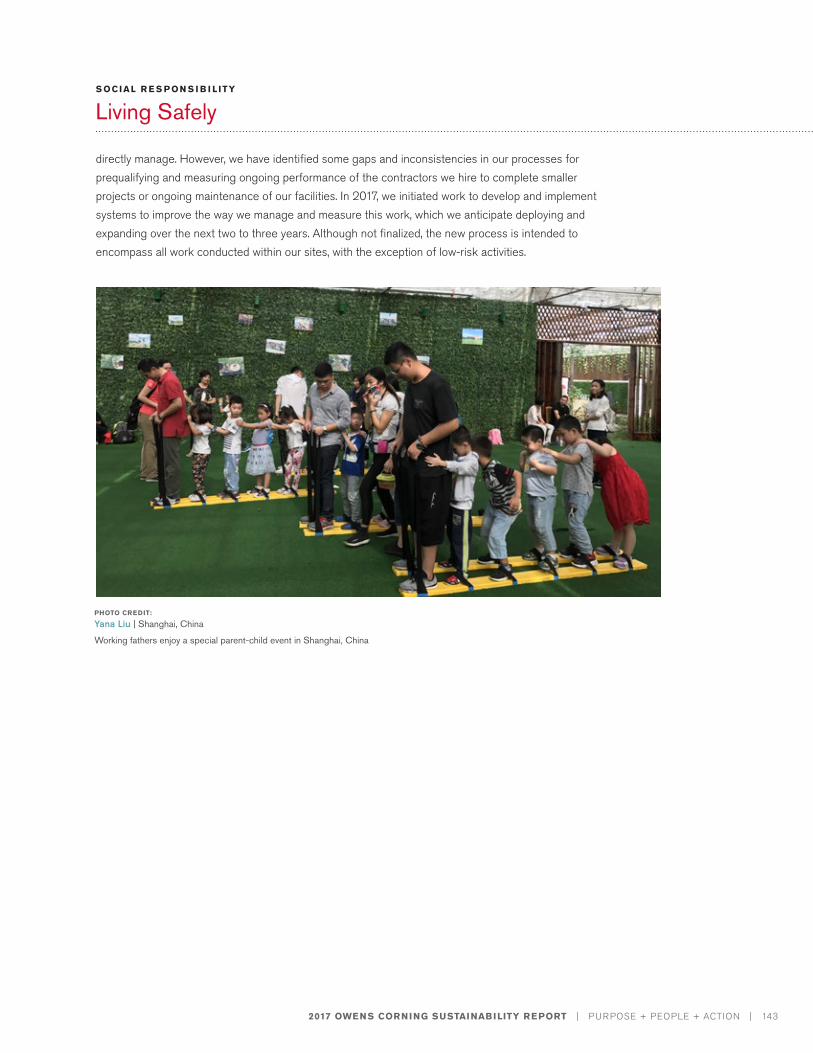
2017 OWENS CORNING SUSTAINABILITY REPORT | PURPOSE + PEOPLE + ACTION | 143
S OCIAL R E S P ON S I B I L ITY
Living Safely
directly manage. However, we have identified some gaps and inconsistencies in our processes for prequalifying and measuring ongoing performance of the contractors we hire to complete smaller projects or ongoing maintenance of our facilities. In 2017, we initiated work to develop and implement systems to improve the way we manage and measure this work, which we anticipate deploying and expanding over the next two to three years. Although not finalized, the new process is intended to encompass all work conducted within our sites, with the exception of low-risk activities.
PHOTO CREDIT:
Yana Liu | Shanghai, China
Working fathers enjoy a special parent-child event in Shanghai, China
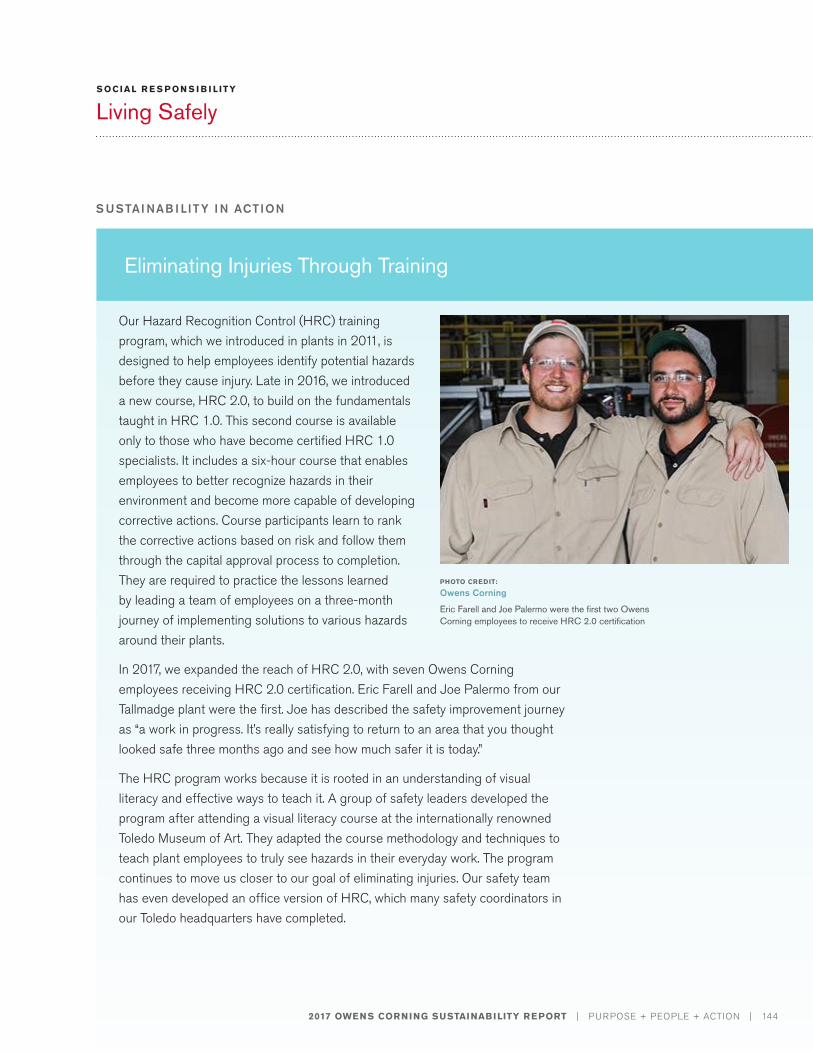
S USTAI NAB I LITY I N ACTION
2017 OWENS CORNING SUSTAINABILITY REPORT | PURPOSE + PEOPLE + ACTION | 144
S OCIAL R E S P ON S I B I L ITY
Living Safely
Eliminating Injuries Through Training
Our Hazard Recognition Control (HRC) training program, which we introduced in plants in 2011, is designed to help employees identify potential hazards before they cause injury. Late in 2016, we introduced a new course, HRC 2.0, to build on the fundamentals taught in HRC 1.0. This second course is available only to those who have become certified HRC 1.0 specialists. It includes a six-hour course that enables employees to better recognize hazards in their environment and become more capable of developing corrective actions. Course participants learn to rank the corrective actions based on risk and follow them through the capital approval process to completion. They are required to practice the lessons learned by leading a team of employees on a three-month journey of implementing solutions to various hazards around their plants.
In 2017, we expanded the reach of HRC 2.0, with seven Owens Corning employees receiving HRC 2.0 certification. Eric Farell and Joe Palermo from our Tallmadge plant were the first. Joe has described the safety improvement journey as “a work in progress. It’s really satisfying to return to an area that you thought looked safe three months ago and see how much safer it is today.”
The HRC program works because it is rooted in an understanding of visual literacy and effective ways to teach it. A group of safety leaders developed the program after attending a visual literacy course at the internationally renowned Toledo Museum of Art. They adapted the course methodology and techniques to teach plant employees to truly see hazards in their everyday work. The program continues to move us closer to our goal of eliminating injuries. Our safety team has even developed an office version of HRC, which many safety coordinators in our Toledo headquarters have completed.
PHOTO CREDIT:
Owens Corning
Eric Farell and Joe Palermo were the first two Owens Corning employees to receive HRC 2.0 certification
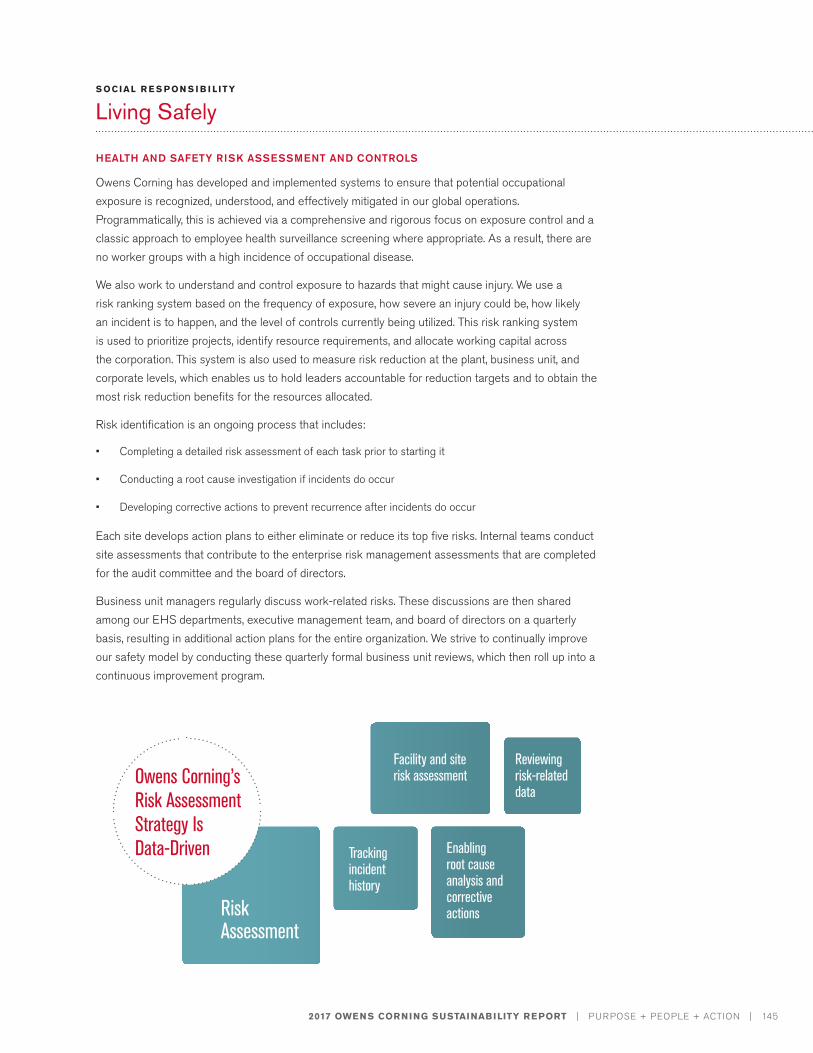
2017 OWENS CORNING SUSTAINABILITY REPORT | PURPOSE + PEOPLE + ACTION | 145
S OCIAL R E S P ON S I B I L ITY
Living Safely
HEALTH AND SAFETY RISK ASSESSMENT AND CONTROLS
Owens Corning has developed and implemented systems to ensure that potential occupational exposure is recognized, understood, and effectively mitigated in our global operations. Programmatically, this is achieved via a comprehensive and rigorous focus on exposure control and a classic approach to employee health surveillance screening where appropriate. As a result, there are no worker groups with a high incidence of occupational disease.
We also work to understand and control exposure to hazards that might cause injury. We use a risk ranking system based on the frequency of exposure, how severe an injury could be, how likely an incident is to happen, and the level of controls currently being utilized. This risk ranking system is used to prioritize projects, identify resource requirements, and allocate working capital across the corporation. This system is also used to measure risk reduction at the plant, business unit, and corporate levels, which enables us to hold leaders accountable for reduction targets and to obtain the most risk reduction benefits for the resources allocated.
Risk identification is an ongoing process that includes:
• Completing a detailed risk assessment of each task prior to starting it
• Conducting a root cause investigation if incidents do occur
• Developing corrective actions to prevent recurrence after incidents do occur
Each site develops action plans to either eliminate or reduce its top five risks. Internal teams conduct site assessments that contribute to the enterprise risk management assessments that are completed for the audit committee and the board of directors.
Business unit managers regularly discuss work-related risks. These discussions are then shared among our EHS departments, executive management team, and board of directors on a quarterly basis, resulting in additional action plans for the entire organization. We strive to continually improve our safety model by conducting these quarterly formal business unit reviews, which then roll up into a continuous improvement program.
Risk Assessment
Enabling root cause analysis and corrective actions
Reviewing risk-related data
Facility and site risk assessment
Tracking incident history
Owens Corning’s Risk Assessment Strategy Is Data-Driven
2017 OWENS CORNING SUSTAINABILITY REPORT | PURPOSE + PEOPLE + ACTION | 146
S OCIAL R E S P ON S I B I L ITY
Living Safely
Our regional leaders are expected to conduct periodic plant inspections as well as provide support and growth opportunities to each of their plants. In some cases, regional leaders cross over divisional lines to help eliminate hazards. Owens Corning also operates a corporate EHS assessment department, which thoroughly reviews EHS processes at every site at least once every three to four years.
We also obtain third-party safety certification when required by our customers. This typically applies to about 30% of our facilities. The global safety and environmental organization verifies and documents the status of management systems during scheduled audits. After assessments are completed, we obtain a published report. All items identified for improvement in the report are incorporated into the facility improvement plan. Critical items are called out and directed to the vice president of operations, sustainability, and EHS for further action.
Risk Assessment Activities
Thoroughly investigating, reporting, and tracking all incidents helps us improve our safety performance. We consolidate all recordable injuries, first-aid treatments, and significant near-miss events at the corporate level, and then analyze the data with respect to incident characteristics and trends.
The data is collected and analyzed each month against our leading indicator metrics, which fall into one of four functional areas:
• Human Resources
• Operations
• Maintenance
• Safety
The respective functional leaders at each plant are responsible for populating the data and documenting their action plans for any elevated levels of risk identified. Plant leaders own the execution of this process and ensure its accurate completion each month, as well as the implementation of appropriate actions to reduce risk. The monthly data collection and analysis give local leadership visibility to the changing level of risk and the opportunity to intervene and reduce that risk before an incident occurs. Based on what we learn, we regularly review and update the metrics and scoring system.
INJURY RATE, OCCUPATIONAL DISEASES, AND LOST-WORKDAY RATES
Regrettably, there were two work-related fatalities in 2017, which were the first fatalities at company locations in over a decade. These incidents have been thoroughly investigated through the processes outlined above, and lessons learned are being used to develop and implement sustainable actions that will help us keep workers safe and achieve our ultimate goal of zero injuries.
Our recordable incident rate in 2017 was a modest improvement from 2016 and 85% below the industry average, as reported by the U.S. Bureau of Labor Statistics for 2015 (the most recent data available). Likewise, the severity of our incidents, as measured by the number of injuries requiring lost-time or restricted work, and the number of lost and restricted workdays, was relatively flat in 2017 compared to 2016. However, this stable performance was achieved despite the acquisition of InterWrap in 2016 and Pittsburgh Corning in mid-2017, which had incident rates that were several times higher than Owens Corning. The significant improvement in safety performance at the acquired
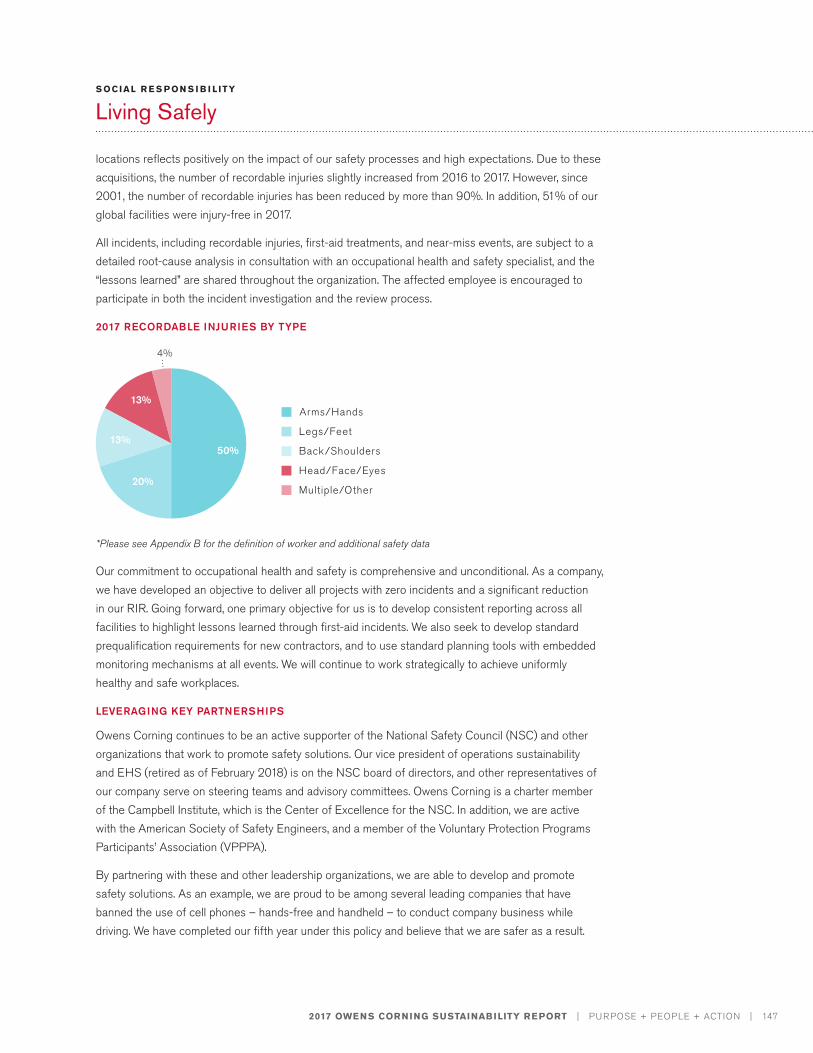
2017 OWENS CORNING SUSTAINABILITY REPORT | PURPOSE + PEOPLE + ACTION | 147
S OCIAL R E S P ON S I B I L ITY
Living Safely
locations reflects positively on the impact of our safety processes and high expectations. Due to these acquisitions, the number of recordable injuries slightly increased from 2016 to 2017. However, since 2001, the number of recordable injuries has been reduced by more than 90%. In addition, 51% of our global facilities were injury-free in 2017.
All incidents, including recordable injuries, first-aid treatments, and near-miss events, are subject to a detailed root-cause analysis in consultation with an occupational health and safety specialist, and the “lessons learned” are shared throughout the organization. The affected employee is encouraged to participate in both the incident investigation and the review process.
2017 RECORDABLE INJURIES BY TYPE
*Please see Appendix B for the definition of worker and additional safety data
Our commitment to occupational health and safety is comprehensive and unconditional. As a company, we have developed an objective to deliver all projects with zero incidents and a significant reduction in our RIR. Going forward, one primary objective for us is to develop consistent reporting across all facilities to highlight lessons learned through first-aid incidents. We also seek to develop standard prequalification requirements for new contractors, and to use standard planning tools with embedded monitoring mechanisms at all events. We will continue to work strategically to achieve uniformly healthy and safe workplaces.
LEVERAGING KEY PARTNERSHIPS
Owens Corning continues to be an active supporter of the National Safety Council (NSC) and other organizations that work to promote safety solutions. Our vice president of operations sustainability and EHS (retired as of February 2018) is on the NSC board of directors, and other representatives of our company serve on steering teams and advisory committees. Owens Corning is a charter member of the Campbell Institute, which is the Center of Excellence for the NSC. In addition, we are active with the American Society of Safety Engineers, and a member of the Voluntary Protection Programs Participants’ Association (VPPPA).
By partnering with these and other leadership organizations, we are able to develop and promote safety solutions. As an example, we are proud to be among several leading companies that have banned the use of cell phones – hands-free and handheld – to conduct company business while driving. We have completed our fifth year under this policy and believe that we are safer as a result.
Arms/Hands
Legs/Feet
Back/Shoulders
Head/Face/Eyes
Multiple/Other
4%
50%
20%
13%
13%
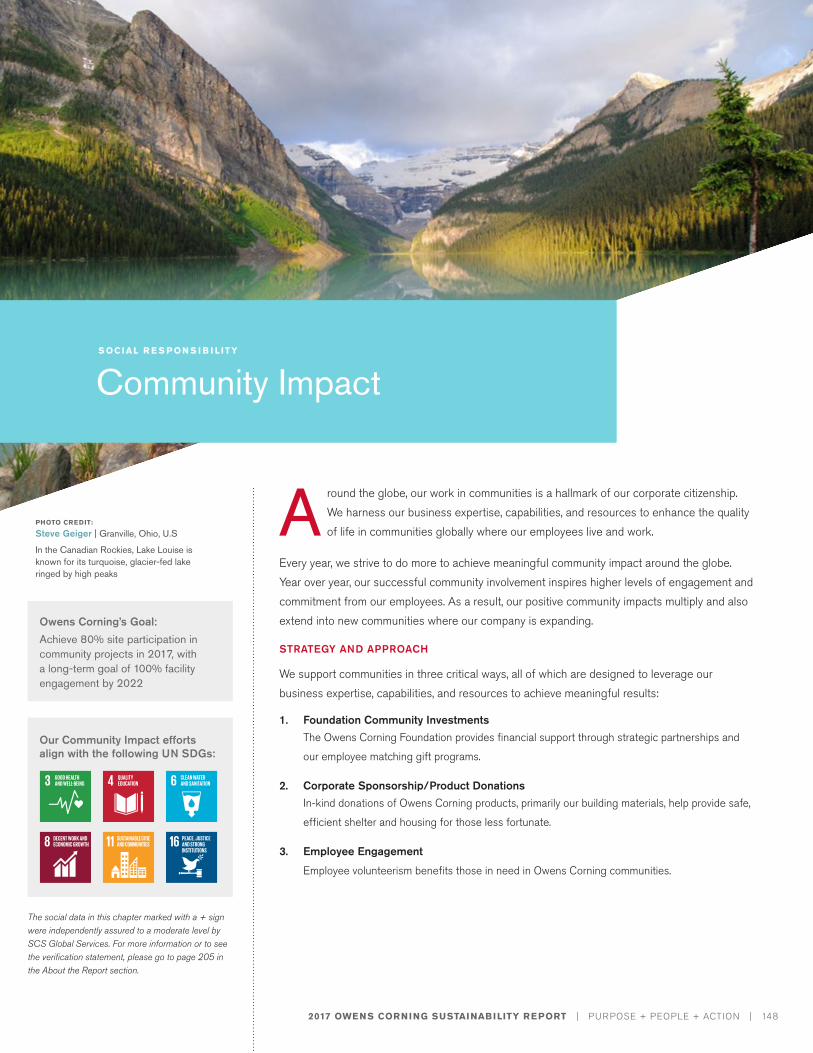
2017 OWENS CORNING SUSTAINABILITY REPORT | PURPOSE + PEOPLE + ACTION | 148
Owens Corning’s Goal:Achieve 80% site participation in community projects in 2017, with a long-term goal of 100% facility engagement by 2022
Our Community Impact efforts align with the following UN SDGs:
PHOTO CREDIT:
Steve Geiger | Granville, Ohio, U.S
In the Canadian Rockies, Lake Louise is known for its turquoise, glacier-fed lake ringed by high peaks
A round the globe, our work in communities is a hallmark of our corporate citizenship. We harness our business expertise, capabilities, and resources to enhance the quality of life in communities globally where our employees live and work.
Every year, we strive to do more to achieve meaningful community impact around the globe. Year over year, our successful community involvement inspires higher levels of engagement and commitment from our employees. As a result, our positive community impacts multiply and also extend into new communities where our company is expanding.
STRATEGY AND APPROACH
We support communities in three critical ways, all of which are designed to leverage our business expertise, capabilities, and resources to achieve meaningful results:
1. Foundation Community InvestmentsThe Owens Corning Foundation provides financial support through strategic partnerships and
our employee matching gift programs.
2. Corporate Sponsorship/Product Donations In-kind donations of Owens Corning products, primarily our building materials, help provide safe,
efficient shelter and housing for those less fortunate.
3. Employee Engagement
Employee volunteerism benefits those in need in Owens Corning communities.
S OCIAL R E S P ON S I B I L ITY
Community Impact
The social data in this chapter marked with a + sign were independently assured to a moderate level by SCS Global Services. For more information or to see the verification statement, please go to page 205 in the About the Report section.
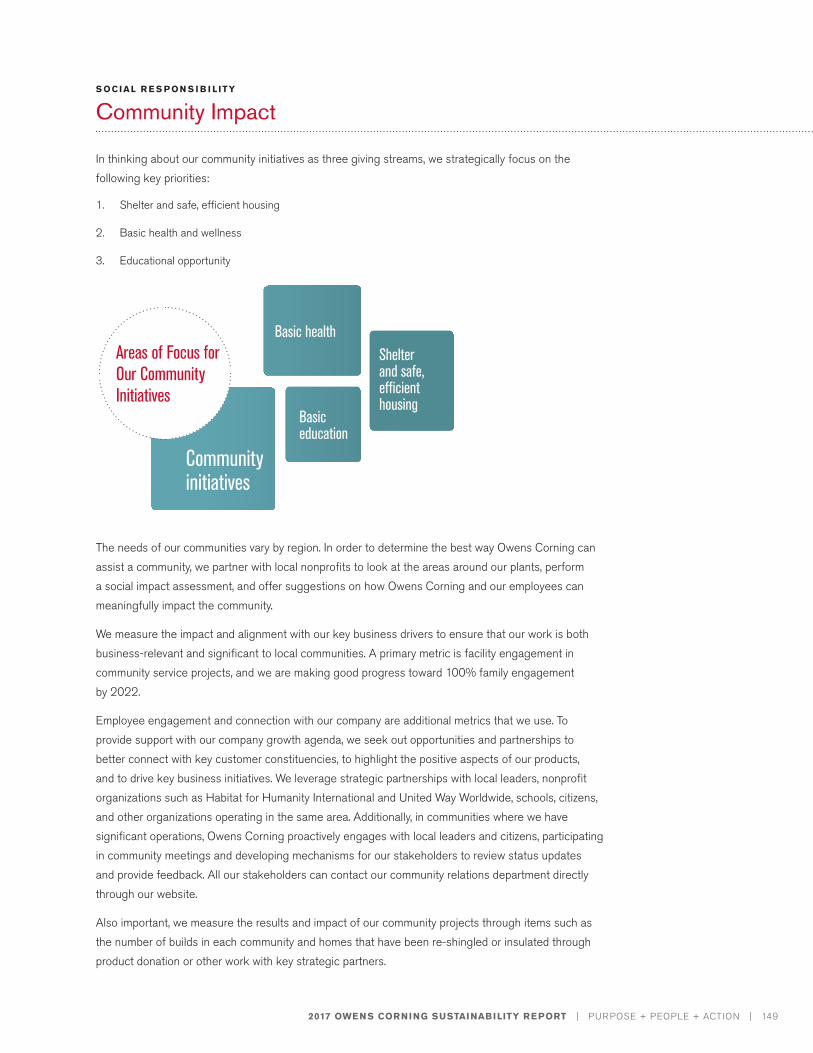
2017 OWENS CORNING SUSTAINABILITY REPORT | PURPOSE + PEOPLE + ACTION | 149
S OCIAL R E S P ON S I B I L ITY
Community Impact
In thinking about our community initiatives as three giving streams, we strategically focus on the following key priorities:
1. Shelter and safe, efficient housing
2. Basic health and wellness
3. Educational opportunity
The needs of our communities vary by region. In order to determine the best way Owens Corning can assist a community, we partner with local nonprofits to look at the areas around our plants, perform a social impact assessment, and offer suggestions on how Owens Corning and our employees can meaningfully impact the community.
We measure the impact and alignment with our key business drivers to ensure that our work is both business-relevant and significant to local communities. A primary metric is facility engagement in community service projects, and we are making good progress toward 100% family engagement by 2022.
Employee engagement and connection with our company are additional metrics that we use. To provide support with our company growth agenda, we seek out opportunities and partnerships to better connect with key customer constituencies, to highlight the positive aspects of our products, and to drive key business initiatives. We leverage strategic partnerships with local leaders, nonprofit organizations such as Habitat for Humanity International and United Way Worldwide, schools, citizens, and other organizations operating in the same area. Additionally, in communities where we have significant operations, Owens Corning proactively engages with local leaders and citizens, participating in community meetings and developing mechanisms for our stakeholders to review status updates and provide feedback. All our stakeholders can contact our community relations department directly through our website.
Also important, we measure the results and impact of our community projects through items such as the number of builds in each community and homes that have been re-shingled or insulated through product donation or other work with key strategic partners.
Community initiatives
Shelter and safe, efficient housing
Basic health
Basic education
Areas of Focus for Our Community Initiatives
2017 OWENS CORNING SUSTAINABILITY REPORT | PURPOSE + PEOPLE + ACTION | 150
S OCIAL R E S P ON S I B I L ITY
Community Impact
Our corporate affairs department manages our corporate citizenship program. The director of community affairs is also president of the Owens Corning Foundation, which was established in 1978. This person reports to the vice president, corporate affairs, with a dotted line to the chair of the Owens Corning Foundation, and is directly responsible for company-wide corporate citizenship strategy and implementation.
STRATEGIC CHARITABLE PARTNERSHIPS
We are committed to encouraging and supporting organizations whose work aligns with our giving goals and corporate citizenship strategy, primarily through strategic charitable partnerships.
The Owens Corning Foundation establishes strategic partnerships with many excellent nonprofit organizations to achieve meaningful impacts. Our three-year partnership with Habitat for Humanity International, for example, is supporting neighborhood revitalization in Owens Corning communities across the United States and internationally. United Way Worldwide is another one of our important charitable partners. Partnering with United Way Worldwide has enabled Owens Corning to expand our community investment in key locations beyond North America to include China, India, and Mexico. Our work in these countries is addressing the most basic needs in villages near Owens Corning facilities.
We have many more strategic charitable partnerships that help us make positive impacts in global communities. Read about several examples under Giving and Volunteering Highlights Around the World.
PRODUCT DONATIONS
As a global leader in building materials and composite solutions, we know our products can make a significant impact in providing shelter and safe, efficient housing for those in need. Owens Corning donates building materials in support of that strategy in several key areas, including:
• Building and rehabilitation of safe, efficient housing
• Neighborhood revitalization projects
• Construction and support of shelters and community centers
• Disaster relief
We partner with organizations such as Habitat for Humanity and World Vision to help coordinate the distribution of product donations. In 2017, we donated enough shingles to re-roof 591 homes and enough insulation for 200 homes (based on an average of 25 squares of shingles for a 2,000-square-foot home and 1,500 pounds of insulation per home). These donations are provided directly from Owens Corning.
Select Key Charitable Partners
• Habitat for Humanity International (Global and Regional)
• United Way International (Global and Regional)
• Rise Against Hunger (Global)
• World Vision (Global)
• Red Cross (Global)
• Cherry Street Mission (U.S.)
• Concrete Preservation Institute (U.S.)
• Toledo Public Schools (U.S.)
• Pack Shack (U.S.)
• Mumbai Mobile Creches (India)
• NetSpring Green IT (China)
• Escuela Hogar Perpetuo Socorro (Mexico)
• Cantine Savoyarde Solidarite (France)
• Lega del filo d’oro (Italy)
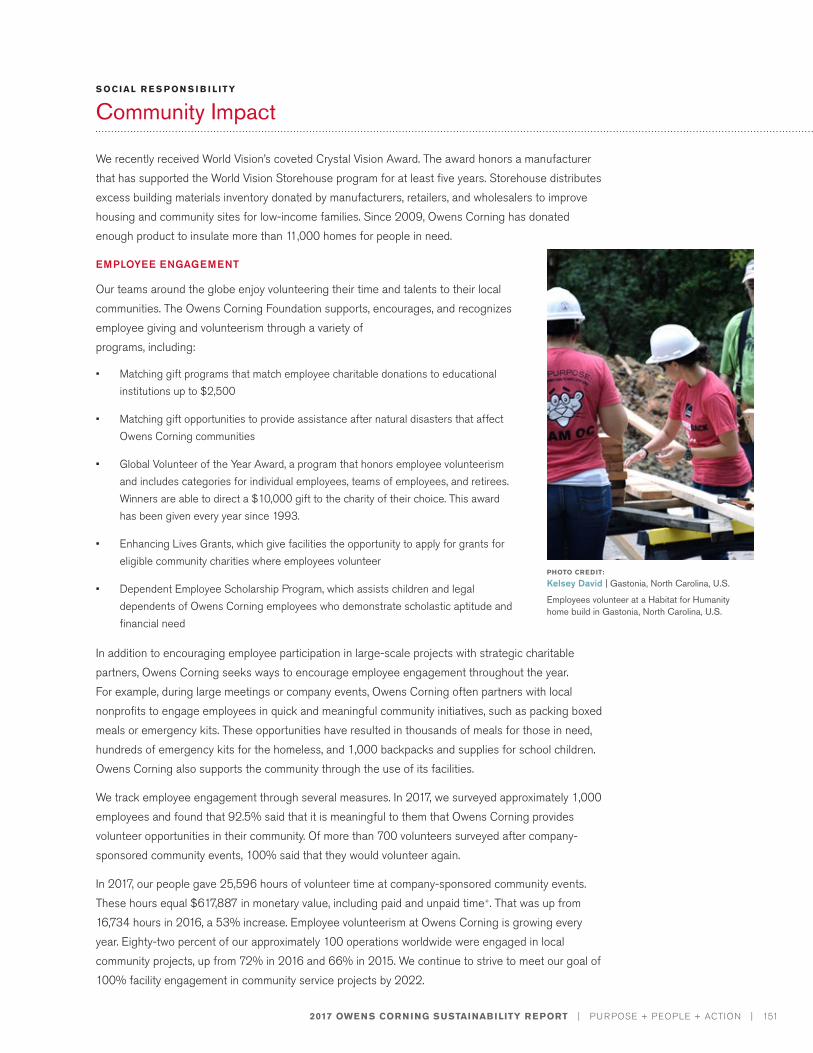
2017 OWENS CORNING SUSTAINABILITY REPORT | PURPOSE + PEOPLE + ACTION | 151
S OCIAL R E S P ON S I B I L ITY
Community Impact
We recently received World Vision’s coveted Crystal Vision Award. The award honors a manufacturer that has supported the World Vision Storehouse program for at least five years. Storehouse distributes excess building materials inventory donated by manufacturers, retailers, and wholesalers to improve housing and community sites for low-income families. Since 2009, Owens Corning has donated enough product to insulate more than 11,000 homes for people in need.
EMPLOYEE ENGAGEMENT
Our teams around the globe enjoy volunteering their time and talents to their local communities. The Owens Corning Foundation supports, encourages, and recognizes employee giving and volunteerism through a variety of programs, including:
• Matching gift programs that match employee charitable donations to educational institutions up to $2,500
• Matching gift opportunities to provide assistance after natural disasters that affect Owens Corning communities
• Global Volunteer of the Year Award, a program that honors employee volunteerism and includes categories for individual employees, teams of employees, and retirees. Winners are able to direct a $10,000 gift to the charity of their choice. This award has been given every year since 1993.
• Enhancing Lives Grants, which give facilities the opportunity to apply for grants for eligible community charities where employees volunteer
• Dependent Employee Scholarship Program, which assists children and legal dependents of Owens Corning employees who demonstrate scholastic aptitude and financial need
In addition to encouraging employee participation in large-scale projects with strategic charitable partners, Owens Corning seeks ways to encourage employee engagement throughout the year. For example, during large meetings or company events, Owens Corning often partners with local nonprofits to engage employees in quick and meaningful community initiatives, such as packing boxed meals or emergency kits. These opportunities have resulted in thousands of meals for those in need, hundreds of emergency kits for the homeless, and 1,000 backpacks and supplies for school children. Owens Corning also supports the community through the use of its facilities.
We track employee engagement through several measures. In 2017, we surveyed approximately 1,000 employees and found that 92.5% said that it is meaningful to them that Owens Corning provides volunteer opportunities in their community. Of more than 700 volunteers surveyed after company-sponsored community events, 100% said that they would volunteer again.
In 2017, our people gave 25,596 hours of volunteer time at company-sponsored community events. These hours equal $617,887 in monetary value, including paid and unpaid time+. That was up from 16,734 hours in 2016, a 53% increase. Employee volunteerism at Owens Corning is growing every year. Eighty-two percent of our approximately 100 operations worldwide were engaged in local community projects, up from 72% in 2016 and 66% in 2015. We continue to strive to meet our goal of 100% facility engagement in community service projects by 2022.
PHOTO CREDIT:
Kelsey David | Gastonia, North Carolina, U.S.
Employees volunteer at a Habitat for Humanity home build in Gastonia, North Carolina, U.S.
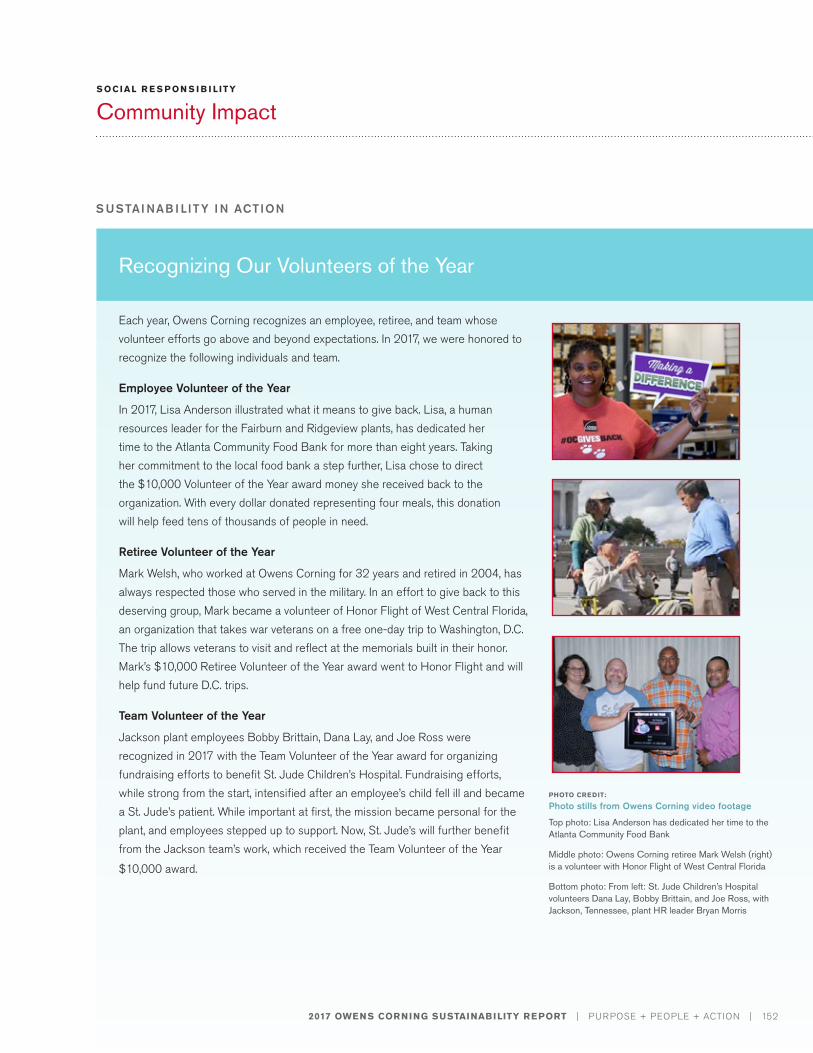
S USTAI NAB I LITY I N ACTION
2017 OWENS CORNING SUSTAINABILITY REPORT | PURPOSE + PEOPLE + ACTION | 152
S OCIAL R E S P ON S I B I L ITY
Community Impact
Recognizing Our Volunteers of the Year
Each year, Owens Corning recognizes an employee, retiree, and team whose volunteer efforts go above and beyond expectations. In 2017, we were honored to recognize the following individuals and team.
Employee Volunteer of the Year
In 2017, Lisa Anderson illustrated what it means to give back. Lisa, a human resources leader for the Fairburn and Ridgeview plants, has dedicated her time to the Atlanta Community Food Bank for more than eight years. Taking her commitment to the local food bank a step further, Lisa chose to direct the $10,000 Volunteer of the Year award money she received back to the organization. With every dollar donated representing four meals, this donation will help feed tens of thousands of people in need.
Retiree Volunteer of the Year
Mark Welsh, who worked at Owens Corning for 32 years and retired in 2004, has always respected those who served in the military. In an effort to give back to this deserving group, Mark became a volunteer of Honor Flight of West Central Florida, an organization that takes war veterans on a free one-day trip to Washington, D.C. The trip allows veterans to visit and reflect at the memorials built in their honor. Mark’s $10,000 Retiree Volunteer of the Year award went to Honor Flight and will help fund future D.C. trips.
Team Volunteer of the Year
Jackson plant employees Bobby Brittain, Dana Lay, and Joe Ross were recognized in 2017 with the Team Volunteer of the Year award for organizing fundraising efforts to benefit St. Jude Children’s Hospital. Fundraising efforts, while strong from the start, intensified after an employee’s child fell ill and became a St. Jude’s patient. While important at first, the mission became personal for the plant, and employees stepped up to support. Now, St. Jude’s will further benefit from the Jackson team’s work, which received the Team Volunteer of the Year
$10,000 award.
PHOTO CREDIT:
Photo stills from Owens Corning video footage
Top photo: Lisa Anderson has dedicated her time to the Atlanta Community Food Bank
Middle photo: Owens Corning retiree Mark Welsh (right) is a volunteer with Honor Flight of West Central Florida
Bottom photo: From left: St. Jude Children’s Hospital volunteers Dana Lay, Bobby Brittain, and Joe Ross, with Jackson, Tennessee, plant HR leader Bryan Morris
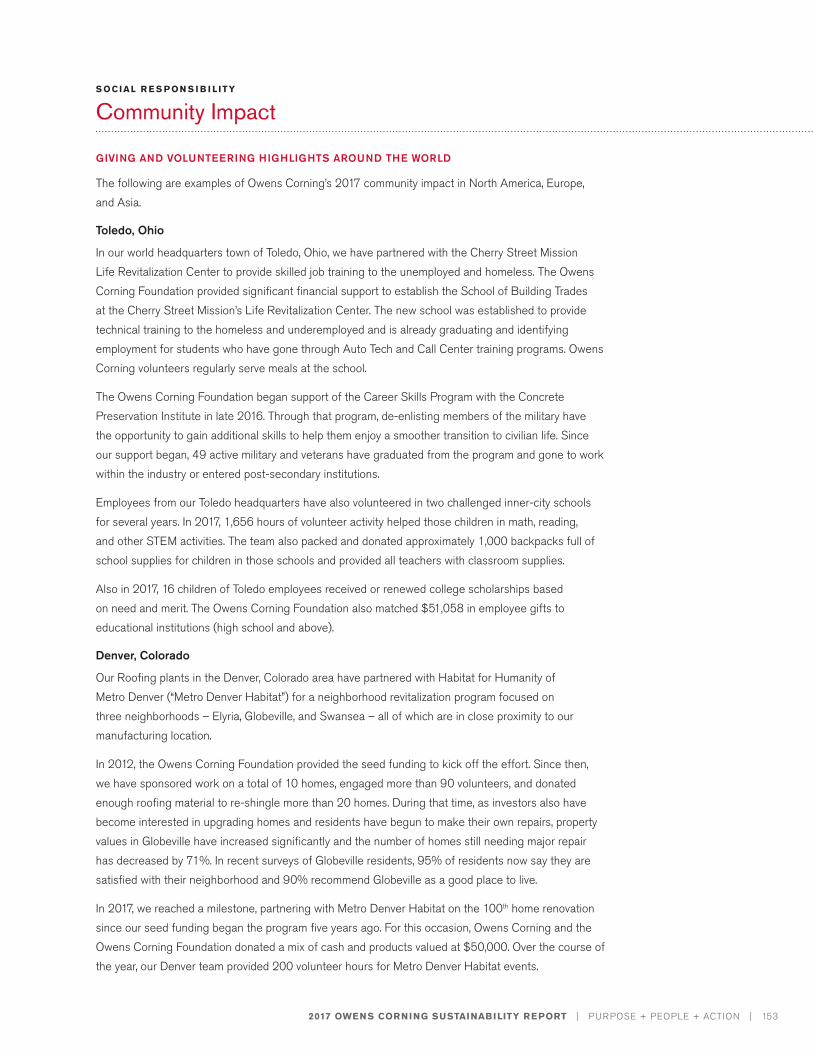
2017 OWENS CORNING SUSTAINABILITY REPORT | PURPOSE + PEOPLE + ACTION | 153
S OCIAL R E S P ON S I B I L ITY
Community Impact
GIVING AND VOLUNTEERING HIGHLIGHTS AROUND THE WORLD
The following are examples of Owens Corning’s 2017 community impact in North America, Europe, and Asia.
Toledo, Ohio
In our world headquarters town of Toledo, Ohio, we have partnered with the Cherry Street Mission Life Revitalization Center to provide skilled job training to the unemployed and homeless. The Owens Corning Foundation provided significant financial support to establish the School of Building Trades at the Cherry Street Mission’s Life Revitalization Center. The new school was established to provide technical training to the homeless and underemployed and is already graduating and identifying employment for students who have gone through Auto Tech and Call Center training programs. Owens Corning volunteers regularly serve meals at the school.
The Owens Corning Foundation began support of the Career Skills Program with the Concrete Preservation Institute in late 2016. Through that program, de-enlisting members of the military have the opportunity to gain additional skills to help them enjoy a smoother transition to civilian life. Since our support began, 49 active military and veterans have graduated from the program and gone to work within the industry or entered post-secondary institutions.
Employees from our Toledo headquarters have also volunteered in two challenged inner-city schools for several years. In 2017, 1,656 hours of volunteer activity helped those children in math, reading, and other STEM activities. The team also packed and donated approximately 1,000 backpacks full of school supplies for children in those schools and provided all teachers with classroom supplies.
Also in 2017, 16 children of Toledo employees received or renewed college scholarships based on need and merit. The Owens Corning Foundation also matched $51,058 in employee gifts to educational institutions (high school and above).
Denver, Colorado
Our Roofing plants in the Denver, Colorado area have partnered with Habitat for Humanity of Metro Denver (“Metro Denver Habitat”) for a neighborhood revitalization program focused on three neighborhoods – Elyria, Globeville, and Swansea – all of which are in close proximity to our manufacturing location.
In 2012, the Owens Corning Foundation provided the seed funding to kick off the effort. Since then, we have sponsored work on a total of 10 homes, engaged more than 90 volunteers, and donated enough roofing material to re-shingle more than 20 homes. During that time, as investors also have become interested in upgrading homes and residents have begun to make their own repairs, property values in Globeville have increased significantly and the number of homes still needing major repair has decreased by 71%. In recent surveys of Globeville residents, 95% of residents now say they are satisfied with their neighborhood and 90% recommend Globeville as a good place to live.
In 2017, we reached a milestone, partnering with Metro Denver Habitat on the 100th home renovation since our seed funding began the program five years ago. For this occasion, Owens Corning and the Owens Corning Foundation donated a mix of cash and products valued at $50,000. Over the course of the year, our Denver team provided 200 volunteer hours for Metro Denver Habitat events.
2017 OWENS CORNING SUSTAINABILITY REPORT | PURPOSE + PEOPLE + ACTION | 154
S OCIAL R E S P ON S I B I L ITY
Community Impact
While Denver is a highlight, in 2017, Owens Corning supported Habitat for Humanity builds in 23 communities in the U.S. and Canada and in five locations in China.
Mexico
In Mexico, we partnered with the Mexican Red Cross to obtain a needs assessment of the local residents to better serve the community. As a result, in 2017, we provided weekend health fairs in villages near our plants. At these events, disadvantaged residents had access to basic health services such as eye exams, blood pressure monitoring, and AIDS awareness training. Other basic needs were met through distributions of blankets, walkers and wheelchairs, eyeglasses, and basic nutrition.
In Mexico City, our facility has adopted a girls’ orphanage located within walking distance of our operations. Regular volunteer activity brings the girls and their teachers to the Owens Corning campus for sports events, plays, lunch outings, and fun afternoons. In 2017, the Owens Corning Foundation began to provide financial support to improve the safety and infrastructure of the orphanage building and to cover the cost of a pediatrician, psychologist, and nutritionist. Through 2017, 55 girls ages 3 to 13 benefited from this volunteerism and financial support.
Near our plant in Tlaxcala, the Owens Corning Foundation has provided funding for the construction of a new school building for a group of deaf children. The school was in crumbling condition when plant employees decided to do something to help, which led the Owens Corning Foundation to provide financial support for a new, safer building. When finished in early 2018, the school will serve 24 deaf children who otherwise would attend a public school with little attention to their special needs.
Europe
In 2017, work began in earnest in several European communities where we operate. The Owens Corning Foundation has partnered with appropriate charitable organizations based on the guidance of community needs assessments that were completed in 2016 in partnership with the King Baudouin Foundation. For example, in Chambéry, France, the Owens Corning Foundation partnered with Cantine Savoyarde Solidarite, an organization that provides meals for people in need. When our team of employees began volunteering to serve meals, funds from the Owens Corning Foundation were used to purchase a new food delivery vehicle for the organization, helping to provide approximately 80,000 meals each year to people in need.
India
In India, the Owens Corning Foundation partnered with United Way Mumbai in 2013 to complete community needs assessments for our local facilities. Since that time, Owens Corning has been highly active in communities in India. In fact, our India operations are among the most active and engaged facilities in all of Owens Corning.
Coming out of the community needs assessment, Owens Corning worked with United Way Mumbai, the HOPE Foundation, and Habitat for Humanity India to provide basic health and sanitation services and clean water facilities in local villages and schools. In 2017, a total of 550 students gained access to basic sanitation facilities and clean water, and four families received toilet facilities. Through our support of Mumbai Mobile Creches, 180 young migrant children also received health and nutrition services.
2017 OWENS CORNING SUSTAINABILITY REPORT | PURPOSE + PEOPLE + ACTION | 155
S OCIAL R E S P ON S I B I L ITY
Community Impact
In addition to health and sanitation, a large part of our work in India focuses on education for children in migrant villages. In 2017, more than 300 migrant children received assistance through Non-Formal Education (NFE) classes to help build their basic knowledge in language and mathematics. As part of this program, Owens Corning employees performed regular home visits, interacted with parents, and provided educational counseling. This helped students learn at their own pace and resulted in an approximate 65% student success rate.
We also help provide children grades four through seven with basic computer education. For the 2017-18 school year, 811 students were enrolled in these computer education classes granting them access to more information and an enhanced education.
Our work in education also extends to monetary giving. Each year we award scholarships to students based on their academic performance. Awarding scholarships helps motivate students who are doing well to continue their efforts and encourages families to keep their students enrolled in school. In 2017, we awarded scholarships to 18 deserving students.
During the summer, we provide support for children to unwind from their regular school activities and engage in experiential learning through field visits, sports, interactive games, and arts and crafts. In 2017, 190 students participated in these activities.
We’re also committed to helping provide students with the skills they need to succeed outside of the classroom. In Taloja, India, the first class of 27 young men completed electrical vocational training in 2017. This program was funded by Owens Corning in partnership with the Kohinoor Technical Institute, and initiated after a community assessment determined a real need for this skill set locally. These 27 young men now have the knowledge needed to build a successful career while also filling a gap in the community’s workforce. Additionally, in December 2017, 12 young women began a six-month training course in computer applications. Their newly learned skills will help them advance in the workforce and open doors to new career opportunities.
As with any community project, all this work was supported by significant volunteerism from local Owens Corning employees. Throughout the year, they were actively involved in teaching English, mentoring, safety awareness sessions, summer sessions, and many other activities to benefit students.
China
In China, the Owens Corning Foundation invests in programs that improve education and youth development; enhance the living conditions of the impoverished, aging and vulnerable families through home renovation; and provide support to children of migrant workers and poor families.
In 2017, we partnered with Habitat for Humanity China and sponsored three house renovations in Shanghai and one renovation and one new home build in Guangzhou. The Owens Corning Foundation provided the financial support, and employees from our plant and office locations volunteered nearly
PHOTO CREDIT:
Kelsey David | Gastonia, North Carolina, U.S.
Employee Wayne McKinney at a Habitat for Humanity home build in Gastonia, North Carolina, U.S.
2017 OWENS CORNING SUSTAINABILITY REPORT | PURPOSE + PEOPLE + ACTION | 156
S OCIAL R E S P ON S I B I L ITY
Community Impact
500 hours on these projects. The Owens Corning Foundation also sponsored the Habitat China Young Leaders Build program that helped more than a dozen families with their urgent home reconstruction needs in Shaoguan, Guangdong Province. The Young Leaders Build brings together junior leaders from numerous large corporations in China to help those in need. The program has become increasingly popular with our team and a great opportunity for our young leaders to expand their network while helping those in need.
During our initial community assessments in China in 2012, our plant employees had noted their strong desire to help the children of migrant families who had come to large urban centers to find work. As a result, the Owens Corning Foundation partnered with NetSpring, a charitable organization based in Shanghai. The Owens Corning Foundation supported the founding of the Green IT Classroom programs in migrant schools near several of our plants in China. We continue to promote their development through educational support, donations of renewed computers, and contributions for the installation of the necessary IT infrastructure for students. In 2017, the Owens Corning Foundation sponsored a new Green IT Classroom in Xi’an, bringing the total number to five classrooms in Owens Corning communities and benefiting more than 2,400 students. Company volunteers spend time with children in each of those schools.
In addition, in partnership with United Way Worldwide and the Amway Charity Foundation, the Owens Corning Foundation supported the Spring Sprout Program in China to equip schools with advanced kitchen equipment, along with books and stationery. By the end of 2016, Owens Corning had set up three “Spring Sprout Kitchens” in Jiangxi and five in Shanxi to serve a total of 5,545 students. These schools board large numbers of “left-behind” children. These are the children of parents who have migrated to urban centers to find work, but felt it best to leave their children in home villages. The conditions in the schools are challenging. The diet consists primarily of soy and rice, and the children trail their peers in height, weight, and intellectual development. Spring Sprout Kitchens’ program improves the ability of the schools to provide a proper diet to the children.
PHOTO CREDIT:
Analucía Padilla | Monterrey, Mexico
"Worth the climb" in Monterrey, Mexico
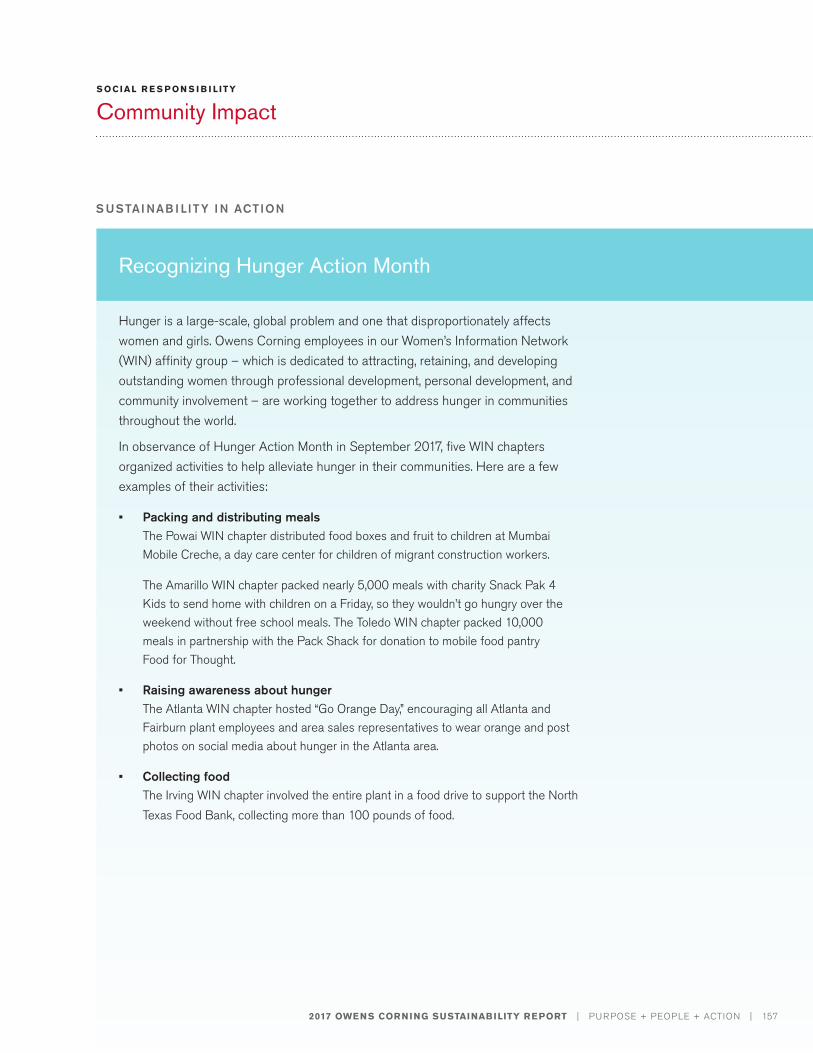
S USTAI NAB I LITY I N ACTION
2017 OWENS CORNING SUSTAINABILITY REPORT | PURPOSE + PEOPLE + ACTION | 157
S OCIAL R E S P ON S I B I L ITY
Community Impact
Recognizing Hunger Action Month
Hunger is a large-scale, global problem and one that disproportionately affects women and girls. Owens Corning employees in our Women’s Information Network (WIN) affinity group – which is dedicated to attracting, retaining, and developing outstanding women through professional development, personal development, and community involvement – are working together to address hunger in communities throughout the world.
In observance of Hunger Action Month in September 2017, five WIN chapters organized activities to help alleviate hunger in their communities. Here are a few examples of their activities:
• Packing and distributing mealsThe Powai WIN chapter distributed food boxes and fruit to children at Mumbai Mobile Creche, a day care center for children of migrant construction workers.
The Amarillo WIN chapter packed nearly 5,000 meals with charity Snack Pak 4 Kids to send home with children on a Friday, so they wouldn’t go hungry over the weekend without free school meals. The Toledo WIN chapter packed 10,000 meals in partnership with the Pack Shack for donation to mobile food pantry Food for Thought.
• Raising awareness about hungerThe Atlanta WIN chapter hosted “Go Orange Day,” encouraging all Atlanta and Fairburn plant employees and area sales representatives to wear orange and post photos on social media about hunger in the Atlanta area.
• Collecting foodThe Irving WIN chapter involved the entire plant in a food drive to support the North Texas Food Bank, collecting more than 100 pounds of food.
2017 OWENS CORNING SUSTAINABILITY REPORT | PURPOSE + PEOPLE + ACTION | 158
S OCIAL R E S P ON S I B I L ITY
Community Impact
BUILDING AND RENOVATING HOMES
Owens Corning understands that for a variety of reasons some members of our communities find themselves unable to obtain safe and efficient housing and shelter. As a leading global producer of residential and commercial building materials, we have the opportunity and expertise to aid in the effort to provide safe and efficient housing and shelter for those who are unable to obtain housing through traditional methods. It’s one of our goals to increase the number of people benefiting from access to safe and efficient housing in our communities through 2022.
Our philanthropic focus on housing and shelter aligns with our three goals of supporting our company’s growth agenda, building a positive reputation within Owens Corning communities, and engaging our employees. Through our partnership with Habitat for Humanity, Owens Corning completed 28 home builds or renovations in 2017 in the United States, Canada, and China.
In 2016, Owens Corning initiated the Roof Deployment Program. Through the program, our network of platinum roofing contractors is given the opportunity to volunteer their services to provide a free roof to a veteran in need. Veterans are identified through our charitable partners, primarily Habitat for Humanity and the Gary Sinise Foundation. Owens Corning donates the roofing materials and helps to provide local PR for the contractor. Since 2016, 57 contractors have taken advantage of the program, with 34 participating in 2017.
CREATING INDIRECT ECONOMIC BENEFITS IN COMMUNITIES
Our businesses increasingly affect the economy of the local regions we operate in, and acting responsibly is critical to achieving our sustainability goals. To this end, we have created a wide range of energy-saving products and high-performance buildings by leveraging our building science expertise and collaborating with our customers to create positive impact in our communities. Through our wages, taxes, hiring, procurement, and financial contribution policies, we ensure that our global operations support communities and other stakeholders in positive ways.
In 2017, Owens Corning and the Owens Corning Foundation made cash contributions to nonprofit organizations that totaled more than $3 million and in-kind gifts totaling close to $950,000+. In addition, through Owens Corning’s annual giving campaign and disaster relief efforts, our employees and vendors raised $1.1 million in 2017.
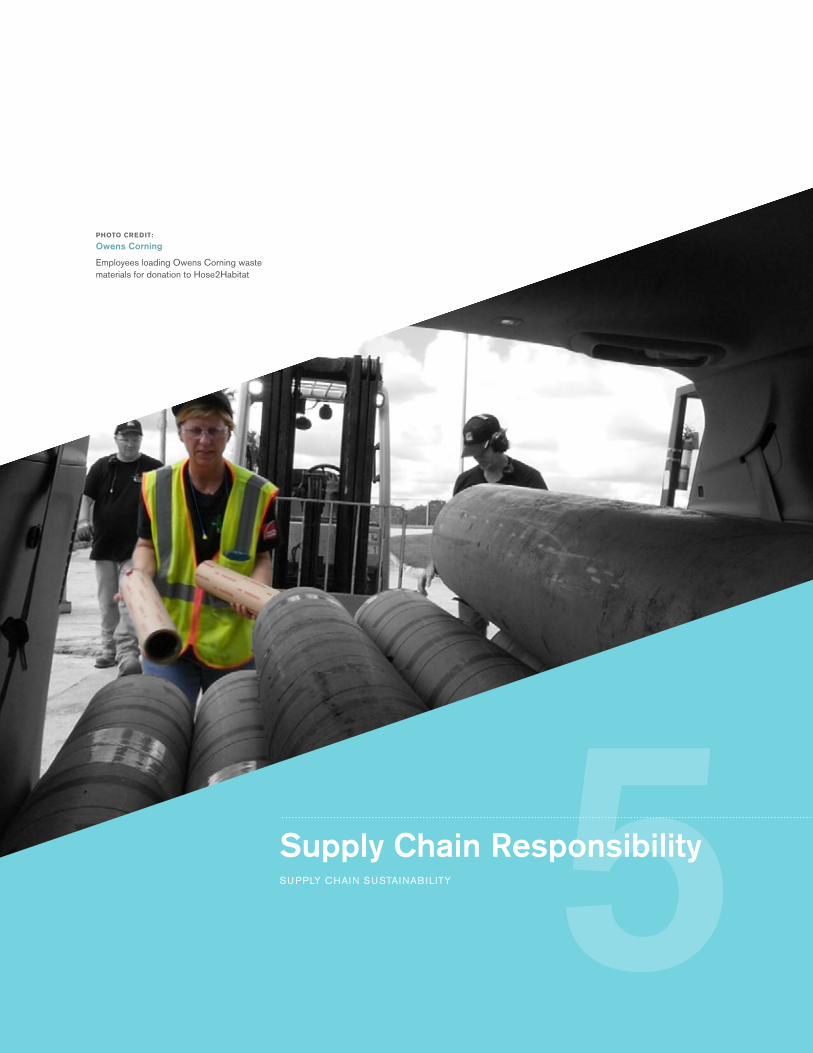
5
PHOTO CREDIT:
Owens Corning
Employees loading Owens Corning waste materials for donation to Hose2Habitat
Supply Chain ResponsibilitySUPPLY CHAIN SUSTAINAB ILITY
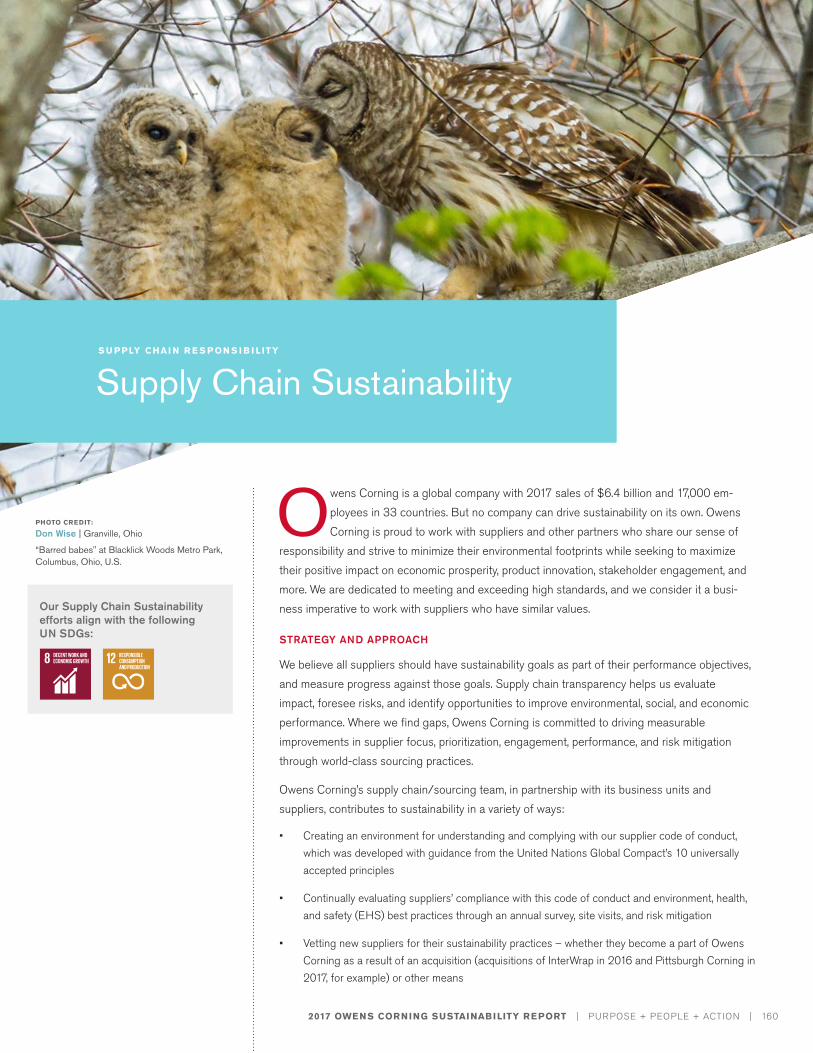
2017 OWENS CORNING SUSTAINABILITY REPORT | PURPOSE + PEOPLE + ACTION | 160
S U PPLY CHAI N R E S P ON S I B I L ITY
Supply Chain Sustainability
Our Supply Chain Sustainability efforts align with the following UN SDGs:
PHOTO CREDIT:
Don Wise | Granville, Ohio
“Barred babes" at Blacklick Woods Metro Park, Columbus, Ohio, U.S.
Owens Corning is a global company with 2017 sales of $6.4 billion and 17,000 em-ployees in 33 countries. But no company can drive sustainability on its own. Owens Corning is proud to work with suppliers and other partners who share our sense of
responsibility and strive to minimize their environmental footprints while seeking to maximize their positive impact on economic prosperity, product innovation, stakeholder engagement, and more. We are dedicated to meeting and exceeding high standards, and we consider it a busi-ness imperative to work with suppliers who have similar values.
STRATEGY AND APPROACH
We believe all suppliers should have sustainability goals as part of their performance objectives, and measure progress against those goals. Supply chain transparency helps us evaluate impact, foresee risks, and identify opportunities to improve environmental, social, and economic performance. Where we find gaps, Owens Corning is committed to driving measurable improvements in supplier focus, prioritization, engagement, performance, and risk mitigation through world-class sourcing practices.
Owens Corning’s supply chain/sourcing team, in partnership with its business units and suppliers, contributes to sustainability in a variety of ways:
• Creating an environment for understanding and complying with our supplier code of conduct, which was developed with guidance from the United Nations Global Compact’s 10 universally accepted principles
• Continually evaluating suppliers’ compliance with this code of conduct and environment, health, and safety (EHS) best practices through an annual survey, site visits, and risk mitigation
• Vetting new suppliers for their sustainability practices – whether they become a part of Owens Corning as a result of an acquisition (acquisitions of InterWrap in 2016 and Pittsburgh Corning in 2017, for example) or other means
2017 OWENS CORNING SUSTAINABILITY REPORT | PURPOSE + PEOPLE + ACTION | 161
S U PPLY CHAI N R E S P ON S I B I L ITY
Supply Chain Sustainability
• Partnering with the research and development team to identify materials and suppliers that can reduce risk for Owens Corning and its customers. Examples include introducing more formaldehyde-free formulations, next-generation flame retardants, and products that don’t contain any volatile organic compounds.
• Partnering with Owens Corning’s business units to identify additional potential suppliers to reduce single-source risk
• Supporting recycling programs – for glass and roofing materials – which provide essential feedstock for our operations. For more information on these programs, see page 56 of the Product Sustainability &
Stewardship section.
The supplier code of conduct is consistent with our code of conduct for employees, and with the commitments we have made both as a signatory to the UN Global Compact and as a member of the RobecoSam DJSI World Index. Our supplier code of conduct outlines the various expectations we have of our suppliers, including key principles we expect our suppliers to embrace, and acts prospectively as a reference for us in our sourcing selection processes. The supplier code of conduct states that suppliers are expected at
• Provide adequate management systems for EHS and product stewardship programs;
• Provide products that are safe and environmentally sound during use and disposal;
• Have programs to reduce the environmental impact of their products, such as reduction of discharges into natural surroundings and other sources of pollution; and
• Establish goals and monitor the reduction of their environmental footprint.
We provide an independent line of communication for suppliers to address infractions or the inability to adhere to our supplier code of conduct due to the actions of an Owens Corning employee. Suppliers can contact us through the business conduct help line at +1-800-241-5689 or collect at +1-770-263-4741.
Goals and Commitments
Owens Corning is committed to carrying out our 2020 supply chain sustainability goals, which are discussed in detail throughout this section:
• Set clear expectations for sustainability progress by our suppliers
• Use leading-edge sourcing practices
• Measure and disclose supply chain performance
• Expand our training on sustainability to meet the needs of our global sourcing organization
• Enhance our transportation efficiency
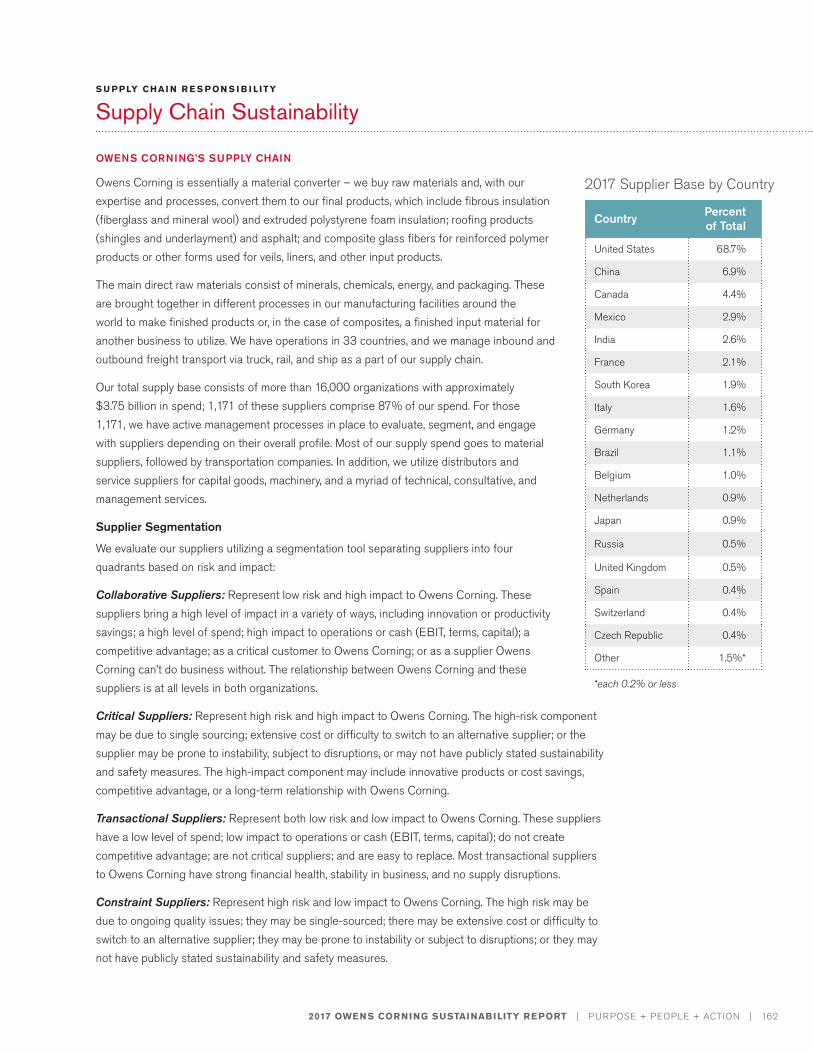
2017 OWENS CORNING SUSTAINABILITY REPORT | PURPOSE + PEOPLE + ACTION | 162
S U PPLY CHAI N R E S P ON S I B I L ITY
Supply Chain Sustainability
OWENS CORNING’S SUPPLY CHAIN
Owens Corning is essentially a material converter – we buy raw materials and, with our expertise and processes, convert them to our final products, which include fibrous insulation (fiberglass and mineral wool) and extruded polystyrene foam insulation; roofing products (shingles and underlayment) and asphalt; and composite glass fibers for reinforced polymer products or other forms used for veils, liners, and other input products.
The main direct raw materials consist of minerals, chemicals, energy, and packaging. These are brought together in different processes in our manufacturing facilities around the world to make finished products or, in the case of composites, a finished input material for another business to utilize. We have operations in 33 countries, and we manage inbound and outbound freight transport via truck, rail, and ship as a part of our supply chain.
Our total supply base consists of more than 16,000 organizations with approximately $3.75 billion in spend; 1,171 of these suppliers comprise 87% of our spend. For those 1,171, we have active management processes in place to evaluate, segment, and engage with suppliers depending on their overall profile. Most of our supply spend goes to material suppliers, followed by transportation companies. In addition, we utilize distributors and service suppliers for capital goods, machinery, and a myriad of technical, consultative, and management services.
Supplier Segmentation
We evaluate our suppliers utilizing a segmentation tool separating suppliers into four quadrants based on risk and impact:
Collaborative Suppliers: Represent low risk and high impact to Owens Corning. These suppliers bring a high level of impact in a variety of ways, including innovation or productivity savings; a high level of spend; high impact to operations or cash (EBIT, terms, capital); a competitive advantage; as a critical customer to Owens Corning; or as a supplier Owens Corning can’t do business without. The relationship between Owens Corning and these suppliers is at all levels in both organizations.
Critical Suppliers: Represent high risk and high impact to Owens Corning. The high-risk component may be due to single sourcing; extensive cost or difficulty to switch to an alternative supplier; or the supplier may be prone to instability, subject to disruptions, or may not have publicly stated sustainability and safety measures. The high-impact component may include innovative products or cost savings, competitive advantage, or a long-term relationship with Owens Corning.
Transactional Suppliers: Represent both low risk and low impact to Owens Corning. These suppliers have a low level of spend; low impact to operations or cash (EBIT, terms, capital); do not create competitive advantage; are not critical suppliers; and are easy to replace. Most transactional suppliers to Owens Corning have strong financial health, stability in business, and no supply disruptions.
Constraint Suppliers: Represent high risk and low impact to Owens Corning. The high risk may be due to ongoing quality issues; they may be single-sourced; there may be extensive cost or difficulty to switch to an alternative supplier; they may be prone to instability or subject to disruptions; or they may not have publicly stated sustainability and safety measures.
Country Percent of Total
United States 68.7%
China 6.9%
Canada 4.4%
Mexico 2.9%
India 2.6%
France 2.1%
South Korea 1.9%
Italy 1.6%
Germany 1.2%
Brazil 1.1%
Belgium 1.0%
Netherlands 0.9%
Japan 0.9%
Russia 0.5%
United Kingdom 0.5%
Spain 0.4%
Switzerland 0.4%
Czech Republic 0.4%
Other 1.5%*
2017 Supplier Base by Country
*each 0.2% or less
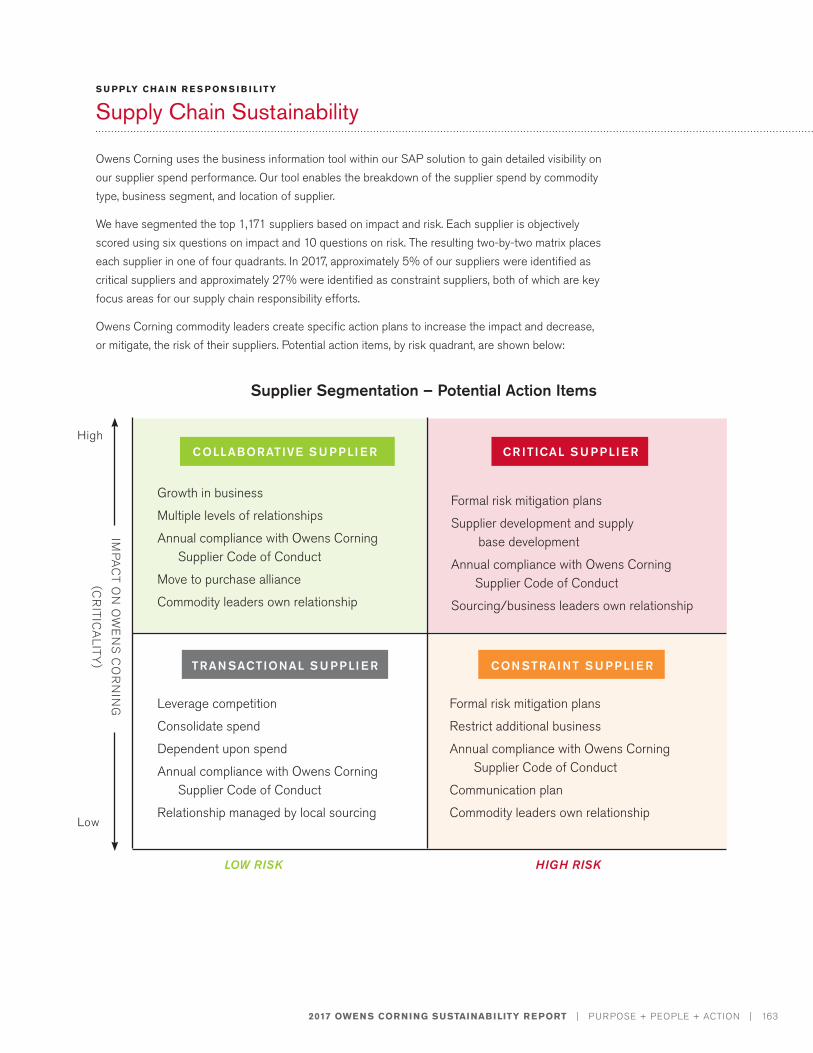
2017 OWENS CORNING SUSTAINABILITY REPORT | PURPOSE + PEOPLE + ACTION | 163
S U PPLY CHAI N R E S P ON S I B I L ITY
Supply Chain Sustainability
Owens Corning uses the business information tool within our SAP solution to gain detailed visibility on our supplier spend performance. Our tool enables the breakdown of the supplier spend by commodity type, business segment, and location of supplier.
We have segmented the top 1,171 suppliers based on impact and risk. Each supplier is objectively scored using six questions on impact and 10 questions on risk. The resulting two-by-two matrix places each supplier in one of four quadrants. In 2017, approximately 5% of our suppliers were identified as critical suppliers and approximately 27% were identified as constraint suppliers, both of which are key focus areas for our supply chain responsibility efforts.
Owens Corning commodity leaders create specific action plans to increase the impact and decrease, or mitigate, the risk of their suppliers. Potential action items, by risk quadrant, are shown below:
Growth in business
Multiple levels of relationships
Annual compliance with Owens Corning Supplier Code of Conduct
Move to purchase alliance
Commodity leaders own relationship
Leverage competition
Consolidate spend
Dependent upon spend
Annual compliance with Owens Corning Supplier Code of Conduct
Relationship managed by local sourcing
Formal risk mitigation plans
Restrict additional business
Annual compliance with Owens Corning Supplier Code of Conduct
Communication plan
Commodity leaders own relationship
Formal risk mitigation plans
Supplier development and supply base development
Annual compliance with Owens Corning Supplier Code of Conduct
Sourcing/business leaders own relationship
COLLABORATIVE S U PPLI E R
TRAN SACTIONAL S U PPLI E R
CR ITICAL S U PPLI E R
CON STRAI NT S U PPLI E R
LOW RISK
High
Low
IMPA
CT O
N O
WE
NS C
OR
NIN
G
(CR
ITICA
LITY)
HIGH RISK
Supplier Segmentation – Potential Action Items
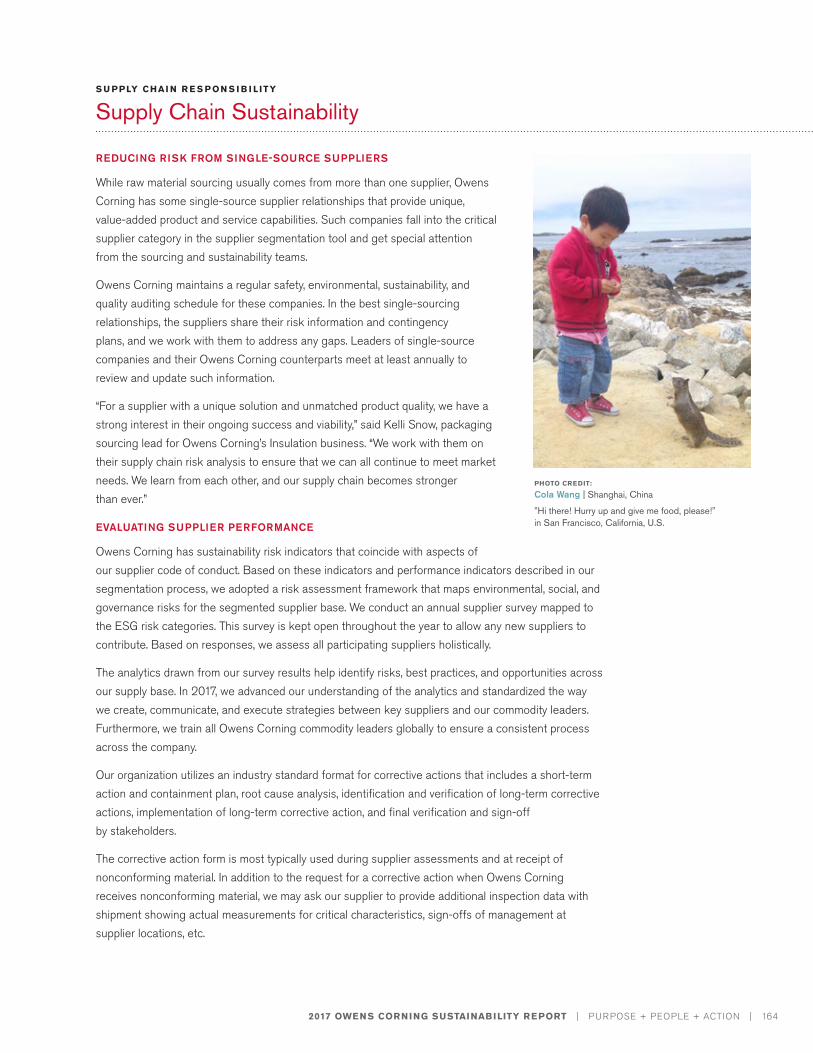
2017 OWENS CORNING SUSTAINABILITY REPORT | PURPOSE + PEOPLE + ACTION | 164
S U PPLY CHAI N R E S P ON S I B I L ITY
Supply Chain Sustainability
REDUCING RISK FROM SINGLE-SOURCE SUPPLIERS
While raw material sourcing usually comes from more than one supplier, Owens Corning has some single-source supplier relationships that provide unique, value-added product and service capabilities. Such companies fall into the critical supplier category in the supplier segmentation tool and get special attention from the sourcing and sustainability teams.
Owens Corning maintains a regular safety, environmental, sustainability, and quality auditing schedule for these companies. In the best single-sourcing relationships, the suppliers share their risk information and contingency plans, and we work with them to address any gaps. Leaders of single-source companies and their Owens Corning counterparts meet at least annually to review and update such information.
“For a supplier with a unique solution and unmatched product quality, we have a strong interest in their ongoing success and viability,” said Kelli Snow, packaging sourcing lead for Owens Corning’s Insulation business. “We work with them on their supply chain risk analysis to ensure that we can all continue to meet market needs. We learn from each other, and our supply chain becomes stronger than ever.”
EVALUATING SUPPLIER PERFORMANCE
Owens Corning has sustainability risk indicators that coincide with aspects of our supplier code of conduct. Based on these indicators and performance indicators described in our segmentation process, we adopted a risk assessment framework that maps environmental, social, and governance risks for the segmented supplier base. We conduct an annual supplier survey mapped to the ESG risk categories. This survey is kept open throughout the year to allow any new suppliers to contribute. Based on responses, we assess all participating suppliers holistically.
The analytics drawn from our survey results help identify risks, best practices, and opportunities across our supply base. In 2017, we advanced our understanding of the analytics and standardized the way we create, communicate, and execute strategies between key suppliers and our commodity leaders. Furthermore, we train all Owens Corning commodity leaders globally to ensure a consistent process across the company.
Our organization utilizes an industry standard format for corrective actions that includes a short-term action and containment plan, root cause analysis, identification and verification of long-term corrective actions, implementation of long-term corrective action, and final verification and sign-off by stakeholders.
The corrective action form is most typically used during supplier assessments and at receipt of nonconforming material. In addition to the request for a corrective action when Owens Corning receives nonconforming material, we may ask our supplier to provide additional inspection data with shipment showing actual measurements for critical characteristics, sign-offs of management at supplier locations, etc.
PHOTO CREDIT:
Cola Wang | Shanghai, China
"Hi there! Hurry up and give me food, please!" in San Francisco, California, U.S.
2017 OWENS CORNING SUSTAINABILITY REPORT | PURPOSE + PEOPLE + ACTION | 165
S U PPLY CHAI N R E S P ON S I B I L ITY
Supply Chain Sustainability
When supplier risk is identified, a contingency plan may be created to assist in mitigating the risk. The contingency plan may be a detailed document outlining action plans in the event of power outages, labor disputes, transportation issues, and materials shortages, or it could be an increased inspection plan or material certification plan at the supplier location. Each risk is reviewed, prioritized, and managed using the appropriate tools available to the organization.
In 2017, 1,171 suppliers (compared with 993 suppliers in 2016) were subject to assessments for impacts on society and labor practices. As a result of these assessments, Owens Corning does not have any suppliers identified as having potential or actual significant negative impacts on society, human rights, labor practices, or the environment. No cases related to human rights were reported in 2017. Owens Corning has a human rights policy in accordance with the UN Global Compact, and expectations on human rights are outlined in our supplier code of conduct.
In 2017, 100% of all new suppliers were screened using societal, human rights, labor practices, and environmental criteria; review of the supplier code of conduct; self-evaluation data; or review by an Owens Corning commodity leader. As discussed earlier in this section, new supplier screenings have become more critical and frequent as we pursue our growth agenda, which includes acquisitions.
We screen new suppliers for any global or governmental sanctions using the Thomson Reuters World Check system. Information is collated from an extensive network of reputable sources, which include:
• 530+ sanction, watch, regulatory, and law enforcement lists;
• Local and international government records;
• Country-specific data sources;
• International adverse electronic and physical media searches;
• English and foreign language data sources; and
• Relevant industry sources.
LOCAL SOURCING
Costs, quality performance, delivery performance, innovation, financial viability, and location are the key considerations in our supplier selection process. Additionally, the supplier must meet social, safety, and environmental standards as stated in our supplier code of conduct. To further enhance sustainability across the supply chain, we believe transportation of materials and engagement with the supplier can be done more efficiently if the supplier is nearby. We do not have a policy in place for local procurement, but we track this information for our U.S. facilities and define “local” to be within a 250-mile radius of any of our facilities.
In 2017, 36% of Owens Corning’s purchases were made locally for significant locations of our operations. Some products, such as cullet (recycled glass), are sourced near plant locations as a matter of good practice and cost effectiveness. Many of our facilities have rail delivery capability, enabling longer haul distance procurement with cost and environmental benefits, which would fall outside the 250-mile range.
PHOTO CREDIT:
Magali Eyraud | Chambéry, France
“Rana de Ojos Rojos (frog with red eyes)” in Costa Rica
2017 OWENS CORNING SUSTAINABILITY REPORT | PURPOSE + PEOPLE + ACTION | 166
S U PPLY CHAI N R E S P ON S I B I L ITY
Supply Chain Sustainability
TRANSPORTATION SUSTAINABILITY
Transportation sustainability continues to be an important aspect of our Scope 3 calculation and goals, but it is a challenge. We have maintained our goal of converting 12% of North American transportation miles from diesel fuel to natural gas by 2020 despite making no significant progress against this goal in 2017.
The path that we have been on since 2012, which included conversion of shipping lanes from diesel-powered equipment to natural-gas-powered equipment and the conversion of truck lanes to intermodal transportation, has been impacted by three factors. First, due to the reduced cost of diesel over the last three years, the conversion to natural gas power has stalled, as the ROI on equipment conversions has not been favorable for the carriers; however, we have held the conversions that had been made in previous years. Second, economic growth and market demand have made it difficult for Owens Corning to make the conversion from truck to intermodal equipment. And, third, capacity of intermodal equipment in our heaviest conversion lanes has been below our level of demand.
As we push for transportation sustainability, we are continuing to add payload to trucks through sourcing for lighter equipment, using more rail boxcars for heavy destination volume, and, for the future, looking at other alternative fuels such as electric power and biodiesel. We are conscientious in choosing our partners in transportation and evaluate our carriers on membership in EPA’s SmartWay program, workforce sustainability, and meeting the requirements for safety in line with our corporate values.
SAND MINING AND OUR SUPPLY CHAIN
There is a global concern that the illegal mining of sand, or extraction from riverbeds and shorelines, is harming the environment and threatening beaches and habitats. In addition, in some parts of the world, sand mining has been linked to human rights violations.
These environmental and social concerns come at a time when the demand for industrial sand has never been higher. An estimated 40 billion tons of sand is used annually around the world, with more than 80% of it consumed by the construction industry. More recently, the fracking industry has become a major user of industrial sand.
Owens Corning has a vested interest in ensuring a sustainable, responsible supply chain for sand to manufacture our products. Our annual sand (silica) consumption approaches 1 million tons, with nearly 75% coming from North America. Glass production requires a higher grade of silica that generally comes from mines and quarries, and, therefore, riverbed and shoreline sands are not suitable.
In 2017, as part of our effort to better understand the human rights issue in global supply chains, we worked with four students from The Ohio State University’s Fisher College of Business on a study of human trafficking and modern slavery. Included in that study was a historical review of supply chains for sand, borax, and limestone, which are used in our products. We thank Ellie Fellers, Sarah Fischer, Katie Harper, and Brittany Bechhold from OSU’s Energy and Sustainability Industry Cluster for their contributions to our knowledge base on this subject.
2017 OWENS CORNING SUSTAINABILITY REPORT | PURPOSE + PEOPLE + ACTION | 167
S U PPLY CHAI N R E S P ON S I B I L ITY
Supply Chain Sustainability
With this information in hand, our global commodity leaders regularly reach out to our suppliers in Asia, India, North America, and Europe, and have confirmed that we source silica specifically from legal mines and quarries. We are confident in the integrity and continuity of our silica supply base, and we want to continue to take a leadership role to promote a safe, sustainable supply chain for silica users in general. We are also major supporters of glass recycling, which reduces our reliance on sand for glass and fiberglass production.
PHOTO CREDIT:
Lisa Hatfield | Louisville, Kentucky, U.S.
“Pot of gold” in Pendleton, Kentucky, U.S.
S USTAI NAB I LITY I N ACTION
2017 OWENS CORNING SUSTAINABILITY REPORT | PURPOSE + PEOPLE + ACTION | 168
S U PPLY CHAI N R E S P ON S I B I L ITY
Supply Chain Sustainability
More than 94% of Owens Corning suppliers are able and willing to comply with all aspects of our supplier code of conduct. This was one of the key findings in 2017 from our annual supplier sustainability survey.
We contacted 1,465 suppliers from around the world to take the survey, up from 993 in 2016, and 328 did so – a response rate of approximately 23%. While the percent returned was down from 26% in 2016, the number returned was greater by 68. The contact list included any supplier that had been scored using the supplier segmentation tool described previously as well as any other large, new suppliers. The survey was revised in recent years to go deeper on certain key issues and remove less important questions.
Owens Corning asked suppliers about their sustainability and safety policies and goals. We found that 87% of suppliers have organizational goals and policies for safety, up from 83% last year, and 69% have them for sustainability. Many of the companies report on their goals and policies internally and/or externally, and some publish their data at least annually.
The survey data are used in a variety of ways:
• Learn what companies are doing, including where they are strong and where they may need support
• Highlight areas that need additional attention and follow-up. For example, not answering a question was treated the same as a negative response, which triggered direct follow-up.
• Identify best practices and leading companies that should be considered for an Owens Corning supplier award
“We have increased training for our commodity leaders on how to use the data and talk to suppliers about their survey results,” said Carla Zeiler global strategic supplier management leader for Owens Corning. “We’ve also learned some things about our suppliers. For example, some said, for legal reasons, they couldn’t say they would comply with all aspects of our supplier code of conduct, but they did say they comply with their own, which they shared with us.”
Supplier Survey
S USTAI NAB I LITY I N ACTION
2017 OWENS CORNING SUSTAINABILITY REPORT | PURPOSE + PEOPLE + ACTION | 169
S U PPLY CHAI N R E S P ON S I B I L ITY
Supply Chain Sustainability
As a result of several acquisitions in recent years, and the subsequent integration of their supply chains, we had some changes to our supplier profile in 2017. With our 2017 acquisition of Pittsburgh Corning, the suppliers we have gained are similar to our existing suppliers. As we did following our 2016 acquisition of InterWrap, we are currently adding these suppliers to our systems and integrating them into our assessment process, as well as identifying synergies where appropriate.
Evaluating supply chain risk is part of our due diligence when considering an acquisition – we want to be sure that we will have access to high-quality, capable, safe partners, or at least that they have the potential to meet our standards with our support and encouragement. Once a transaction is finalized, we provide extensive internal training and structure to ensure that acquired businesses understand our supplier code of conduct and how to administer it. In addition, our commodity leaders spend time getting to know key suppliers, explaining the supplier code of conduct, following up on issues of concern, and, if necessary, identifying alternative potential suppliers.
The 2016 acquisition of InterWrap resulted in several major new, non-U.S. suppliers for Owens Corning’s Roofing business, and we have been particularly effective in India, for example, in auditing and partnering with these large, new suppliers. We have evaluated a full slate of criteria, including labor force protections, emergency management, OHSAS 18001 Occupational Health and Safety Management standards certification, chemical process safety, storage of raw materials, and equipment maintenance.
“Acquisitions often come with new suppliers, sometimes very significant ones from outside the U.S.,” explained Brian Meyer, minerals and global components sourcing leader for Owens Corning’s Roofing business with sourcing responsibilities for 18 Owens Corning facilities across the U.S., China, and India. “Our approach is to engage with them early to set expectations and implement a consistent structure for supplier relationships. Sustainability metrics are an important gauge of a supplier’s ability to provide a committed, reliable supply of raw materials to support our growth.”
For more information on how we integrate acquisitions into our sustainability program, see page 171 in the Growth Strategy + Prosperity section.
How Acquisitions Impact Supply Chain Sustainability
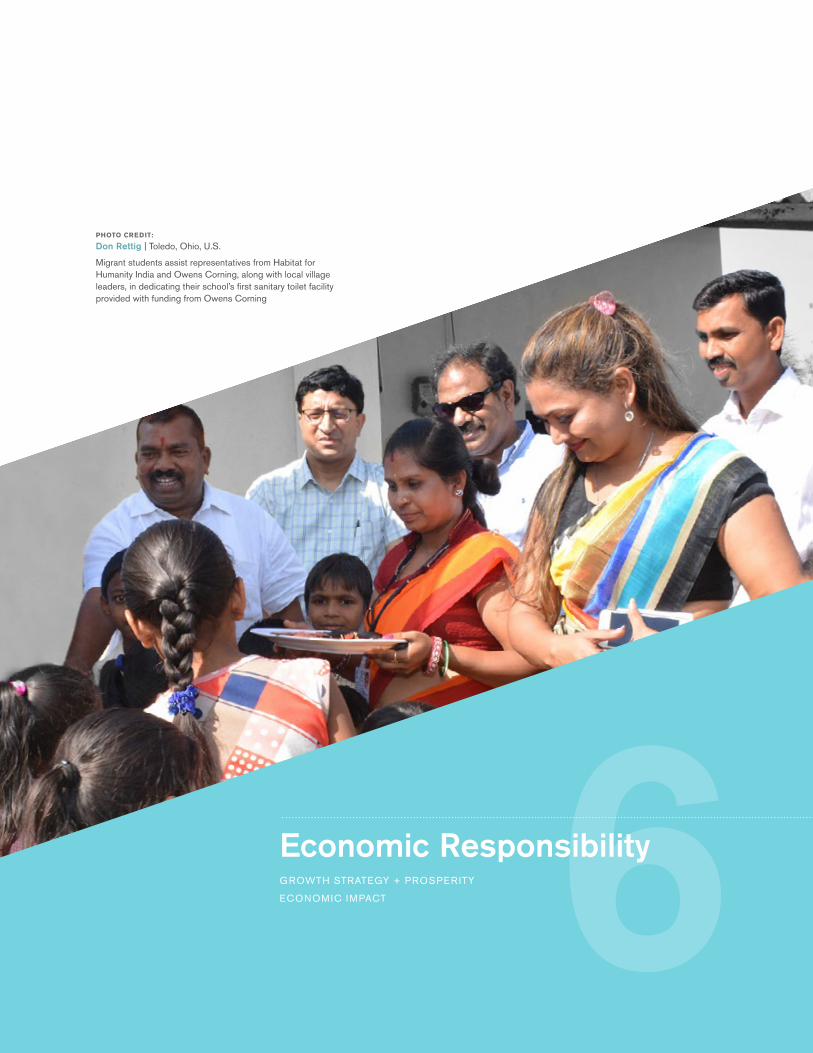
PHOTO CREDIT:
Don Rettig | Toledo, Ohio, U.S.
Migrant students assist representatives from Habitat for Humanity India and Owens Corning, along with local village leaders, in dedicating their school’s first sanitary toilet facility provided with funding from Owens Corning
6Economic ResponsibilityGROWTH STRATEGY + PROSPER ITY
ECONOMIC IMPACT
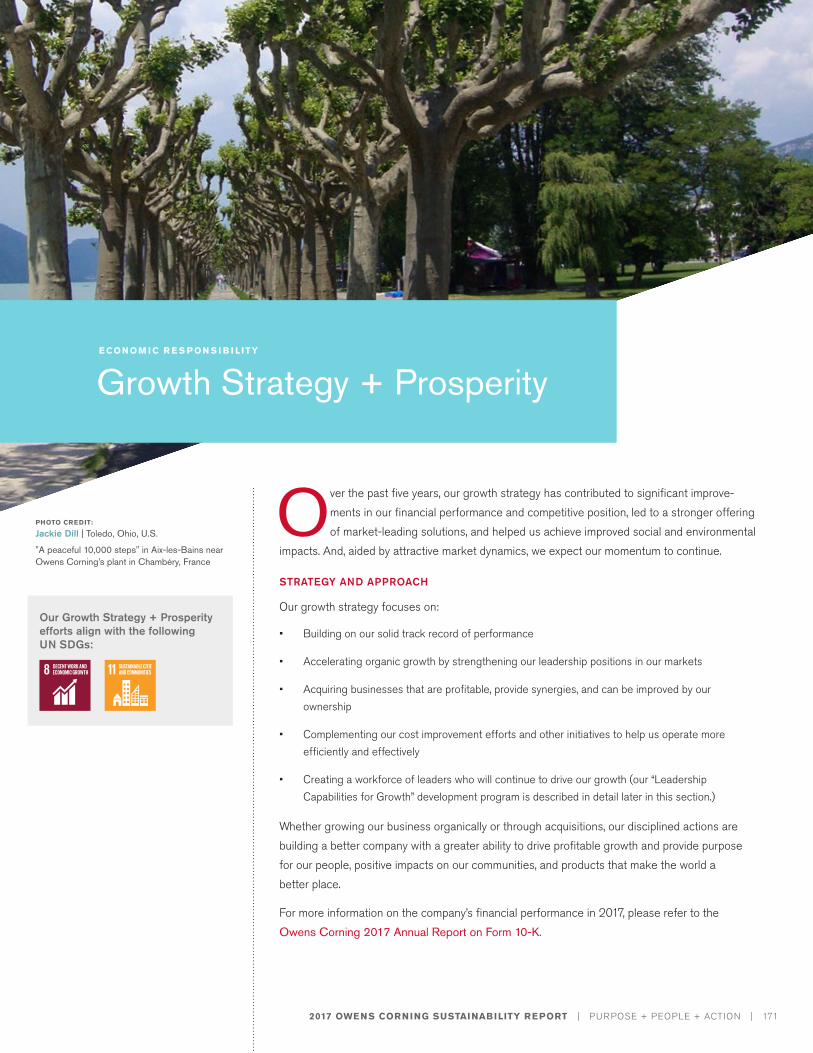
2017 OWENS CORNING SUSTAINABILITY REPORT | PURPOSE + PEOPLE + ACTION | 171
Our Growth Strategy + Prosperity efforts align with the following UN SDGs:
PHOTO CREDIT:
Jackie Dill | Toledo, Ohio, U.S.
"A peaceful 10,000 steps" in Aix-les-Bains near Owens Corning’s plant in Chambéry, France
E CON OM I C R E S P ON S I B I L ITY
Growth Strategy + Prosperity
Over the past five years, our growth strategy has contributed to significant improve-ments in our financial performance and competitive position, led to a stronger offering of market-leading solutions, and helped us achieve improved social and environmental
impacts. And, aided by attractive market dynamics, we expect our momentum to continue.
STRATEGY AND APPROACH
Our growth strategy focuses on:
• Building on our solid track record of performance
• Accelerating organic growth by strengthening our leadership positions in our markets
• Acquiring businesses that are profitable, provide synergies, and can be improved by our ownership
• Complementing our cost improvement efforts and other initiatives to help us operate more efficiently and effectively
• Creating a workforce of leaders who will continue to drive our growth (our “Leadership Capabilities for Growth” development program is described in detail later in this section.)
Whether growing our business organically or through acquisitions, our disciplined actions are building a better company with a greater ability to drive profitable growth and provide purpose for our people, positive impacts on our communities, and products that make the world a better place.
For more information on the company’s financial performance in 2017, please refer to the Owens Corning 2017 Annual Report on Form 10-K.
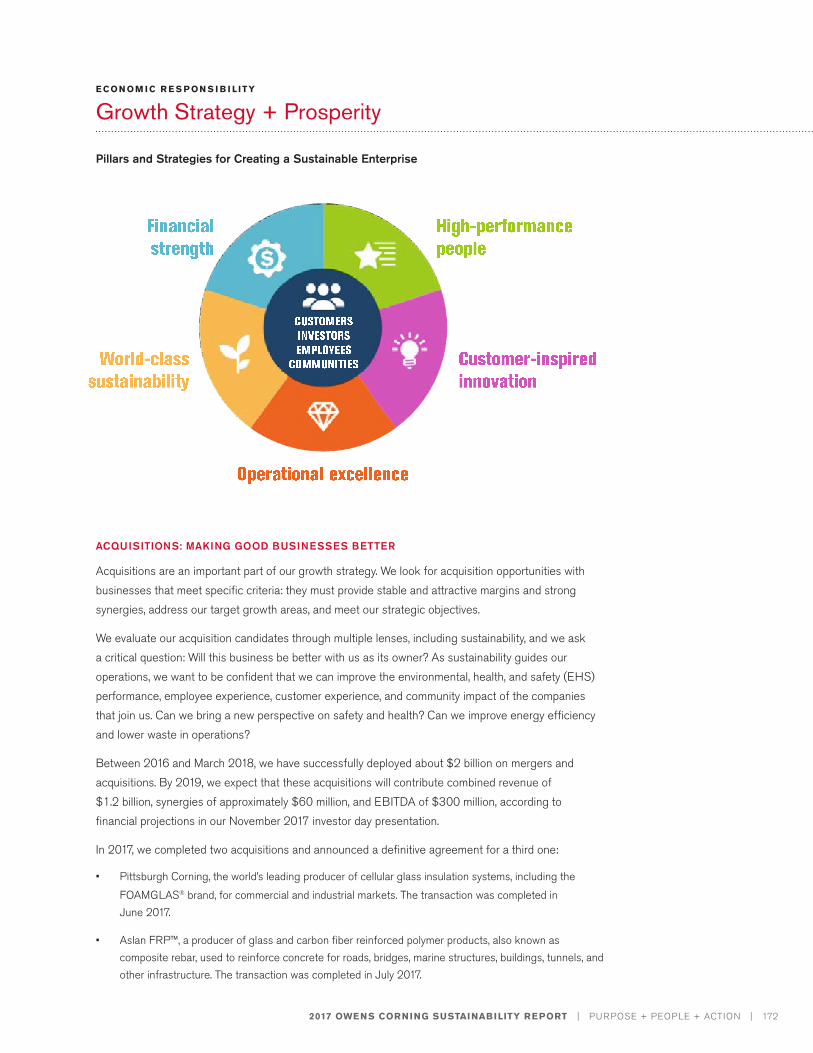
2017 OWENS CORNING SUSTAINABILITY REPORT | PURPOSE + PEOPLE + ACTION | 172
E CON OM I C R E S P ON S I B I L ITY
Growth Strategy + Prosperity
Pillars and Strategies for Creating a Sustainable Enterprise
ACQUISITIONS: MAKING GOOD BUSINESSES BETTER
Acquisitions are an important part of our growth strategy. We look for acquisition opportunities with businesses that meet specific criteria: they must provide stable and attractive margins and strong synergies, address our target growth areas, and meet our strategic objectives.
We evaluate our acquisition candidates through multiple lenses, including sustainability, and we ask a critical question: Will this business be better with us as its owner? As sustainability guides our operations, we want to be confident that we can improve the environmental, health, and safety (EHS) performance, employee experience, customer experience, and community impact of the companies that join us. Can we bring a new perspective on safety and health? Can we improve energy efficiency and lower waste in operations?
Between 2016 and March 2018, we have successfully deployed about $2 billion on mergers and acquisitions. By 2019, we expect that these acquisitions will contribute combined revenue of $1.2 billion, synergies of approximately $60 million, and EBITDA of $300 million, according to financial projections in our November 2017 investor day presentation.
In 2017, we completed two acquisitions and announced a definitive agreement for a third one:
• Pittsburgh Corning, the world’s leading producer of cellular glass insulation systems, including the
FOAMGLAS® brand, for commercial and industrial markets. The transaction was completed in June 2017.
• Aslan FRP™, a producer of glass and carbon fiber reinforced polymer products, also known as composite rebar, used to reinforce concrete for roads, bridges, marine structures, buildings, tunnels, and other infrastructure. The transaction was completed in July 2017.
2017 OWENS CORNING SUSTAINABILITY REPORT | PURPOSE + PEOPLE + ACTION | 173
E CON OM I C R E S P ON S I B I L ITY
Growth Strategy + Prosperity
• Paroc Group, a leading producer of high-performance mineral wool insulation in Europe. A definitive agreement was announced in October 2017 and the transaction was completed in February 2018.
These transactions follow the 2016 acquisition and integration of InterWrap, a leading manufacturer of roofing underlayment and packaging materials. The acquired businesses successfully expand the capabilities and global reach of our three business segments (Composities, Insulation, and Roofing). We do not anticipate that these acquisitions will keep us from meeting our sustainability goals and commitments.
Improving EHS performance and enhancing the employee experience are critical elements in our acquisition integration process. At FOAMGLAS®, for example, just as we did at InterWrap in 2016, we implemented our “Critical Six” program, which is focused on minimizing or eliminating life-altering injuries from six of the highest-risk causes. The Critical Six workplace safety elements are:
• Lock/Tag/Try for controlling energy
• Confined Space
• Machine Guarding
• Powered Industrial Vehicles
• Working from Heights
• Automobile Safety
The impact on the safety performance at our FOAMGLAS® insulation materials facilities was almost immediate. From the date the completed acquisition was announced (June 27, 2017) to the end of the year, we achieved an 85% reduction in recordable injuries, compared with our target of a 50% reduction. We assigned more than 30 EHS professionals at these sites for EHS integration starting in July 2017, and each site had a tailored 90-day EHS integration plan. In addition to the Critical Six, we focused on training and education, enhanced personal protective equipment requirements, and dust control.
We are focused on building a sustainable safety culture across all acquired facilities, including implementing behavior-based safety programs to promote peer-to-peer interaction and accountability. In addition, we are working to engage our acquired organizations in the Owens Corning Healthy Living platform, which has six wellness pillars. For more information on this program, see page 133 in the Healthy Living section of this report.
ORGANIC GROWTH: INVESTING IN THE FUTURE
In addition to the acquisitive growth, we are making strategic investments in our existing business to support our growth agenda, strengthen our value proposition to customers, and contribute to a sustainable enterprise. This encompasses expanding capacity to meet increasing demand, introducing new, sustainable products, investing in more efficient equipment, closing underperforming facilities where necessary, and developing strategic alliances and other initiatives to ensure we are realigning assets toward our best growth opportunities.
2017 OWENS CORNING SUSTAINABILITY REPORT | PURPOSE + PEOPLE + ACTION | 174
E CON OM I C R E S P ON S I B I L ITY
Growth Strategy + Prosperity
For example, in 2017, we began production at our new $90 million manufacturing facility in Joplin, Missouri, which produces Thermafiber® SAFB™ (Sound Attenuation Fire Blankets) FF, the first formaldehyde-free, light-density mineral wool insulation in North America. The facility has more than 100 employees, and job safety training has been critical since the start-up. Owens Corning has been using the Job Instruction method of training that provides operations and safety training in three stages:
1. Demonstration of the task by the trainee with a focus on the most important steps for completing the work;
2. Review of the important steps, plus highlighting the reasons, any possible pitfalls, and general tips; and
3. Demonstration of safe completion of the task by trainees.
Also in 2017, we invested $50 million to rebuild a glass melter and expand production capacity by about 25 percent at our Chambéry, France, composites manufacturing facility. As a result, all thermoplastic chopped strand products from this facility will be based on boron-free Advantex® glass, which contributes to decreased emissions, reduces the environmental impact of manufacturing fiberglass, and provides superior performance in corrosive environments compared to standard E-glass.
In 2016 in India, we announced a $110 million investment in a state-of-the-art, 80,000-ton glass furnace at our Taloja facility. Start-up will occur in 2018, and, as a result, we expect significant sustainability benefits as we leverage the newest technologies in a cost-efficient platform. The new furnace incorporates Owens Corning’s most advanced melter and front-end technologies, which make it one of the most efficient furnaces with the smallest environmental footprint in the industry. Due to the materials we chose for its construction, we expect that this furnace will have a world-class lifespan between required rebuilds, thus maximizing its lifetime productivity.
To accelerate the development and commercialization of new products that drive growth, we have formed pipeline councils, which are tasked with taking the best ideas and getting them into our new product pipeline faster through expedited decision-making and a tight focus on innovation. In addition, we have developed an internal pool of MBA-trained strategy analysts who are available to work on various growth initiatives for our businesses.
For additional information on our product innovation and sustainable products efforts, see the Product Responsibility section starting on page 34 of this report.
BUILDING OUR ‘LEADERSHIP CAPABILITIES FOR GROWTH’
“We believe the growth of our business happens through the growth of our people. We have identified the leadership skills that are necessary for helping to drive our growth strategy, and we have programs in place both to help current leaders master those skills and to prepare rising stars to assume increasing leadership roles across the company,” says Sherry Smith, human resources lead for global leadership development.
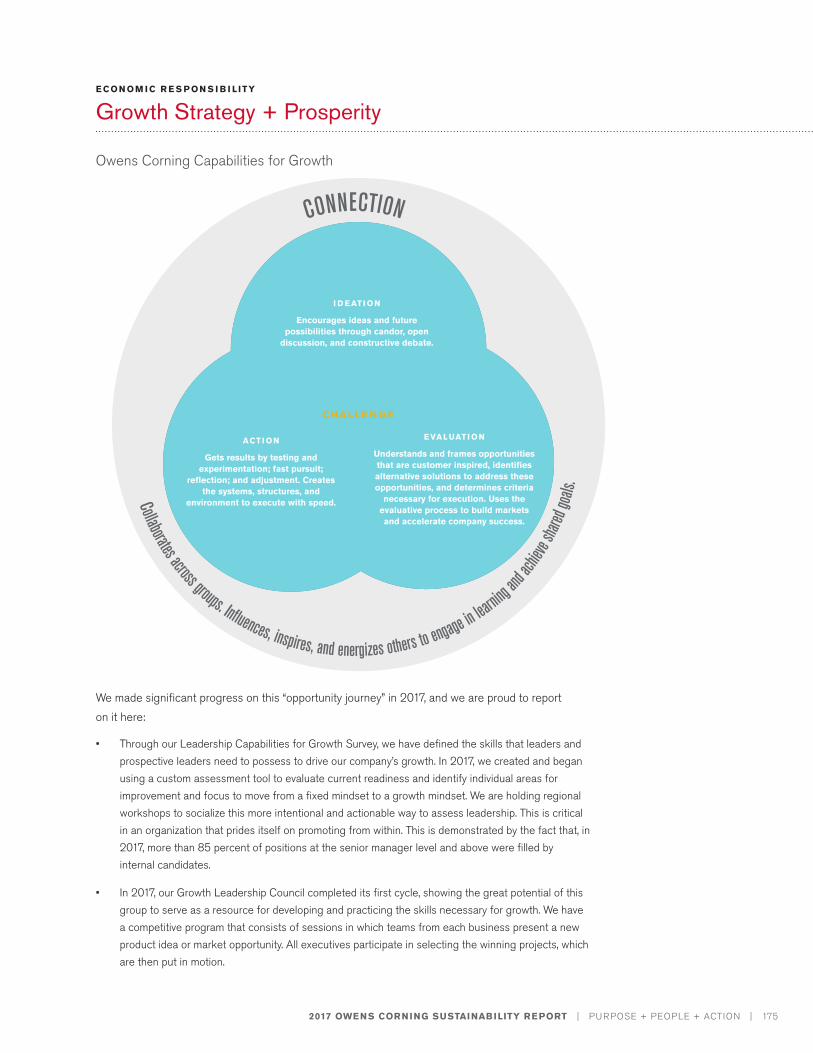
2017 OWENS CORNING SUSTAINABILITY REPORT | PURPOSE + PEOPLE + ACTION | 175
E CON OM I C R E S P ON S I B I L ITY
Growth Strategy + Prosperity
We made significant progress on this “opportunity journey” in 2017, and we are proud to report on it here:
• Through our Leadership Capabilities for Growth Survey, we have defined the skills that leaders and prospective leaders need to possess to drive our company’s growth. In 2017, we created and began using a custom assessment tool to evaluate current readiness and identify individual areas for improvement and focus to move from a fixed mindset to a growth mindset. We are holding regional workshops to socialize this more intentional and actionable way to assess leadership. This is critical in an organization that prides itself on promoting from within. This is demonstrated by the fact that, in 2017, more than 85 percent of positions at the senior manager level and above were filled by internal candidates.
• In 2017, our Growth Leadership Council completed its first cycle, showing the great potential of this group to serve as a resource for developing and practicing the skills necessary for growth. We have a competitive program that consists of sessions in which teams from each business present a new product idea or market opportunity. All executives participate in selecting the winning projects, which are then put in motion.
I D EATI ON
Encourages ideas and future possibilities through candor, open
discussion, and constructive debate.
ACTI ON
Gets results by testing and experimentation; fast pursuit;
reflection; and adjustment. Creates the systems, structures, and
environment to execute with speed.
EVALUATI ON
Understands and frames opportunities that are customer inspired, identifies alternative solutions to address these opportunities, and determines criteria
necessary for execution. Uses the evaluative process to build markets and accelerate company success.
CHALLE N G E
Owens Corning Capabilities for Growth
Collaborates across groups. Inf uences, inspires, and energizes others to engage in lear
ning and
achie
ve sha
red go
als.
CONNECTION
2017 OWENS CORNING SUSTAINABILITY REPORT | PURPOSE + PEOPLE + ACTION | 176
E CON OM I C R E S P ON S I B I L ITY
Growth Strategy + Prosperity
• We provide acquisition integration training to our current leaders, and offer tailored programs to help leaders from acquired companies learn quickly about our culture and how we view leadership. These programs include training on human-centered design, coaching for impact, and cultural diversity – which are consistent with our aspiration to build market-leading businesses that are global in scope, human in scale.
“We want to be the gold standard where top leaders want to work,” said Tracy Bolander, vice president of talent management. “We believe our growth agenda significantly enhances our ability to attract strong leaders and, equally important, to attract professionals who have the desire and capacity to lead and grow with us in the years ahead.”
For more information on our employee and leadership development programs, see the Employee Experience section beginning on page 111 of this report.
2017 OWENS CORNING SUSTAINABILITY REPORT | PURPOSE + PEOPLE + ACTION | 177
E CON OM I C R E S P ON S I B I L ITY
Economic Impact
PHOTO CREDIT:
Steve Geiger | Granville, Ohio, U.S
Rockport Harbor in Maine, U.S.
Owens Corning is committed to balancing economic growth with social progress and environmental stewardship. We are a world leader in building materials and composite systems, delivering a broad range of high-quality products and services. Our products
range from insulation and roofing for residential, commercial, and industrial applications to glass fiber used to reinforce composite materials for transportation, electronics, marine, infrastructure, wind energy, and other high-performance markets.
DRIVING SUSTAINABLE ECONOMIC GROWTH
At Owens Corning, we believe environmental sustainability is central to economic growth. Our commitment to balancing economic growth with social progress and environmental stewardship enables us to continue to deliver sustainable solutions to customers and stakeholders worldwide. Our economic progress is reflected in various financial indicators and robust performance across the company. Notably, we achieved revenue growth of 12% in 2017 as well as record levels of both adjusted EBIT and free cash flow. Owens Corning is at its best when all of our businesses make meaningful contributions to our financial results, and these results reflect the continued improvements we have made to our portfolio of businesses. Based on the strength exhibited across our portfolio and confidence in our market outlook, our board of directors declared a quarterly dividend of $0.21 per share, representing a 5% increase over the prior year.
To review our economic performance in detail, please see the Owens Corning 2017 Annual Report on Form 10-K.
Key Sustainability Indicators
To drive sustainable economic growth, we are focused on addressing and continuously improving on our key sustainability indicators. These include:
Our Economic Impact efforts align with the following UN SDG:
2017 OWENS CORNING SUSTAINABILITY REPORT | PURPOSE + PEOPLE + ACTION | 178
E CON OM I C R E S P ON S I B I L ITY
Economic Impact
• Achieving operational sustainability by reducing our environmental footprint, in line with our global stakeholders’ expectations. We are committed to reducing primary energy usage, greenhouse gas emissions, fine particulate matter and toxic air emissions, as well as minimizing waste to landfill and water usage.
• Charting a clear course of action to drive product and supply chain sustainability through enhanced engagement and by enabling product life cycle transparency, which feedback reminds us is a critical success factor for our stakeholders. Our product responsibility goals make transparent the total life cycle assessment (LCA) of all core products.
• Ensuring community impact through local community initiatives, a key aspect of honoring our social responsibility.
• Striving to drive net-zero energy building capabilities, thereby achieving no net carbon releases, through sustained partnerships with customers, specifiers, architects, and builders.
• Expanding our building science expertise to educate the building industry, engineers, contractors, and homeowners on safe and efficient building materials.
• Continuing to make the safety, health, and wellness of our employees a top priority. Our safety programs are designed to maintain high standards of workplace safety for our global workforce through robust safety measures and proactive mitigation of workplace safety hazards. Our global wellness strategy, focused on six key pillars, engages our employees as well as their families.
PENSION LIABILITIES
Because we believe our people are integral to our success, we are committed to providing all employees with comprehensive retirement benefits. Generally, we offer these benefits via defined contribution arrangements. However, defined benefit plans may be provided in accordance with local custom to ensure a competitive overall benefits package.
Over 95% of our defined benefit obligations are payable through a fund held and maintained separately from the resources of the organization. The U.S. qualified plan is 107% funded, as determined by actuarial valuation within the past 12 months. The U.K. and Canadian plans are less than 100% funded, also based on actuarial valuation within the past 12 months. These three plans represent over 95% of the company’s defined benefit liabilities.
Our strategy for the U.S. plan is to contribute at least the minimum required amount each year and ensure that the plan is funded at 80% or greater. Other plans are funded in order to fully comply with local funding requirements.
Approximately 90% of Owens Corning employees who are eligible, participate in voluntary retirement savings (defined contribution) programs.
Based on our U.S. 401(k) plan, which represents approximately 93% of our contributory savings plans globally, employees who maximize the company match will be saving 14% of salary toward retirement, from both employee and employer contributions.
PHOTO CREDIT:
Cheryl Reynolds | Jackson, Tennessee, U.S.
Rescued eagle at Reelfoot Lake in Ridgely, Tennessee, U.S.
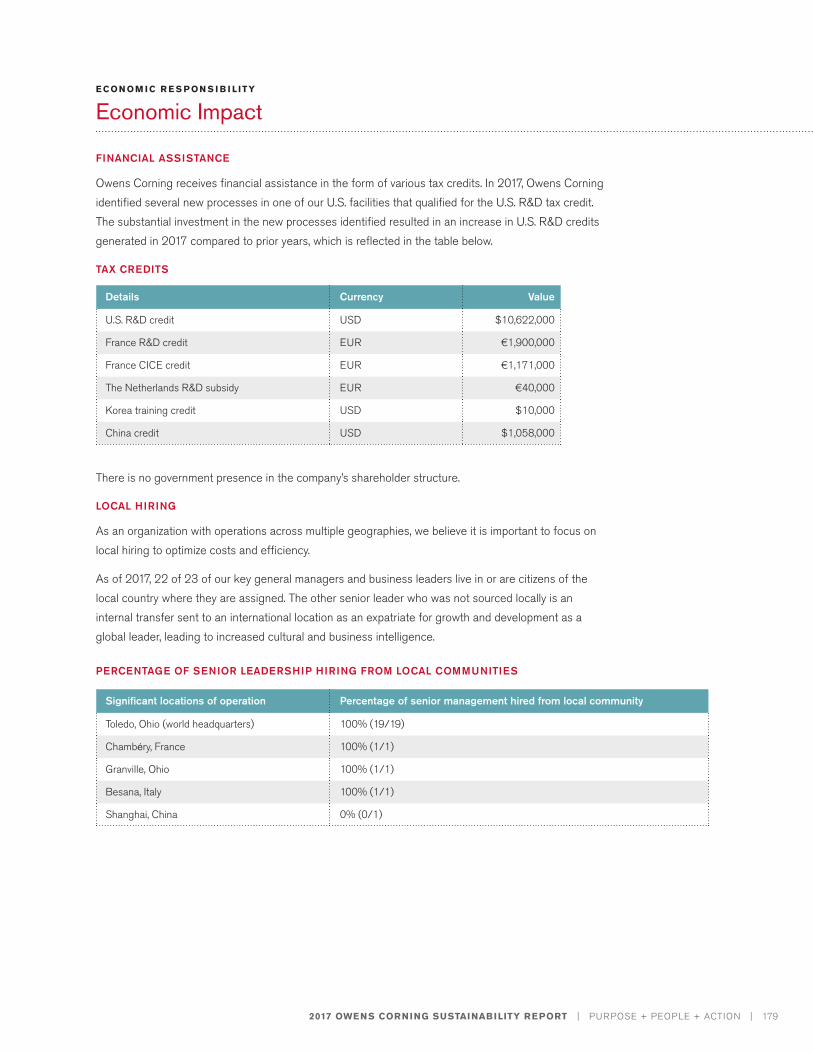
2017 OWENS CORNING SUSTAINABILITY REPORT | PURPOSE + PEOPLE + ACTION | 179
E CON OM I C R E S P ON S I B I L ITY
Economic Impact
FINANCIAL ASSISTANCE
Owens Corning receives financial assistance in the form of various tax credits. In 2017, Owens Corning identified several new processes in one of our U.S. facilities that qualified for the U.S. R&D tax credit. The substantial investment in the new processes identified resulted in an increase in U.S. R&D credits generated in 2017 compared to prior years, which is reflected in the table below.
TAX CREDITS
There is no government presence in the company’s shareholder structure.
LOCAL HIRING
As an organization with operations across multiple geographies, we believe it is important to focus on local hiring to optimize costs and efficiency.
As of 2017, 22 of 23 of our key general managers and business leaders live in or are citizens of the local country where they are assigned. The other senior leader who was not sourced locally is an internal transfer sent to an international location as an expatriate for growth and development as a global leader, leading to increased cultural and business intelligence.
PERCENTAGE OF SENIOR LEADERSHIP HIRING FROM LOCAL COMMUNITIES
Details Currency Value
U.S. R&D credit USD $10,622,000
France R&D credit EUR €1,900,000
France CICE credit EUR €1,171,000
The Netherlands R&D subsidy EUR €40,000
Korea training credit USD $10,000
China credit USD $1,058,000
Significant locations of operation Percentage of senior management hired from local community
Toledo, Ohio (world headquarters) 100% (19/19)
Chambéry, France 100% (1/1)
Granville, Ohio 100% (1/1)
Besana, Italy 100% (1/1)
Shanghai, China 0% (0/1)
PHOTO CREDIT:
Cindy Patterson | Toledo, Ohio, U.S.
“Sharing Breakfast in Hawaii”
7Governance and EthicsCORPORATE GOVERNANCE
ITS
2017 OWENS CORNING SUSTAINABILITY REPORT | PURPOSE + PEOPLE + ACTION | 181
PHOTO CREDIT:
Michael Todd | Jackson, Tennessee, U.S.
"Nene, a true survivor, once on the brink of extinction" at Hawaii Volcanoes National Park, in Hawaii, U.S.
STRATEGY AND APPROACH
E ffective corporate governance is a requirement for every company. For us, it is a requirement and a discipline – a deliberate framework of formal guidelines, processes, and procedures that controls how we conduct business and interact with our
stakeholders. It is the backbone of our business and ensures that we operate in accordance with the highest ethical standards, our charter documents, all applicable laws, and stakeholder interests.
As part of our disciplined approach to corporate governance, we adopted Corporate Governance Guidelines, which cover everything related to the board, including selection, composition, leadership, performance, relationship to management, meeting procedures, committee matters, and leadership development.
Our Code of Business Conduct is also very important for our effective corporate governance. All of our employees are required to abide by our code of business conduct and its prescriptions on legal and ethical conduct.
In addition, we have multiple corporate policies and procedures that address specific corporate governance topics. Together with our corporate governance guidelines and code of business conduct, these policies and procedures inform the way we work every day, and specifically guide us in conducting business ethically, maintaining strong relationships with our stakeholders, and staying true to our values.
As outlined in further detail in this section, on our website, and in our public filings, our governance framework brings all our businesses and associates under a single roof and integrates our values within daily operations. It provides oversight of performance and drives excellence, accountability, and transparency across all our businesses.
G OVE R NAN CE AN D ETH I CS
Corporate Governance
Our Corporate Governance efforts align with the following UN SDG:
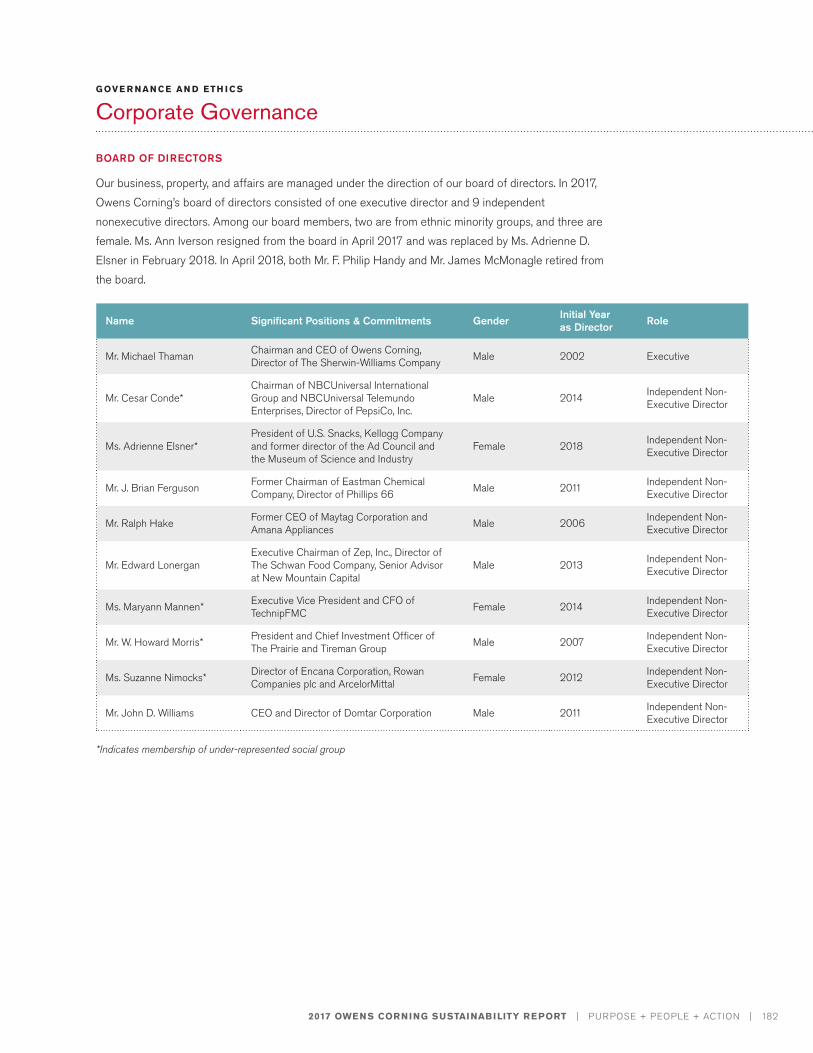
2017 OWENS CORNING SUSTAINABILITY REPORT | PURPOSE + PEOPLE + ACTION | 182
BOARD OF DIRECTORS
Our business, property, and affairs are managed under the direction of our board of directors. In 2017, Owens Corning’s board of directors consisted of one executive director and 9 independent nonexecutive directors. Among our board members, two are from ethnic minority groups, and three are female. Ms. Ann Iverson resigned from the board in April 2017 and was replaced by Ms. Adrienne D. Elsner in February 2018. In April 2018, both Mr. F. Philip Handy and Mr. James McMonagle retired from the board.
G OVE R NAN CE AN D ETH I CS
Corporate Governance
Name Significant Positions & Commitments Gender Initial Year as Director Role
Mr. Michael Thaman Chairman and CEO of Owens Corning, Director of The Sherwin-Williams Company Male 2002 Executive
Mr. Cesar Conde*Chairman of NBCUniversal International Group and NBCUniversal Telemundo Enterprises, Director of PepsiCo, Inc.
Male 2014 Independent Non-Executive Director
Ms. Adrienne Elsner*President of U.S. Snacks, Kellogg Company and former director of the Ad Council and the Museum of Science and Industry
Female 2018 Independent Non-Executive Director
Mr. J. Brian Ferguson Former Chairman of Eastman Chemical Company, Director of Phillips 66 Male 2011 Independent Non-
Executive Director
Mr. Ralph Hake Former CEO of Maytag Corporation and Amana Appliances Male 2006 Independent Non-
Executive Director
Mr. Edward LonerganExecutive Chairman of Zep, Inc., Director of The Schwan Food Company, Senior Advisor at New Mountain Capital
Male 2013 Independent Non-Executive Director
Ms. Maryann Mannen* Executive Vice President and CFO of TechnipFMC Female 2014 Independent Non-
Executive Director
Mr. W. Howard Morris* President and Chief Investment Officer of The Prairie and Tireman Group Male 2007 Independent Non-
Executive Director
Ms. Suzanne Nimocks* Director of Encana Corporation, Rowan Companies plc and ArcelorMittal Female 2012 Independent Non-
Executive Director
Mr. John D. Williams CEO and Director of Domtar Corporation Male 2011 Independent Non-Executive Director
*Indicates membership of under-represented social group
2017 OWENS CORNING SUSTAINABILITY REPORT | PURPOSE + PEOPLE + ACTION | 183
We understand that a strong, responsive, and independent board is necessary. All board members, other than our chairman and chief executive officer, are independent under all applicable legal, regulatory, and stock exchange requirements (“independent directors”). Seven board members have relevant experience in our GICS level 1 sector. Average tenure on the board is currently 7.2 years. For more information on individual board members and their competencies, please see the discussion under Director Qualifications, Skills, and Experience in our 2018 Proxy Statement.
Pursuant to our corporate governance guidelines, the board selects its chairperson based on collective judgment as to the candidate best suited to meet our company’s needs at a given time. Currently, Michael H. Thaman serves as Owens Corning’s chairman of the board, president, and chief executive officer (chairman and CEO). John D. Williams, a non-management director, serves as lead independent director of the board, with responsibility for presiding over all executive sessions of the board and of non-management directors. The board believes that this leadership structure is appropriate for Owens Corning considering our company’s governance structure, current needs, and business environment, as well as the unique talents, experiences, and attributes of the individuals in those roles.
During 2017, the board met six times. The average attendance rate of the meetings of the board and board committees on which he or she served was 99%. In addition, the board held five executive sessions (i.e., meetings of only non-management directors) in 2017. Our corporate governance guidelines require at least three executive sessions per year, at least one of which must include only independent directors.
Board Committees
The board has five committees:
1. Audit Committee
2. Compensation Committee
3. Governance and Nominating Committee
4. Executive Committee
5. Finance Committee
Read more about the committees of the board under the section Board and Committee Membership in our 2018 Proxy Statement or on the Owens Corning website.
Nomination and Selection of Qualified Board Members
The board of directors is responsible for nominating candidates for election to the board (by stockholders) and for filling vacancies that may occur between annual meetings of stockholders.
We have formal procedures for selecting and nominating potential board members. Pursuant to its charter, the governance and nominating committee is responsible for identifying, evaluating, and recommending board and board committee candidates to the full board. The committee evaluates potential candidates on an ongoing basis and is authorized to consider recommendations from current board members, outside search firms, and stockholders. The committee does not have a formal policy
G OVE R NAN CE AN D ETH I CS
Corporate Governance
PHOTO CREDIT:
Honggang Wang | Xi’an, China
“The bee on the blossoming flower” in Xi’an, Shanxi Province, China
2017 OWENS CORNING SUSTAINABILITY REPORT | PURPOSE + PEOPLE + ACTION | 184
with respect to the consideration of director candidates recommended by stockholders. However, its practice is to consider those candidates on the same basis and in the same manner as it considers recommendations from other sources. As outlined in our bylaws, each board member is elected individually and must receive a majority of votes.
The governance and nominating committee is authorized to recommend only those director candidates that meet our Director Qualification Standards. Nominees for director are selected based on, among other things: experience, knowledge, skills, expertise, mature judgment, acumen, character, integrity, diversity, ability to make independent analytical inquiries, understanding of the company’s business environment, and willingness to devote adequate time and effort to board responsibilities. All our current nonexecutive directors have fewer than four additional mandates to public boards, as required by our qualification standards.
The governance and nominating committee’s charter specifically requires consideration of diversity, which is regarded as a key lever for enhancing the board’s ability to manage and direct the affairs and business of our company. Pursuant to its charter, the governance and nominating committee is responsible for identifying and recommending director nominees consistent with the director qualification criteria described above, including diversity. Recent additions to the board demonstrate our commitment to diversity. As of April 2018, four of the last five directors to join the board were either female or ethnic minorities. The board now possesses 50% gender and ethnic diversity. This represents a nearly threefold increase in gender and ethnic diversity in the last six years, which stood at 17% as recently as 2012. The effectiveness of this process is assessed annually by the full board as part of the board self-evaluation process. The committee believes that its consideration of diversity effectively implements the charter requirements.
Director independence is another key criterion used by the committee for screening potential board candidates and committee members. Our board of directors has adopted director qualification standards with respect to the determination of director independence. These standards incorporate the independence requirements of the New York Stock Exchange corporate governance listing standards. The standards specify the criteria by which the independence of our directors will be determined, including strict guidelines for directors and their immediate families with respect to past employment or affiliation with our company or its independent registered public accounting firm. With the assistance of the governance and nominating committee, the board uses the director qualification standards to determine whether a director has a material relationship with the company other than as a director. For additional details, please see pages 19-20 of our 2018 Proxy Statement.
Board Education
Based on our company’s corporate governance guidelines, we provide new directors with a director orientation program to familiarize them with, among other things, our company’s business; strategic plans; significant financial, accounting, and risk management issues; compliance programs; conflict policies; code of business conduct and ethics; corporate governance guidelines; principal officers; internal auditors; and independent auditors. The orientation process for new directors is designed to make them knowledgeable about our company and includes briefings by the CEO and management.
G OVE R NAN CE AN D ETH I CS
Corporate Governance
2017 OWENS CORNING SUSTAINABILITY REPORT | PURPOSE + PEOPLE + ACTION | 185
After the orientation process, directors are expected to continue to learn about our business and business-related issues to ensure that they maintain the necessary expertise and competency to perform their responsibilities as directors. They continue their learning through conversations with our chief executive officer, chief financial officer, and other officers, by reviewing materials provided to them, by visiting our offices and plants, and by participating in educational programs administered by third parties.
Board and Committee Evaluation
Each year, the governance and nominating committee facilitates a process to evaluate the effectiveness of the board, its five committees, the chairman and CEO, and committee charters:
• The board conducts an evaluation of itself, including its effectiveness.
• The board evaluates the chairman/CEO on various aspects of his performance.
• The board evaluates the lead independent director.
• The committees evaluate themselves on topics such as whether each committee is complying with its charter requirements.
The board and its committees complete annual self-assessment questionnaires and have individual discussions with the lead independent director to evaluate effectiveness in several areas, including board composition, structure, and process. The completed questionnaires are submitted directly to a third-party law firm. The law firm summarizes the results, and the governance and nominating committee circulates the summarized results to all directors, with the exception of results related to evaluation of the chairman and CEO, which are sent only to the independent directors. Non-management directors discuss their feedback on the chairman and CEO with the lead independent director. The results of the chairman and CEO evaluation are discussed in an executive session of the non-management directors and are also factored into the compensation committee’s performance evaluation of the chairman and CEO.
CONFLICTS OF INTEREST
We take conflicts of interest, and the avoidance and management of conflicts of interest, very seriously. We have several written policies and procedures in place for avoiding, managing, and disclosing conflicts of interest by directors, officers, employees, and members of their immediate families.
Our Directors’ Code of Conduct states, among other things, that a director who has an actual or potential conflict of interest:
• Must disclose the existence and nature of such actual or potential conflict to the chairman of the board and the chairman of the governance and nominating committee; and
• May proceed with the transaction only after receiving approval from the governance and nominating committee.
In our annual proxy statement, we disclose transactions with related persons. For related party transactions that are subject to FASB Accounting Standards Codification (ASC) Topic 850, we comply with additional disclosure requirements. We also disclose all other conflicts of interest, such as the
G OVE R NAN CE AN D ETH I CS
Corporate Governance
2017 OWENS CORNING SUSTAINABILITY REPORT | PURPOSE + PEOPLE + ACTION | 186
existence of controlling shareholders, cross-board membership, and cross-sharing with suppliers and other stakeholders.
REMUNERATION POLICIES
Owens Corning continually monitors the evolution of compensation best practices, and reviews the relationship between company performance and compensation and the goals and targets we set. Individual goals and targets are designed to ensure Owens Corning as a whole meets its financial and environmental goals while operating as an ethical company.
Overall corporate governance compensation decisions are based on the core philosophy that compensation must align with and enhance long-term, sustainable growth for our stockholders. Approximately 80% of pay for executive officers is variable, contingent, and directly linked to individual and company performance. Generally, company performance is measured based on financial goals, and individual performance is measured based on objectives related to environment and safety, financial objectives, talent management, reputational risks, compliance and risk management, and other factors appropriate for the individual role. For a detailed discussion on executive compensation, including ways we apply internal and external financial success metrics and other metrics, please see the section on Executive Compensation in our 2018 Proxy Statement. Our proxy statement also includes details on potential termination payments and recoupment of compensation (clawback) paid to named executive officers.
CEO pay ratio is reported on page 54 of our 2018 Proxy Statement.
CONSULTATION WITH STAKEHOLDERS
To better understand our stakeholders’ expectations and priorities, we proactively engage and consult with individuals, groups, and organizations that are impacted by our business operations. As described more fully under Stakeholder Engagement and Material Issues and in our annual proxy statements, we rely on stakeholder guidance and direction to choose our business strategies and priorities, and to learn what’s working and what’s not. We reach out to stakeholders, and we invite them to communicate with us, on any and all economic, environmental, and social topics related to our business. The collective stakeholder input is crucial to the board’s fulfillment of its duties and responsibilities. It directly informs the board’s identification and management of economic, environmental, and social topics and their impacts, risks, and opportunities.
STAKEHOLDER COMMUNICATION
We also invite all our stockholders and other interested parties to communicate with our board on any critical concerns they might have about our business. Interested parties may communicate with the lead independent director or any other non-management director by sending an email to [email protected]. Our senior vice president and general counsel and/or the vice president, internal audit promptly reviews all such communications for evaluation and appropriate follow-up. A summary of all communications (other than “spam” or “junk” messages unrelated to the board’s duties and responsibilities) is reported to the non-management directors.
In addition, stakeholders and other interested parties may communicate with the VP and chief sustainability officer (CSO) via his email address, his assistant, the sustainability email address provided on our website, or telephone. All business-appropriate inquiries are handled by the VP
G OVE R NAN CE AN D ETH I CS
Corporate Governance
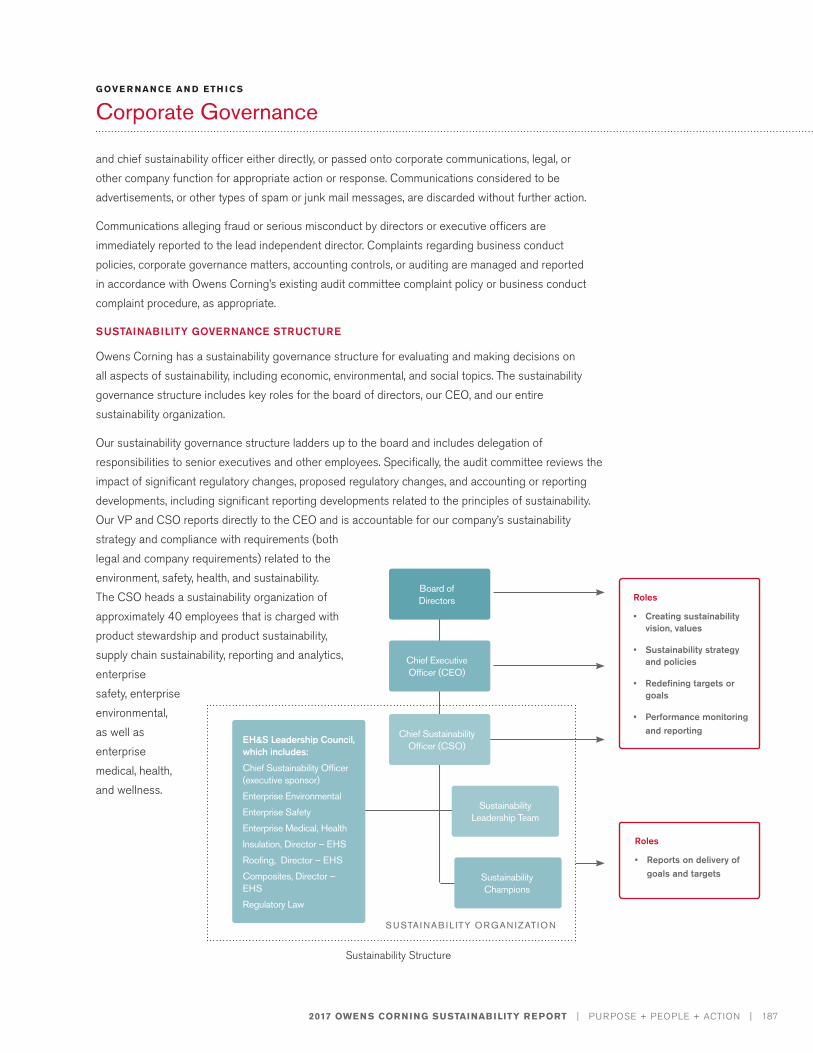
2017 OWENS CORNING SUSTAINABILITY REPORT | PURPOSE + PEOPLE + ACTION | 187
and chief sustainability officer either directly, or passed onto corporate communications, legal, or other company function for appropriate action or response. Communications considered to be advertisements, or other types of spam or junk mail messages, are discarded without further action.
Communications alleging fraud or serious misconduct by directors or executive officers are immediately reported to the lead independent director. Complaints regarding business conduct policies, corporate governance matters, accounting controls, or auditing are managed and reported in accordance with Owens Corning’s existing audit committee complaint policy or business conduct complaint procedure, as appropriate.
SUSTAINABILITY GOVERNANCE STRUCTURE
Owens Corning has a sustainability governance structure for evaluating and making decisions on all aspects of sustainability, including economic, environmental, and social topics. The sustainability governance structure includes key roles for the board of directors, our CEO, and our entire sustainability organization.
Our sustainability governance structure ladders up to the board and includes delegation of responsibilities to senior executives and other employees. Specifically, the audit committee reviews the impact of significant regulatory changes, proposed regulatory changes, and accounting or reporting developments, including significant reporting developments related to the principles of sustainability. Our VP and CSO reports directly to the CEO and is accountable for our company’s sustainability strategy and compliance with requirements (both legal and company requirements) related to the environment, safety, health, and sustainability. The CSO heads a sustainability organization of approximately 40 employees that is charged with product stewardship and product sustainability, supply chain sustainability, reporting and analytics, enterprise safety, enterprise environmental, as well as enterprise medical, health, and wellness.
G OVE R NAN CE AN D ETH I CS
Corporate Governance
Board of Directors
Chief Executive Officer (CEO)
Chief Sustainability Officer (CSO)
EH&S Leadership Council, which includes:
Chief Sustainability Officer (executive sponsor)
Enterprise Environmental
Enterprise Safety
Enterprise Medical, Health
Insulation, Director – EHS
Roofing, Director – EHS
Composites, Director – EHS
Regulatory Law
Sustainability Leadership Team
Roles
• Creating sustainability vision, values
• Sustainability strategy and policies
• Redefining targets or goals
• Performance monitoring and reporting
Roles
• Reports on delivery of goals and targetsSustainability
Champions
SUSTAI NAB I L ITY ORGAN IZATION
Sustainability Structure
2017 OWENS CORNING SUSTAINABILITY REPORT | PURPOSE + PEOPLE + ACTION | 188
We measure the success of our sustainability efforts on an ongoing basis. The sustainability leadership team holds regular meetings to review sustainability initiatives such as performance against metrics, debate current trends in the market, evaluate the transparency needs for our products, and understand increasing stakeholder expectations as it relates to our supply chain sustainability efforts. These reviews ensure we are focused on the programs that matter most to our stakeholders and to the world.
RISK OVERSIGHT AND MANAGEMENT FRAMEWORK
Optimal risk management and disclosure are high priorities for Owens Corning. We identify and manage risks through a robust framework that comprehensively scans risks across economic, environmental, and social domains. We pursue a forward-looking and holistic approach to enable business decisions, and take calculated risks to build long-term financial goals and shape a successful future.
The audit committee of the board has primary responsibility for facilitating board oversight and management of key risks and financial exposures. Pursuant to its charter, the audit committee’s responsibilities include:
• Reviewing annually, and receiving periodic updates on, our company’s identification of its key risks, major financial exposures, and related mitigation plans;
• Overseeing our company’s management of key risks and major financial exposures that fall within the specific purview of the audit committee;
• Ensuring that the board and its committees oversee our company’s management of key risks and major financial exposures within their respective purviews; and
• Evaluating periodically the effectiveness of the above-referenced process of oversight by the board and
its committees.
The compensation, finance, and governance and nominating committees of the board all review and evaluate risks associated with their respective areas. Each board committee provides reports concerning its respective risk management activities to the board, and the board considers and discusses such reports.
Owens Corning also has a risk committee that is responsible for overseeing and monitoring our company’s risk assessment and mitigation-related actions. The risk committee is not a board committee. It is a cross-functional corporate committee that includes members from the corporate audit, finance, legal, security, and treasury, and business functions. It is the internal mechanism for identifying risks and mitigation strategies, plus providing key updates to executive officers and the audit committee of the board.
The risk committee’s responsibilities and activities include the following:
• Reviewing the Owens Corning Risk Register developed by the business functions. Risks are prioritized based on their placement on a register that considers financial impact and probability of occurrence, as well as whether the level of exposure is acceptable, and if mitigation plans are actively in place or improved risk mitigation is needed.
G OVE R NAN CE AN D ETH I CS
Corporate Governance
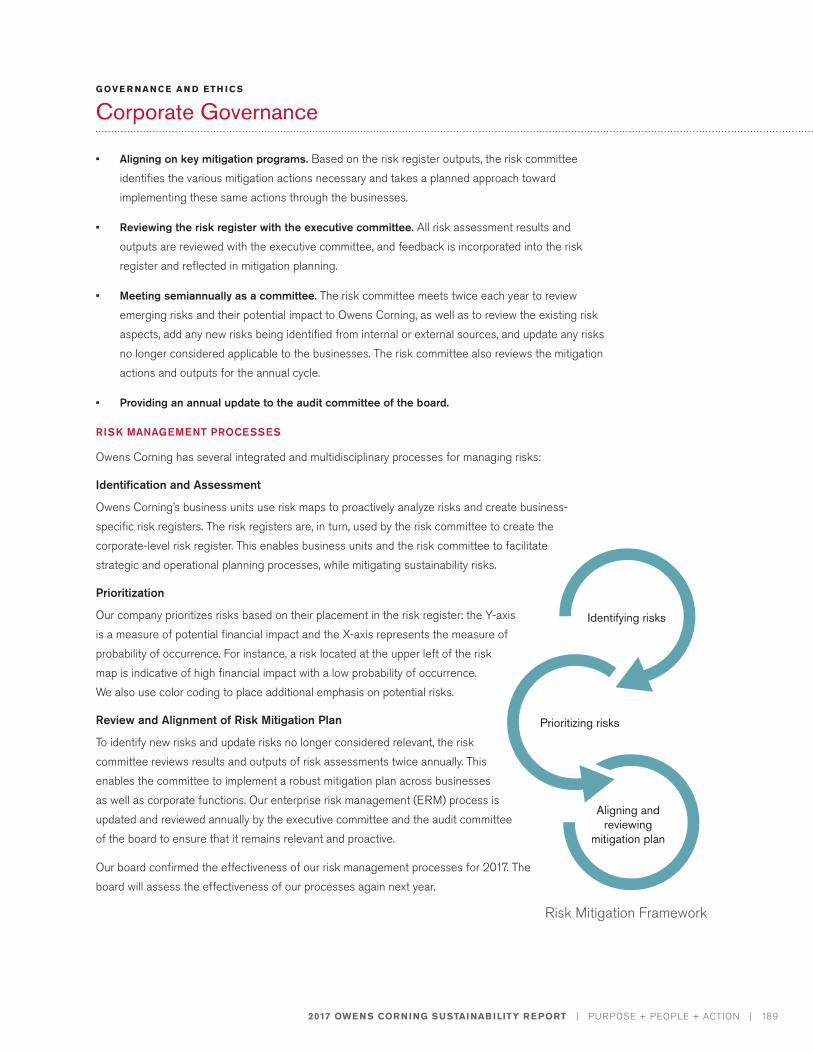
2017 OWENS CORNING SUSTAINABILITY REPORT | PURPOSE + PEOPLE + ACTION | 189
• Aligning on key mitigation programs. Based on the risk register outputs, the risk committee identifies the various mitigation actions necessary and takes a planned approach toward implementing these same actions through the businesses.
• Reviewing the risk register with the executive committee. All risk assessment results and outputs are reviewed with the executive committee, and feedback is incorporated into the risk register and reflected in mitigation planning.
• Meeting semiannually as a committee. The risk committee meets twice each year to review emerging risks and their potential impact to Owens Corning, as well as to review the existing risk aspects, add any new risks being identified from internal or external sources, and update any risks no longer considered applicable to the businesses. The risk committee also reviews the mitigation actions and outputs for the annual cycle.
• Providing an annual update to the audit committee of the board.
RISK MANAGEMENT PROCESSES
Owens Corning has several integrated and multidisciplinary processes for managing risks:
Identification and Assessment
Owens Corning’s business units use risk maps to proactively analyze risks and create business-specific risk registers. The risk registers are, in turn, used by the risk committee to create the corporate-level risk register. This enables business units and the risk committee to facilitate strategic and operational planning processes, while mitigating sustainability risks.
Prioritization
Our company prioritizes risks based on their placement in the risk register: the Y-axis is a measure of potential financial impact and the X-axis represents the measure of probability of occurrence. For instance, a risk located at the upper left of the risk map is indicative of high financial impact with a low probability of occurrence. We also use color coding to place additional emphasis on potential risks.
Review and Alignment of Risk Mitigation Plan
To identify new risks and update risks no longer considered relevant, the risk committee reviews results and outputs of risk assessments twice annually. This enables the committee to implement a robust mitigation plan across businesses as well as corporate functions. Our enterprise risk management (ERM) process is updated and reviewed annually by the executive committee and the audit committee of the board to ensure that it remains relevant and proactive.
Our board confirmed the effectiveness of our risk management processes for 2017. The board will assess the effectiveness of our processes again next year.
G OVE R NAN CE AN D ETH I CS
Corporate Governance
Identifying risks
Prioritizing risks
Aligning and reviewing
mitigation plan
Risk Mitigation Framework
2017 OWENS CORNING SUSTAINABILITY REPORT | PURPOSE + PEOPLE + ACTION | 190
SUMMARY OF KEY RISKS
Owens Corning is subject to many diverse risks, including cyber threats, loss of key facilities due to natural catastrophes, significant regulatory changes, competitive threats, supply chain and energy constraints, loss of key talent, theft of intellectual property, product liability, IT infrastructure failures, loss of a key customer, and global political risks.
Risks vary in terms of importance and likelihood. We use a correlation analysis to assess the likelihood of an event occurring within a specific time period and then develop strategic plans and prioritize accordingly. We apply this analysis to our key external business drivers such as housing starts, hurricane and other severe weather conditions, and aspects like wind-power growth rates. For example, correlation analysis has indicated that the insulation business is highly correlated to new home starts. Based on actual and forecasted home starts, the business builds its strategic plan and makes the appropriate tactical maneuvers to right-size capacity and the workforce. Additionally, energy, commodity, and foreign currency hedging programs are routinely evaluated to provide inputs to our correlation analysis.
For an in-depth discussion of our quantitative and qualitative risks and our approach for managing them, please see our 2017 Annual Report on Form 10-K, and for a discussion on our climate change risks, management of those risks, and related opportunities, please see our CDP Climate Change 2018 Report.
Some of the key risks that directly impact our operations include:
• Low levels of residential or commercial construction activity can have a material adverse impact on our business and results of operations.
• We face significant competition in the markets we serve and we may not be able to compete successfully.
• Our sales may fall rapidly in response to declines in demand because we do not operate under long-term volume agreements to supply our customers and because of customer concentration in certain segments.
• Worldwide economic conditions and credit tightening could have a material adverse impact on the Company.
• Our level of indebtedness could adversely impact our business, financial condition or results of operations.
• Adverse weather conditions and the level of severe storms could have a material adverse impact on our results of operations.
• Our operations require substantial capital, leading to high levels of fixed costs that will be incurred regardless of our level of business activity.
• We may be exposed to increases in costs of energy, materials and transportation or reductions in availability of materials and transportation, which could reduce our margins and have a material adverse impact on our business, financial condition and results of operations.
G OVE R NAN CE AN D ETH I CS
Corporate Governance
2017 OWENS CORNING SUSTAINABILITY REPORT | PURPOSE + PEOPLE + ACTION | 191
• Our results of operations in a given period may be impacted by price volatility in certain wind-generated energy markets in the United States
• We are subject to risks relating to our information technology systems, and any failure to adequately protect our critical information technology systems could materially affect our operations.
• We are subject to risks associated with our international operations.
• The Company’s income tax net operating loss and U.S. foreign tax credit carryforwards may be limited and our results of operations may be adversely impacted.
• Our intellectual property rights may not provide meaningful commercial protection for our products or brands and third parties may assert that we violate their intellectual property rights, which could adversely impact our business, financial condition and results of operations.
• Our hedging activities to address energy price fluctuations may not be successful in offsetting increases in those costs or may reduce or eliminate the benefits of any decreases in those costs.
• Downgrades of our credit ratings could adversely impact us.
• Increases in the cost of labor, union organizing activity, labor disputes and work stoppages at our facilities could delay or impede our production, reduce sales of our products and increase our costs.
• We could face potential product liability and warranty claims, we may not accurately estimate costs related to such claims, and we may not have sufficient insurance coverage available to cover such claims.
• We may be subject to liability under and may make substantial future expenditures to comply with environmental laws and regulations
• We will not be insured against all potential losses and could be seriously harmed by natural disasters, catastrophes or sabotage.
• We depend on our senior management team and other skilled and experienced personnel to operate our business effectively, and the loss of any of these individuals or the failure to attract additional personnel could adversely impact our financial condition and results of operations.
• We are subject to various legal and regulatory proceedings, including litigation in the ordinary course of business, and uninsured judgments or a rise in insurance premiums may adversely impact our business, financial condition and results of operations.
• If our efforts in acquiring and integrating other businesses, establishing joint ventures or expanding our production capacity are not successful, our business may not grow.
• Our ongoing efforts to increase productivity and reduce costs may not result in anticipated savings in operating costs.
• Significant changes in the factors and assumptions used to measure our defined benefit plan obligations, actual investment returns on pension assets and other factors could have a negative impact on our financial condition or liquidity.
• If we were required to write down all or part of our goodwill or other indefinite-lived intangible assets, our results of operations or financial condition could be materially adversely affected in a particular period.
G OVE R NAN CE AN D ETH I CS
Corporate Governance
2017 OWENS CORNING SUSTAINABILITY REPORT | PURPOSE + PEOPLE + ACTION | 192
Climate Change Risks
Climate change risks and opportunities are fundamentally driven by three factors: regulations, physical climate factors, and other climate-related variations. In the spirit of transparency, Owens Corning voluntarily discloses these risks in our CDP Climate Change 2017 Report. Our CDP Climate Change 2018 Report will be published in the third quarter on our sustainability website.
Freedom of Association and Collective Bargaining Risks
Owens Corning does not restrict worker’s rights to exercise freedom of association or collective bargaining in any of our operations. Our strategy is to engage all our employees individually and through elected third-party representatives where those are present. We demonstrate this approach through labor management meetings and contract negotiations, which are done throughout the year.
An independent trade union represents 64% of our employees, who are also covered by collective bargaining agreements. To support employees’ right to exercise freedom of association and collective bargaining, as of the end of 2017, we had 12 consultations/negotiations with trade unions over organizational changes, including restructuring and outsourcing.
Child Labor and Forced Labor Related Risks
Owens Corning’s human rights policy states Owens Corning does not and will not employ child labor or forced, slave, convict, or bonded labor. In addition, Owens Corning will not knowingly engage a supplier or distributor, or enter into a joint venture with an organization, that directly or indirectly, through a third party, employs child labor, forced labor, or persons who were trafficked into employment. Read more in Human Rights on pages 128-132.
For an in-depth discussion of our quantitative and qualitative risks and our approach to managing them, please see our 2017 Annual Report on Form 10-K.
For information on water risk’s please see our CDP Water 2017 Report; our CDP Water 2018 Report will be published in the third quarter on our sustainability website.
G OVE R NAN CE AN D ETH I CS
Corporate Governance
2017 OWENS CORNING SUSTAINABILITY REPORT | PURPOSE + PEOPLE + ACTION | 193
PHOTO CREDIT:
Nancy Zhu | Shanghai, China
Sang Qing mountain in Jiang Xi province, China
C onducting business ethically is both an opportunity and a responsibility of every employee. The high value that Owens Corning places on integrity is reflected in everything from the products we make, to the way we make them, and how we
interact with others. We preserve and enhance our reputation by acting with integrity and making ethical decisions, and by expecting the same from our business partners. Through our actions, we earn the trust of our suppliers, our customers, our co-workers, and our investors.
The Owens Corning Code of Conduct is a powerful mechanism for assuring a sustainable, respected company. Our code applies to every single person at Owens Corning, regardless of position or seniority. By living up to high standards and expectations, we show our stakeholders that we respect them, we respect Owens Corning, and we respect the value of ethical business conduct.
Also as part of our comprehensive corporate ethics program, we have specific policies that apply to our chief executive, senior financial officers, members of the board of directors, and other business conduct policies that apply to all employees on specific ethics topics and serve to support the code of conduct. The code of conduct and these policies can be found and reviewed in:
• Code of Conduct
• Ethics Policy for Chief Executive and Senior Financial Officers
• Directors’ Code of Conduct
• Equal Opportunity
• Nonharassment
• Human Rights Policy
G OVE R NAN CE AN D ETH I CS
Ethics
Our Ethics efforts align with the following UN SDG:
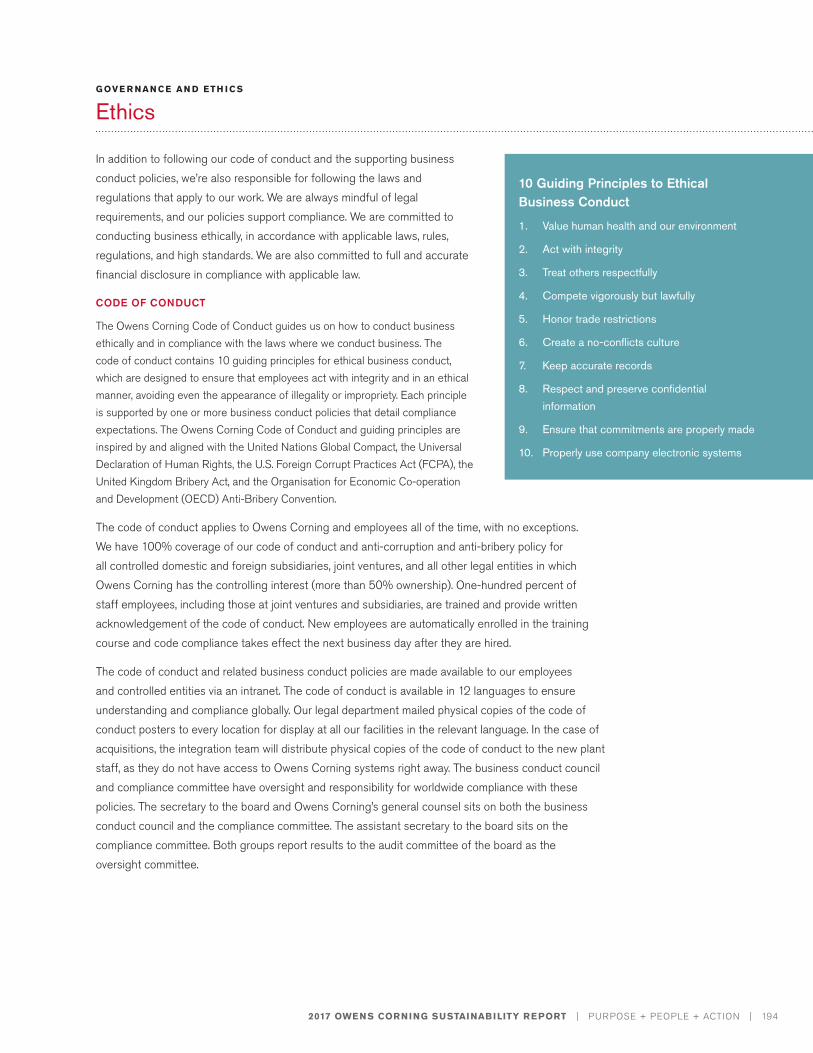
2017 OWENS CORNING SUSTAINABILITY REPORT | PURPOSE + PEOPLE + ACTION | 194
In addition to following our code of conduct and the supporting business conduct policies, we’re also responsible for following the laws and regulations that apply to our work. We are always mindful of legal requirements, and our policies support compliance. We are committed to conducting business ethically, in accordance with applicable laws, rules, regulations, and high standards. We are also committed to full and accurate financial disclosure in compliance with applicable law.
CODE OF CONDUCT
The Owens Corning Code of Conduct guides us on how to conduct business ethically and in compliance with the laws where we conduct business. The code of conduct contains 10 guiding principles for ethical business conduct, which are designed to ensure that employees act with integrity and in an ethical manner, avoiding even the appearance of illegality or impropriety. Each principle is supported by one or more business conduct policies that detail compliance expectations. The Owens Corning Code of Conduct and guiding principles are inspired by and aligned with the United Nations Global Compact, the Universal Declaration of Human Rights, the U.S. Foreign Corrupt Practices Act (FCPA), the United Kingdom Bribery Act, and the Organisation for Economic Co-operation and Development (OECD) Anti-Bribery Convention.
The code of conduct applies to Owens Corning and employees all of the time, with no exceptions. We have 100% coverage of our code of conduct and anti-corruption and anti-bribery policy for all controlled domestic and foreign subsidiaries, joint ventures, and all other legal entities in which Owens Corning has the controlling interest (more than 50% ownership). One-hundred percent of staff employees, including those at joint ventures and subsidiaries, are trained and provide written acknowledgement of the code of conduct. New employees are automatically enrolled in the training course and code compliance takes effect the next business day after they are hired.
The code of conduct and related business conduct policies are made available to our employees and controlled entities via an intranet. The code of conduct is available in 12 languages to ensure understanding and compliance globally. Our legal department mailed physical copies of the code of conduct posters to every location for display at all our facilities in the relevant language. In the case of acquisitions, the integration team will distribute physical copies of the code of conduct to the new plant staff, as they do not have access to Owens Corning systems right away. The business conduct council and compliance committee have oversight and responsibility for worldwide compliance with these policies. The secretary to the board and Owens Corning’s general counsel sits on both the business conduct council and the compliance committee. The assistant secretary to the board sits on the compliance committee. Both groups report results to the audit committee of the board as the oversight committee.
G OVE R NAN CE AN D ETH I CS
Ethics
10 Guiding Principles to Ethical Business Conduct
1. Value human health and our environment
2. Act with integrity
3. Treat others respectfully
4. Compete vigorously but lawfully
5. Honor trade restrictions
6. Create a no-conflicts culture
7. Keep accurate records
8. Respect and preserve confidential information
9. Ensure that commitments are properly made
10. Properly use company electronic systems
2017 OWENS CORNING SUSTAINABILITY REPORT | PURPOSE + PEOPLE + ACTION | 195
Areas covered by the code of conduct and business conduct policies include, but are not limited to:
• Corruption and bribery
• Discrimination
• Confidential information
• Data privacy
• Antitrust/anticompetitive practices
• Insider trading/dealing
• Environment, health, and safety
• Whistleblowing
In addition, the code of conduct includes expectations for integrity and business dealings including gifts and entertainment, business travel, computer use, and social media, as well as the use of company assets.
All staff employees are required to take an annual refresher training course on our code of conduct and business conduct policies. Following the course, staff employees globally are required to certify their compliance, and are expected to disclose any nonconformance or conflicts of interest that had not already been reported. In addition, managers are expected to lead by example to make sure all employees know and understand the code of conduct, other company policies, and applicable laws. In 2017, Owens Corning recorded approximately 6,200 hours of this training for our staff employees, which is approximately 27% of our total employee workforce, in addition to a variety of workshops and communication to employee groups globally.
The code of conduct is incorporated into the way all employees work every day, with customers, colleagues, suppliers, and the public. It is an extension of our corporate values, and 100% compliance is an expectation of employment at Owens Corning.
SENIOR OFFICER POLICIES
Owens Corning’s chief executive officer, chief financial officer, and corporate controller (together, “senior officers”) are held to additional legal and ethical standards. They not only must comply with applicable laws and other requirements, but must also proactively engage in and promote honest and ethical conduct, including, for example, the ethical handling of actual or apparent conflicts of interest between personal and professional relationships. These are specific corporate policies that apply to our senior officers:
• Ethics Policy for Senior Officers: Senior officers are bound by our ethics policy for senior officers, which sets forth policies to guide the performance of their duties as chief executive officer, chief financial officer, and corporate controller.
• Reporting on Violations: Senior officers are required to report any suspected legal and ethical violations to legal operations or corporate audit services or to any member of our business conduct council. We also maintain a confidential reporting system, the business conduct helpline at 1-800-461-9330, and other mechanisms for receiving advice and concerns from our employees, as described in more detail later in this section.
G OVE R NAN CE AN D ETH I CS
Ethics
2017 OWENS CORNING SUSTAINABILITY REPORT | PURPOSE + PEOPLE + ACTION | 196
• Conflicts of Interest: No senior officer shall make any investment, accept any position or benefits, participate in any transaction or business arrangement, or otherwise act in a manner that creates or appears to create a conflict of interest with the company, unless the senior officer makes full disclosure of the facts and circumstances to, and obtains the prior written approval of, the governance and nominating committee of the board of directors. Conflicts of interest requirements also apply to members of our board of directors.
DIRECTORS’ CODE OF CONDUCT
The directors’ code of conduct, adopted by the board, assists directors in fulfilling their duties to Owens Corning. The directors are entrusted with responsibility to oversee management of the business and affairs of Owens Corning. As the company’s policymakers, the directors set the standard of conduct for all directors, officers, and employees. Each director is required to use due care in the performance of his or her duties, be loyal to Owens Corning, and act in good faith and in a manner the director reasonably believes to be in or not opposed to the best interests of our company.
Based on the directors’ code of conduct, a director should:
• Use reasonable efforts to attend board and committee meetings regularly;
• Dedicate sufficient time, energy, and attention to Owens Corning to ensure diligent performance of his or her duties, including preparing for meetings and decision-making by reviewing in advance any materials distributed and making reasonable inquiries;
• Be aware of and seek to fulfill his or her duties and responsibilities as set forth in our company’s certificate of incorporation, bylaws, and corporate governance guidelines; and
• Seek to comply with all applicable laws, regulations, confidentiality obligations, and corporate policies.
Read more in the Owens Corning Directors’ Code of Conduct.
FULL AND ACCURATE PUBLIC DISCLOSURES
It is Owens Corning’s policy to make full, fair, accurate, timely, and understandable disclosure, in compliance with all applicable laws, rules, and regulations, in all reports and documents that the company files with, or submits or furnishes to, the U.S. Securities and Exchange Commission (SEC) and in all other public communications made by Owens Corning.
EQUAL OPPORTUNITY AND NONDISCRIMINATION
Owens Corning seeks to maintain a highly productive organization of individuals representing differences in viewpoints, cultures, races, and gender, and embracing good ideas produced by that diversity. To provide equal employment and advancement opportunities to all individuals, employment decisions are based solely on merit, qualifications, and abilities. Accordingly, it is Owens Corning’s policy to provide employment opportunities without regard to race, color, religion, national origin, age, disability, veteran or military status, pregnancy status, gender, gender identity, sexual orientation, genetic information, or any other characteristic protected by applicable law. Owens Corning will not tolerate acts of discrimination, including harassment.
G OVE R NAN CE AN D ETH I CS
Ethics
2017 OWENS CORNING SUSTAINABILITY REPORT | PURPOSE + PEOPLE + ACTION | 197
Business Conduct Process and Internal Investigation Process
Every year, Owens Corning reviews and publishes its code of conduct to perpetuate fair and ethical conduct. All new employees receive the code of conduct upon joining the company. Further, all salaried employees must annually certify that they have reviewed and understand the code of conduct.
As part of the Owens Corning’s compliance programs and code of conduct, the company makes robust use of an open reporting process, through which employees may report a concern of a suspected policy or legal violation to any manager, human resources representative, or member of the business conduct council or legal department or by in writing to the office of the general counsel or to the ethical complaints email address. Employees may also report their concerns anonymously by either calling or submitting an online form to the 24/7 confidential business conduct helpline, which is operated by an independent third-party vendor. Owens Corning takes all reports of misconduct seriously. Once a concern is brought to the company’s attention, it is thoroughly reviewed and investigated by the Owens Corning business conduct council, a global team accountable for the management and oversight of the company’s internal investigations protocol and escalation of concerns to the audit committee of the board of directors, where appropriate. Owens Corning makes every effort to ensure that investigations are consistent, comprehensive, and confidential to the extent possible, and follow applicable laws. If a report is substantiated, the company will respond as it deems appropriate or necessary, consistent with the law, and will act swiftly to correct the problem and deter future occurrences. Depending on the circumstances, this may include training and/or disciplinary action up to, and including, termination. Individuals may also be subject to civil or criminal prosecution for violating the law.
All employees are encouraged to report suspicions of violations of the law or policy and are expected to cooperate in any investigation of wrongdoing. Owens Corning has a strict nonretaliation policy. No hardship, loss of benefits, nor penalty may be imposed on an employee as punishment for filing a good-faith complaint of discrimination or responding to a complaint of discrimination, appearing as a witness in the investigation of a complaint, serving as an investigator, or otherwise cooperating in a workplace investigation. Retaliation or attempted retaliation is a violation of company policy and anyone who engages in retaliation may be subject to discipline. This expectation is reinforced with senior business and HR leadership during a quarterly compliance review.
Internal investigations are reviewed for trends and opportunities on at least a quarterly basis and further discussed with senior business leaders. A periodic report is provided to the audit committee of the board of directors along with an update of the compliance program in general. Annually, the general counsel and chief compliance officer report significant highlights from the open reporting process to all employees attending a town hall hosted by the CEO, including the number of reported concerns received, the percentage of anonymous reports, and the percentage of reports that resulted in termination.
In 2017, the majority of reported complaints reviewed were employee-related matters and a smaller number of business integrity reports. Fewer than 25% of the reports resulted in substantiated policy violations, but even if not substantiated, the remaining reports presented opportunities for improvement in management systems. Identified trends led to enterprise level changes including policy updates, training, and communication.
G OVE R NAN CE AN D ETH I CS
Ethics
2017 OWENS CORNING SUSTAINABILITY REPORT | PURPOSE + PEOPLE + ACTION | 198
SEEKING AND ADDRESSING ADVICE, CONCERNS, AND COMPLAINTS REGARDING
MISCONDUCT
In addition to making sure that all employees know and understand our code of conduct, other company policies, and applicable laws, we invite employees to provide input and report concerns and complaints regarding ethical and lawful business conduct.
An employee who would like to report his or her concerns and seeks guidance can follow one of the below measures:
1. Talk to a manager, leader, or another manager he or she trusts
2. Talk to a human resources representative or any human resources director
3. Talk to any member of the business conduct council or member of legal operations
4. Write an email to: [email protected]
5. Call the confidential business conduct helpline at 1-800-461-9330 (or the local number in their country)
6. Submit their concern online at http://helpline.owenscorning.com
7. Write a letter to:
Owens Corning Ethical Business Complaints
Office of the General Counsel 2-29
One Owens Corning Parkway, Toledo, OH 43659
All breaches of our business conduct policies are reported to the audit committee of the board of directors. Employees are disciplined up to and including pursuing criminal charges. We also disclose any breach as applicable by law. After extensive reviews, we have found no record of any fair competition breaches in our company’s history. We have also had no legal actions for anti-competitive behavior or monopoly practices.
EQUAL OPPORTUNITY AND NONDISCRIMINATION
Owens Corning seeks to maintain a highly productive organization of individuals representing differences in viewpoints, cultures, races, and gender, and embracing good ideas produced by that diversity. To provide equal employment and advancement opportunities to all individuals, employment decisions are based solely on merit, qualifications, and abilities. Accordingly, it is Owens Corning’s policy to provide employment opportunities without regard to race, color, religion, national origin, age, disability, veteran or military status, pregnancy status, gender, gender identity, sexual orientation, genetic information, or any other characteristic protected by applicable law. Owens Corning will not tolerate acts of discrimination, including harassment.
In 2017, the business conduct council reviewed and investigated three equal opportunity complaints, none of which were found to violate the law.
G OVE R NAN CE AN D ETH I CS
Ethics
2017 OWENS CORNING SUSTAINABILITY REPORT | PURPOSE + PEOPLE + ACTION | 199
Child or Forced Labor
Owens Corning does not and will not employ child or forced labor. In addition, Owens Corning will not knowingly engage a supplier or distributor, or enter into a joint venture with an organization that employs or subcontracts child or forced labor. Owens Corning defines “child labor” as work or service extracted from anyone under the age of 16, and defines “forced labor” as any work or service not voluntarily performed and extracted from an individual under threat of force.
Industrial Relations
Owens Corning makes use of a variety of formal and informal processes to address and resolve labor practices at each facility. All labor practice concerns raised by employees are resolved, typically through a peer review or grievance process at the local level. Occasionally, local grievances require additional input at the divisional or corporate level, and if still not resolved, are definitively decided by a neutral arbitrator. Although the company does not compile the number of grievances or complaints filed by employees/unions at each plant each year, it is not unusual for each facility to resolve dozens of such labor concerns each year. In 2017, fewer than five total labor concerns across Owens Corning required the use of an arbitrator to reach a final disposition (i.e., grievance withdrawn, granted, or settled).
In the unfortunate circumstance that one of the above mechanisms of resolution is unsuccessful, an employee may choose to proceed with legal action or file a complaint with a local agency. These are handled through Owens Corning’s legal department following the same guidelines of investigation, remediation, and non-retaliation policies discussed above.
Read more in the Owens Corning Equal Opportunity Policy.
NONHARASSMENT
It is Owens Corning’s intent that all employees will work in an environment free from harassment on any basis including, but not limited to, harassment based on race, color, sex, age, national origin, veteran or military status, pregnancy status, sexual orientation, gender identity, cultural affiliation, religion, genetic information, physical or mental disability, personal characteristics or circumstances, or any other characteristic protected by applicable law.
Employees at all locations worldwide and at all levels of our company have the responsibility to avoid any act or actions, implied or explicit, that may suggest any form of harassment of any other person within the workplace or in a work setting. This includes contractors, vendors, consultants, customers, and other nonemployees, such as visitors, who have reason to be engaged in business with Owens Corning. Our company actively investigates any allegation of harassment, evaluates the conduct and the context of the alleged behavior, and takes appropriate action.
Read more in the Owens Corning Nonharassment Policy.
ANTI-CORRUPTION
Corruption risks are assessed at the corporate level, and the audit committee has oversight of the anti-corruption policy through the code of conduct. Corruption is recognized as a risk on Owens Corning’s enterprise and compliance risk registers. The Owens Corning compliance team completes a
G OVE R NAN CE AN D ETH I CS
Ethics
2017 OWENS CORNING SUSTAINABILITY REPORT | PURPOSE + PEOPLE + ACTION | 200
compliance risk assessment annually on 100% of our operations, including those in high-risk countries (as defined by Transparency International), for risks related to corruption. A ranking is given to each area of compliance risk and plotted on a 9-box risk register. Any topic where the risk is not deemed acceptable has a remedial action plan prepared and assigned to a subject matter expert.
Through the compliance risk assessment, high-risk areas are identified by business, geography, etc. Mitigation plans are developed as applicable. The compliance team regularly partners with internal audit to monitor corruption and bribery risks. Whistleblower hotlines and reporting avenues are available to all employees and are posted at every facility. A systematic risk assessment and mitigation process is conducted for all business expansions.
All 12 Board members and 100% of our employees have received communication on our anti-corruption policies and procedures. In addition, 27%, or 4,724 employees, have received training on anti-corruption. For information on board member training on anti-corruption, see the Board Education section of Corporate Governance.
Owens Corning received no fines, penalties, or settlements in relation to corruption in 2017. Furthermore, no employees were disciplined or dismissed due to noncompliance with anti-corruption policies in 2017.
All our business partners receive communication on our supplier code of conduct in many forms including the supplier portal, purchase order terms, our assessment, as well as direct communication with commodity leaders. Our supplier code of conduct includes requirements on human rights, labor, environmental, anti-corruption, and trade and customs.
POLITICAL CONTRIBUTIONS
Owens Corning makes political contributions through our Owens Corning Better Government Fund. The fund is a voluntary, nonprofit, unincorporated committee operating as a separate, segregated fund of Owens Corning.
The purpose of the fund is to provide our employees and shareholders with an opportunity to take part in the American political process. The fund provides a convenient way for these stakeholders to join a program of political giving so that they may have a united and constructive voice for better government. The fund prohibits direct or indirect contributions from Owens Corning or any other corporation or political action committee.
In 2017, the Owens Corning Better Government Fund contributed approximately $67,000 toward political candidates and organizations. As such, Owens Corning has contributed no corporate funds or dollars to any political institution.
Additional information on the Better Government Fund’s contributions can be found at www.fec.gov.
G OVE R NAN CE AN D ETH I CS
Ethics
PHOTO CREDIT:
Andrew Thornburg | Joplin, Missouri, U.S.
"Backyard Fun" in the Midwest U.S.
8About the Report
2017 OWENS CORNING SUSTAINABILITY REPORT | PURPOSE + PEOPLE + ACTION | 202
About the Report
PHOTO CREDIT:
Don Wise | Granville, Ohio, U.S.
"American icon,” the bald eagle, at Highbanks Metro Park in Columbus, Ohio, U.S.
T his is Owens Corning’s 12th year of publishing an annual sustainability report, and this report reflects the reporting period January 1, 2017 to December 31, 2017. This report was published in May 2018, with our previous sustainability report published
in June 2017. We appreciate the opportunity to share this report with you to explain our deep commitment to, and involvement in, the social, environmental, supply chain, product sustainability, and economic sectors that our company influences.
This report was prepared in accordance with the GRI Standards: Comprehensive option. Additionally, this report is designed to address disclosures and material issues related to CDP, Dow Jones Sustainability Index, United Nations Sustainable Development Goals, and other stakeholders’ requests. This approach enables us to provide an integrated, comprehensive view of our sustainability and social responsibility commitments, progress, and activities.
We are focused on creating robust business and reporting strategies that align effectively with the needs and priorities of our company and stakeholders. We do this by investing substantial time and effort in understanding, prioritizing, and addressing material topics, as well as reporting on them effectively. As such, our materiality matrix was carefully developed to take into consideration different stakeholder needs and our involvement with impacts of material topics. To stay in lock-step with the changing business context, stakeholder requirements, and emerging trends, we regularly review and update our list of material topics and their relative priority. For a list of our material topics and our materiality matrix, plus a discussion of our ongoing stakeholder engagement, please see pages 18-24.
SCOPE AND BOUNDARIES
For this report, we developed the content and determined the boundaries of material topics based on where the impacts (on the economy, environment, and/or society) for each material topic occur. We are reporting on: 1) ways that we have caused or contributed to impacts for
2017 OWENS CORNING SUSTAINABILITY REPORT | PURPOSE + PEOPLE + ACTION | 203
About the Report
material topics, and 2) ways that our activities, products, and services are directly linked to these impacts through our business relationships. This includes business relationships with entities that we do not control and might not have leverage to effect change in their impacts.
In summary, the boundary of all these aspects covers our entire global operations including Asia Pacific, Europe, Latin America, Canada, and United States. Internal boundary includes all Owens Corning plants and offices that are owned and leased. External boundary includes supplier locations, communities, and customer locations where Owens Corning has control.
Significant Changes in Scope
In 2017, we acquired Pittsburgh Corning, adding six locations (five manufacturing and one office) to our Insulation business. In accordance with protocol, we collected or estimated their utility and production data back to our base year of 2010 or the year they opened. All six locations are included in the environmental baseline and metrics provided in this report. Social and economic metrics are set from 2017 forward. This change in scope is applicable across all material topics addressed in our report. The boundaries of our material topics have not otherwise changed.
There have been no material restatements of information provided in this report.
PRECAUTIONARY APPROACH AND ALIGNMENT WITH OTHER UN INITIATIVES
Owens Corning has been a signatory to the United Nations Global Compact since 2010. The UN Global Compact is a strategic, voluntary policy initiative for businesses that are committed to aligning their operations and strategies with 10 universally accepted principles in the areas of human rights, labor, environment, and anti-corruption. By doing so, business, as a primary driver of globalization, can help ensure that markets, commerce, technology, and finance advance in ways that benefit economies and societies everywhere.
Principle 7 of the UN Global Compact states that “businesses should support a precautionary approach to environmental challenges.” The Precautionary Principle or approach was originally introduced by the United Nations in the 1992 Rio Declaration of Environment and Development. Principle 15 of the Rio Declaration explains that “where there are threats of serious or irreversible damage, lack of full scientific certainty shall not be used as a reason for postponing cost-effective measures to prevent environmental degradation.” The precautionary approach calls upon us to diligently assess and manage environmental, health, and safety risks, so that we take appropriate actions to prevent harm. We ensure that our products and technology comply with or exceed all applicable laws, regulations, and approval standards to protect the environment and human life and health. In addition, our product stewardship programs are designed to ensure the integrity of our products and the processes used to develop, produce, and manage them. Owens Corning is confident that these efforts are consistent with and meet the expectations of the precautionary approach. Read more in our Product Stewardship Policy.
As shown throughout this report, we align our activities with the UN’s 17 Sustainable Development Goals (SDGs).
In addition, Owens Corning publicly states our support for the UN Universal Declaration of Human Rights. The creation of the 30 articles in 1948, which make up the Universal Declaration, was a
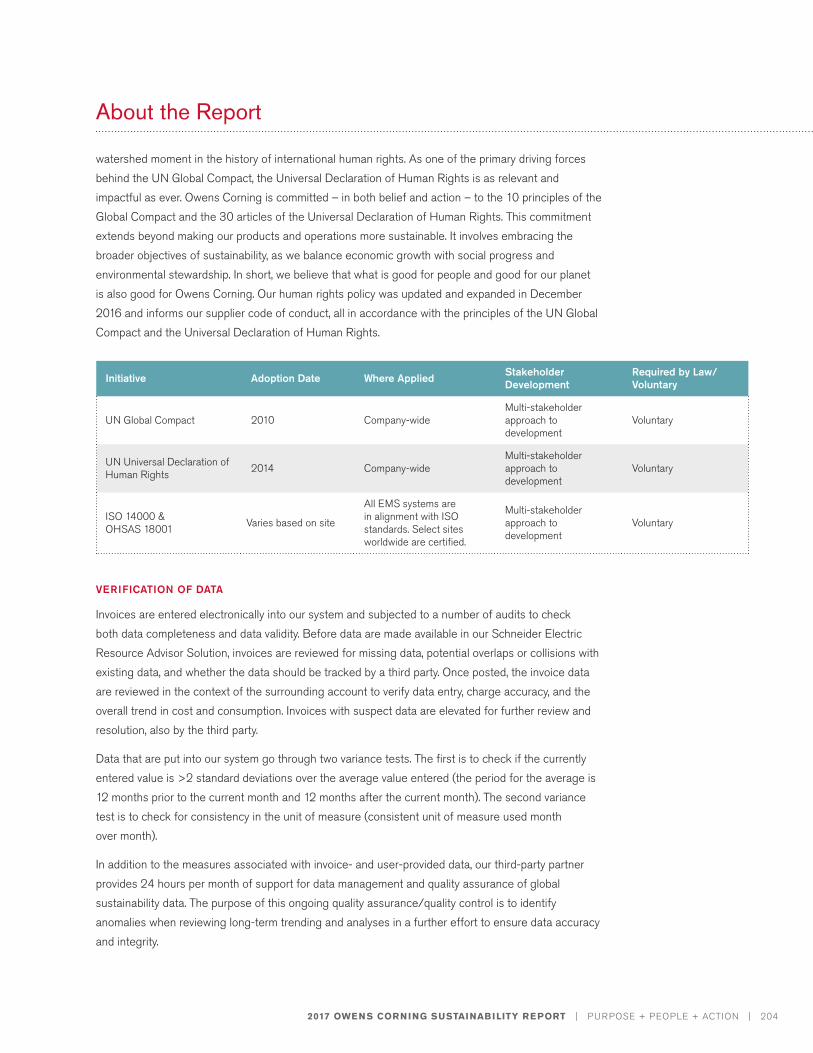
2017 OWENS CORNING SUSTAINABILITY REPORT | PURPOSE + PEOPLE + ACTION | 204
About the Report
watershed moment in the history of international human rights. As one of the primary driving forces behind the UN Global Compact, the Universal Declaration of Human Rights is as relevant and impactful as ever. Owens Corning is committed – in both belief and action – to the 10 principles of the Global Compact and the 30 articles of the Universal Declaration of Human Rights. This commitment extends beyond making our products and operations more sustainable. It involves embracing the broader objectives of sustainability, as we balance economic growth with social progress and environmental stewardship. In short, we believe that what is good for people and good for our planet is also good for Owens Corning. Our human rights policy was updated and expanded in December 2016 and informs our supplier code of conduct, all in accordance with the principles of the UN Global Compact and the Universal Declaration of Human Rights.
VERIFICATION OF DATA
Invoices are entered electronically into our system and subjected to a number of audits to check both data completeness and data validity. Before data are made available in our Schneider Electric Resource Advisor Solution, invoices are reviewed for missing data, potential overlaps or collisions with existing data, and whether the data should be tracked by a third party. Once posted, the invoice data are reviewed in the context of the surrounding account to verify data entry, charge accuracy, and the overall trend in cost and consumption. Invoices with suspect data are elevated for further review and resolution, also by the third party.
Data that are put into our system go through two variance tests. The first is to check if the currently entered value is >2 standard deviations over the average value entered (the period for the average is 12 months prior to the current month and 12 months after the current month). The second variance test is to check for consistency in the unit of measure (consistent unit of measure used month over month).
In addition to the measures associated with invoice- and user-provided data, our third-party partner provides 24 hours per month of support for data management and quality assurance of global sustainability data. The purpose of this ongoing quality assurance/quality control is to identify anomalies when reviewing long-term trending and analyses in a further effort to ensure data accuracy and integrity.
Initiative Adoption Date Where Applied Stakeholder Development
Required by Law/Voluntary
UN Global Compact 2010 Company-wideMulti-stakeholder approach to development
Voluntary
UN Universal Declaration of Human Rights 2014 Company-wide
Multi-stakeholder approach to development
Voluntary
ISO 14000 & OHSAS 18001 Varies based on site
All EMS systems are in alignment with ISO standards. Select sites worldwide are certified.
Multi-stakeholder approach to development
Voluntary
2017 OWENS CORNING SUSTAINABILITY REPORT | PURPOSE + PEOPLE + ACTION | 205
About the Report
These boundaries are applicable to all GRI Standards topics, including:
• General Disclosures
• Management Approach
• Economic
• Environmental
• Social
EXTERNAL ASSURANCE
Owens Corning understands the importance of transparency in disclosure on all its matrices, KPIs and mechanisms of assurance to enhance the reliability of reported data. As we move forward, we will externally assure additional topics, prioritizing based on availability of data and importance to stakeholders as observed through our materiality assessment.
SCS Global Services performed the assurance of the Owens Corning 2017 Sustainability Report against the AA1000 Assurance Standard (2008). In addition, SCS Global Services evaluated the Report against the Global Reporting Initiative’s (GRI) Standards for reporting. Specific performance data were assessed utilizing internationally recognized standards including:
• ISAE 3000 (Revised), Assurance Engagements Other than Audits or Reviews of Historical Financial Information
• World Resources Institute’s Greenhouse Gas Protocol: A Corporate Accounting and Reporting Standard (Revised Edition), March 2004 along with Scope 2 and Scope 3 Guidance
• ISO 14064-3:2006 Specification with guidance for the validation and verification of GHG assertions
To view the assurance statement, please see pages 230-232.
For additional information on the economic and social metrics verified through SCS Global Services, see: https://www.owenscorning.com/corporate/sustainability/docs/2018/OwensCorning_2017AdditionalSocialMetrics.pdf
QUESTIONS ABOUT THE REPORT
Any questions regarding our reporting processes or this report can be directed to our chief sustainability officer:
Mr. Frank O’Brien-Bernini
Vice President and Chief Sustainability Officer Phone: 1.419.248.8000 Email: [email protected]
PHOTO CREDIT:
Charles White | Guelph, Ontario, Canada
"African Dragon Fly" in Madikwe Game Reserve in South Africa
AppendicesAPPENDIX A - AWARDS
APPENDIX B - SUPPLEMENTAL DATA
APPENDIX C - PARTNERSHIPS AND COLLABORATIONS
APPENDIX D - ASSURANCE AND VER IF ICATION
2017 OWENS CORNING SUSTAINABILITY REPORT | PURPOSE + PEOPLE + ACTION | 207
APPE N D I X
Appendix A
AWARDS AND DISTINCTIONS
January 2017
• Recognized as one of the world’s most sustainable companies for the fourth consecutive year by sustainability investment specialist RobecoSAM. Owens Corning’s score – within 1% of the top score globally – earned it the "Gold Class” distinction. The company was also named an “Industry Mover” by RobecoSAM.
February 2017
• Received asthma & allergy friendly® certification for its Pure Safety™ high performance insulation – the building products industry’s first product to earn the asthma & allergy friendly® certification from the Asthma and Allergy Foundation of America (AAFA). Pure Safety™ insulation has up to 65% less dust than comparable insulation and is mold and mildew resistant.
March 2017
• Ranked 350 among 500 on Forbes’ list of America’s Best Employers.
April 2017
• Appeared on Corporate Responsibility Magazine’s annual 100 Best Corporate Citizens list for the third consecutive year, moving up from 43 to 25.
• Announced plans to introduce formaldehyde-free Thermafiber® light density mineral wool insulation solutions during the American Institute of Architects (AIA) Conference on Architecture 2017 in Orlando, Florida. As the first formaldehyde-free mineral wool insulation in North America, Thermafiber® mineral wool insulation solutions represent a breakthrough for architects, specifiers, and contractors interested in achieving green building standards.
June 2017
• Listed on the Fortune 500® list for the 63rd consecutive year.
• Ranked second among large organizations on IDG’s Computerworld list of the “2017 Best Places to Work in IT,” an annual ranking of the top 100 work environments for information technology professionals.
July 2017
• Named one of eight companies as an Eco-Leader by Green Builder Media, an annual selection of companies that actively pursue sustainability initiatives and community leadership roles.
September 2017
• Earned placement for the eighth year in a row in the Dow Jones Sustainability World Index (DJSI World) for its sustainability performance. For the fifth straight year, named the Industry Leader for the DJSI World Building Products group.
October 2017
• Ranked on Vault’s list of Best 50 Internships, a national assessment of the top internship programs, moving up from 44 to 21.
November 2017
• Earned the SAFETY Act Designation from the U.S. Department of Homeland Security for several Thermafiber® mineral wool insulation products and their supporting design and installation services. Use of these products and services will provide building professionals with liability protection in the event of an act of terrorism on their structure.
• Received independent certification for three types of commercial and residential insulation as made with renewable energy, which are available for specification and purchase. These products are the first to have met the requirements of SCS Global Services’ certification protocol to validate electricity used to make them is 100% wind powered, which, in turn, reduces their carbon footprint.
December 2017
• Received a perfect score of 100% on the Corporate Equality Index (CEI), a national benchmarking survey and report on corporate policies and practices related to lesbian, gay, bisexual, and transgender (LGBT) workplace equality, administered by the Human Rights Campaign Foundation.
• Named one of 25 global companies on CDP’s “A List” for both climate and water. This achievement recognizes actions completed in 2016 to manage environmental risks, cut carbon emissions, and enhance water stewardship.
• Recognized on the CDP Supply Chain “A list,” which recognizes companies from around the world as leaders in their efforts and actions to manage carbon emissions and address climate- related issues.
• Ranked 82 on The Wall Street Journal’s inaugural Management Top 250 list. The WSJ Management Top 250, as ranked by the Drucker Institute, is based on corporate effectiveness, defined as "doing the right things well." The measure assesses how well a company follows a core set of principles.
• Announced a commitment to donate insulation and roofing products for 10 homes to be built by the Gary Sinise Foundation’s R.I.S.E. program (Restoring Independence Supporting Empowerment). The program provides fully customized, specially adapted smart homes to ease the everyday burdens of severely wounded veterans and their families and caregivers.
2017 OWENS CORNING SUSTAINABILITY REPORT | PURPOSE + PEOPLE + ACTION | 208
APPE N D I X
Appendix A
2017 OWENS CORNING AWARDS
Our employees make the difference at Owens Corning and we’re proud to celebrate their accomplishments through several award recognitions in four key areas – innovation, environment, talent, and safety. These awards are available to all Owens Corning employees and celebrate those who go above and beyond to make a significant impact on our business, people, and the world.
2017 INNOVATION AWARDS
Innovation and innovative thinking are essential to our continued success. We look to foster a culture where employees are encouraged to think “outside the box,” and we’re proud to celebrate teams, individuals, and projects that exemplified innovation at Owens Corning in 2017. Many of these projects involve people from several different facilities around the world.
SLAYTER AWARDS
There were three key people associated with the invention of “commercial” glass fibers that launched our company – Games Slayter, Jack Thomas, and Dale Kleist. Slayter was subsequently dubbed the “Father of Fiberglas,” went on to become the first vice president of research and development in 1938, and the Granville site was dedicated to him in 1961. Slayter, Thomas, and Kleist were all inducted into the National Inventors Hall of Fame in 2006.
In 2017, 10 project teams received Slayter Awards:
New Product Innovation
Product launched after Jan. 1, 2015, that has clearly added differentiated value to Owens Corning customers, as defined by them.
Bending the Curve | Carl Baca, Richelle Delia, Chris Kasprzak, Dan Mills, Tyler Musick
This cross-functional team helped customers and contractors understand the value of synthetic roofing
underlayments versus felt paper. By “thinking like the customer” and understanding what homeowners and
contractors want, the team was able to best illustrate the benefits of synthetic underlayments for contractors. Their
work helped drive the market conversion rate to synthetics from 3% to 10% in 2017.
Special Achievement Categories:
Advancing Fundamental Science
Major contribution based on deep scientific or technical work that drives significant learning for the company.
Self-Adhered Underlayments | Tracey Hall, Patrick Haller, Dave Ploense, Scott Schweiger, Jon Verhoff
This team helped develop a more in-depth understanding of the technology and science behind self-adhered
underlayments. By conducting in-depth product research, developing test methods, and working to investigate,
understand, and improve performance attributes, the self-adhered underlayments team was able to enhance and
launch products quickly. Their work also established critical capabilities and knowledge for this industry-leading
technology.
2017 OWENS CORNING SUSTAINABILITY REPORT | PURPOSE + PEOPLE + ACTION | 209
APPE N D I X
Appendix A
Unlocking Capacity | Frank Macdonald, Dave Purvis, Jordan Sloan
Since 2015, Owens Corning has been dependent on strategic supply alliances to meet customers’ multi-end roving
(MER) orders. This team knew they could unlock significant MER capacity from company assets if technology
existed to increase output while maintaining product quality. The result of their work was a game-changing
manufacturing process and a standardized global platform that creates supply flexibility.
Choice to Try
Big ideas, though not commercialized, significantly advanced learning inside Owens Corning and better positioned the company for the future.
Top Coat Control Project | Dave Aschenbeck, Ben Barszcz, Geoff Bergman, Robert Bobbitt, Sanjay Mansukhani
Team members hypothesized that better control of the top coat of asphalt during the shingle manufacturing
process would improve product performance and reduce Owens Corning’s manufacturing cost. The team
discovered a sensor capable of measuring top coat thickness during manufacture, which enabled them to control
the process as they expected. While the initial problem was not solved by this work, the knowledge gained through
the experiments was valuable and led to additional projects to improve quality.
Early Career Innovation
Novel solutions from professionals with less than five years of work experience after their last academic graduation.
Next Generation Fiberizing Technology | Rick Mastropole
Rick, one of our Early Career Innovation winners, saw an opportunity to improve fiberizing technology and enhance
Owens Corning’s industry position for fiberglass and mineral wool. His innovative designs resulted in increased
manufacturing flexibility that could revolutionize the industry.
Joint Development of Step-Change Winder Technology | Ben Kowalski
Our second Early Career Innovation winner, Ben, partnered with a company that worked with us on winder
technology for glass fiber. The way this material is wound on a bobbin can limit productivity. Ben studied previous
attempts to overcome the limitation, and through his research, designed and tested a new winder concept. The
concept has been proven in the lab and will soon be tested at manufacturing scale. Ben’s innovation has the
potential to double fiber forming speed.
New Approach to Innovation
Outstanding achievement based on a scientific approach to ideation or evaluation, using tools and techniques that enable new revenue sources or productivity gains.
Silentex® Texturized Roving Next Generation Nozzles | Luc Brandt, Dominique Font, Pauline Gachet
Owens Corning’s patented direct-filling technology has become the most widely used method to fill automotive
mufflers with sound-absorptive glass roving. This cross-functional team from two European facilities worked
together and used a problem-solving methodology to create a new patent-pending nozzle that benefits customers
and establishes a stronger technical link between the Silentex® texturized roving process and Owens Corning glass,
confirming the company’s leadership in direct-fill technology.
2017 OWENS CORNING SUSTAINABILITY REPORT | PURPOSE + PEOPLE + ACTION | 210
APPE N D I X
Appendix A
Accelerating Growth through Open Innovation
The sourcing of external ideas, products, technologies, or services to a third-party accelerated implementation or commercialization of an innovation that is new to Owens Corning.
XStrand™ 3D Printing Filament – Creating an Industry-Leading Additive Platform | Vincent Huin, Jean-Christophe Mathelin, Emmanuel Vaquant
Identifying an unmet market need within the additive manufacturing industry led this team to partner with several
external groups to create, test, and commercialize products related to glass-reinforced plastics for 3D printing. The
team was able to produce the first functional prototype material within six months and has started commercialization
of the XStrand™ filament using a range of global distribution partners.
Speed to Commercialization
Achievement had speed and business impact, relative to the nature of the project. This includes a technology quickly and effectively deployed to manufacturing.
RhinoMat® Coated Woven, North American Growth | Ron Boisvert, Andy Durham, Jesse Gadley,
Hamza Haji, Jason Woodall
The Speed to Commercialization winners recognized that specifiers and contractors were reluctant to move away
from an older, familiar technology and instead use Owens Corning’s RhinoMat® geomembrane product. After
significant research on critical characteristics for installation and application, the team completed test installations to
provide proof of concept. They then conducted an aggressive “engineering outreach” campaign, eventually resulting
in 66% year-over-year growth in the RhinoMat® coated woven product line in 2017.
Sustainability Innovation
Project enabled Owens Corning to accelerate meeting or surpassing its 2020 sustainability goals.
Rio Claro Plant – Successes in Reducing Waste to Landfill | Carlos Bertoncin, Luiz Cruz, Moacir Matos, Gustavo Nogueira, Claudio Stek
In 2017, the Rio Claro plant’s sustainability team worked to find ways to repurpose their glass waste into useful
materials such as ceramics and thermoplastic railway sleepers. The plant’s efforts have created revenue from scrap
worth over $400,000 a year, with additional cost savings from reduced landfill use.
AL MARZOCCHI INTELLECTUAL PROPERTY AWARDS
The intellectual property award is named after Al Marzocchi, the all-time Owens Corning record patent holder. His patents span four decades, from the 1950s through the 1980s, and several technology platforms. The Marzocchi Award is presented for achievement in invention that results in milestone numbers of patents and trade secrets: 15 for Bronze, 20 for Silver, 25 for Gold, 30 for Platinum, 35 for Rhodium, and 40+ for Diamond. The following employees were honored for reaching significant milestones in 2017:
30 patents or trade secrets – Platinum | Bert Elliott
Bert received the Platinum award in 2017. His patents have focused on shingle design and performance, including
the design of the SureNail® shingle.
2017 OWENS CORNING SUSTAINABILITY REPORT | PURPOSE + PEOPLE + ACTION | 211
APPE N D I X
Appendix A
20 patents or trade secrets – Silver | Ed Harrington and Pete McGinnis
Ed and Pete were recognized with Silver awards for their intellectual property contributions. Ed's work has focused
on improving the performance of asphalt as a saturant coating that is used in all roofing shingles, while Pete's
patents have been focused on formulations for high-performance and specialty glasses, including the development
of direct melt S-glass.
15 patents or trade secrets – Bronze | Mitch Weekley
Mitch received the Bronze award, reflecting his continued innovation in extruded polystyrene foam and work on
improvements in blowing agents, cell orientation and structure, and density performance.
2017 ENVIRONMENTAL AND OPERATIONS SUSTAINABILITY AWARDS
We understand the influence our business and products can have on the environment and look to our employees to help manage our impact. We’re proud to recognize our team members who helped us make the world a better, greener place in 2017.
Environmental Excellence Award
This award is designed to recognize sustained excellence in environmental stewardship and areas of regulatory or public interest.
Claudio Stek, Luiz Cruz, Gustavo Nogueira, Carlos Bertoncin, Moacir Matos; Rio Claro, Brazil
In addition to winning our 2017 Sustainability Innovation award, the Rio Claro sustainability team also received the
Environmental Excellence Award for their work in repurposing facility waste. Additional details can be found in the
Innovation Awards section.
Environmental OutreachThis award recognizes teams or individuals who actively participate in community environmental programs or initiatives, who may organize special events to raise environmental awareness, or who work to mentor smaller facilities, customers, or vendors in environmental stewardship
JungWoo Ha; Asan, South Korea
Since 2014, JungWoo has organized a monthly volunteer campaign where Kimchon plant employees spend time
cleaning up a nearby seaside park. This ongoing project has had a positive impact on the surrounding community,
plant employees, and the environment.
Environmental Impact Improvement
This award is given to a site having implemented new environmental processes or technology delivering significant impact reduction and/or compliance assurance with new or challenging environmental requirements.
Rhonda Hrabchak; Irving, Texas
In 2017, Rhonda and her team helped streamline and improve how we record and take action on environmental data
collected. Using a continuous improvement approach, the team quantified the risk of errors in the collection process
and developed a procedure and tool to help reduce the risk. The tool that was developed has potential to be used at
other Owens Corning sites and improve our company’s environmental data collection.
2017 OWENS CORNING SUSTAINABILITY REPORT | PURPOSE + PEOPLE + ACTION | 212
APPE N D I X
Appendix A
2017 TALENT AWARDS
Developing and growing our people is essential to the continued growth of Owens Corning. Our Talent Awards look to recognize leaders who go above and beyond to recruit and develop talent, promote a diverse work environment, and identify ways to grow their colleagues and the business.
Recruiter of Talent
For attracting, recruiting, and referring outstanding talent to Owens Corning from outside of the company.
Chris Skinner; Brussels, Belgium
The 2017 Recruiter of Talent award winner, Chris, has shown passion for Owens Corning and recruiting top talent
to the organization. Chris has opened new recruitment channels, brought in diverse talents, and creates a positive
onboarding experience for those around him. Colleagues recognize his dedication and respect his role as a leader.
Developer of Talent
For building capabilities through teaching others; participating in formal training programs; and mentoring and coaching others to develop, improve performance, and advance careers.
John Power; Amarillo, Texas
At the end of 2016 and into 2017, John worked with the Amarillo facility team to implement a thorough employee
engagement strategy. As plant leader, John became a visible, hands-on leader, visiting and working on holidays to
thank employees, starting weekly breakfast meetings for employees to meet leadership and creating a newsletter
to share important events. He also recruited and developed key talent to fill gaps in leadership and move employees
where they could be most successful.
Diversity & Inclusion Promoter
For increasing the representation, advancement, and inclusion of women and racially diverse minorities, thus promoting cultural diversity and diversity of thought.
Tara Waresvka; Jacksonville, Florida
The 2017 Diversity & Inclusion Promoter winner, Tara, is very active within Owens Corning and is dedicated to
supporting her team members. She is actively engaged in a variety of employee engagement activities and has
mentored several high-potential female employees to encourage their development. Tara also participates in Habitat
for Humanity builds, school supply drives, and local plant events.
Growth Champion
For creating an innovative team environment with inspirational leadership that grows the business.
Steve Thaxton; Granville, Ohio Steve’s leadership has led to unprecedented innovation in 2017 from the components science and technology
division of Owens Corning. He fosters an atmosphere for problem solving, collaboration, innovation and growth.
Steve’s leadership has resulted in over 80 new innovation projects initiated and $155 million in revenue growth.
2017 OWENS CORNING SUSTAINABILITY REPORT | PURPOSE + PEOPLE + ACTION | 213
APPE N D I X
Appendix A
2017 SAFETY AWARDS
Safety is among our top priorities, and we’re proud to recognize individuals, teams, and projects that have gone above and beyond to make our operations, people, and plants safer.
Juan Flores; Mexico City, Mexico
Since joining the plant in January 2017, Juan has focused on all aspects of safety. Using continuous improvement
tools, he developed a strategy around safety, quality, and productivity processes. This has increased the safety culture
for more than 50 logistics employees.
YingYan Lu; Yuhang, China
From 2014 through 2017, YingYan led the Yuhang plant with no onsite injuries. Under her leadership the Yuhang
location became the first Asia Pacific plant to create a visitor safety orientation video, won government recognition
as a “Model Industry for Control on Airborne Particulates,” and achieved Total Productive Maintenance Excellence
certification.
Mary Megan Youmans; Irving, Texas
Mary Megan has improved safety at the Irving asphalt plant, as well as other asphalt sites and the business overall.
In 2017 she helped improve the lock-tag-try matrices and Visio drawing updates, created and managed a 60-day
database tracking hydrogen sulfide exposure, and reviewed, updated, and created many job hazard analysis forms.
Pierre Bueso, Simon Claudepierre, Yves Fiel, Pierre Landes, Benoit Lorre, Eric Mailland, Philippe Morel, Infirmerie (Actis) Ocv, Alain Petellaz, Henri Prevosto, Gabriel Spinelli, Thierry Tournier, Jerome Vollet, and Pascal Wouters; Chambéry, France
In 2017, this team reduced glass-in-hand injuries by implementing various processes and procedures including,
safety meetings, focused employee training, prototypes to improve equipment, and a tool and holster for cleaning
tasks instead of using hands. Because of these efforts there were no recordable injuries due to glass-in-hand in
2017, compared to three in 2016.
Hans Berkman, Ismail Er, Henrie Groeneveld, Vincent Meier, and Tieme Zwaan; Apeldoorn, Netherlands
In 2017, the Apeldoorn team installed an ionization bar on the winding equipment that drastically reduced
electrostatic discharge that the plant had been experiencing for more than 30 years. The ionization bar is expected
to eliminate future safety incidents related to electrostatic discharge. Team members also applied the solution to the
rewinding machines to further eliminate safety risks caused by electrostatic discharge.
Bruce Allen, Russell Ault, Rollo Gallion, Joseph Hester, Barry Lewis, and Mel Sancrant; various locations
Since 2016, this field technical services team has performed more than 2,300 on-site residential roof inspections
with zero injuries. Through their leadership, team members have become a roof-safety resource to the Roofing
business as well as sales, marketing, science and technology, and Owens Corning contractors.
Chris Allen, Jonathan Best, Chuck Brumbaugh, Chris Bulls, Alan Chan, TJ Crabtree, Josh Davis, Doug Denison, Saiyan Du, Ryan Durrill, Kristi Fox, Frank Hall, Janet Hendry, David Hill, Nancy Joy, Sylvain Lalonde, Jerry Lewis, Jason Li, Victor Liu, Ken Moseley, Oscar Ortinez, Stephen Phillips, Petra Procova, Jian Qiu, Robert Riggs, Samantha Stafford, Natacha Van Gastel, Stacy Wahl, James Wang, Yunchao Wei, Grady Whatley, Pascal Wouters, Hailong Yu, and Jun Zhu; various locations
When Owens Corning acquired FOAMGLAS® in June 2017, one of the first tasks was to address safety at its five
sites. Owens Corning safety leaders mentioned above were on site the first day after the acquisition was complete,
and they partnered with site leaders to assess conditions. In teams of two or more, they spent days, and sometimes
weeks, in FOAMGLAS® plants to address and improve safety. Since their efforts, injuries at the plants reduced by
85% in the second half of 2017.
2017 OWENS CORNING SUSTAINABILITY REPORT | PURPOSE + PEOPLE + ACTION | 214
APPE N D I X
Appendix B
DEFINING WORKERS
For the purposes of this report, Owens Corning defines “workers” as our employees globally across all facilities in which we operate. Within the Living Safely section of this report, we additionally report on contractors over whom we have direct supervision as well as those for our large capital projects.
REPORTING METHODOLOGY
Owens Corning follows the World Resources Institute (WRI) Corporate Accounting and Reporting standard for defining and accounting its baseline structure. In 2017, we had over 100 facilities, which are included in the scope and boundary of our reporting. The data for divested facilities are excluded from our company environmental footprint; however, the data for closures are included in our reporting.
Given the guideline of baseline adjustments by WRI, we review all structural changes such as mergers, acquisitions, and divestments on an annual basis. Per the stated protocol, the data of mergers or acquisitions greater than 50% are reviewed for accuracy and integrity and then integrated into our reporting inventory from base year to current year. This process of updating the baseline is completed for both the numerator (aspect) and denominator (sales or production) of our calculations. This approach was implemented to ensure a meaningful and consistent comparison of emissions over time, including for the current year.
Please note that numbers have been rounded. Some totals have been affected as a result.
ENVIRONMENTAL METHODOLOGY
For the organizational and geographical boundaries of the inventory, we have used owned and leased facilities globally under Owens Corning’s operational control.
The physical infrastructure, activities, and/or technologies of the inventory are understood as:
• Offices, distribution centers, warehouses, manufacturing facilities, fleet vehicles, corporate jet, and employee travel.
• Emissions resulting from welding gases and air conditioning have been excluded as de minimis.
The GHG sources identified are purchased electricity, natural gas, diesel, jet fuel, gasoline, propane, blowing agents, and refrigerants.
All greenhouse gases declared in the Kyoto Protocol (CO2, CH4, N2O, SF6, HFCs, PFCs, NF3) are included in the evaluation.
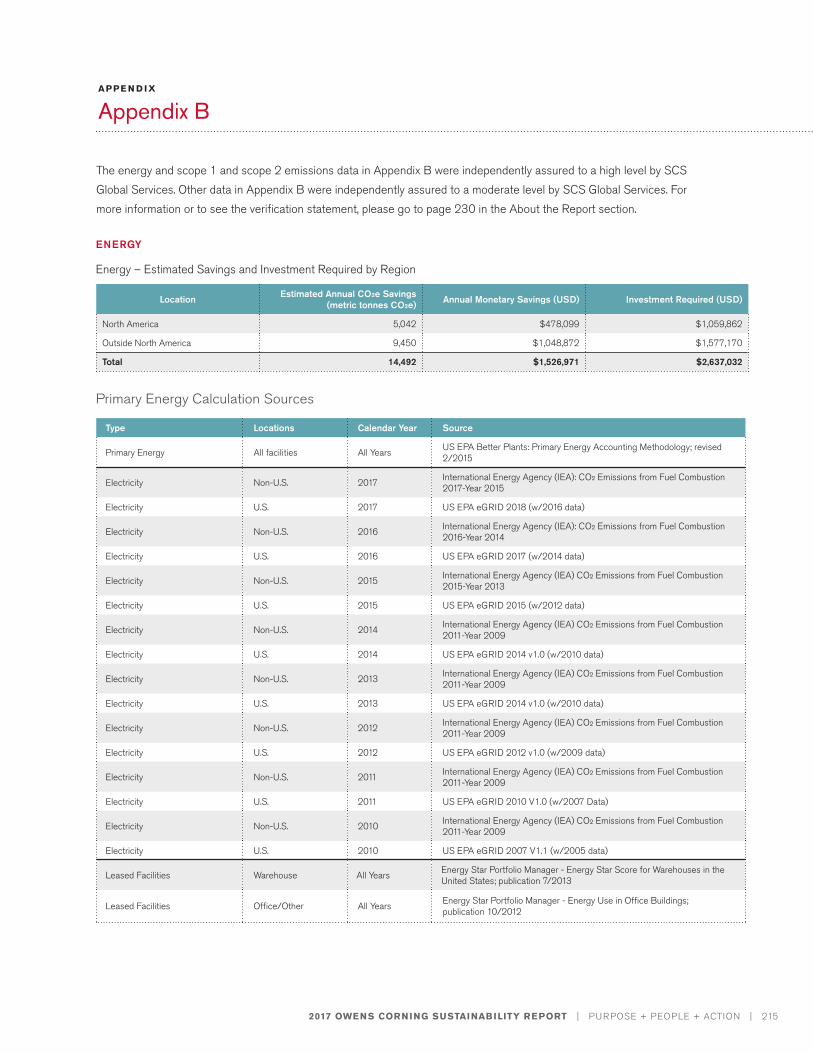
2017 OWENS CORNING SUSTAINABILITY REPORT | PURPOSE + PEOPLE + ACTION | 215
APPE N D I X
Appendix B
ENERGY
Energy – Estimated Savings and Investment Required by Region
Location Estimated Annual CO2e Savings (metric tonnes CO2e) Annual Monetary Savings (USD) Investment Required (USD)
North America 5,042 $478,099 $1,059,862
Outside North America 9,450 $1,048,872 $1,577,170
Total 14,492 $1,526,971 $2,637,032
Type Locations Calendar Year Source
Primary Energy All facilities All Years US EPA Better Plants: Primary Energy Accounting Methodology; revised 2/2015
Electricity Non-U.S. 2017 International Energy Agency (IEA): CO2 Emissions from Fuel Combustion 2017-Year 2015
Electricity U.S. 2017 US EPA eGRID 2018 (w/2016 data)
Electricity Non-U.S. 2016 International Energy Agency (IEA): CO2 Emissions from Fuel Combustion 2016-Year 2014
Electricity U.S. 2016 US EPA eGRID 2017 (w/2014 data)
Electricity Non-U.S. 2015 International Energy Agency (IEA) CO2 Emissions from Fuel Combustion 2015-Year 2013
Electricity U.S. 2015 US EPA eGRID 2015 (w/2012 data)
Electricity Non-U.S. 2014 International Energy Agency (IEA) CO2 Emissions from Fuel Combustion 2011-Year 2009
Electricity U.S. 2014 US EPA eGRID 2014 v1.0 (w/2010 data)
Electricity Non-U.S. 2013 International Energy Agency (IEA) CO2 Emissions from Fuel Combustion 2011-Year 2009
Electricity U.S. 2013 US EPA eGRID 2014 v1.0 (w/2010 data)
Electricity Non-U.S. 2012 International Energy Agency (IEA) CO2 Emissions from Fuel Combustion 2011-Year 2009
Electricity U.S. 2012 US EPA eGRID 2012 v1.0 (w/2009 data)
Electricity Non-U.S. 2011 International Energy Agency (IEA) CO2 Emissions from Fuel Combustion 2011-Year 2009
Electricity U.S. 2011 US EPA eGRID 2010 V1.0 (w/2007 Data)
Electricity Non-U.S. 2010 International Energy Agency (IEA) CO2 Emissions from Fuel Combustion 2011-Year 2009
Electricity U.S. 2010 US EPA eGRID 2007 V1.1 (w/2005 data)
Leased Facilities Warehouse All Years Energy Star Portfolio Manager - Energy Star Score for Warehouses in the United States; publication 7/2013
Leased Facilities Office/Other All Years Energy Star Portfolio Manager - Energy Use in Office Buildings; publication 10/2012
Primary Energy Calculation Sources
The energy and scope 1 and scope 2 emissions data in Appendix B were independently assured to a high level by SCS Global Services. Other data in Appendix B were independently assured to a moderate level by SCS Global Services. For more information or to see the verification statement, please go to page 230 in the About the Report section.
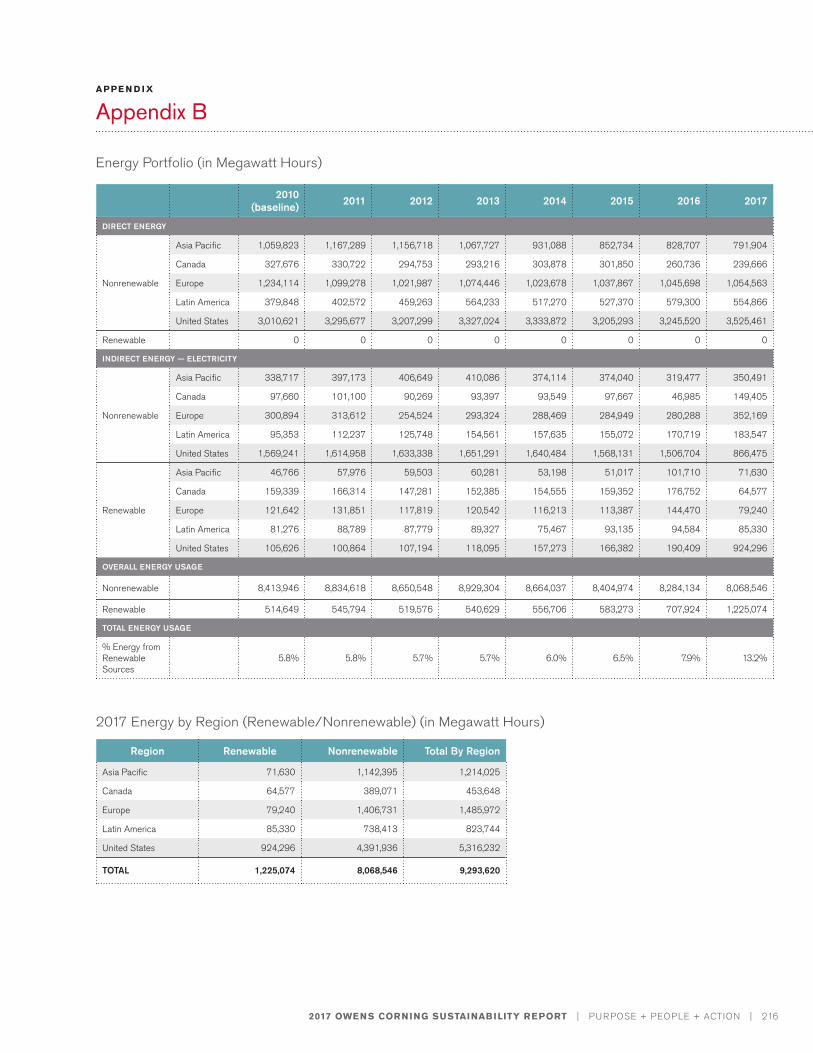
2017 OWENS CORNING SUSTAINABILITY REPORT | PURPOSE + PEOPLE + ACTION | 216
APPE N D I X
Appendix B
Energy Portfolio (in Megawatt Hours)
2017 Energy by Region (Renewable/Nonrenewable) (in Megawatt Hours)
2010 (baseline) 2011 2012 2013 2014 2015 2016 2017
DIRECT ENERGY
Nonrenewable
Asia Pacific 1,059,823 1,167,289 1,156,718 1,067,727 931,088 852,734 828,707 791,904
Canada 327,676 330,722 294,753 293,216 303,878 301,850 260,736 239,666
Europe 1,234,114 1,099,278 1,021,987 1,074,446 1,023,678 1,037,867 1,045,698 1,054,563
Latin America 379,848 402,572 459,263 564,233 517,270 527,370 579,300 554,866
United States 3,010,621 3,295,677 3,207,299 3,327,024 3,333,872 3,205,293 3,245,520 3,525,461
Renewable 0 0 0 0 0 0 0 0
INDIRECT ENERGY — ELECTRICITY
Nonrenewable
Asia Pacific 338,717 397,173 406,649 410,086 374,114 374,040 319,477 350,491
Canada 97,660 101,100 90,269 93,397 93,549 97,667 46,985 149,405
Europe 300,894 313,612 254,524 293,324 288,469 284,949 280,288 352,169
Latin America 95,353 112,237 125,748 154,561 157,635 155,072 170,719 183,547
United States 1,569,241 1,614,958 1,633,338 1,651,291 1,640,484 1,568,131 1,506,704 866,475
Renewable
Asia Pacific 46,766 57,976 59,503 60,281 53,198 51,017 101,710 71,630
Canada 159,339 166,314 147,281 152,385 154,555 159,352 176,752 64,577
Europe 121,642 131,851 117,819 120,542 116,213 113,387 144,470 79,240
Latin America 81,276 88,789 87,779 89,327 75,467 93,135 94,584 85,330
United States 105,626 100,864 107,194 118,095 157,273 166,382 190,409 924,296
OVERALL ENERGY USAGE
Nonrenewable 8,413,946 8,834,618 8,650,548 8,929,304 8,664,037 8,404,974 8,284,134 8,068,546
Renewable 514,649 545,794 519,576 540,629 556,706 583,273 707,924 1,225,074
TOTAL ENERGY USAGE
% Energy from Renewable Sources
5.8% 5.8% 5.7% 5.7% 6.0% 6.5% 7.9% 13.2%
Region Renewable Nonrenewable Total By Region
Asia Pacific 71,630 1,142,395 1,214,025
Canada 64,577 389,071 453,648
Europe 79,240 1,406,731 1,485,972
Latin America 85,330 738,413 823,744
United States 924,296 4,391,936 5,316,232
TOTAL 1,225,074 8,068,546 9,293,620
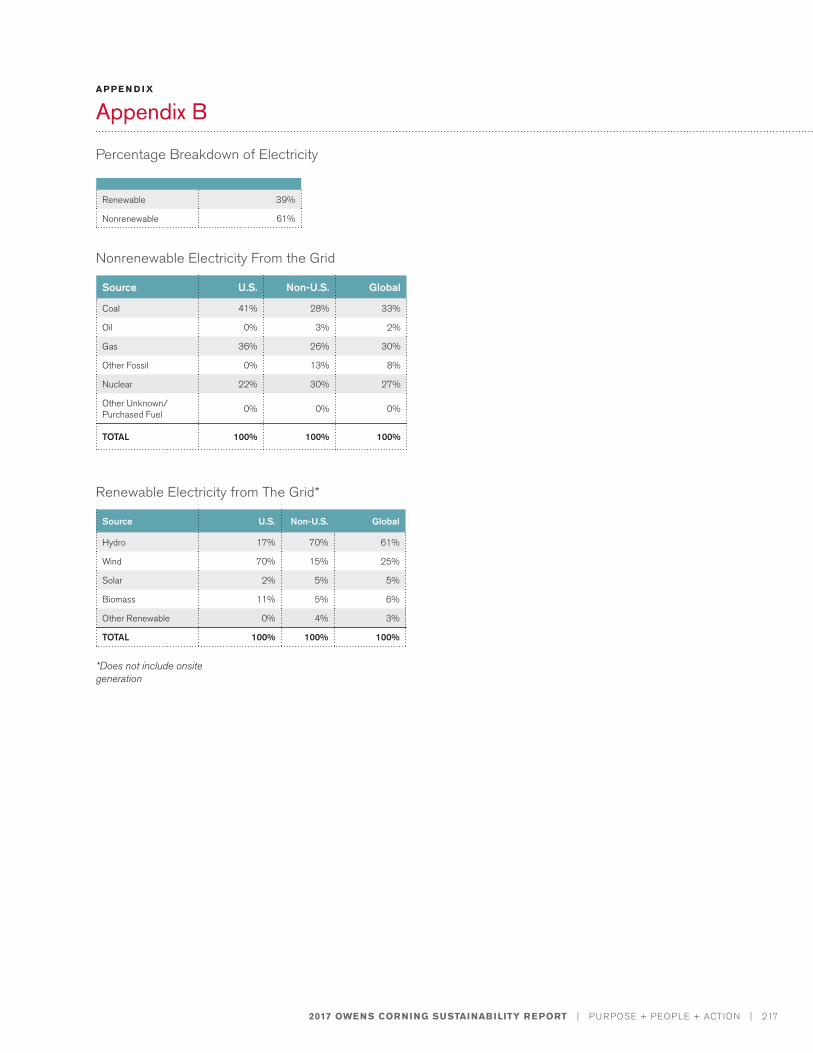
2017 OWENS CORNING SUSTAINABILITY REPORT | PURPOSE + PEOPLE + ACTION | 217
APPE N D I X
Appendix B
Percentage Breakdown of Electricity
Nonrenewable Electricity From the Grid
Renewable Electricity from The Grid*
Renewable 39%
Nonrenewable 61%
Source U.S. Non-U.S. Global
Coal 41% 28% 33%
Oil 0% 3% 2%
Gas 36% 26% 30%
Other Fossil 0% 13% 8%
Nuclear 22% 30% 27%
Other Unknown/ Purchased Fuel 0% 0% 0%
TOTAL 100% 100% 100%
Source U.S. Non-U.S. Global
Hydro 17% 70% 61%
Wind 70% 15% 25%
Solar 2% 5% 5%
Biomass 11% 5% 6%
Other Renewable 0% 4% 3%
TOTAL 100% 100% 100%
*Does not include onsite generation
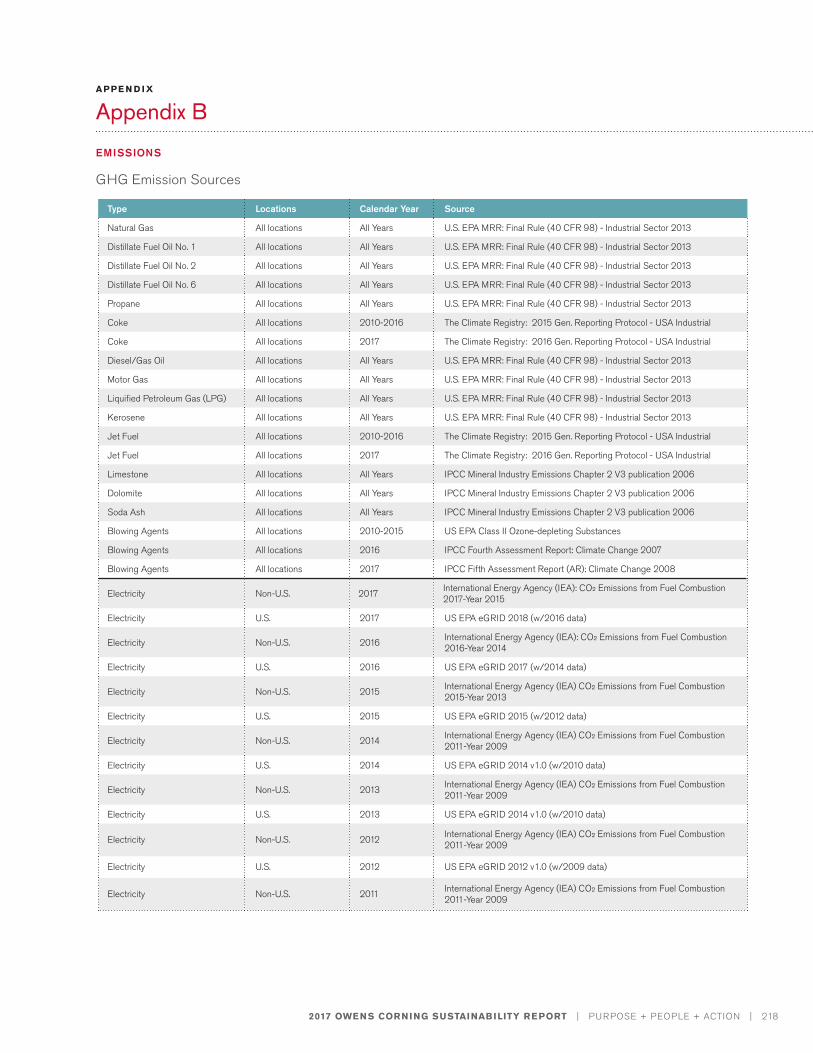
2017 OWENS CORNING SUSTAINABILITY REPORT | PURPOSE + PEOPLE + ACTION | 218
APPE N D I X
Appendix B
EMISSIONS
Type Locations Calendar Year Source
Natural Gas All locations All Years U.S. EPA MRR: Final Rule (40 CFR 98) - Industrial Sector 2013
Distillate Fuel Oil No. 1 All locations All Years U.S. EPA MRR: Final Rule (40 CFR 98) - Industrial Sector 2013
Distillate Fuel Oil No. 2 All locations All Years U.S. EPA MRR: Final Rule (40 CFR 98) - Industrial Sector 2013
Distillate Fuel Oil No. 6 All locations All Years U.S. EPA MRR: Final Rule (40 CFR 98) - Industrial Sector 2013
Propane All locations All Years U.S. EPA MRR: Final Rule (40 CFR 98) - Industrial Sector 2013
Coke All locations 2010-2016 The Climate Registry: 2015 Gen. Reporting Protocol - USA Industrial
Coke All locations 2017 The Climate Registry: 2016 Gen. Reporting Protocol - USA Industrial
Diesel/Gas Oil All locations All Years U.S. EPA MRR: Final Rule (40 CFR 98) - Industrial Sector 2013
Motor Gas All locations All Years U.S. EPA MRR: Final Rule (40 CFR 98) - Industrial Sector 2013
Liquified Petroleum Gas (LPG) All locations All Years U.S. EPA MRR: Final Rule (40 CFR 98) - Industrial Sector 2013
Kerosene All locations All Years U.S. EPA MRR: Final Rule (40 CFR 98) - Industrial Sector 2013
Jet Fuel All locations 2010-2016 The Climate Registry: 2015 Gen. Reporting Protocol - USA Industrial
Jet Fuel All locations 2017 The Climate Registry: 2016 Gen. Reporting Protocol - USA Industrial
Limestone All locations All Years IPCC Mineral Industry Emissions Chapter 2 V3 publication 2006
Dolomite All locations All Years IPCC Mineral Industry Emissions Chapter 2 V3 publication 2006
Soda Ash All locations All Years IPCC Mineral Industry Emissions Chapter 2 V3 publication 2006
Blowing Agents All locations 2010-2015 US EPA Class II Ozone-depleting Substances
Blowing Agents All locations 2016 IPCC Fourth Assessment Report: Climate Change 2007
Blowing Agents All locations 2017 IPCC Fifth Assessment Report (AR): Climate Change 2008
Electricity Non-U.S. 2017 International Energy Agency (IEA): CO2 Emissions from Fuel Combustion 2017-Year 2015
Electricity U.S. 2017 US EPA eGRID 2018 (w/2016 data)
Electricity Non-U.S. 2016 International Energy Agency (IEA): CO2 Emissions from Fuel Combustion 2016-Year 2014
Electricity U.S. 2016 US EPA eGRID 2017 (w/2014 data)
Electricity Non-U.S. 2015 International Energy Agency (IEA) CO2 Emissions from Fuel Combustion 2015-Year 2013
Electricity U.S. 2015 US EPA eGRID 2015 (w/2012 data)
Electricity Non-U.S. 2014 International Energy Agency (IEA) CO2 Emissions from Fuel Combustion 2011-Year 2009
Electricity U.S. 2014 US EPA eGRID 2014 v1.0 (w/2010 data)
Electricity Non-U.S. 2013 International Energy Agency (IEA) CO2 Emissions from Fuel Combustion 2011-Year 2009
Electricity U.S. 2013 US EPA eGRID 2014 v1.0 (w/2010 data)
Electricity Non-U.S. 2012 International Energy Agency (IEA) CO2 Emissions from Fuel Combustion 2011-Year 2009
Electricity U.S. 2012 US EPA eGRID 2012 v1.0 (w/2009 data)
Electricity Non-U.S. 2011 International Energy Agency (IEA) CO2 Emissions from Fuel Combustion 2011-Year 2009
GHG Emission Sources
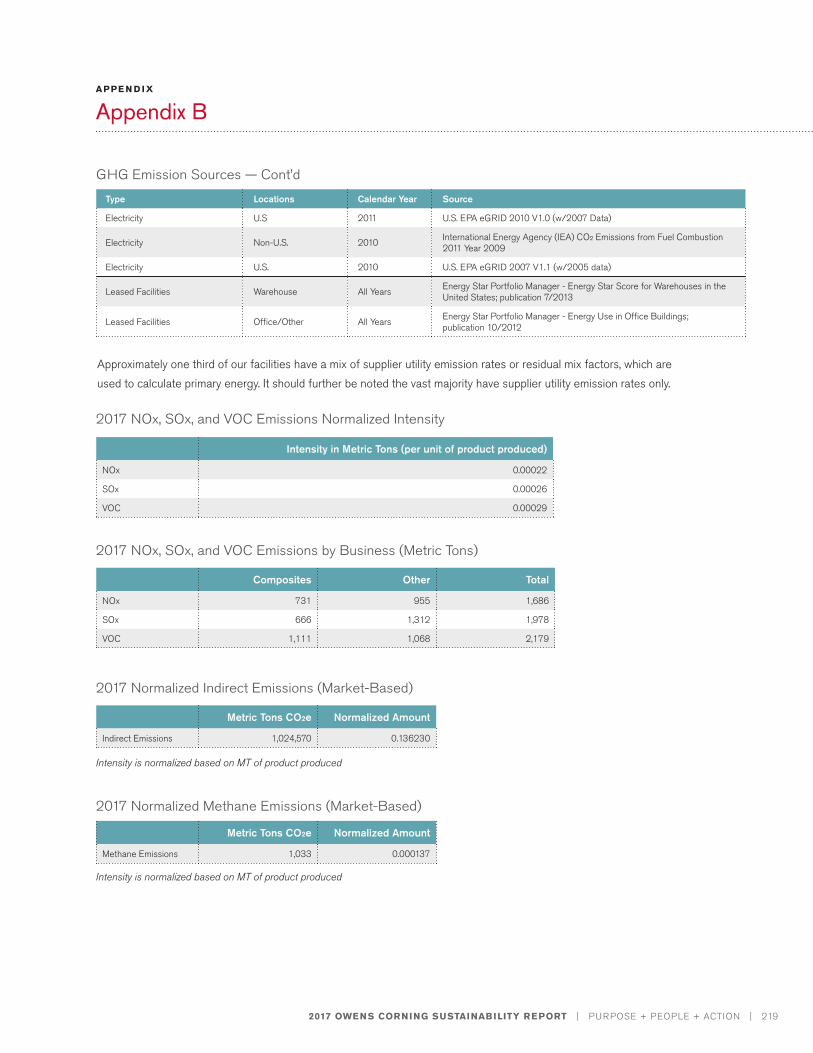
2017 OWENS CORNING SUSTAINABILITY REPORT | PURPOSE + PEOPLE + ACTION | 219
APPE N D I X
Appendix B
2017 NOx, SOx, and VOC Emissions by Business (Metric Tons)
2017 Normalized Indirect Emissions (Market-Based)
2017 NOx, SOx, and VOC Emissions Normalized Intensity
Composites Other Total
NOx 731 955 1,686
SOx 666 1,312 1,978
VOC 1,111 1,068 2,179
Metric Tons CO2e Normalized Amount
Indirect Emissions 1,024,570 0.136230
Intensity in Metric Tons (per unit of product produced)
NOx 0.00022
SOx 0.00026
VOC 0.00029
Intensity is normalized based on MT of product produced
2017 Normalized Methane Emissions (Market-Based)
Metric Tons CO2e Normalized Amount
Methane Emissions 1,033 0.000137
Intensity is normalized based on MT of product produced
Type Locations Calendar Year Source
Electricity U.S 2011 U.S. EPA eGRID 2010 V1.0 (w/2007 Data)
Electricity Non-U.S. 2010 International Energy Agency (IEA) CO2 Emissions from Fuel Combustion 2011 Year 2009
Electricity U.S. 2010 U.S. EPA eGRID 2007 V1.1 (w/2005 data)
Leased Facilities Warehouse All Years Energy Star Portfolio Manager - Energy Star Score for Warehouses in the United States; publication 7/2013
Leased Facilities Office/Other All Years Energy Star Portfolio Manager - Energy Use in Office Buildings; publication 10/2012
Approximately one third of our facilities have a mix of supplier utility emission rates or residual mix factors, which are used to calculate primary energy. It should further be noted the vast majority have supplier utility emission rates only.
GHG Emission Sources — Cont’d
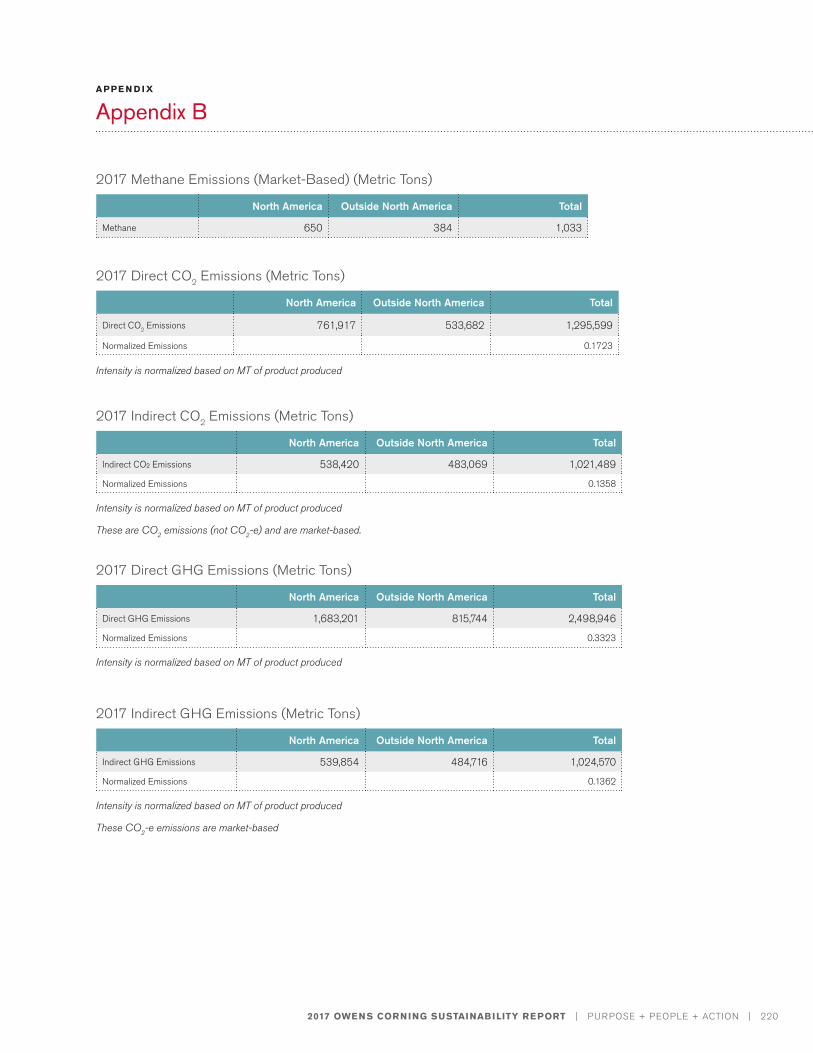
2017 OWENS CORNING SUSTAINABILITY REPORT | PURPOSE + PEOPLE + ACTION | 220
APPE N D I X
Appendix B
2017 Methane Emissions (Market-Based) (Metric Tons)
2017 Direct CO2 Emissions (Metric Tons)
North America Outside North America Total
Methane 650 384 1,033
North America Outside North America Total
Direct CO2 Emissions 761,917 533,682 1,295,599
Normalized Emissions 0.1723
Intensity is normalized based on MT of product produced
2017 Indirect CO2 Emissions (Metric Tons)
2017 Direct GHG Emissions (Metric Tons)
2017 Indirect GHG Emissions (Metric Tons)
North America Outside North America Total
Indirect CO2 Emissions 538,420 483,069 1,021,489
Normalized Emissions 0.1358
North America Outside North America Total
Direct GHG Emissions 1,683,201 815,744 2,498,946
Normalized Emissions 0.3323
North America Outside North America Total
Indirect GHG Emissions 539,854 484,716 1,024,570
Normalized Emissions 0.1362
Intensity is normalized based on MT of product produced
These are CO2 emissions (not CO2-e) and are market-based.
Intensity is normalized based on MT of product produced
Intensity is normalized based on MT of product produced
These CO2-e emissions are market-based
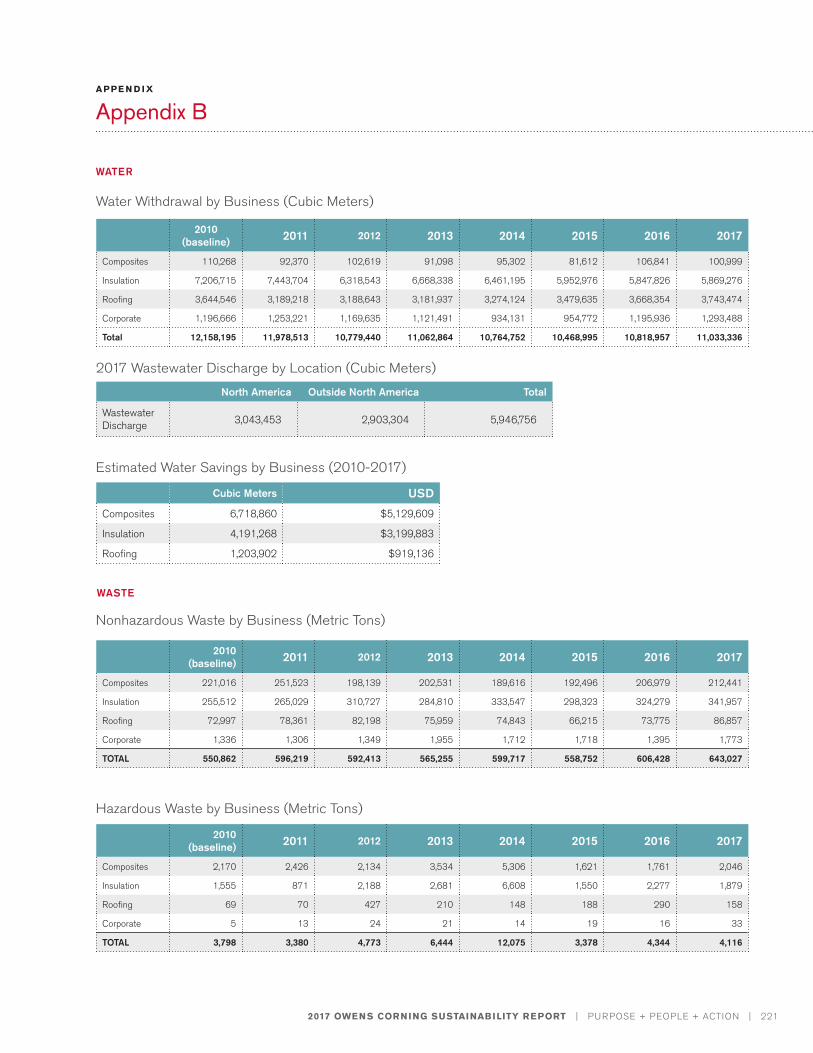
2017 OWENS CORNING SUSTAINABILITY REPORT | PURPOSE + PEOPLE + ACTION | 221
APPE N D I X
Appendix B
WATER
2010 (baseline) 2011 2012 2013 2014 2015 2016 2017
Composites 110,268 92,370 102,619 91,098 95,302 81,612 106,841 100,999
Insulation 7,206,715 7,443,704 6,318,543 6,668,338 6,461,195 5,952,976 5,847,826 5,869,276
Roofing 3,644,546 3,189,218 3,188,643 3,181,937 3,274,124 3,479,635 3,668,354 3,743,474
Corporate 1,196,666 1,253,221 1,169,635 1,121,491 934,131 954,772 1,195,936 1,293,488
Total 12,158,195 11,978,513 10,779,440 11,062,864 10,764,752 10,468,995 10,818,957 11,033,336
Water Withdrawal by Business (Cubic Meters)
2017 Wastewater Discharge by Location (Cubic Meters)
Estimated Water Savings by Business (2010-2017)
North America Outside North America Total
Wastewater Discharge 3,043,453 2,903,304 5,946,756
Cubic Meters USD
Composites 6,718,860 $5,129,609
Insulation 4,191,268 $3,199,883
Roofing 1,203,902 $919,136
WASTE
2010 (baseline) 2011 2012 2013 2014 2015 2016 2017
Composites 221,016 251,523 198,139 202,531 189,616 192,496 206,979 212,441
Insulation 255,512 265,029 310,727 284,810 333,547 298,323 324,279 341,957
Roofing 72,997 78,361 82,198 75,959 74,843 66,215 73,775 86,857
Corporate 1,336 1,306 1,349 1,955 1,712 1,718 1,395 1,773
TOTAL 550,862 596,219 592,413 565,255 599,717 558,752 606,428 643,027
2010 (baseline) 2011 2012 2013 2014 2015 2016 2017
Composites 2,170 2,426 2,134 3,534 5,306 1,621 1,761 2,046
Insulation 1,555 871 2,188 2,681 6,608 1,550 2,277 1,879
Roofing 69 70 427 210 148 188 290 158
Corporate 5 13 24 21 14 19 16 33
TOTAL 3,798 3,380 4,773 6,444 12,075 3,378 4,344 4,116
Nonhazardous Waste by Business (Metric Tons)
Hazardous Waste by Business (Metric Tons)
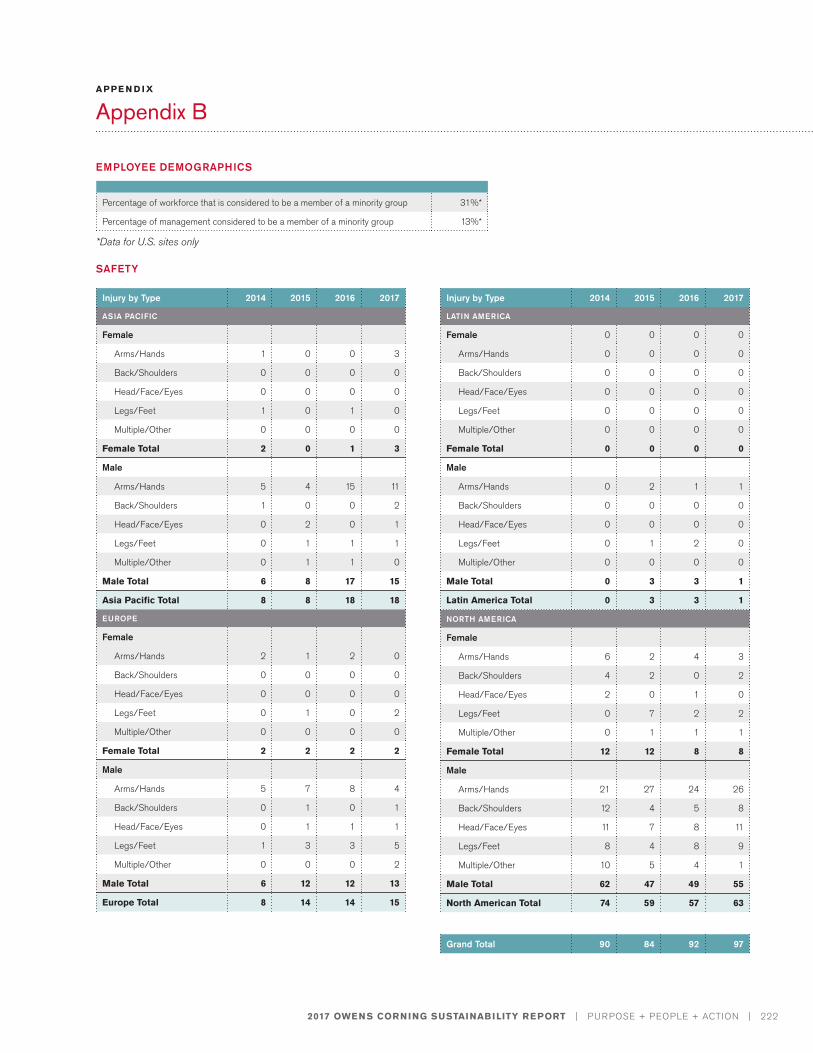
2017 OWENS CORNING SUSTAINABILITY REPORT | PURPOSE + PEOPLE + ACTION | 222
APPE N D I X
Appendix B
EMPLOYEE DEMOGRAPHICS
SAFETY
Percentage of workforce that is considered to be a member of a minority group 31%*
Percentage of management considered to be a member of a minority group 13%*
*Data for U.S. sites only
Injury by Type 2014 2015 2016 2017
ASIA PACIFIC
Female
Arms/Hands 1 0 0 3
Back/Shoulders 0 0 0 0
Head/Face/Eyes 0 0 0 0
Legs/Feet 1 0 1 0
Multiple/Other 0 0 0 0
Female Total 2 0 1 3
Male
Arms/Hands 5 4 15 11
Back/Shoulders 1 0 0 2
Head/Face/Eyes 0 2 0 1
Legs/Feet 0 1 1 1
Multiple/Other 0 1 1 0
Male Total 6 8 17 15
Asia Pacific Total 8 8 18 18
EUROPE
Female
Arms/Hands 2 1 2 0
Back/Shoulders 0 0 0 0
Head/Face/Eyes 0 0 0 0
Legs/Feet 0 1 0 2
Multiple/Other 0 0 0 0
Female Total 2 2 2 2
Male
Arms/Hands 5 7 8 4
Back/Shoulders 0 1 0 1
Head/Face/Eyes 0 1 1 1
Legs/Feet 1 3 3 5
Multiple/Other 0 0 0 2
Male Total 6 12 12 13
Europe Total 8 14 14 15
NORTH AMERICA
Female
Arms/Hands 6 2 4 3
Back/Shoulders 4 2 0 2
Head/Face/Eyes 2 0 1 0
Legs/Feet 0 7 2 2
Multiple/Other 0 1 1 1
Female Total 12 12 8 8
Male
Arms/Hands 21 27 24 26
Back/Shoulders 12 4 5 8
Head/Face/Eyes 11 7 8 11
Legs/Feet 8 4 8 9
Multiple/Other 10 5 4 1
Male Total 62 47 49 55
North American Total 74 59 57 63
Injury by Type 2014 2015 2016 2017
LATIN AMERICA
Female 0 0 0 0
Arms/Hands 0 0 0 0
Back/Shoulders 0 0 0 0
Head/Face/Eyes 0 0 0 0
Legs/Feet 0 0 0 0
Multiple/Other 0 0 0 0
Female Total 0 0 0 0
Male
Arms/Hands 0 2 1 1
Back/Shoulders 0 0 0 0
Head/Face/Eyes 0 0 0 0
Legs/Feet 0 1 2 0
Multiple/Other 0 0 0 0
Male Total 0 3 3 1
Latin America Total 0 3 3 1
Grand Total 90 84 92 97
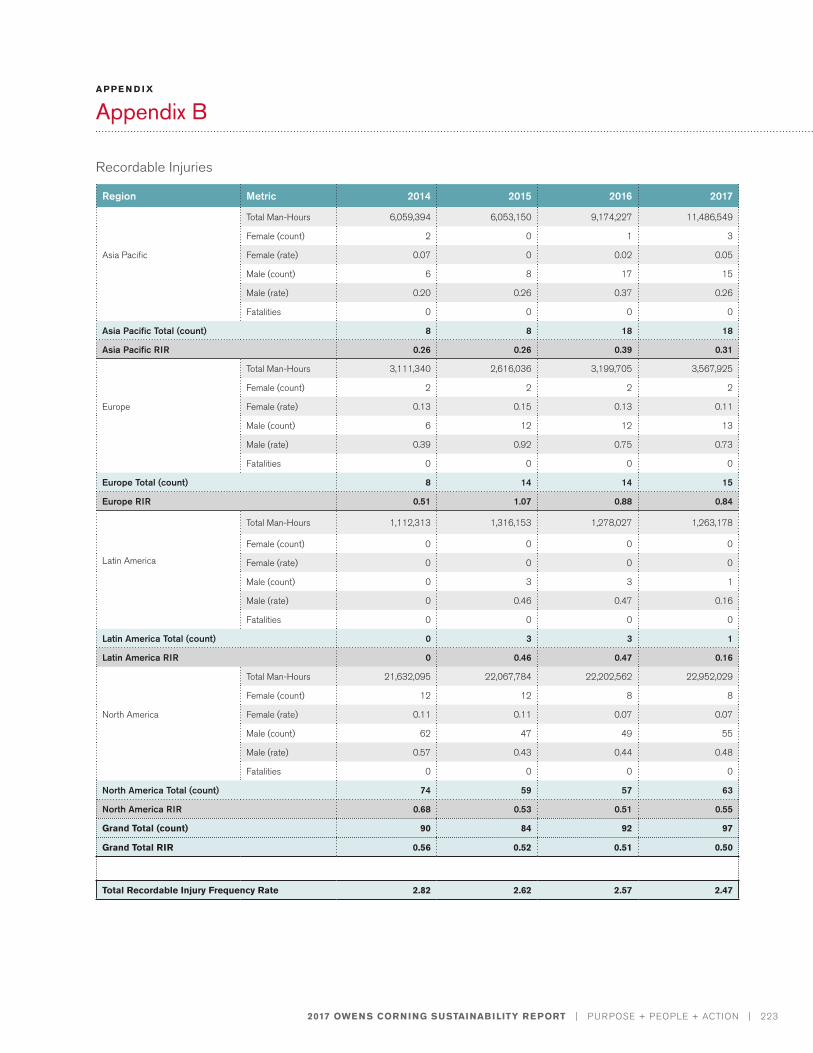
2017 OWENS CORNING SUSTAINABILITY REPORT | PURPOSE + PEOPLE + ACTION | 223
APPE N D I X
Appendix B
Recordable Injuries
Region Metric 2014 2015 2016 2017
Asia Pacific
Total Man-Hours 6,059,394 6,053,150 9,174,227 11,486,549
Female (count) 2 0 1 3
Female (rate) 0.07 0 0.02 0.05
Male (count) 6 8 17 15
Male (rate) 0.20 0.26 0.37 0.26
Fatalities 0 0 0 0
Asia Pacific Total (count) 8 8 18 18
Asia Pacific RIR 0.26 0.26 0.39 0.31
Europe
Total Man-Hours 3,111,340 2,616,036 3,199,705 3,567,925
Female (count) 2 2 2 2
Female (rate) 0.13 0.15 0.13 0.11
Male (count) 6 12 12 13
Male (rate) 0.39 0.92 0.75 0.73
Fatalities 0 0 0 0
Europe Total (count) 8 14 14 15
Europe RIR 0.51 1.07 0.88 0.84
Latin America
Total Man-Hours 1,112,313 1,316,153 1,278,027 1,263,178
Female (count) 0 0 0 0
Female (rate) 0 0 0 0
Male (count) 0 3 3 1
Male (rate) 0 0.46 0.47 0.16
Fatalities 0 0 0 0
Latin America Total (count) 0 3 3 1
Latin America RIR 0 0.46 0.47 0.16
North America
Total Man-Hours 21,632,095 22,067,784 22,202,562 22,952,029
Female (count) 12 12 8 8
Female (rate) 0.11 0.11 0.07 0.07
Male (count) 62 47 49 55
Male (rate) 0.57 0.43 0.44 0.48
Fatalities 0 0 0 0
North America Total (count) 74 59 57 63
North America RIR 0.68 0.53 0.51 0.55
Grand Total (count) 90 84 92 97
Grand Total RIR 0.56 0.52 0.51 0.50
Total Recordable Injury Frequency Rate 2.82 2.62 2.57 2.47
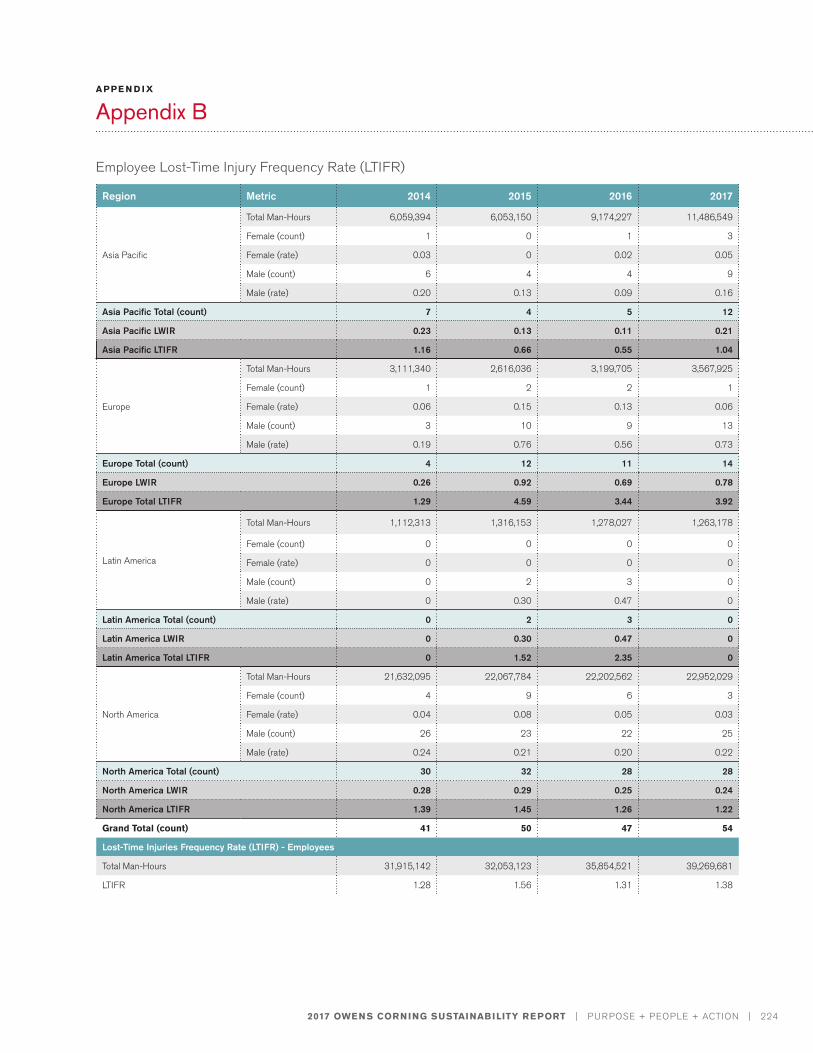
2017 OWENS CORNING SUSTAINABILITY REPORT | PURPOSE + PEOPLE + ACTION | 224
APPE N D I X
Appendix B
Employee Lost-Time Injury Frequency Rate (LTIFR)
Region Metric 2014 2015 2016 2017
Asia Pacific
Total Man-Hours 6,059,394 6,053,150 9,174,227 11,486,549
Female (count) 1 0 1 3
Female (rate) 0.03 0 0.02 0.05
Male (count) 6 4 4 9
Male (rate) 0.20 0.13 0.09 0.16
Asia Pacific Total (count) 7 4 5 12
Asia Pacific LWIR 0.23 0.13 0.11 0.21
Asia Pacific LTIFR 1.16 0.66 0.55 1.04
Europe
Total Man-Hours 3,111,340 2,616,036 3,199,705 3,567,925
Female (count) 1 2 2 1
Female (rate) 0.06 0.15 0.13 0.06
Male (count) 3 10 9 13
Male (rate) 0.19 0.76 0.56 0.73
Europe Total (count) 4 12 11 14
Europe LWIR 0.26 0.92 0.69 0.78
Europe Total LTIFR 1.29 4.59 3.44 3.92
Latin America
Total Man-Hours 1,112,313 1,316,153 1,278,027 1,263,178
Female (count) 0 0 0 0
Female (rate) 0 0 0 0
Male (count) 0 2 3 0
Male (rate) 0 0.30 0.47 0
Latin America Total (count) 0 2 3 0
Latin America LWIR 0 0.30 0.47 0
Latin America Total LTIFR 0 1.52 2.35 0
North America
Total Man-Hours 21,632,095 22,067,784 22,202,562 22,952,029
Female (count) 4 9 6 3
Female (rate) 0.04 0.08 0.05 0.03
Male (count) 26 23 22 25
Male (rate) 0.24 0.21 0.20 0.22
North America Total (count) 30 32 28 28
North America LWIR 0.28 0.29 0.25 0.24
North America LTIFR 1.39 1.45 1.26 1.22
Grand Total (count) 41 50 47 54
Lost-Time Injuries Frequency Rate (LTIFR) - Employees
Total Man-Hours 31,915,142 32,053,123 35,854,521 39,269,681
LTIFR 1.28 1.56 1.31 1.38
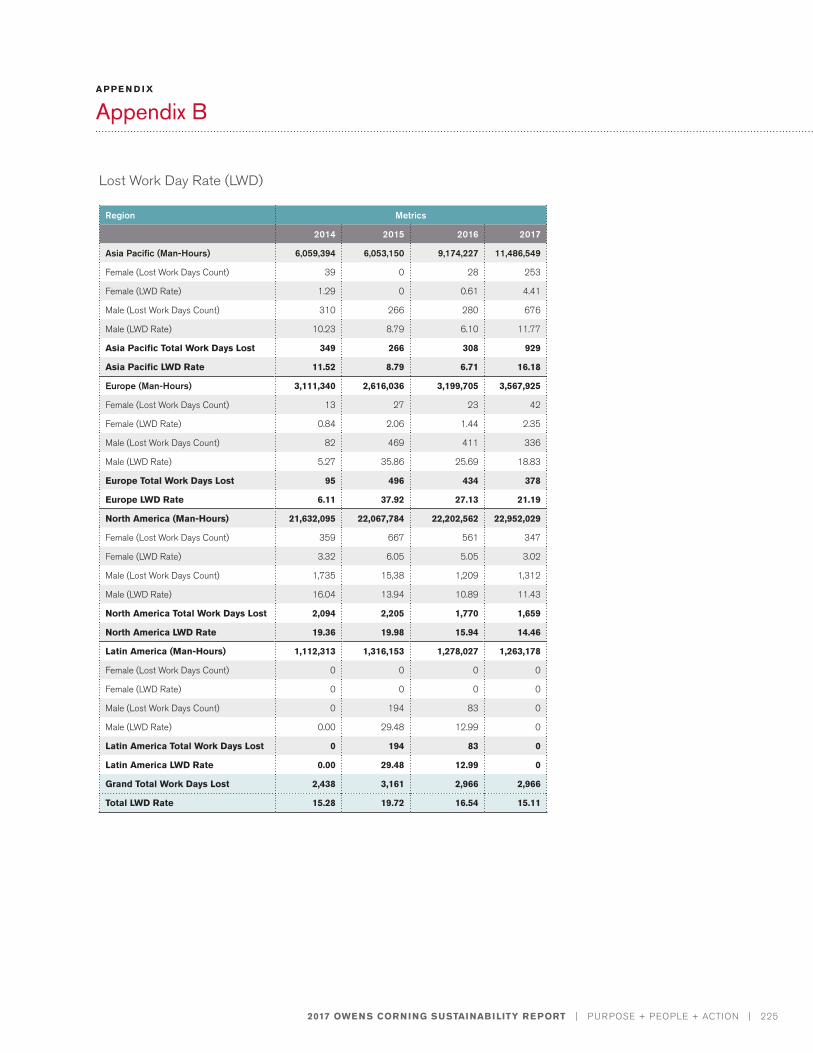
2017 OWENS CORNING SUSTAINABILITY REPORT | PURPOSE + PEOPLE + ACTION | 225
APPE N D I X
Appendix B
Lost Work Day Rate (LWD)
Region Metrics
2014 2015 2016 2017
Asia Pacific (Man-Hours) 6,059,394 6,053,150 9,174,227 11,486,549
Female (Lost Work Days Count) 39 0 28 253
Female (LWD Rate) 1.29 0 0.61 4.41
Male (Lost Work Days Count) 310 266 280 676
Male (LWD Rate) 10.23 8.79 6.10 11.77
Asia Pacific Total Work Days Lost 349 266 308 929
Asia Pacific LWD Rate 11.52 8.79 6.71 16.18
Europe (Man-Hours) 3,111,340 2,616,036 3,199,705 3,567,925
Female (Lost Work Days Count) 13 27 23 42
Female (LWD Rate) 0.84 2.06 1.44 2.35
Male (Lost Work Days Count) 82 469 411 336
Male (LWD Rate) 5.27 35.86 25.69 18.83
Europe Total Work Days Lost 95 496 434 378
Europe LWD Rate 6.11 37.92 27.13 21.19
North America (Man-Hours) 21,632,095 22,067,784 22,202,562 22,952,029
Female (Lost Work Days Count) 359 667 561 347
Female (LWD Rate) 3.32 6.05 5.05 3.02
Male (Lost Work Days Count) 1,735 15,38 1,209 1,312
Male (LWD Rate) 16.04 13.94 10.89 11.43
North America Total Work Days Lost 2,094 2,205 1,770 1,659
North America LWD Rate 19.36 19.98 15.94 14.46
Latin America (Man-Hours) 1,112,313 1,316,153 1,278,027 1,263,178
Female (Lost Work Days Count) 0 0 0 0
Female (LWD Rate) 0 0 0 0
Male (Lost Work Days Count) 0 194 83 0
Male (LWD Rate) 0.00 29.48 12.99 0
Latin America Total Work Days Lost 0 194 83 0
Latin America LWD Rate 0.00 29.48 12.99 0
Grand Total Work Days Lost 2,438 3,161 2,966 2,966
Total LWD Rate 15.28 19.72 16.54 15.11
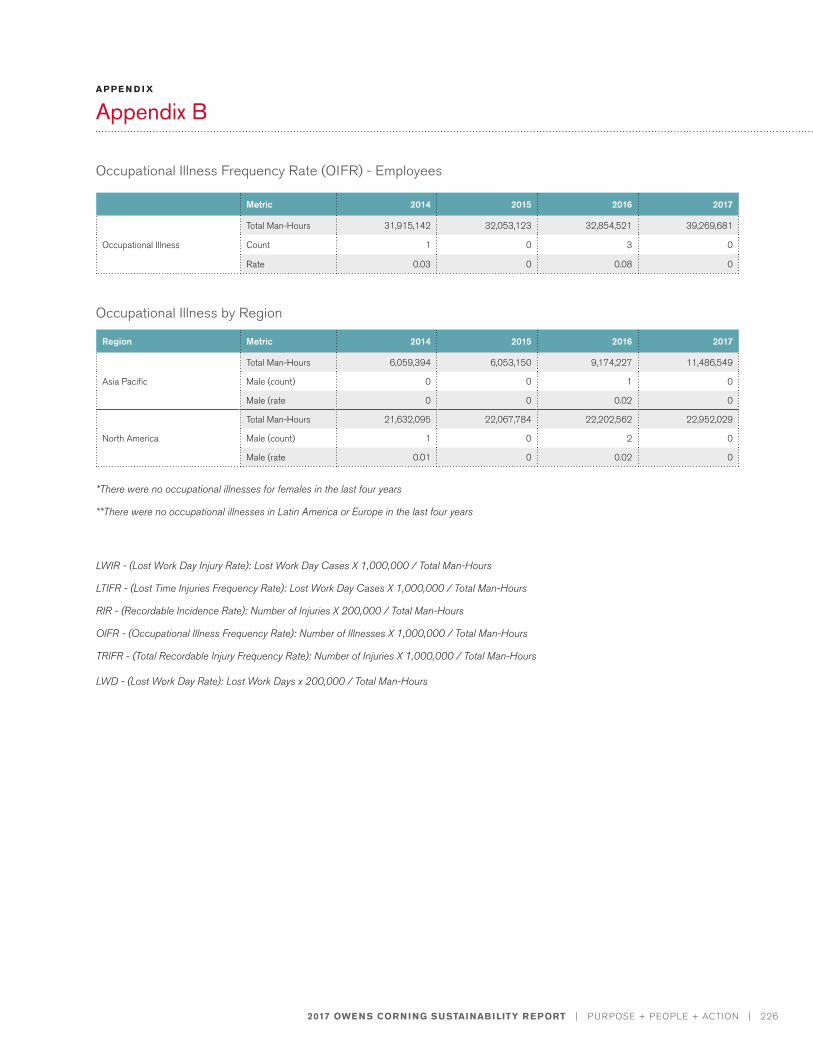
2017 OWENS CORNING SUSTAINABILITY REPORT | PURPOSE + PEOPLE + ACTION | 226
APPE N D I X
Appendix B
Occupational Illness Frequency Rate (OIFR) - Employees
Occupational Illness by Region
Metric 2014 2015 2016 2017
Occupational Illness
Total Man-Hours 31,915,142 32,053,123 32,854,521 39,269,681
Count 1 0 3 0
Rate 0.03 0 0.08 0
Region Metric 2014 2015 2016 2017
Asia Pacific
Total Man-Hours 6,059,394 6,053,150 9,174,227 11,486,549
Male (count) 0 0 1 0
Male (rate 0 0 0.02 0
North America
Total Man-Hours 21,632,095 22,067,784 22,202,562 22,952,029
Male (count) 1 0 2 0
Male (rate 0.01 0 0.02 0
*There were no occupational illnesses for females in the last four years
**There were no occupational illnesses in Latin America or Europe in the last four years
LWIR - (Lost Work Day Injury Rate): Lost Work Day Cases X 1,000,000 / Total Man-Hours
LTIFR - (Lost Time Injuries Frequency Rate): Lost Work Day Cases X 1,000,000 / Total Man-Hours
RIR - (Recordable Incidence Rate): Number of Injuries X 200,000 / Total Man-Hours
OIFR - (Occupational Illness Frequency Rate): Number of Illnesses X 1,000,000 / Total Man-Hours
TRIFR - (Total Recordable Injury Frequency Rate): Number of Injuries X 1,000,000 / Total Man-Hours
LWD - (Lost Work Day Rate): Lost Work Days x 200,000 / Total Man-Hours
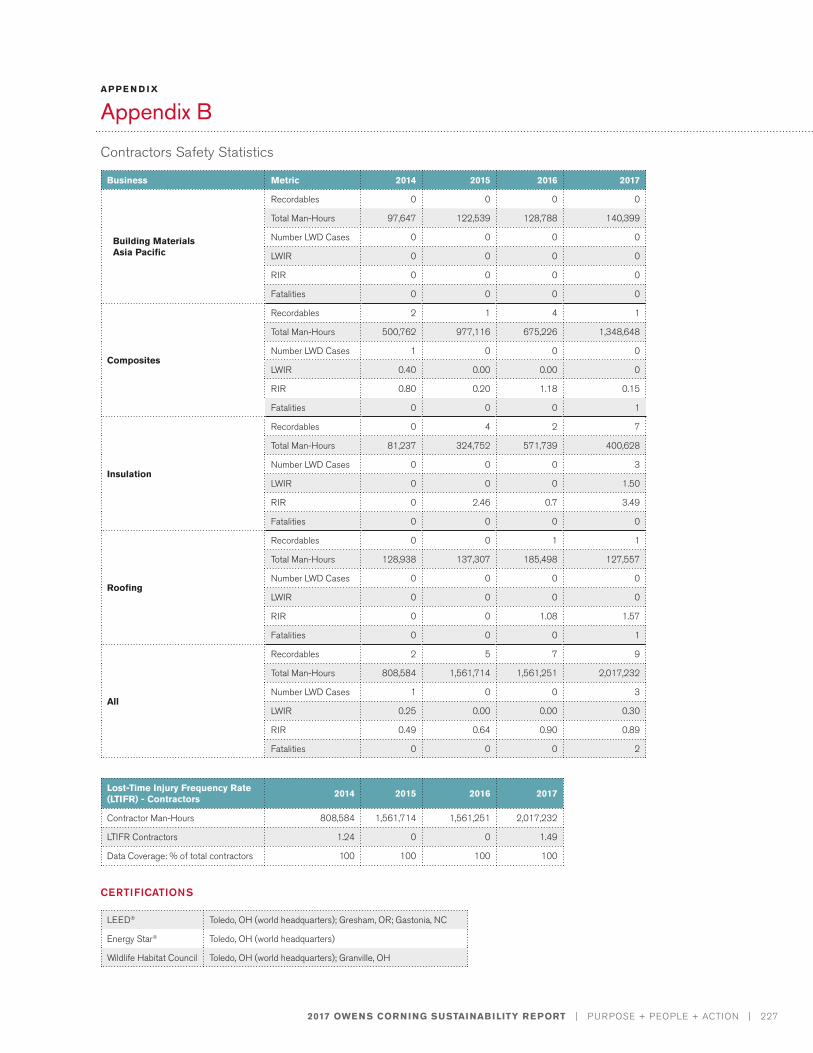
2017 OWENS CORNING SUSTAINABILITY REPORT | PURPOSE + PEOPLE + ACTION | 227
APPE N D I X
Appendix B
CERTIFICATIONS
LEED® Toledo, OH (world headquarters); Gresham, OR; Gastonia, NC
Energy Star® Toledo, OH (world headquarters)
Wildlife Habitat Council Toledo, OH (world headquarters); Granville, OH
Business Metric 2014 2015 2016 2017
Building Materials Asia Pacific
Recordables 0 0 0 0
Total Man-Hours 97,647 122,539 128,788 140,399
Number LWD Cases 0 0 0 0
LWIR 0 0 0 0
RIR 0 0 0 0
Fatalities 0 0 0 0
Composites
Recordables 2 1 4 1
Total Man-Hours 500,762 977,116 675,226 1,348,648
Number LWD Cases 1 0 0 0
LWIR 0.40 0.00 0.00 0
RIR 0.80 0.20 1.18 0.15
Fatalities 0 0 0 1
Insulation
Recordables 0 4 2 7
Total Man-Hours 81,237 324,752 571,739 400,628
Number LWD Cases 0 0 0 3
LWIR 0 0 0 1.50
RIR 0 2.46 0.7 3.49
Fatalities 0 0 0 0
Roofing
Recordables 0 0 1 1
Total Man-Hours 128,938 137,307 185,498 127,557
Number LWD Cases 0 0 0 0
LWIR 0 0 0 0
RIR 0 0 1.08 1.57
Fatalities 0 0 0 1
All
Recordables 2 5 7 9
Total Man-Hours 808,584 1,561,714 1,561,251 2,017,232
Number LWD Cases 1 0 0 3
LWIR 0.25 0.00 0.00 0.30
RIR 0.49 0.64 0.90 0.89
Fatalities 0 0 0 2
Contractors Safety Statistics
Lost-Time Injury Frequency Rate (LTIFR) - Contractors 2014 2015 2016 2017
Contractor Man-Hours 808,584 1,561,714 1,561,251 2,017,232
LTIFR Contractors 1.24 0 0 1.49
Data Coverage: % of total contractors 100 100 100 100
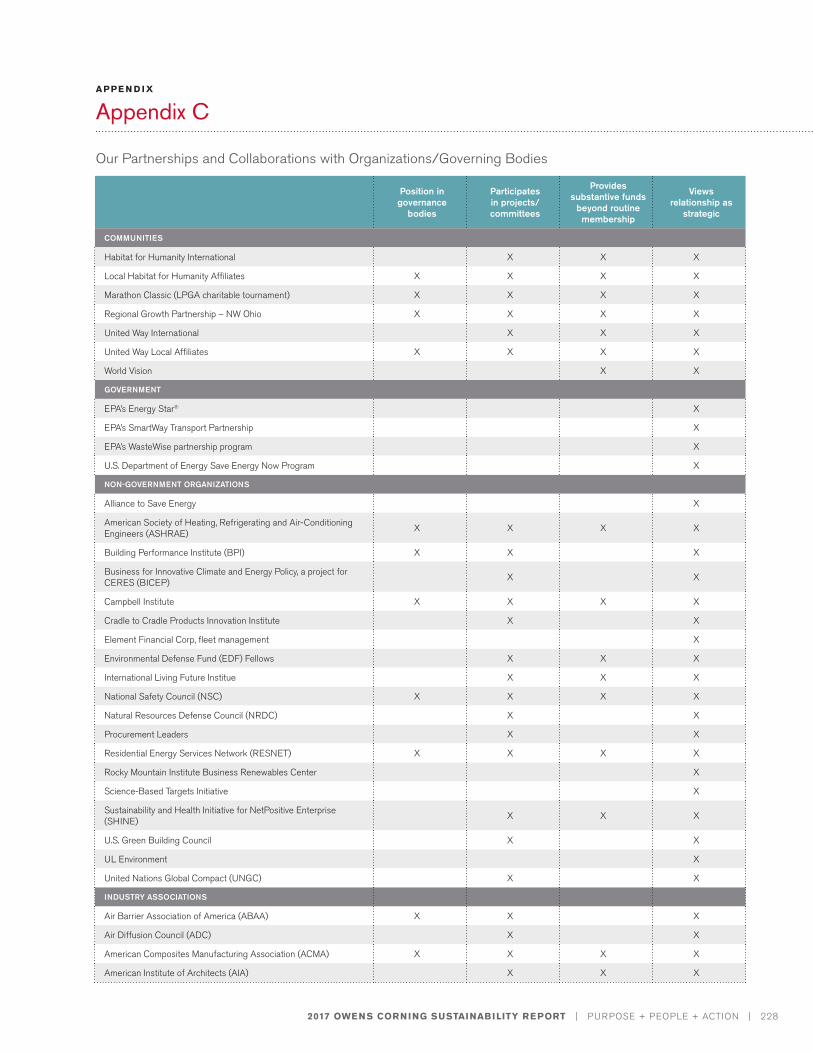
2017 OWENS CORNING SUSTAINABILITY REPORT | PURPOSE + PEOPLE + ACTION | 228
APPE N D I X
Appendix C
Position in governance
bodies
Participates in projects/ committees
Provides substantive funds
beyond routine membership
Views relationship as
strategic
COMMUNITIES
Habitat for Humanity International X X X
Local Habitat for Humanity Affiliates X X X X
Marathon Classic (LPGA charitable tournament) X X X X
Regional Growth Partnership – NW Ohio X X X X
United Way International X X X
United Way Local Affiliates X X X X
World Vision X X
GOVERNMENT
EPA’s Energy Star® X
EPA’s SmartWay Transport Partnership X
EPA’s WasteWise partnership program X
U.S. Department of Energy Save Energy Now Program X
NON-GOVERNMENT ORGANIZATIONS
Alliance to Save Energy X
American Society of Heating, Refrigerating and Air-Conditioning Engineers (ASHRAE) X X X X
Building Performance Institute (BPI) X X X
Business for Innovative Climate and Energy Policy, a project for CERES (BICEP) X X
Campbell Institute X X X X
Cradle to Cradle Products Innovation Institute X X
Element Financial Corp, fleet management X
Environmental Defense Fund (EDF) Fellows X X X
International Living Future Institue X X X
National Safety Council (NSC) X X X X
Natural Resources Defense Council (NRDC) X X
Procurement Leaders X X
Residential Energy Services Network (RESNET) X X X X
Rocky Mountain Institute Business Renewables Center X
Science-Based Targets Initiative X
Sustainability and Health Initiative for NetPositive Enterprise (SHINE) X X X
U.S. Green Building Council X X
UL Environment X
United Nations Global Compact (UNGC) X X
INDUSTRY ASSOCIATIONS
Air Barrier Association of America (ABAA) X X X
Air Diffusion Council (ADC) X X
American Composites Manufacturing Association (ACMA) X X X X
American Institute of Architects (AIA) X X X
Our Partnerships and Collaborations with Organizations/Governing Bodies
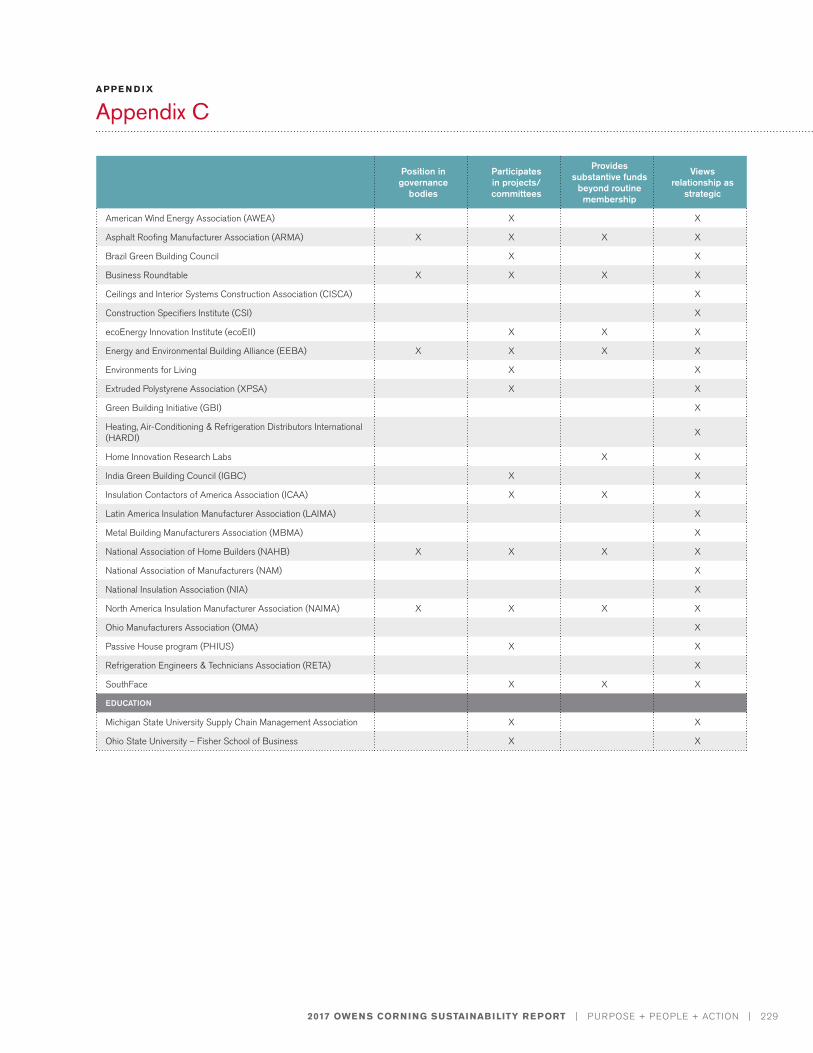
2017 OWENS CORNING SUSTAINABILITY REPORT | PURPOSE + PEOPLE + ACTION | 229
APPE N D I X
Appendix C
Position in governance
bodies
Participates in projects/ committees
Provides substantive funds
beyond routine membership
Views relationship as
strategic
American Wind Energy Association (AWEA) X X
Asphalt Roofing Manufacturer Association (ARMA) X X X X
Brazil Green Building Council X X
Business Roundtable X X X X
Ceilings and Interior Systems Construction Association (CISCA) X
Construction Specifiers Institute (CSI) X
ecoEnergy Innovation Institute (ecoEII) X X X
Energy and Environmental Building Alliance (EEBA) X X X X
Environments for Living X X
Extruded Polystyrene Association (XPSA) X X
Green Building Initiative (GBI) X
Heating, Air-Conditioning & Refrigeration Distributors International (HARDI) X
Home Innovation Research Labs X X
India Green Building Council (IGBC) X X
Insulation Contactors of America Association (ICAA) X X X
Latin America Insulation Manufacturer Association (LAIMA) X
Metal Building Manufacturers Association (MBMA) X
National Association of Home Builders (NAHB) X X X X
National Association of Manufacturers (NAM) X
National Insulation Association (NIA) X
North America Insulation Manufacturer Association (NAIMA) X X X X
Ohio Manufacturers Association (OMA) X
Passive House program (PHIUS) X X
Refrigeration Engineers & Technicians Association (RETA) X
SouthFace X X X
EDUCATION
Michigan State University Supply Chain Management Association X X
Ohio State University – Fisher School of Business X X
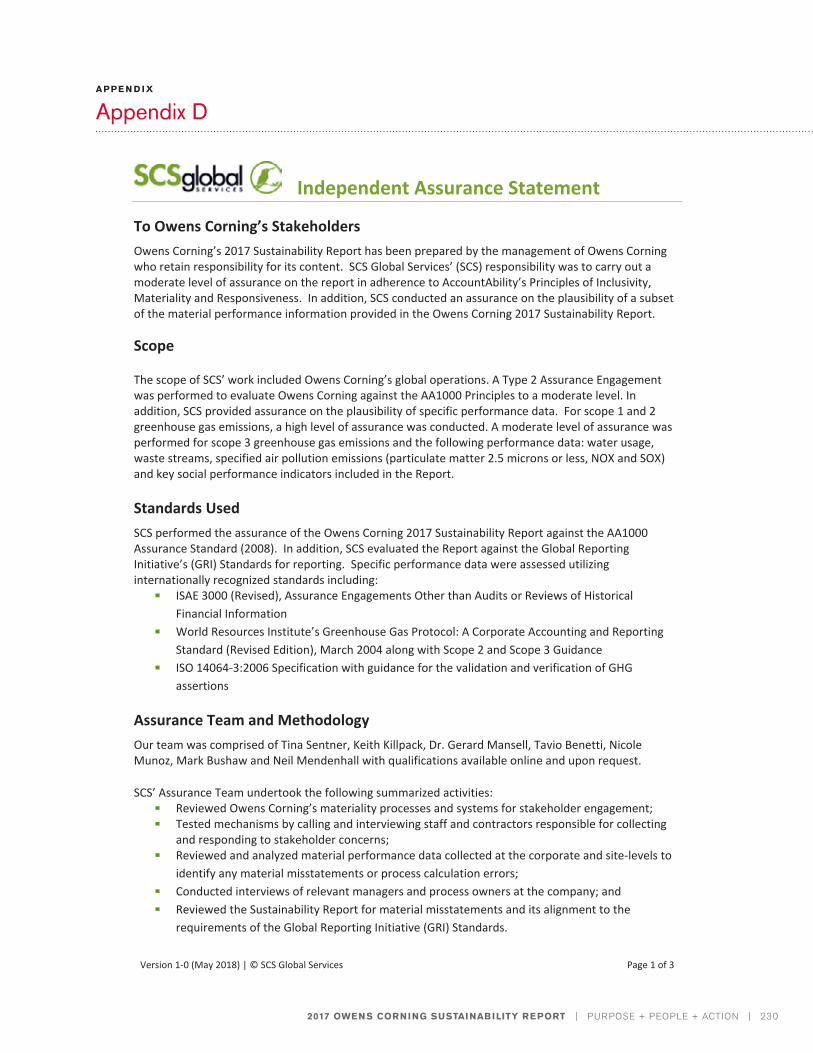
2017 OWENS CORNING SUSTAINABILITY REPORT | PURPOSE + PEOPLE + ACTION | 230
APPE N D I X
Appendix D
Version 1-0 (May 2018) | © SCS Global Services Page 1 of 3
Independent Assurance Statement
To Owens Corning’s Stakeholders Owens Corning’s 2017 Sustainability Report has been prepared by the management of Owens Corning who retain responsibility for its content. SCS Global Services’ (SCS) responsibility was to carry out a moderate level of assurance on the report in adherence to AccountAbility’s Principles of Inclusivity, Materiality and Responsiveness. In addition, SCS conducted an assurance on the plausibility of a subset of the material performance information provided in the Owens Corning 2017 Sustainability Report.
Scope
The scope of SCS’ work included Owens Corning’s global operations. A Type 2 Assurance Engagement was performed to evaluate Owens Corning against the AA1000 Principles to a moderate level. In addition, SCS provided assurance on the plausibility of specific performance data. For scope 1 and 2 greenhouse gas emissions, a high level of assurance was conducted. A moderate level of assurance was performed for scope 3 greenhouse gas emissions and the following performance data: water usage, waste streams, specified air pollution emissions (particulate matter 2.5 microns or less, NOX and SOX) and key social performance indicators included in the Report.
Standards Used SCS performed the assurance of the Owens Corning 2017 Sustainability Report against the AA1000 Assurance Standard (2008). In addition, SCS evaluated the Report against the Global Reporting Initiative’s (GRI) Standards for reporting. Specific performance data were assessed utilizing internationally recognized standards including:
ISAE 3000 (Revised), Assurance Engagements Other than Audits or Reviews of Historical Financial Information
World Resources Institute’s Greenhouse Gas Protocol: A Corporate Accounting and Reporting Standard (Revised Edition), March 2004 along with Scope 2 and Scope 3 Guidance
ISO 14064-3:2006 Specification with guidance for the validation and verification of GHG assertions
Assurance Team and Methodology Our team was comprised of Tina Sentner, Keith Killpack, Dr. Gerard Mansell, Tavio Benetti, Nicole Munoz, Mark Bushaw and Neil Mendenhall with qualifications available online and upon request.
SCS’ Assurance Team undertook the following summarized activities: Reviewed Owens Corning’s materiality processes and systems for stakeholder engagement; Tested mechanisms by calling and interviewing staff and contractors responsible for collecting
and responding to stakeholder concerns; Reviewed and analyzed material performance data collected at the corporate and site-levels to
identify any material misstatements or process calculation errors; Conducted interviews of relevant managers and process owners at the company; and Reviewed the Sustainability Report for material misstatements and its alignment to the
requirements of the Global Reporting Initiative (GRI) Standards.
2017 OWENS CORNING SUSTAINABILITY REPORT | PURPOSE + PEOPLE + ACTION | 231
APPE N D I X
Appendix D
Version 1-0 (May 2018) | © SCS Global Services Page 2 of 3
Limitations SCS tested systems, reviewed data, and performed limited recalculations based on internationally recognized sampling techniques which focus on risk and the materiality of the reported performance data. These techniques have allowed us to assure this Report to an overall moderate level which reduces the risk of our conclusions being in error but does not reduce it to zero.
Conclusions Based on the methodology and activities performed we have found that Owens Corning is adhering to AccountAbility’s Principles. A summary of our conclusions and evidence in support of these conclusions follows: Inclusivity: Owens Corning has effectively integrated stakeholders into the development of their products and processes as a strategy to improve performance. In addition, Owens Corning is aligned with best practices of corporate governance assisting them to acquire the requisite competencies for eliciting effective stakeholder participation. SCS reviewed sufficient evidence that competent outside firms and resources were used - when they were deemed necessary and/or more effective - for collecting material issues and eliciting stakeholder participation. Materiality: Substantial evidence exists of Owens Corning’s work to develop and implement a robust materiality process in 2015 with the assistance of competent outside firms. This work lead to the identification of material issues and stakeholders. In 2016 and 2017 this process was reviewed and supplemented with additional stakeholder outreach which lead to minor adjustments in the material issues in the 2017 report. Responsiveness: SCS reviewed a number of mechanisms in place for capturing information from stakeholders and responding to their concerns. These mechanisms were found to be effective and responsive. Evidence was available to show how reported information was acted on in a timely way. Specific email addresses and telephone lines are available for workers, customers and suppliers which can answer questions in real time and take in concerns. Violation reports are handled by a third party in order to ensure anonymity if requested. A sample of these systems were tested and proved to be easy to use and responsive. In addition, our review of the data and calculations in regard to Owens Corning’s reporting on greenhouse gas emissions, water use, waste, air pollution and social performance indicators found no evidence of material errors or misstatements that were not corrected prior to the publication of this Report. In particular, we found that reported scope 1 and 2 GHG emissions which we assessed at a high-level, are reliable.
Observations & Recommendations No material observations were left unaddressed prior to the publication of this Report. It is recommended that Owens Corning implement a materiality review procedure inclusive of a schedule and/or identification of significant company changes that would trigger more thorough materiality reviews. It was observed that materiality processes were sufficiently completed at five-year intervals with updates being conducted annually in the interim years, however there was no evidence of a procedure to indicate the accepted timing and needs for such activities.
2017 OWENS CORNING SUSTAINABILITY REPORT | PURPOSE + PEOPLE + ACTION | 232
APPE N D I X
Appendix D
Version 1-0 (May 2018) | © SCS Global Services Page 3 of 3
Independence SCS Global Services is an independent and internationally accredited conformance assessment body. All members of the assurance team are internally reviewed to ensure they are free from conflicts of interest. SCS has no financial dependence on Owens Corning beyond the scope of this engagement and a limited number of independent product assessments and certifications it performs annually.
Declaration
___________________________ Neil Mendenhall Associate Certified Sustainability Assurance Practitioner (ACSAP) SCS Global Services Emeryville, California - May 2018
PHOTO CREDIT:
T. Andy Whisenant | Gastonia, North Carolina
The photographer’s daughter enjoys the view of Linville Gorge in western North Carolina
GRI Index
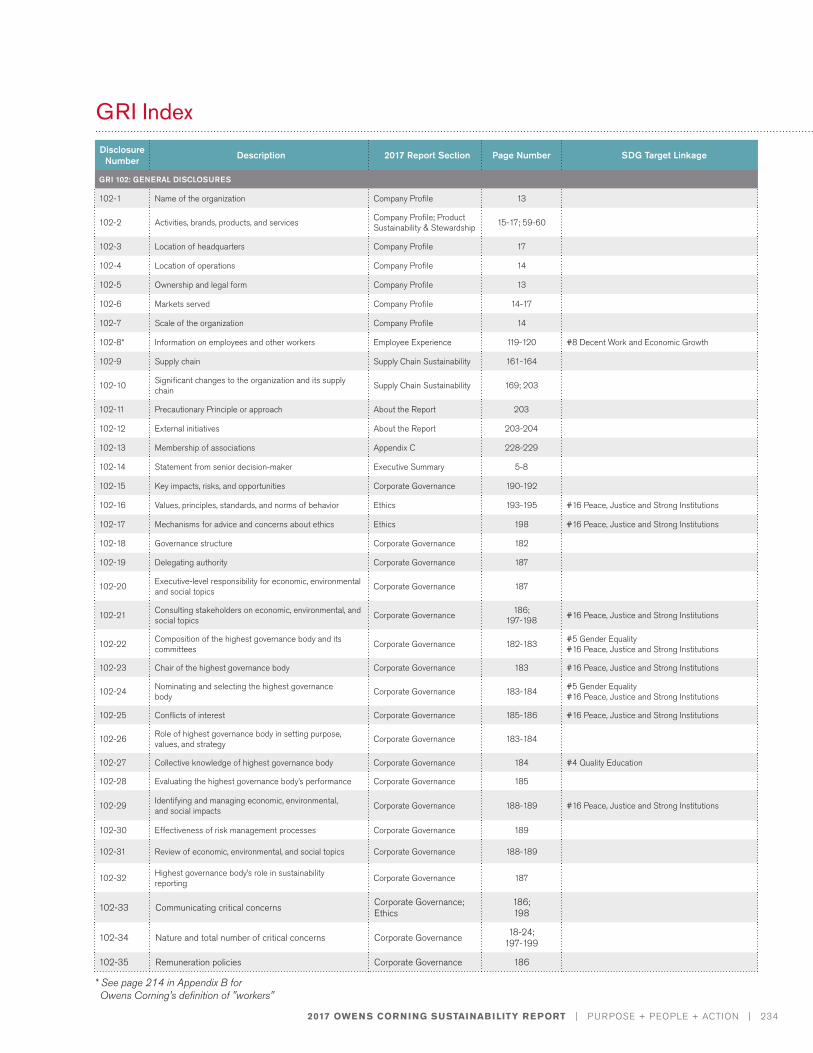
2017 OWENS CORNING SUSTAINABILITY REPORT | PURPOSE + PEOPLE + ACTION | 234
GRI IndexDisclosure
Number Description 2017 Report Section Page Number SDG Target Linkage
GRI 102: GENERAL DISCLOSURES
102-1 Name of the organization Company Profile 13
102-2 Activities, brands, products, and services Company Profile; Product Sustainability & Stewardship 15-17; 59-60
102-3 Location of headquarters Company Profile 17
102-4 Location of operations Company Profile 14
102-5 Ownership and legal form Company Profile 13
102-6 Markets served Company Profile 14-17
102-7 Scale of the organization Company Profile 14
102-8* Information on employees and other workers Employee Experience 119-120 #8 Decent Work and Economic Growth
102-9 Supply chain Supply Chain Sustainability 161-164
102-10 Significant changes to the organization and its supply chain Supply Chain Sustainability 169; 203
102-11 Precautionary Principle or approach About the Report 203
102-12 External initiatives About the Report 203-204
102-13 Membership of associations Appendix C 228-229
102-14 Statement from senior decision-maker Executive Summary 5-8
102-15 Key impacts, risks, and opportunities Corporate Governance 190-192
102-16 Values, principles, standards, and norms of behavior Ethics 193-195 #16 Peace, Justice and Strong Institutions
102-17 Mechanisms for advice and concerns about ethics Ethics 198 #16 Peace, Justice and Strong Institutions
102-18 Governance structure Corporate Governance 182
102-19 Delegating authority Corporate Governance 187
102-20 Executive-level responsibility for economic, environmental and social topics Corporate Governance 187
102-21 Consulting stakeholders on economic, environmental, and social topics Corporate Governance 186;
197-198 #16 Peace, Justice and Strong Institutions
102-22 Composition of the highest governance body and its committees Corporate Governance 182-183 #5 Gender Equality
#16 Peace, Justice and Strong Institutions
102-23 Chair of the highest governance body Corporate Governance 183 #16 Peace, Justice and Strong Institutions
102-24 Nominating and selecting the highest governance body Corporate Governance 183-184 #5 Gender Equality
#16 Peace, Justice and Strong Institutions
102-25 Conflicts of interest Corporate Governance 185-186 #16 Peace, Justice and Strong Institutions
102-26 Role of highest governance body in setting purpose, values, and strategy Corporate Governance 183-184
102-27 Collective knowledge of highest governance body Corporate Governance 184 #4 Quality Education
102-28 Evaluating the highest governance body’s performance Corporate Governance 185
102-29 Identifying and managing economic, environmental, and social impacts Corporate Governance 188-189 #16 Peace, Justice and Strong Institutions
102-30 Effectiveness of risk management processes Corporate Governance 189
102-31 Review of economic, environmental, and social topics Corporate Governance 188-189
102-32 Highest governance body’s role in sustainability reporting Corporate Governance 187
102-33 Communicating critical concerns Corporate Governance; Ethics
186; 198
102-34 Nature and total number of critical concerns Corporate Governance 18-24; 197-199
102-35 Remuneration policies Corporate Governance 186
* See page 214 in Appendix B for Owens Corning's definition of "workers"
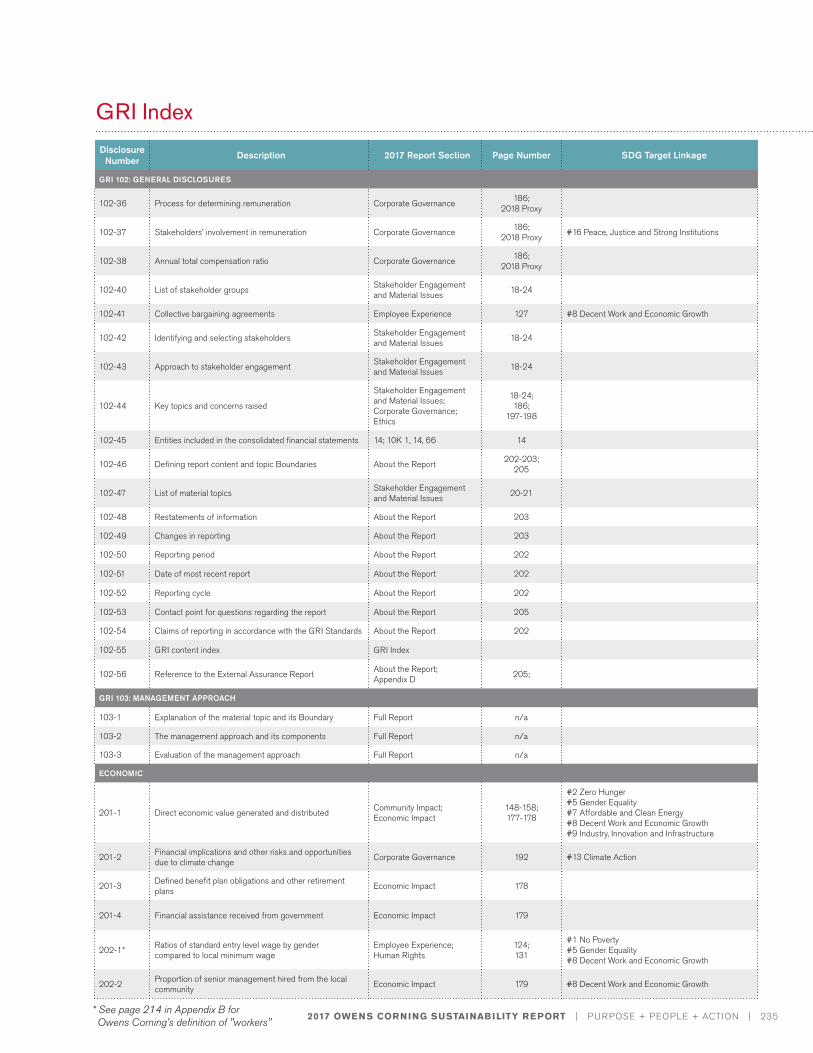
2017 OWENS CORNING SUSTAINABILITY REPORT | PURPOSE + PEOPLE + ACTION | 235
GRI IndexDisclosure
Number Description 2017 Report Section Page Number SDG Target Linkage
GRI 102: GENERAL DISCLOSURES
102-36 Process for determining remuneration Corporate Governance 186; 2018 Proxy
102-37 Stakeholders’ involvement in remuneration Corporate Governance 186; 2018 Proxy #16 Peace, Justice and Strong Institutions
102-38 Annual total compensation ratio Corporate Governance 186; 2018 Proxy
102-40 List of stakeholder groups Stakeholder Engagement and Material Issues 18-24
102-41 Collective bargaining agreements Employee Experience 127 #8 Decent Work and Economic Growth
102-42 Identifying and selecting stakeholders Stakeholder Engagement and Material Issues 18-24
102-43 Approach to stakeholder engagement Stakeholder Engagement and Material Issues 18-24
102-44 Key topics and concerns raised
Stakeholder Engagement and Material Issues; Corporate Governance; Ethics
18-24; 186;
197-198
102-45 Entities included in the consolidated financial statements 14; 10K 1, 14, 66 14
102-46 Defining report content and topic Boundaries About the Report 202-203; 205
102-47 List of material topics Stakeholder Engagement and Material Issues 20-21
102-48 Restatements of information About the Report 203
102-49 Changes in reporting About the Report 203
102-50 Reporting period About the Report 202
102-51 Date of most recent report About the Report 202
102-52 Reporting cycle About the Report 202
102-53 Contact point for questions regarding the report About the Report 205
102-54 Claims of reporting in accordance with the GRI Standards About the Report 202
102-55 GRI content index GRI Index
102-56 Reference to the External Assurance Report About the Report; Appendix D 205;
GRI 103: MANAGEMENT APPROACH
103-1 Explanation of the material topic and its Boundary Full Report n/a
103-2 The management approach and its components Full Report n/a
103-3 Evaluation of the management approach Full Report n/a
ECONOMIC
201-1 Direct economic value generated and distributed Community Impact; Economic Impact
148-158; 177-178
#2 Zero Hunger #5 Gender Equality #7 Affordable and Clean Energy #8 Decent Work and Economic Growth #9 Industry, Innovation and Infrastructure
201-2 Financial implications and other risks and opportunities due to climate change Corporate Governance 192 #13 Climate Action
201-3 Defined benefit plan obligations and other retirement plans Economic Impact 178
201-4 Financial assistance received from government Economic Impact 179
202-1* Ratios of standard entry level wage by gender compared to local minimum wage
Employee Experience; Human Rights
124; 131
#1 No Poverty #5 Gender Equality #8 Decent Work and Economic Growth
202-2 Proportion of senior management hired from the local community Economic Impact 179 #8 Decent Work and Economic Growth
* See page 214 in Appendix B for Owens Corning's definition of "workers"
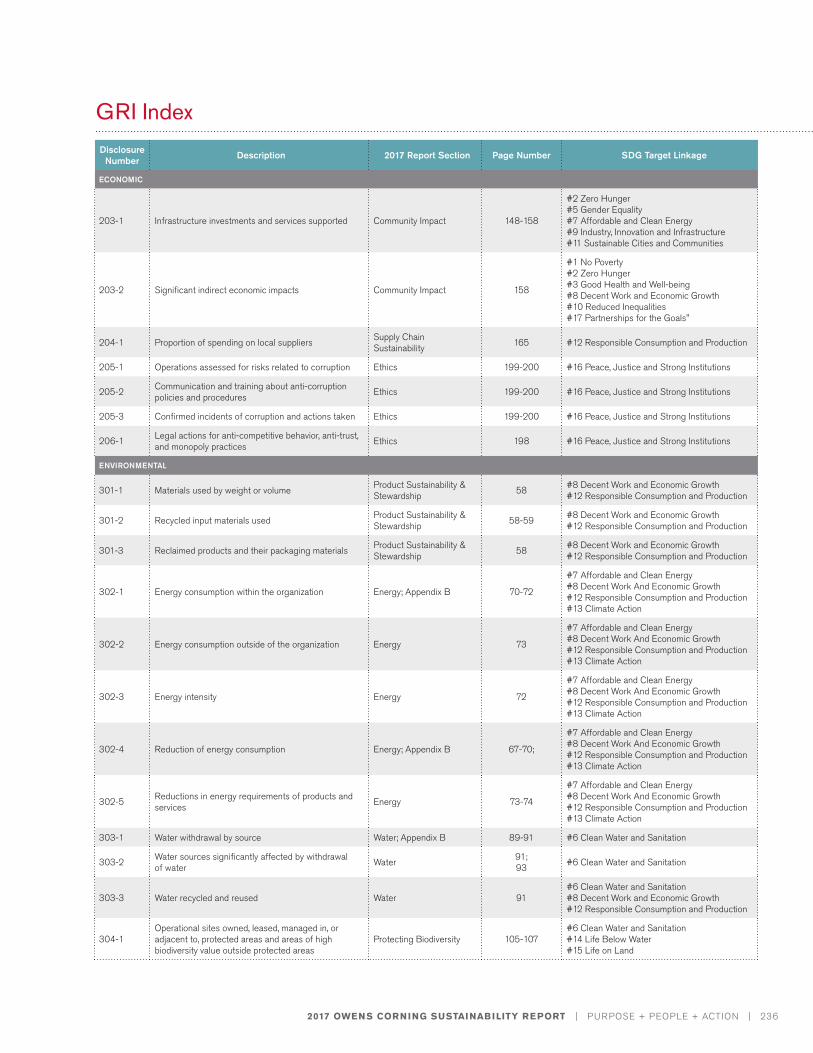
2017 OWENS CORNING SUSTAINABILITY REPORT | PURPOSE + PEOPLE + ACTION | 236
GRI IndexDisclosure
Number Description 2017 Report Section Page Number SDG Target Linkage
ECONOMIC
203-1 Infrastructure investments and services supported Community Impact 148-158
#2 Zero Hunger #5 Gender Equality #7 Affordable and Clean Energy #9 Industry, Innovation and Infrastructure #11 Sustainable Cities and Communities
203-2 Significant indirect economic impacts Community Impact 158
#1 No Poverty #2 Zero Hunger #3 Good Health and Well-being #8 Decent Work and Economic Growth #10 Reduced Inequalities #17 Partnerships for the Goals"
204-1 Proportion of spending on local suppliers Supply Chain Sustainability 165 #12 Responsible Consumption and Production
205-1 Operations assessed for risks related to corruption Ethics 199-200 #16 Peace, Justice and Strong Institutions
205-2 Communication and training about anti-corruption policies and procedures Ethics 199-200 #16 Peace, Justice and Strong Institutions
205-3 Confirmed incidents of corruption and actions taken Ethics 199-200 #16 Peace, Justice and Strong Institutions
206-1 Legal actions for anti-competitive behavior, anti-trust, and monopoly practices Ethics 198 #16 Peace, Justice and Strong Institutions
ENVIRONMENTAL
301-1 Materials used by weight or volume Product Sustainability & Stewardship 58 #8 Decent Work and Economic Growth
#12 Responsible Consumption and Production
301-2 Recycled input materials used Product Sustainability & Stewardship 58-59 #8 Decent Work and Economic Growth
#12 Responsible Consumption and Production
301-3 Reclaimed products and their packaging materials Product Sustainability & Stewardship 58 #8 Decent Work and Economic Growth
#12 Responsible Consumption and Production
302-1 Energy consumption within the organization Energy; Appendix B 70-72
#7 Affordable and Clean Energy #8 Decent Work And Economic Growth #12 Responsible Consumption and Production #13 Climate Action
302-2 Energy consumption outside of the organization Energy 73
#7 Affordable and Clean Energy #8 Decent Work And Economic Growth #12 Responsible Consumption and Production #13 Climate Action
302-3 Energy intensity Energy 72
#7 Affordable and Clean Energy #8 Decent Work And Economic Growth #12 Responsible Consumption and Production #13 Climate Action
302-4 Reduction of energy consumption Energy; Appendix B 67-70;
#7 Affordable and Clean Energy #8 Decent Work And Economic Growth #12 Responsible Consumption and Production #13 Climate Action
302-5 Reductions in energy requirements of products and services Energy 73-74
#7 Affordable and Clean Energy #8 Decent Work And Economic Growth #12 Responsible Consumption and Production #13 Climate Action
303-1 Water withdrawal by source Water; Appendix B 89-91 #6 Clean Water and Sanitation
303-2 Water sources significantly affected by withdrawal of water Water 91;
93 #6 Clean Water and Sanitation
303-3 Water recycled and reused Water 91#6 Clean Water and Sanitation #8 Decent Work and Economic Growth #12 Responsible Consumption and Production
304-1Operational sites owned, leased, managed in, or adjacent to, protected areas and areas of high biodiversity value outside protected areas
Protecting Biodiversity 105-107#6 Clean Water and Sanitation #14 Life Below Water #15 Life on Land
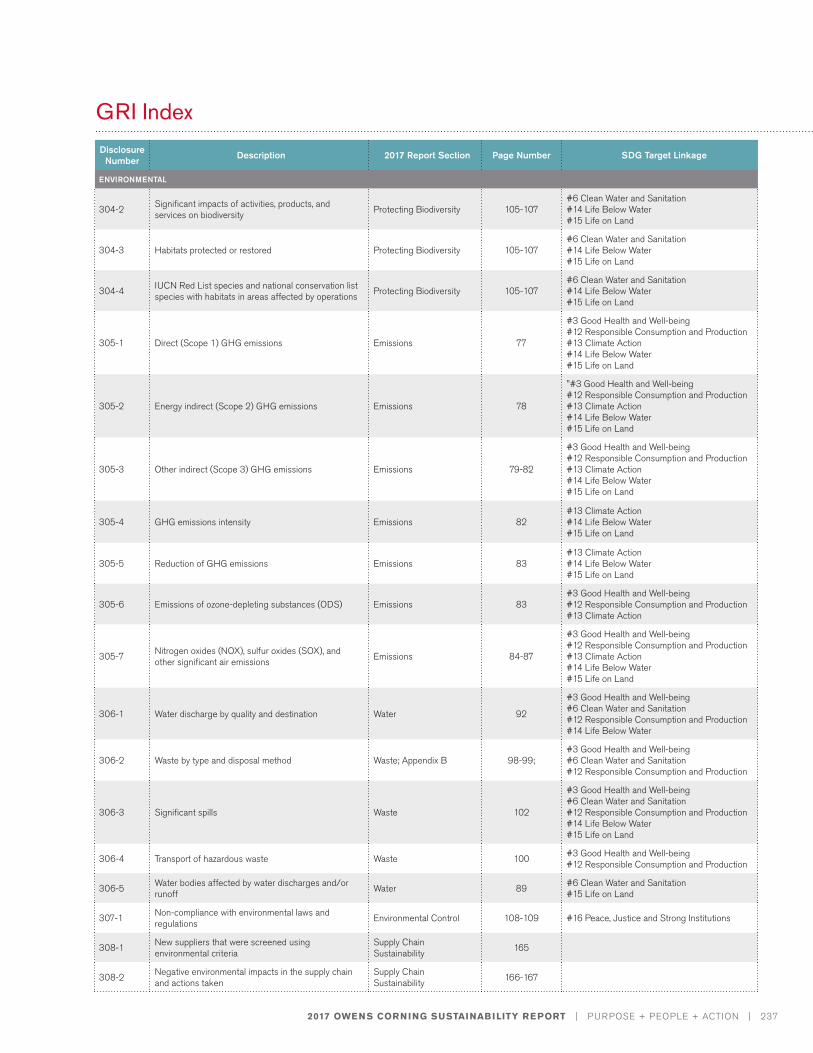
2017 OWENS CORNING SUSTAINABILITY REPORT | PURPOSE + PEOPLE + ACTION | 237
GRI IndexDisclosure
Number Description 2017 Report Section Page Number SDG Target Linkage
ENVIRONMENTAL
304-2 Significant impacts of activities, products, and services on biodiversity Protecting Biodiversity 105-107
#6 Clean Water and Sanitation #14 Life Below Water #15 Life on Land
304-3 Habitats protected or restored Protecting Biodiversity 105-107#6 Clean Water and Sanitation #14 Life Below Water #15 Life on Land
304-4 IUCN Red List species and national conservation list species with habitats in areas affected by operations Protecting Biodiversity 105-107
#6 Clean Water and Sanitation #14 Life Below Water #15 Life on Land
305-1 Direct (Scope 1) GHG emissions Emissions 77
#3 Good Health and Well-being #12 Responsible Consumption and Production #13 Climate Action #14 Life Below Water #15 Life on Land
305-2 Energy indirect (Scope 2) GHG emissions Emissions 78
"#3 Good Health and Well-being #12 Responsible Consumption and Production #13 Climate Action #14 Life Below Water #15 Life on Land
305-3 Other indirect (Scope 3) GHG emissions Emissions 79-82
#3 Good Health and Well-being #12 Responsible Consumption and Production #13 Climate Action #14 Life Below Water #15 Life on Land
305-4 GHG emissions intensity Emissions 82#13 Climate Action #14 Life Below Water #15 Life on Land
305-5 Reduction of GHG emissions Emissions 83#13 Climate Action #14 Life Below Water #15 Life on Land
305-6 Emissions of ozone-depleting substances (ODS) Emissions 83#3 Good Health and Well-being #12 Responsible Consumption and Production #13 Climate Action
305-7 Nitrogen oxides (NOX), sulfur oxides (SOX), and other significant air emissions Emissions 84-87
#3 Good Health and Well-being #12 Responsible Consumption and Production #13 Climate Action #14 Life Below Water #15 Life on Land
306-1 Water discharge by quality and destination Water 92
#3 Good Health and Well-being #6 Clean Water and Sanitation #12 Responsible Consumption and Production #14 Life Below Water
306-2 Waste by type and disposal method Waste; Appendix B 98-99;#3 Good Health and Well-being #6 Clean Water and Sanitation #12 Responsible Consumption and Production
306-3 Significant spills Waste 102
#3 Good Health and Well-being #6 Clean Water and Sanitation #12 Responsible Consumption and Production #14 Life Below Water #15 Life on Land
306-4 Transport of hazardous waste Waste 100 #3 Good Health and Well-being #12 Responsible Consumption and Production
306-5 Water bodies affected by water discharges and/or runoff Water 89 #6 Clean Water and Sanitation
#15 Life on Land
307-1 Non-compliance with environmental laws and regulations Environmental Control 108-109 #16 Peace, Justice and Strong Institutions
308-1 New suppliers that were screened using environmental criteria
Supply Chain Sustainability 165
308-2 Negative environmental impacts in the supply chain and actions taken
Supply Chain Sustainability 166-167
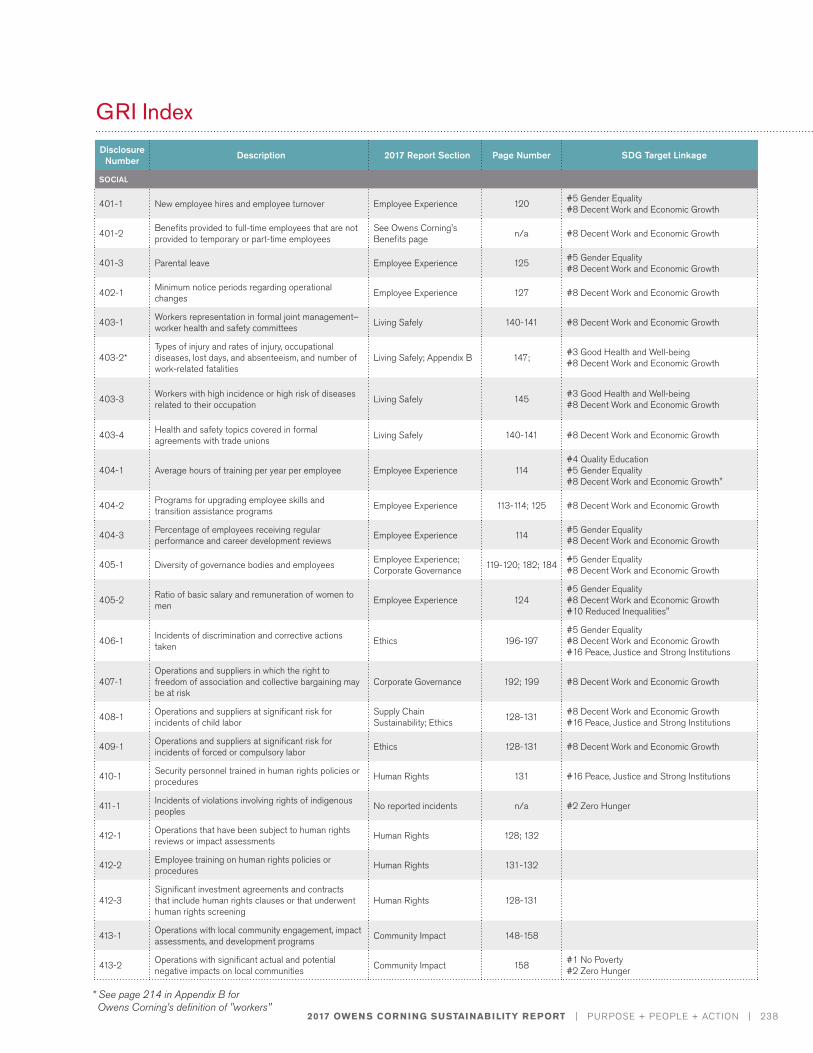
2017 OWENS CORNING SUSTAINABILITY REPORT | PURPOSE + PEOPLE + ACTION | 238
GRI IndexDisclosure
Number Description 2017 Report Section Page Number SDG Target Linkage
SOCIAL
401-1 New employee hires and employee turnover Employee Experience 120 #5 Gender Equality #8 Decent Work and Economic Growth
401-2 Benefits provided to full-time employees that are not provided to temporary or part-time employees
See Owens Corning's Benefits page n/a #8 Decent Work and Economic Growth
401-3 Parental leave Employee Experience 125 #5 Gender Equality #8 Decent Work and Economic Growth
402-1 Minimum notice periods regarding operational changes Employee Experience 127 #8 Decent Work and Economic Growth
403-1 Workers representation in formal joint management–worker health and safety committees Living Safely 140-141 #8 Decent Work and Economic Growth
403-2*Types of injury and rates of injury, occupational diseases, lost days, and absenteeism, and number of work-related fatalities
Living Safely; Appendix B 147; #3 Good Health and Well-being #8 Decent Work and Economic Growth
403-3 Workers with high incidence or high risk of diseases related to their occupation Living Safely 145 #3 Good Health and Well-being
#8 Decent Work and Economic Growth
403-4 Health and safety topics covered in formal agreements with trade unions Living Safely 140-141 #8 Decent Work and Economic Growth
404-1 Average hours of training per year per employee Employee Experience 114#4 Quality Education #5 Gender Equality #8 Decent Work and Economic Growth"
404-2 Programs for upgrading employee skills and transition assistance programs Employee Experience 113-114; 125 #8 Decent Work and Economic Growth
404-3 Percentage of employees receiving regular performance and career development reviews Employee Experience 114 #5 Gender Equality
#8 Decent Work and Economic Growth
405-1 Diversity of governance bodies and employees Employee Experience; Corporate Governance 119-120; 182; 184 #5 Gender Equality
#8 Decent Work and Economic Growth
405-2 Ratio of basic salary and remuneration of women to men Employee Experience 124
#5 Gender Equality #8 Decent Work and Economic Growth #10 Reduced Inequalities"
406-1 Incidents of discrimination and corrective actions taken Ethics 196-197
#5 Gender Equality #8 Decent Work and Economic Growth #16 Peace, Justice and Strong Institutions
407-1Operations and suppliers in which the right to freedom of association and collective bargaining may be at risk
Corporate Governance 192; 199 #8 Decent Work and Economic Growth
408-1 Operations and suppliers at significant risk for incidents of child labor
Supply Chain Sustainability; Ethics 128-131 #8 Decent Work and Economic Growth
#16 Peace, Justice and Strong Institutions
409-1 Operations and suppliers at significant risk for incidents of forced or compulsory labor Ethics 128-131 #8 Decent Work and Economic Growth
410-1 Security personnel trained in human rights policies or procedures Human Rights 131 #16 Peace, Justice and Strong Institutions
411-1 Incidents of violations involving rights of indigenous peoples No reported incidents n/a #2 Zero Hunger
412-1 Operations that have been subject to human rights reviews or impact assessments Human Rights 128; 132
412-2 Employee training on human rights policies or procedures Human Rights 131-132
412-3Significant investment agreements and contracts that include human rights clauses or that underwent human rights screening
Human Rights 128-131
413-1 Operations with local community engagement, impact assessments, and development programs Community Impact 148-158
413-2 Operations with significant actual and potential negative impacts on local communities Community Impact 158 #1 No Poverty
#2 Zero Hunger
* See page 214 in Appendix B for Owens Corning's definition of "workers"
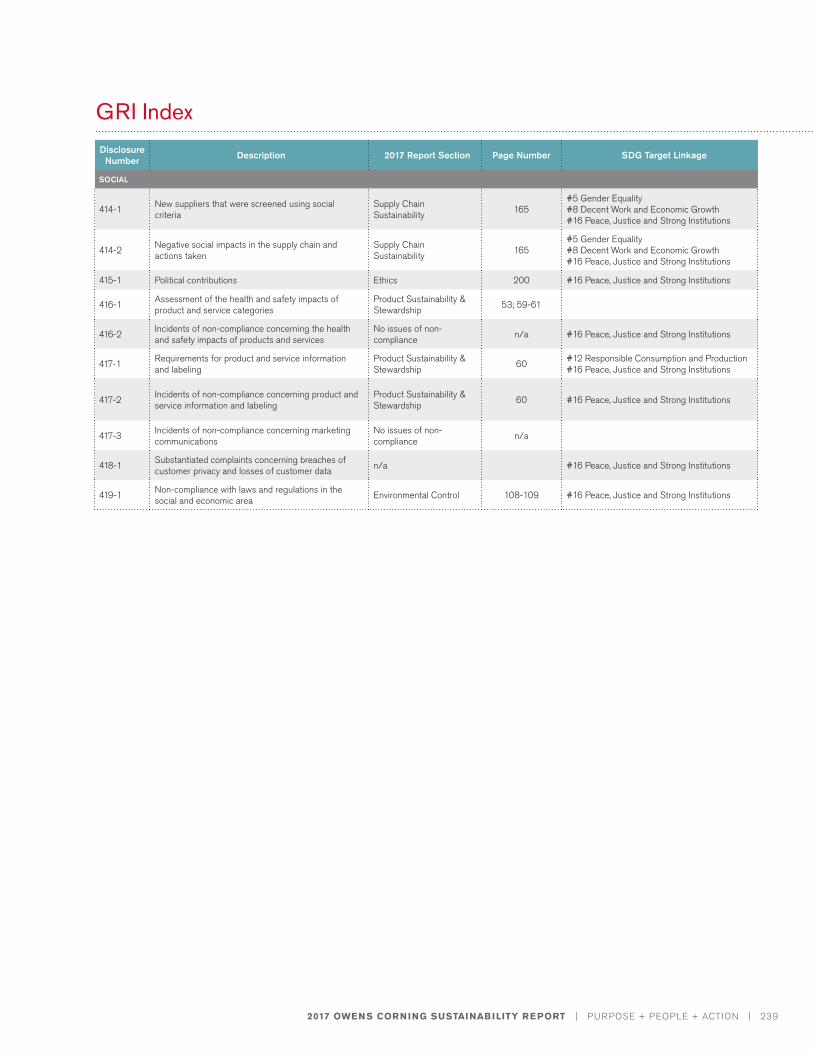
2017 OWENS CORNING SUSTAINABILITY REPORT | PURPOSE + PEOPLE + ACTION | 239
GRI IndexDisclosure
Number Description 2017 Report Section Page Number SDG Target Linkage
SOCIAL
414-1 New suppliers that were screened using social criteria
Supply Chain Sustainability 165
#5 Gender Equality #8 Decent Work and Economic Growth #16 Peace, Justice and Strong Institutions
414-2 Negative social impacts in the supply chain and actions taken
Supply Chain Sustainability 165
#5 Gender Equality #8 Decent Work and Economic Growth #16 Peace, Justice and Strong Institutions
415-1 Political contributions Ethics 200 #16 Peace, Justice and Strong Institutions
416-1 Assessment of the health and safety impacts of product and service categories
Product Sustainability & Stewardship 53; 59-61
416-2 Incidents of non-compliance concerning the health and safety impacts of products and services
No issues of non-compliance n/a #16 Peace, Justice and Strong Institutions
417-1 Requirements for product and service information and labeling
Product Sustainability & Stewardship 60 #12 Responsible Consumption and Production
#16 Peace, Justice and Strong Institutions
417-2 Incidents of non-compliance concerning product and service information and labeling
Product Sustainability & Stewardship 60 #16 Peace, Justice and Strong Institutions
417-3 Incidents of non-compliance concerning marketing communications
No issues of non-compliance n/a
418-1 Substantiated complaints concerning breaches of customer privacy and losses of customer data n/a #16 Peace, Justice and Strong Institutions
419-1 Non-compliance with laws and regulations in the social and economic area Environmental Control 108-109 #16 Peace, Justice and Strong Institutions