Embed Size (px)
Citation preview
PURPOSE
Joint Transportation Committee (JTC) directed to:
• Conduct a study of the Washington State Ferry (WSF) fares that
recommends the most appropriate fare media for use with the
reservation system and the implementation of demand
management pricing and interoperability with other payment
methods
• Include direct collaboration with members of the Washington
State Transportation Commission (WSTC) (Transportation Budget)
DEFINITIONS
Interoperability Degree to which system accepts fare media of other systems and vice versa
Fare Media The products that are accepted for payment
Fare Structure The structure and policies setting the fares & to
whom they are charged
CUSTOMERS
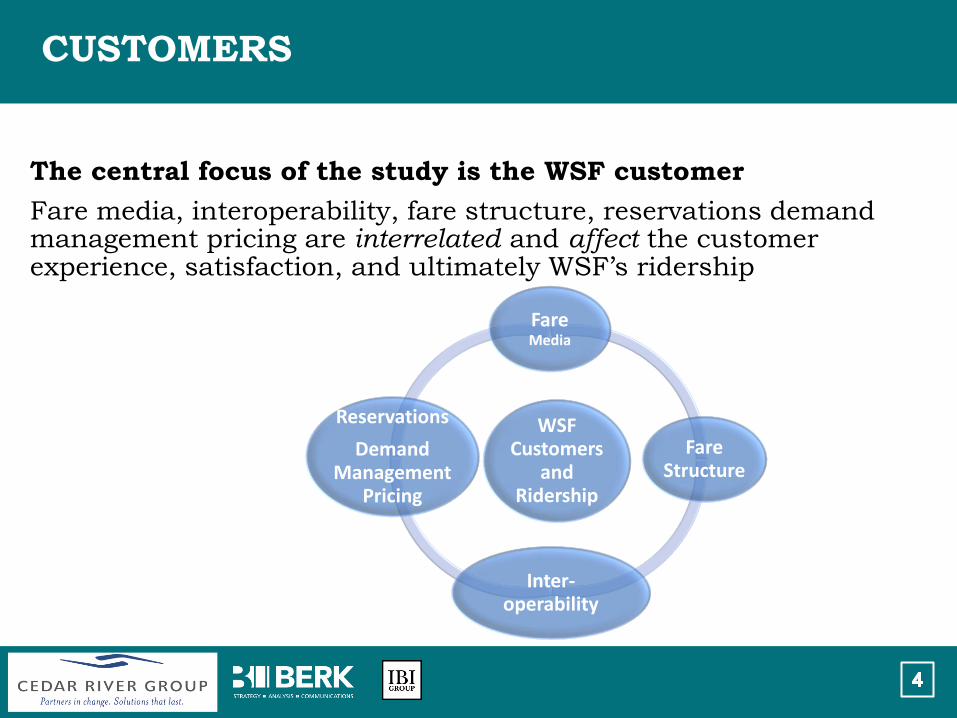
The central focus of the study is the WSF customer
Fare media, interoperability, fare structure, reservations demand management pricing are interrelated and affect the customer experience, satisfaction, and ultimately WSF’s ridership
WSF
Customers and
Ridership
Fare Media
Fare Structure
Inter-operability
Reservations
Demand Management
Pricing
CUSTOMERS AND RIDERSHIP
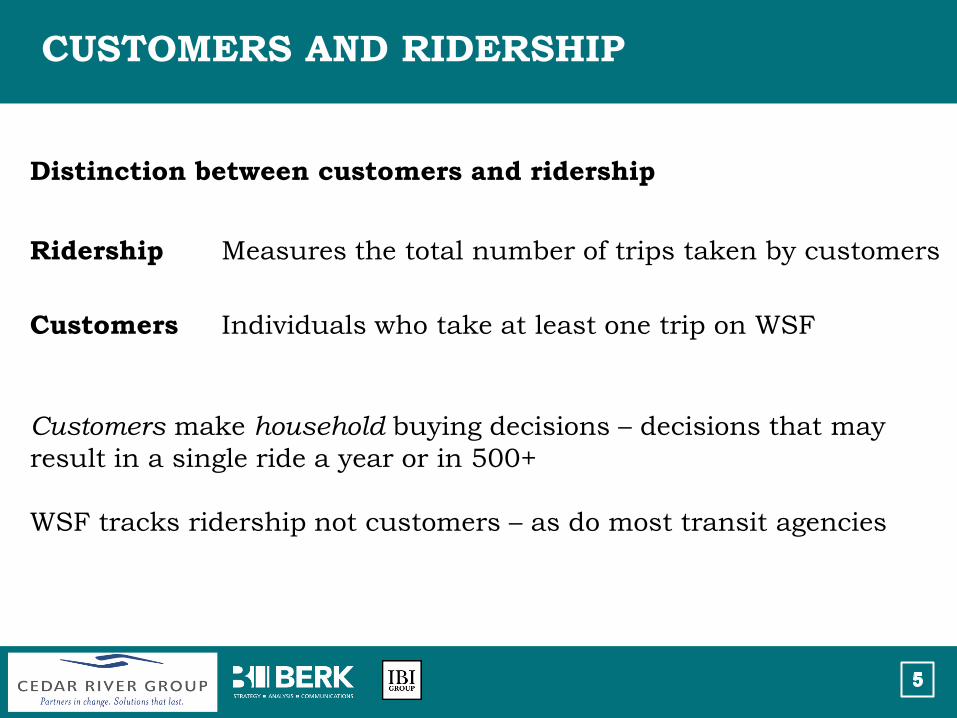
Distinction between customers and ridership
Ridership Measures the total number of trips taken by customers
Customers Individuals who take at least one trip on WSF
Customers make household buying decisions – decisions that may
result in a single ride a year or in 500+
WSF tracks ridership not customers – as do most transit agencies
CUSTOMERS AND RIDERSHIP
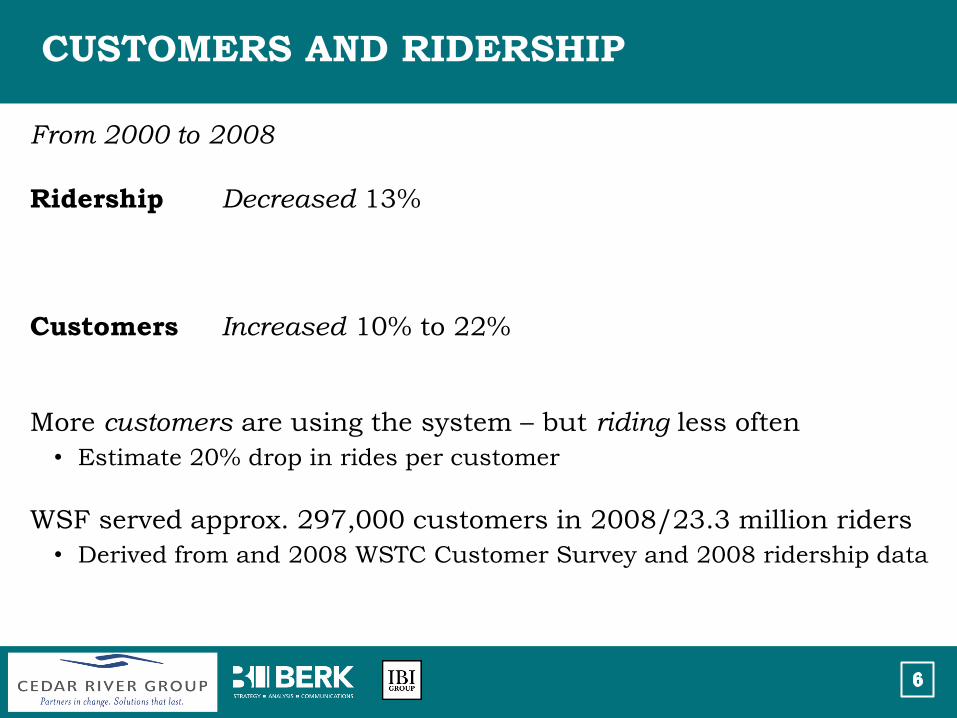
From 2000 to 2008
Ridership Decreased 13%
Customers Increased 10% to 22%
More customers are using the system – but riding less often
• Estimate 20% drop in rides per customer
WSF served approx. 297,000 customers in 2008/23.3 million riders
• Derived from and 2008 WSTC Customer Survey and 2008 ridership data
WSF CUSTOMERS ARE SEGMENTED
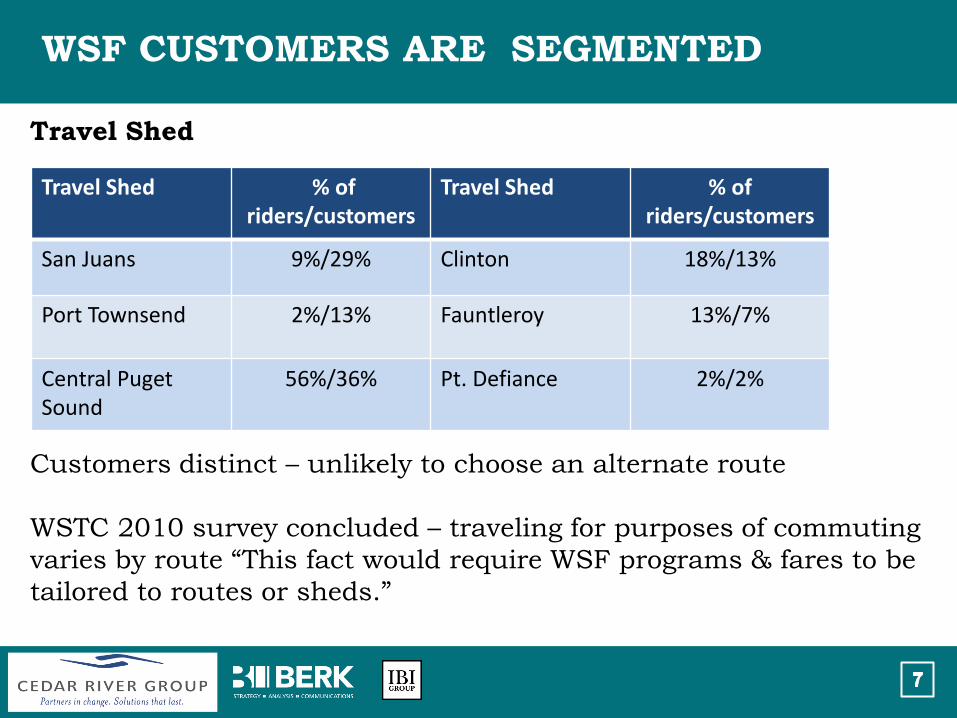
Travel Shed
Customers distinct – unlikely to choose an alternate route
WSTC 2010 survey concluded – traveling for purposes of commuting
varies by route “This fact would require WSF programs & fares to be
tailored to routes or sheds.”
Travel Shed % of riders/customers
Travel Shed % of riders/customers
San Juans 9%/29% Clinton 18%/13%
Port Townsend 2%/13% Fauntleroy 13%/7%
Central Puget Sound
56%/36% Pt. Defiance 2%/2%
WSF CUSTOMERS ARE SEGMENTED
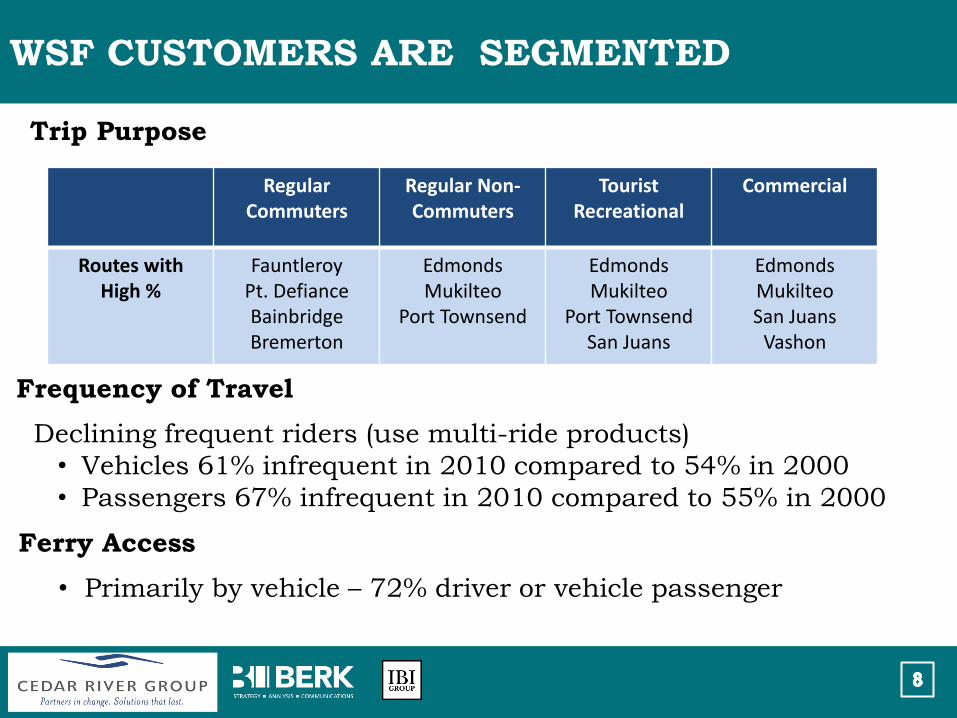
Trip Purpose
Regular Commuters
Regular Non-Commuters
Tourist Recreational
Commercial
Routes with High %
Fauntleroy Pt. Defiance Bainbridge Bremerton
Edmonds Mukilteo
Port Townsend
Edmonds Mukilteo
Port Townsend San Juans
Edmonds Mukilteo San Juans
Vashon
Frequency of Travel
Declining frequent riders (use multi-ride products)
• Vehicles 61% infrequent in 2010 compared to 54% in 2000
• Passengers 67% infrequent in 2010 compared to 55% in 2000
Ferry Access
• Primarily by vehicle – 72% driver or vehicle passenger
RIDERSHIP
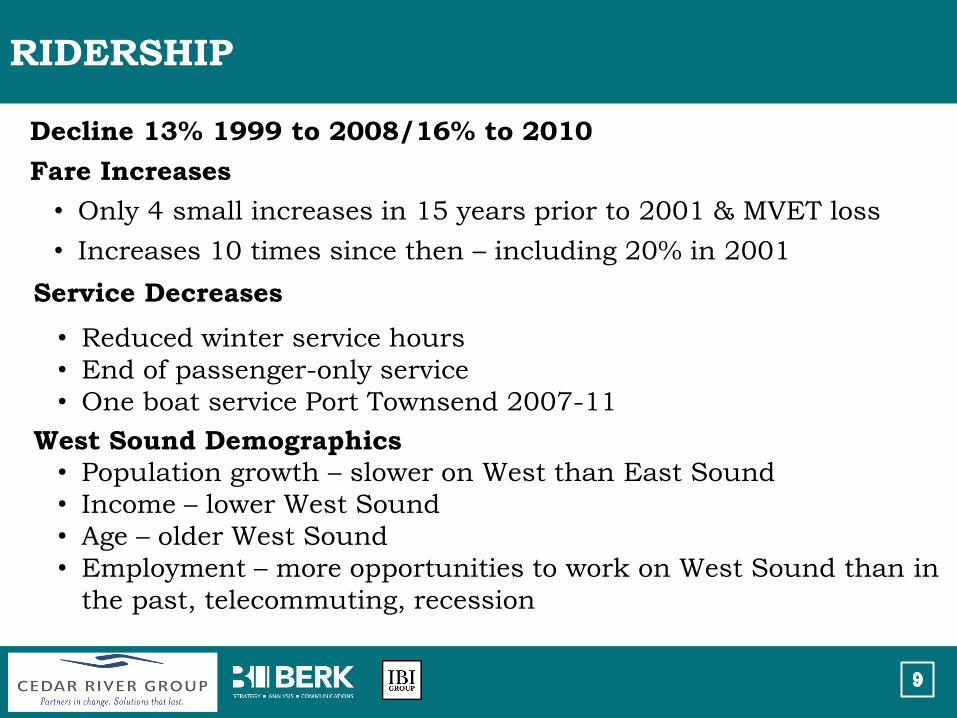
Decline 13% 1999 to 2008/16% to 2010
Fare Increases
• Only 4 small increases in 15 years prior to 2001 & MVET loss
• Increases 10 times since then – including 20% in 2001
Service Decreases
• Reduced winter service hours
• End of passenger-only service
• One boat service Port Townsend 2007-11
West Sound Demographics
• Population growth – slower on West than East Sound
• Income – lower West Sound
• Age – older West Sound
• Employment – more opportunities to work on West Sound than in
the past, telecommuting, recession
RIDERSHIP
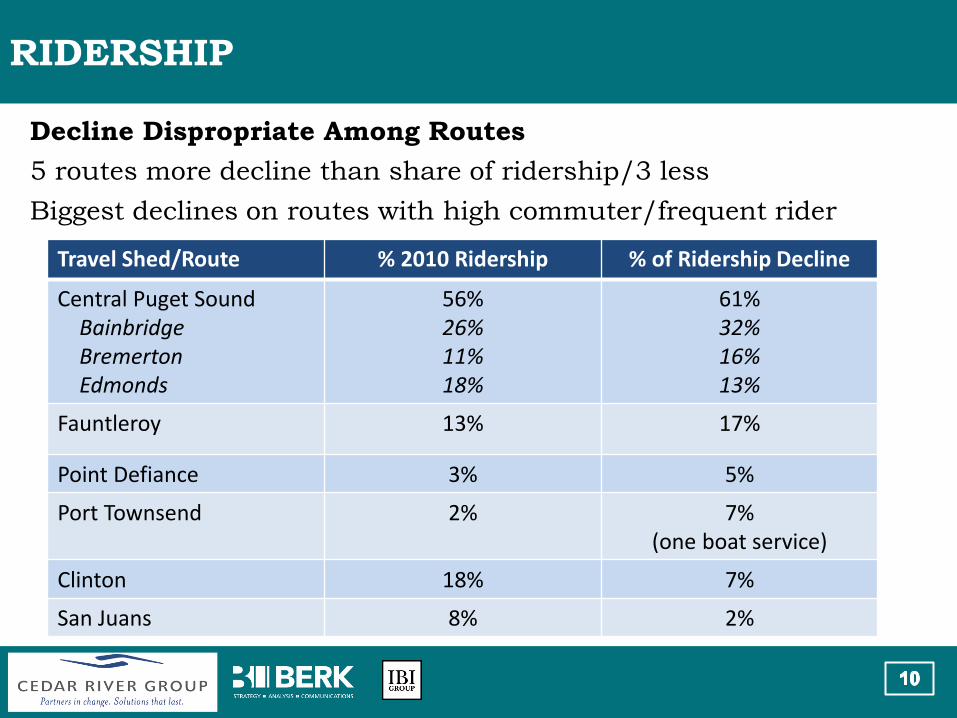
Decline Dispropriate Among Routes
5 routes more decline than share of ridership/3 less
Biggest declines on routes with high commuter/frequent rider
Travel Shed/Route % 2010 Ridership % of Ridership Decline
Central Puget Sound Bainbridge Bremerton Edmonds
56% 26% 11% 18%
61% 32% 16% 13%
Fauntleroy 13% 17%
Point Defiance 3% 5%
Port Townsend 2% 7% (one boat service)
Clinton 18% 7%
San Juans 8% 2%
FARE STRUCTURE
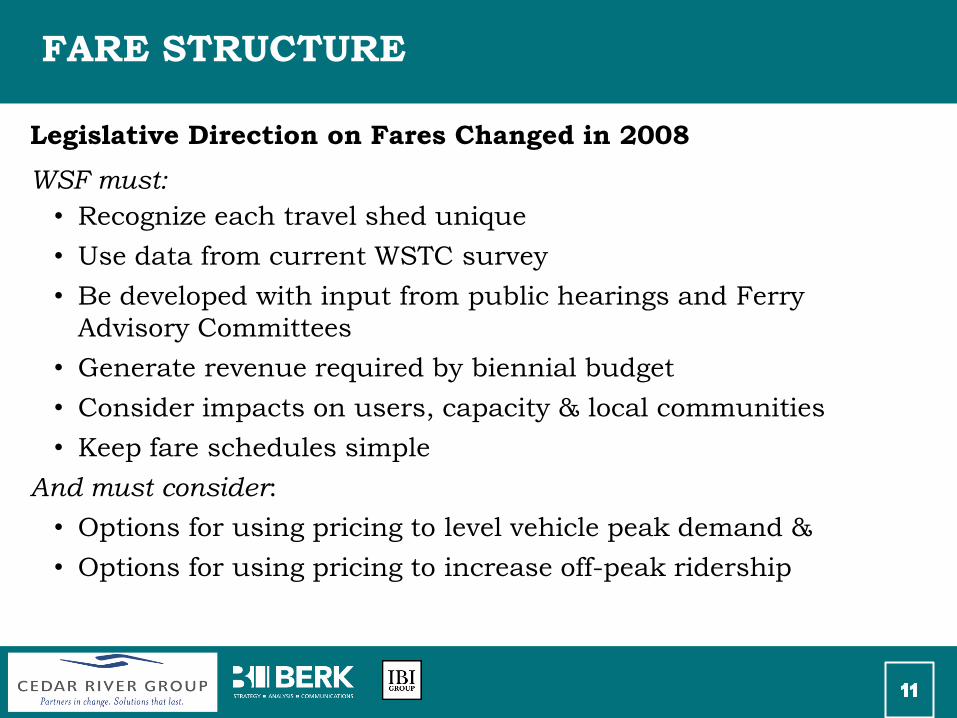
Legislative Direction on Fares Changed in 2008
WSF must:
• Recognize each travel shed unique
• Use data from current WSTC survey
• Be developed with input from public hearings and Ferry
Advisory Committees
• Generate revenue required by biennial budget
• Consider impacts on users, capacity & local communities
• Keep fare schedules simple
And must consider:
• Options for using pricing to level vehicle peak demand &
• Options for using pricing to increase off-peak ridership
FARE STRUCTURE PRINCIPLES, DISCOUNTS & SURCHARGES
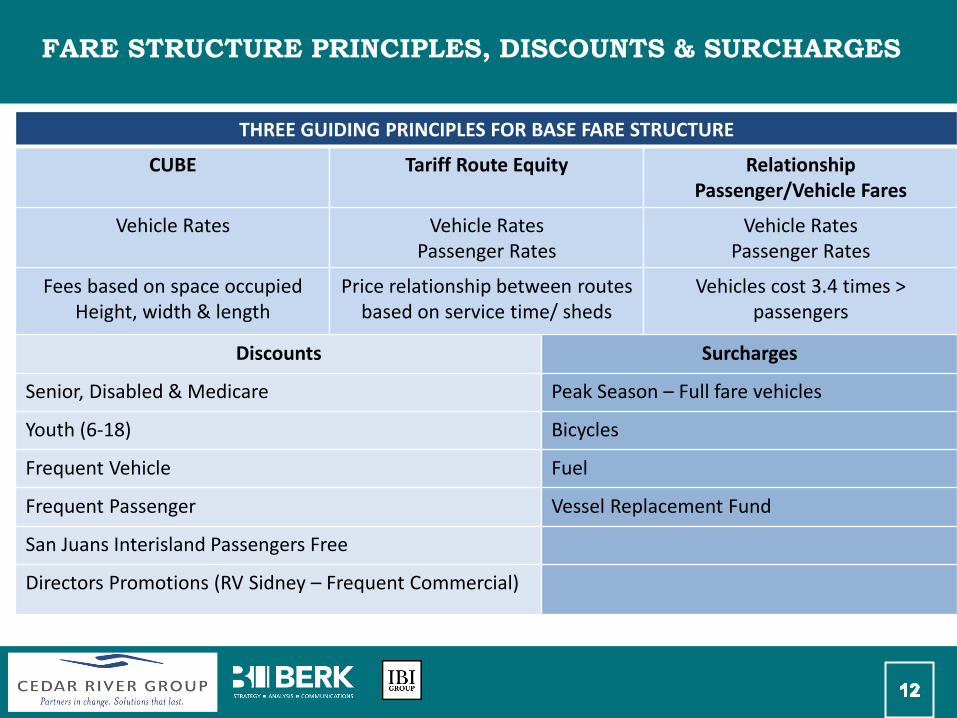
THREE GUIDING PRINCIPLES FOR BASE FARE STRUCTURE
CUBE Tariff Route Equity Relationship Passenger/Vehicle Fares
Vehicle Rates Vehicle Rates Passenger Rates
Vehicle Rates Passenger Rates
Fees based on space occupied Height, width & length
Price relationship between routes based on service time/ sheds
Vehicles cost 3.4 times > passengers
Discounts Surcharges
Senior, Disabled & Medicare Peak Season – Full fare vehicles
Youth (6-18) Bicycles
Frequent Vehicle Fuel
Frequent Passenger Vessel Replacement Fund
San Juans Interisland Passengers Free
Directors Promotions (RV Sidney – Frequent Commercial)
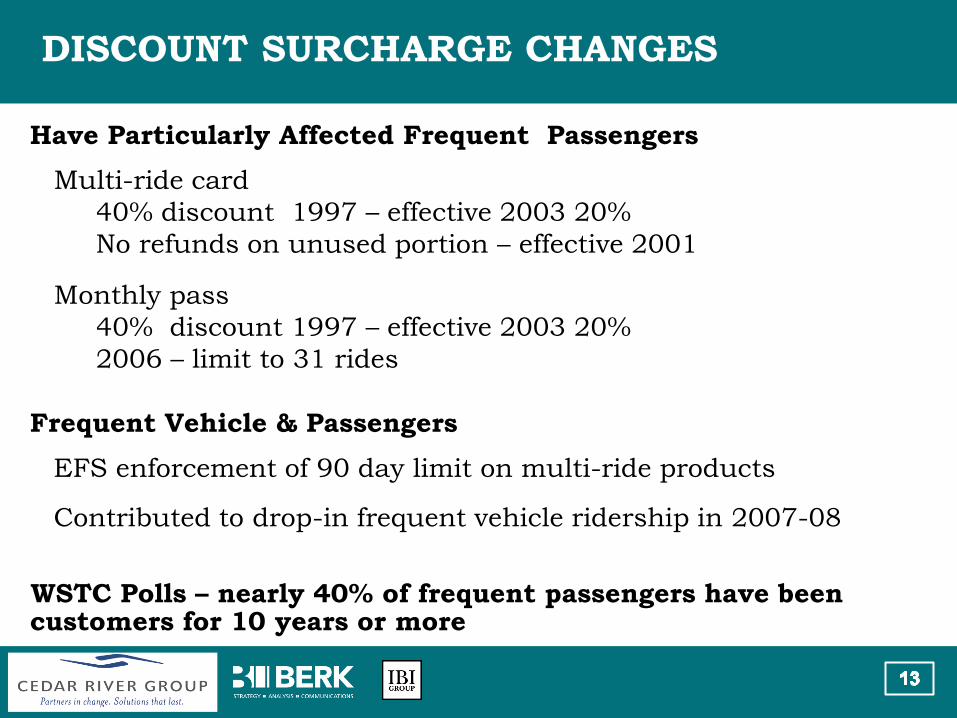
DISCOUNT SURCHARGE CHANGES
Have Particularly Affected Frequent Passengers
Multi-ride card
40% discount 1997 – effective 2003 20%
No refunds on unused portion – effective 2001
Monthly pass
40% discount 1997 – effective 2003 20%
2006 – limit to 31 rides
Frequent Vehicle & Passengers
EFS enforcement of 90 day limit on multi-ride products
Contributed to drop-in frequent vehicle ridership in 2007-08
WSTC Polls – nearly 40% of frequent passengers have been customers for 10 years or more
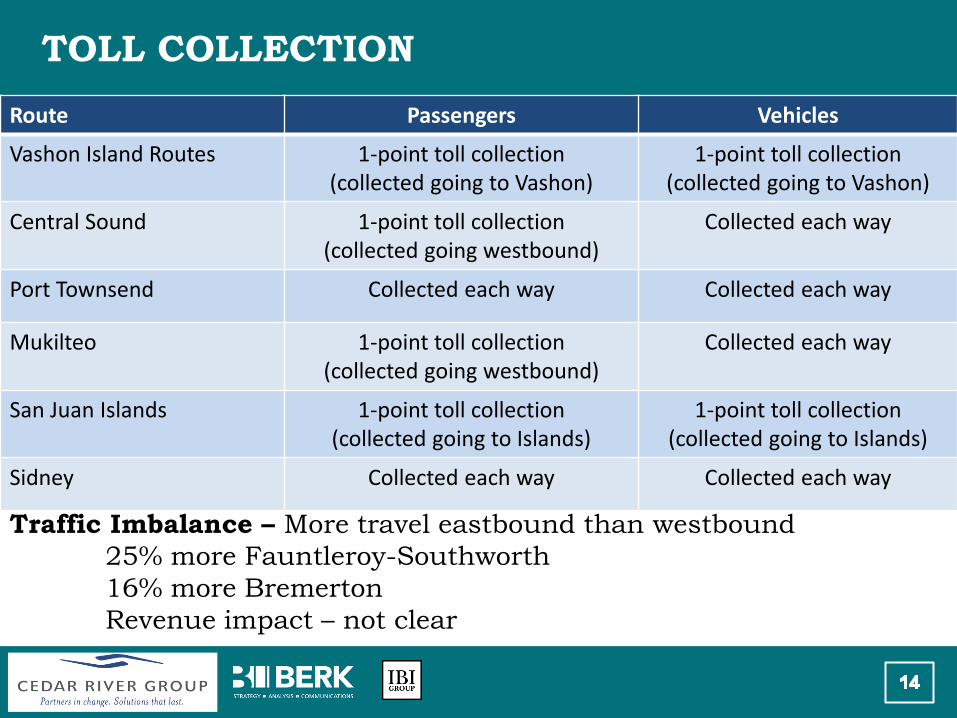
TOLL COLLECTION
Route Passengers Vehicles
Vashon Island Routes 1-point toll collection (collected going to Vashon)
1-point toll collection (collected going to Vashon)
Central Sound 1-point toll collection (collected going westbound)
Collected each way
Port Townsend Collected each way Collected each way
Mukilteo 1-point toll collection (collected going westbound)
Collected each way
San Juan Islands 1-point toll collection (collected going to Islands)
1-point toll collection (collected going to Islands)
Sidney Collected each way Collected each way
Traffic Imbalance – More travel eastbound than westbound
25% more Fauntleroy-Southworth
16% more Bremerton
Revenue impact – not clear
FARE MEDIA & INTEROPERABILITY
WSF – Currently Three Fare Media
• Electronic Fare System (EFS)/Branded Wave2Go
• One Regional Card for All (ORCA)
• Commercial Accounts
Washington State Department of Transportation
• Good to Go!
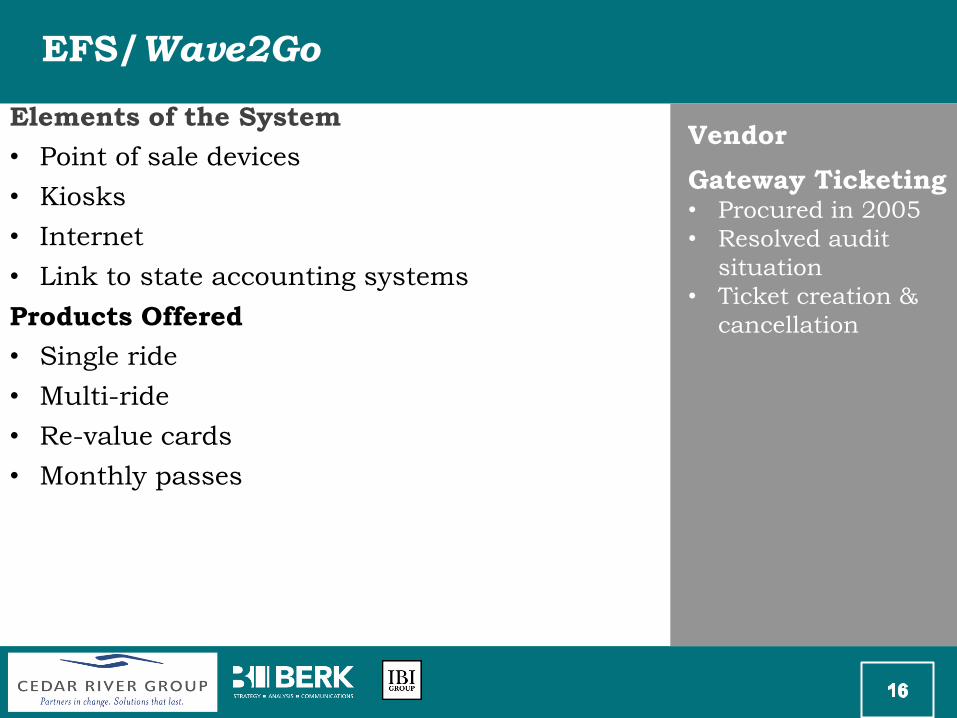
EFS/Wave2Go
Elements of the System
• Point of sale devices
• Kiosks
• Internet
• Link to state accounting systems
Products Offered
• Single ride
• Multi-ride
• Re-value cards
• Monthly passes
Vendor
Gateway Ticketing • Procured in 2005
• Resolved audit
situation
• Ticket creation &
cancellation
EFS/Wave2Go CHALLENGES
Fare Computation Complex
• 22 routes, 7 account classifications, 72 fare types, 9 ticket types, 27 validity periods, 15 passenger types
• Multifunctional – traffic statistics, farebox recovery, revenue allocation
Implementing Fare Changes Complex
• Driven by data files – with each change new data file
Off the Shelf Software
• Limits WSF options
Supplier Support
• Limited – reservations implementation problem
• 12 month wait
Software Design & Code
• Cannot easily accommodate changes and modifications
ORCA
WSF
• Full passenger fares/stored value
• Monthly passes
• Drivers full fare (start end of October)
• Employer program – monthly passes
Two Features – WSF Does Not Use
• Regional Pass/PugetPass (transfer)
• Stored rides
• Multi-ride cards
• Operational decision not system
constraint
Launched 2009
Card based system
7 agencies
WSF Community Transit
Everett Transit
Kitsap Transit
METRO
Pierce Transit
Sound Transit
Good To Go!
Typical Toll Lane
• Transponder Reader
• Vehicle Detection
• Automatic Vehicle Classification
• License Plate Readers
• Lane Controller
Account based
Limited fee
categories
Tacoma Narrows
Bridge
SR 167 HOT Lanes
SR 520 - soon
INTEROPREABILITY: OPERATIONAL
CONSIDERATIONS
WSF Visual Count Required
• Coast Guard
• Ticket policies
WSF Passenger Type & Destination
• Needed to value a ticket
Communities Outside Good to Go! Area
• Primarily King, Pierce, and to some extent Kitsap using
Good to Go!
EFS Accounting
• Recognizes revenue when ticket sold, not when used
Surcharges
• ORCA not able to delineate surcharge to customer
EFS & ORCA INTEROPREABILITY
SYSTEMS CONSIDERATIONS
ORCA and EFS – Distinct Systems
• WSF turnstiles & seller booths equipped with ORCA card
readers
• Special interface device Gate Adaption Kit (GAK)
• GAK and card reader store ORCA fare tables etc.
• ORCA consolidates transactions, creates batch file
• Regional ORCA clearinghouse processes ORCA data
Front-End (Customer Use)
• Reasonably well integrated – accept ORCA for travel
Back-End
• No integration between ORCA and EFS
• WSF must keep two sets of data, reporting etc.
• Manual processes to reconcile
COMMERCIAL ACCOUNTS
Separate from EFS and ORCA
• Employees carry charge card processed at time of travel
• Travel billing at end of month
1,400 accounts
• Pass credit screen & pay $50 annual administration fee
• Commercial reservations for account holders in San Juans
RESERVATIONS & DEMAND MANAGEMENT
PRICING
New Vehicle Reservation System
• Planned for Central Sound routes, Port Townsend & San
Juans with commercial reservations on all routes
• Three phase implementation
1. Replace software on current Port Townsend & Sidney
system
2. Extend commercial reservations to all routes
3. Central Puget Sound
• Account based system
• Link to EFS – critical
• System using custom rather than off the shelf due to
EFS constraints
• Avoiding EFS vendor support in Phase One – vendor 12
month lag to support
Demand Management Pricing
• Follow reservations
FARE REVENUE
70% (FY 2010) of Operations Funds
Vehicle fares (driver + vehicle) – 75% of revenue
• Standard vehicles – 67%
• Commercial & oversize – 8%
Passenger fares – 25% of revenue
Single trip fares more revenue than multi-ride
• 68% of revenue
• Revenue from multi-use products down despite fare
increases
• $12.9 million in FY 2006 to $10.9 million in FY 2010
Yield – higher (amount per rider) comparing FY 2006 to FY 2010
• 9% passenger fare increase – 11% increase yield
• 8% vehicle fare increase – 13% increase yield
NEXT STEPS
WSTC Customer Survey
• Complete first week of Nov.
Three White Papers
• Interoperability
• Fare Media
• Fare Structure
Review Policy Workgroup Meetings
• November 8
• November 30