Embed Size (px)
Citation preview
1
AASCIF Convention 2015: Bridging the Future
San Francisco July 6
Terrance J. Bogyo
Independent Researcher | Speaker | Consultant
Introduction: Who is this presenter? Terrance (Terry) J. Bogyo (BSc, MBA, CCRC, RRP)
In de p e n de n t Re s e a rc h e r | S p e a ke r | Con s u l t a n t
1665 58 A Street
Delta, BC V4L 1X5
e-mail: [email protected]
Blog: www.WorkersCompPerspectives.wordpress.com
Phone: (604) 943-3545
Skype: terry.bogyo
Canada and California are not so very different when it comes to Workers’ Compensation Canada
Employed labour force 2014: 17,802,200
Estimated covered by workers’ comp boards: 2013: 14.8 million
Actual [weighted]Average Assessment Rate for Assessable employers [2013]($/$100): 1.94
California Employment
Dec 2014: 17,566,281 Estimated number of
workers covered by workers’ comp insurance: 2014: 14.7 million
Average Workers’ Compensation Insurer Rate per $100 of Payroll, as of June 30, 2014 (Dollar $): 2.96
Canada and California are not so very different when it comes to Workers’ Compensation Canada
Typical TT Compensation rate: 90% of Net Earnings No waiting period Max insured 2014: varies by province-
BC: $77,900 Alberta: $92,300 Manitoba: No Max, Ontario: $84,100
Administration Costs for Assessable
Employers ($000's) ($) 2011: $1,474,841 [No equivalent for underwriting profit]
California Typical TT Compensation rate:
2/3rds Average Weekly Wage Three day waiting period Max insured 2014: $1,611.96 per week
Administration costs for insured
employers 2007*: Insurer underwriting profit:
$1,976 million, Administration expense:
$5,323 million
*IWH Workers' compensation in California and Canada
https://www.iwh.on.ca/briefings/comp-california-canada 2010
Purpose and Outline Demographic Effects: Global Changes – Local Impacts
Purpose:
To persuade you that global demographic changes matter.
Outline
What we mean by demographics
How workforce and population demographics are changing
What demographic change means to you and me, our families, our communities– and AASCIF jurisdictions
Demographics dem·o·graph·ics (dĕm'ə-grăf'ĭks) noun
shortened term for ‘population characteristics’ including
race, age, income, educational attainment
Healthcare plan membership, multiple-job holding
home ownership, employment status, location
...
2
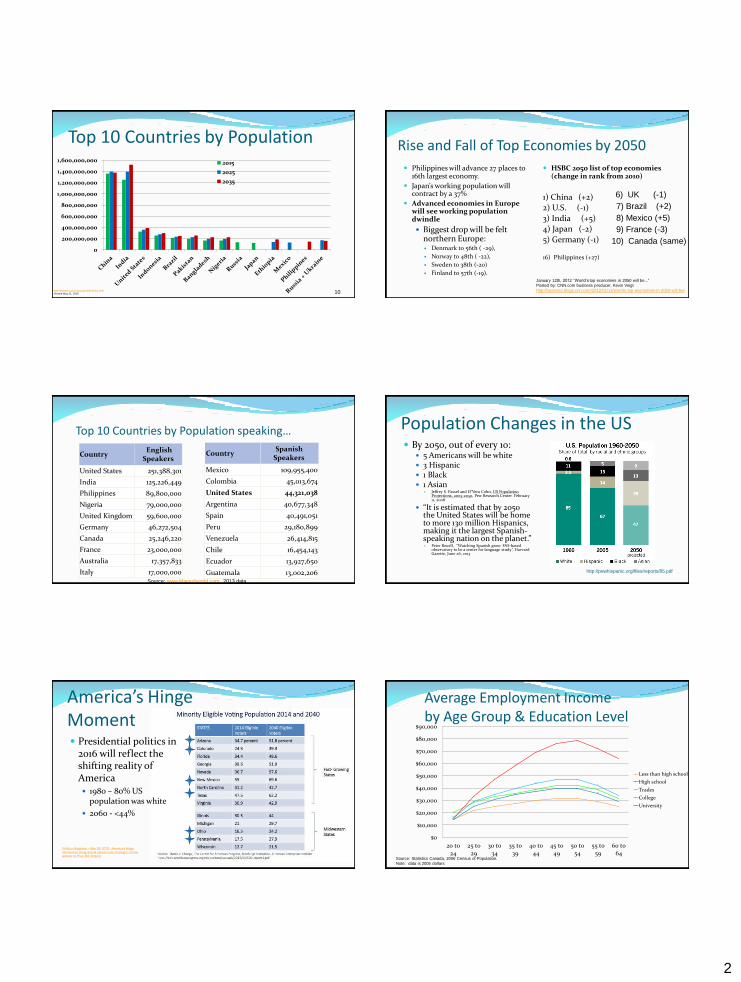
Top 10 Countries by Population
10 http://sasweb.ssd.census.gov/idb/ranks.html
Viewed May 21, 2015
0
200,000,000
400,000,000
600,000,000
800,000,000
1,000,000,000
1,200,000,000
1,400,000,000
1,600,000,000 2015
2025
2035
Rise and Fall of Top Economies by 2050
Philippines will advance 27 places to 16th largest economy.
Japan’s working population will contract by a 37%
Advanced economies in Europe will see working population dwindle
Biggest drop will be felt northern Europe: Denmark to 56th ( -29),
Norway to 48th ( -22),
Sweden to 38th (-20)
Finland to 57th (-19).
HSBC 2050 list of top economies (change in rank from 2010)
1) China (+2) 2) U.S. (-1)
3) India (+5) 4) Japan (-2)
5) Germany (-1)
16) Philippines (+27)
6) UK (-1)
7) Brazil (+2)
8) Mexico (+5)
9) France (-3)
10) Canada (same)
January 12th, 2012 “World’s top economies in 2050 will be...”
Posted by: CNN.com business producer, Kevin Voigt
http://business.blogs.cnn.com/2012/01/12/worlds-top-economies-in-2050-will-be/
Top 10 Countries by Population speaking…
Country English
Speakers
United States 251,388,301
India 125,226,449
Philippines 89,800,000
Nigeria 79,000,000
United Kingdom 59,600,000
Germany 46,272,504
Canada 25,246,220
France 23,000,000
Australia 17,357,833
Italy 17,000,000
Country Spanish
Speakers
Mexico 109,955,400
Colombia 45,013,674
United States 44,321,038
Argentina 40,677,348
Spain 40,491,051
Peru 29,180,899
Venezuela 26,414,815
Chile 16,454,143
Ecuador 13,927,650
Guatemala 13,002,206 Source: www.Mapsofworld.com 2013 data
Population Changes in the US By 2050, out of every 10:
5 Americans will be white 3 Hispanic 1 Black 1 Asian
Jeffrey S. Passel and D’Vera Cohn, US Population Projections, 2005-2050, Pew Research Center February 11, 2008
“It is estimated that by 2050 the United States will be home to more 130 million Hispanics, making it the largest Spanish-speaking nation on the planet.” Peter Reuell, “Watching Spanish grow: FAS-based
observatory to be a center for language study”, Harvard Gazette, June 26, 2013
http://pewhispanic.org/files/reports/85.pdf
America’s Hinge Moment Presidential politics in
2016 will reflect the shifting reality of America 1980 – 80% US
population was white
2060 - <44%
Politico Magazine – Mar 29, 2015: America’s Hinge
Moment by Doug Sosnik (democratic strategist, former advisor to Pres. Bill Clinton)
Average Employment Income by Age Group & Education Level
$0
$10,000
$20,000
$30,000
$40,000
$50,000
$60,000
$70,000
$80,000
$90,000
20 to24
25 to29
30 to34
35 to39
40 to44
45 to49
50 to54
55 to59
60 to64
Less than high school
High school
Trades
College
University
Source: Statistics Canada, 2006 Census of Population.
Note: data is 2005 dollars
3
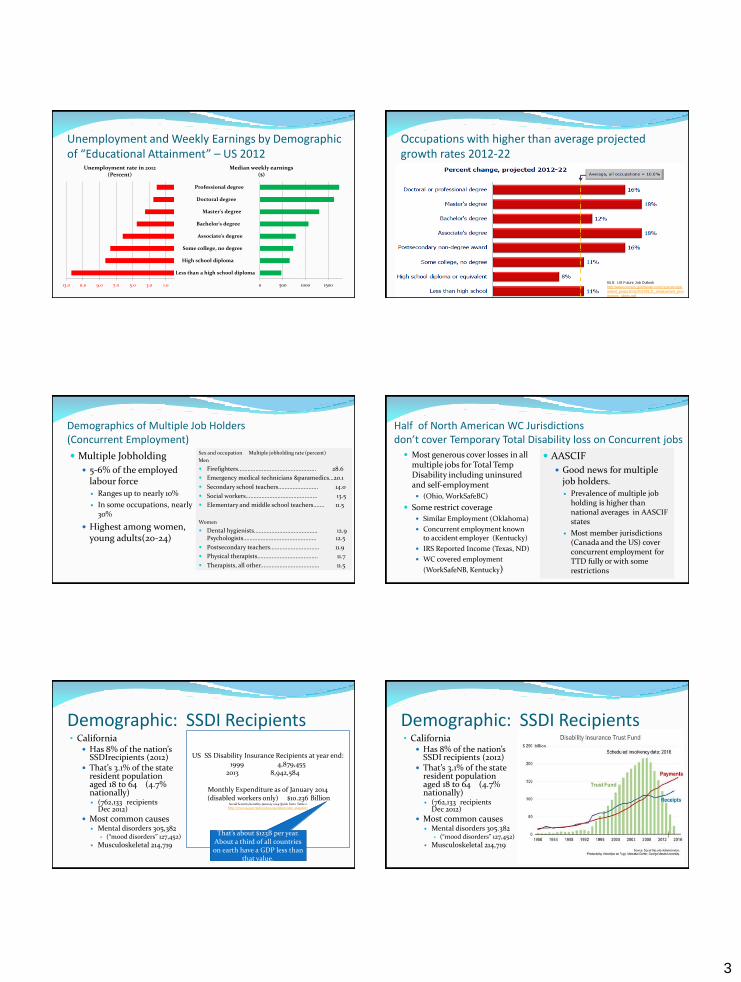
Unemployment and Weekly Earnings by Demographic of “Educational Attainment” – US 2012
13.0 11.0 9.0 7.0 5.0 3.0 1.0
Unemployment rate in 2012 (Percent)
0 500 1000 1500
Less than a high school diploma
High school diploma
Some college, no degree
Associate's degree
Bachelor's degree
Master's degree
Doctoral degree
Professional degree
Median weekly earnings ($)
Occupations with higher than average projected growth rates 2012-22
BLS: US Future Job Outlook
http://www.census.gov/newsroom/cspan/emplo
yment_projections/20140131_employment_proj
ections_slides.pdf
Demographics of Multiple Job Holders (Concurrent Employment)
Multiple Jobholding
5-6% of the employed labour force Ranges up to nearly 10%
In some occupations, nearly 30%
Highest among women, young adults(20-24)
Sex and occupation Multiple jobholding rate (percent)
Men
Firefighters................................................. 28.6
Emergency medical technicians ¶medics...20.1
Secondary school teachers......................... 14.0
Social workers............................................. 13.5
Elementary and middle school teachers....... 11.5
Women
Dental hygienists........................................ 12.9 Psychologists.............................................. 12.5
Postsecondary teachers............................... 11.9
Physical therapists...................................... 11.7
Therapists, all other..................................... 11.5
BLS Monthly Labor Review July 2010
Half of North American WC Jurisdictions don’t cover Temporary Total Disability loss on Concurrent jobs
Most generous cover losses in all multiple jobs for Total Temp Disability including uninsured and self-employment
(Ohio, WorkSafeBC)
Some restrict coverage
Similar Employment (Oklahoma)
Concurrent employment known to accident employer (Kentucky)
IRS Reported Income (Texas, ND)
WC covered employment
(WorkSafeNB, Kentucky)
AASCIF
Good news for multiple job holders. Prevalence of multiple job
holding is higher than national averages in AASCIF states
Most member jurisdictions (Canada and the US) cover concurrent employment for TTD fully or with some restrictions
Demographic: SSDI Recipients • California
Has 8% of the nation’s SSDIrecipients (2012)
That’s 3.1% of the state resident population aged 18 to 64 (4.7% nationally) (762,133 recipients
Dec 2012)
Most common causes Mental disorders 305,382
(“mood disorders” 127,452)
Musculoskeletal 214,719
US SS Disability Insurance Recipients at year end: 1999 4,879,455
2013 8,942,584
Monthly Expenditure as of January 2014 (disabled workers only) $10.236 Billion
Social Security benefits, January 2014 Quick Facts Table 2 http://www.ssa.gov/policy/docs/quickfacts/stat_snapshot/
That’s about $123B per year. About a third of all countries on earth have a GDP less than
that value.
Demographic: SSDI Recipients • California
Has 8% of the nation’s SSDI recipients (2012)
That’s 3.1% of the state resident population aged 18 to 64 (4.7% nationally) (762,133 recipients
Dec 2012)
Most common causes Mental disorders 305.382
(“mood disorders” 127,452)
Musculoskeletal 214,719
4
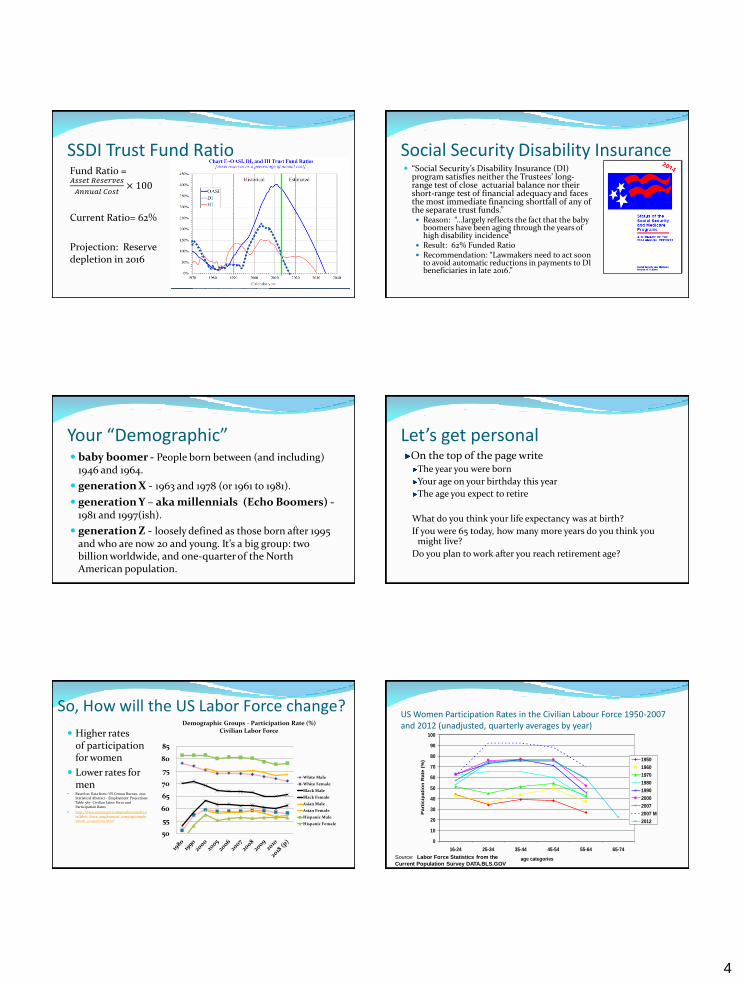
SSDI Trust Fund Ratio Fund Ratio = 𝐴𝑠𝑠𝑒𝑡 𝑅𝑒𝑠𝑒𝑟𝑣𝑒𝑠
𝐴𝑛𝑛𝑢𝑎𝑙 𝐶𝑜𝑠𝑡× 100
Current Ratio= 62%
Projection: Reserve depletion in 2016
Social Security Disability Insurance “Social Security’s Disability Insurance (DI)
program satisfies neither the Trustees’ long-range test of close actuarial balance nor their short-range test of financial adequacy and faces the most immediate financing shortfall of any of the separate trust funds.” Reason: “…largely reflects the fact that the baby
boomers have been aging through the years of high disability incidence”
Result: 62% Funded Ratio Recommendation: “Lawmakers need to act soon
to avoid automatic reductions in payments to DI beneficiaries in late 2016.”
Your “Demographic” baby boomer - People born between (and including)
1946 and 1964.
generation X - 1963 and 1978 (or 1961 to 1981).
generation Y – aka millennials (Echo Boomers) - 1981 and 1997(ish).
generation Z - loosely defined as those born after 1995 and who are now 20 and young. It’s a big group: two billion worldwide, and one-quarter of the North American population.
Let’s get personal On the top of the page write
The year you were born
Your age on your birthday this year
The age you expect to retire
What do you think your life expectancy was at birth?
If you were 65 today, how many more years do you think you might live?
Do you plan to work after you reach retirement age?
So, How will the US Labor Force change?
Higher rates of participation for women
Lower rates for men
Based on Data from: US Census Bureau, 2012 Statistical Abstract - Employment Projections Table 587- Civilian Labor Force and Participation Rates
http://www.census.gov/compendia/statab/cats/labor_force_employment_earnings/employment_projections.html
50
55
60
65
70
75
80
85
Demographic Groups - Participation Rate (%) Civilian Labor Force
White Male
White Female
Black Male
Black Female
Asian Male
Asian Female
Hispanic Male
Hispanic Female
US Women Participation Rates in the Civilian Labour Force 1950-2007 and 2012 (unadjusted, quarterly averages by year)
0
10
20
30
40
50
60
70
80
90
100
16-24 25-34 35-44 45-54 55-64 65-74
age categories
Part
icip
ati
on
Rate
(%
) 1950
1960
1970
1980
1990
2000
2007
2007 M
2012
Source: Labor Force Statistics from the
Current Population Survey DATA.BLS.GOV
5
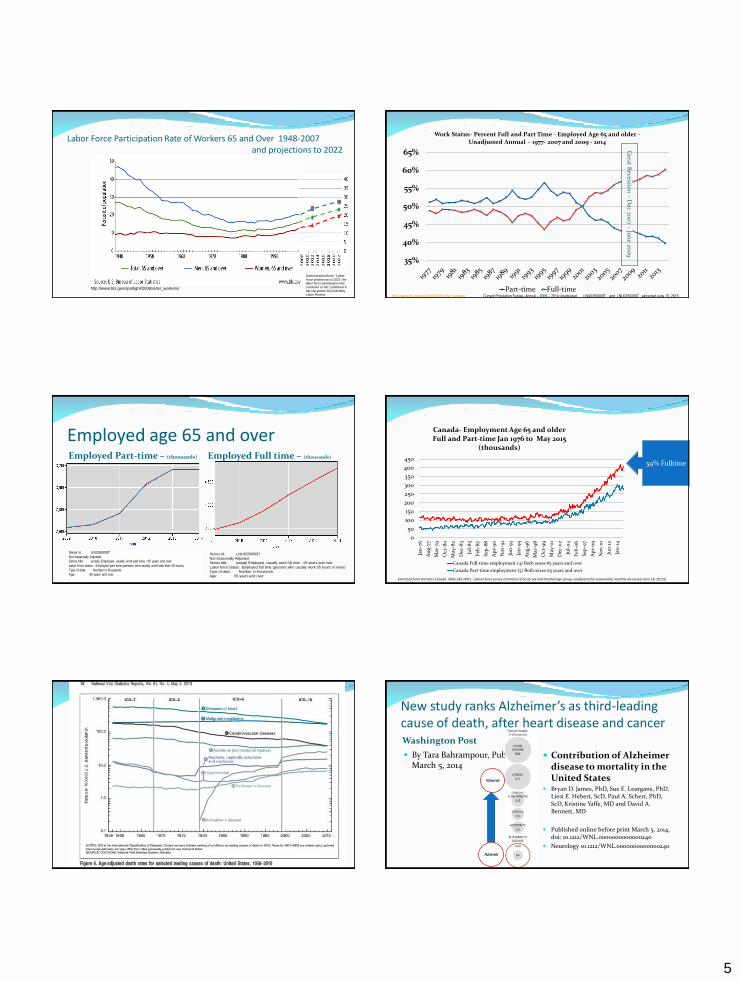
Labor Force Participation Rate of Workers 65 and Over 1948-2007 and projections to 2022
http://www.bls.gov/spotlight/2008/older_workers/
Data extracted from "Labor
force projections to 2022: the labor force participation rate
continues to fall," published in
the December 2013 Monthly Labor Review.
35%
40%
45%
50%
55%
60%
65%
Work Status- Percent Full and Part Time - Employed Age 65 and older - Unadjusted Annual – 1977- 2007 and 2009 - 2014
Part-time Full-time
Great R
ecession
– D
ec 200
7 – Ju
ne 20
09
http://www.bls.gov/spotlight/2008/older_workers/ Current Population Survey- Annual – 2009 – 2014 Unadjusted LNU02600097 and LNU02500097 extracted June 15, 2015
Employed age 65 and over Employed Part-time – (thousands) Employed Full time – (thousands)
Series Id: LNU02500097
Not Seasonally Adjusted
Series title: (unadj) Employed, usually work full time - 65 years and over
Labor force status: Employed full time (persons who usually work 35 hours or more)
Type of data: Number in thousands
Age: 65 years and over
Series Id: LNU02600097
Not Seasonally Adjusted
Series title: (unadj) Employed, usually work part time - 65 years and over
Labor force status: Employed part time (persons who usually work less than 35 hours)
Type of data: Number in thousands
Age: 65 years and over
0
50
100
150
200
250
300
350
400
450
Jan
-76
Au
g-7
7
Mar
-79
Oct
-80
May
-82
Dec
-83
Jul-
85
Feb
-87
Sep
-88
Ap
r-9
0
No
v-9
1
Jun
-93
Jan
-95
Au
g-9
6
Mar
-98
Oct
-99
May
-01
Dec
-02
Jul-
04
Feb
-06
Sep
-07
Ap
r-0
9
No
v-10
Jun
-12
Jan
-14
Canada- Employment Age 65 and older Full and Part-time Jan 1976 to May 2015
(thousands)
Canada Full-time employment (4) Both sexes 65 years and over
Canada Part-time employment (5) Both sexes 65 years and over
59% Fulltime
Extracted from Statistics Canada. Table 282-0001 - Labour force survey estimates (LFS), by sex and detailed age group, unadjusted for seasonality, monthly (accessed: June 18, 2015))
New study ranks Alzheimer’s as third-leading cause of death, after heart disease and cancer Washington Post
By Tara Bahrampour, Published: March 5, 2014
Contribution of Alzheimer disease to mortality in the United States
Bryan D. James, PhD, Sue E. Leurgans, PhD, Liesi E. Hebert, ScD, Paul A. Scherr, PhD, ScD, Kristine Yaffe, MD and David A. Bennett, MD
Published online before print March 5, 2014, doi: 10.1212/WNL.0000000000000240
Neurology 10.1212/WNL.0000000000000240
Alzheimer's
Alzheimer's
6
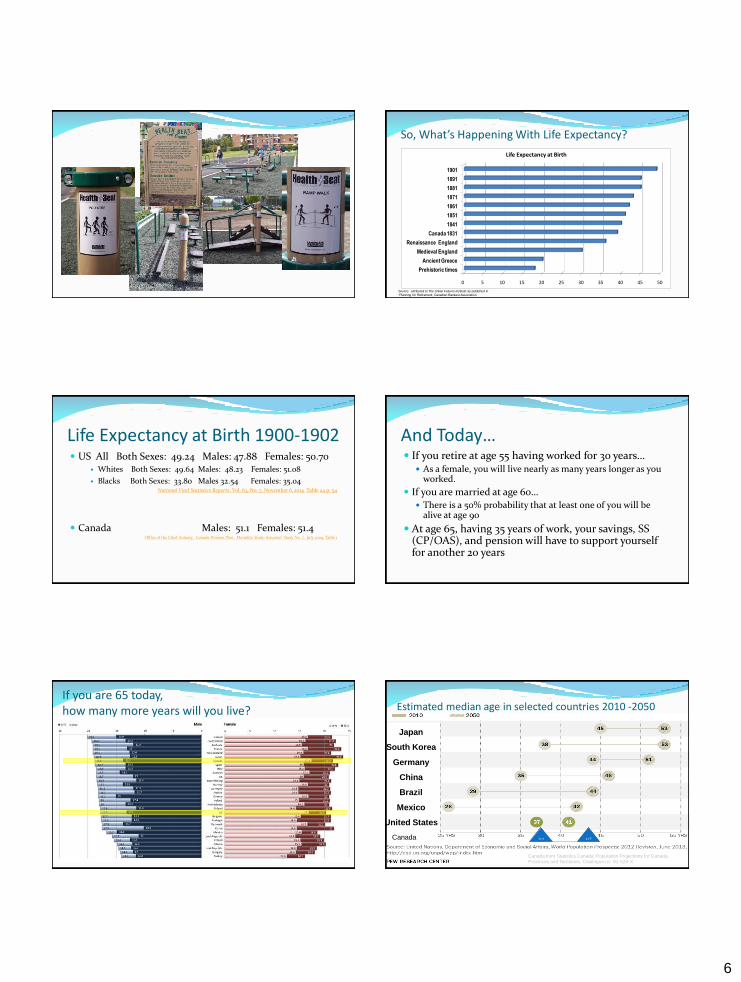
So, What’s Happening With Life Expectancy?
0 5 10 15 20 25 30 35 40 45 50
Prehistoric times
Ancient Greece
Medieval England
Renaissance England
Canada 1831
1841
1851
1861
1871
1881
1891
1901
Life Expectancy at Birth
Source: attributed to The Urban Futures Institute as published in
“Planning for Retirement, Canadian Bankers Association.
Life Expectancy at Birth 1900-1902 US All Both Sexes: 49.24 Males: 47.88 Females: 50.70
Whites Both Sexes: 49.64 Males: 48.23 Females: 51.08
Blacks Both Sexes: 33.80 Males 32.54 Females: 35.04 National Vital Statistics Reports, Vol. 63, No. 7, November 6, 2014 Table 24 p. 54
Canada Males: 51.1 Females: 51.4 Office of the Chief Actuary, Canada Pension Plan: Mortality Study-Actuarial Study No. 7, July 2009, Table 1
And Today… If you retire at age 55 having worked for 30 years…
As a female, you will live nearly as many years longer as you worked.
If you are married at age 60…
There is a 50% probability that at least one of you will be alive at age 90
At age 65, having 35 years of work, your savings, SS (CP/OAS), and pension will have to support yourself for another 20 years
If you are 65 today, how many more years will you live? Estimated median age in selected countries 2010 -2050
Japan
South Korea
Germany
China
Brazil
Mexico
United States
37.9 43.8 Canada
Canada from Statistics Canada, Population Projections for Canada, Provinces and Territories, Catalogue no. 91-520-X
7
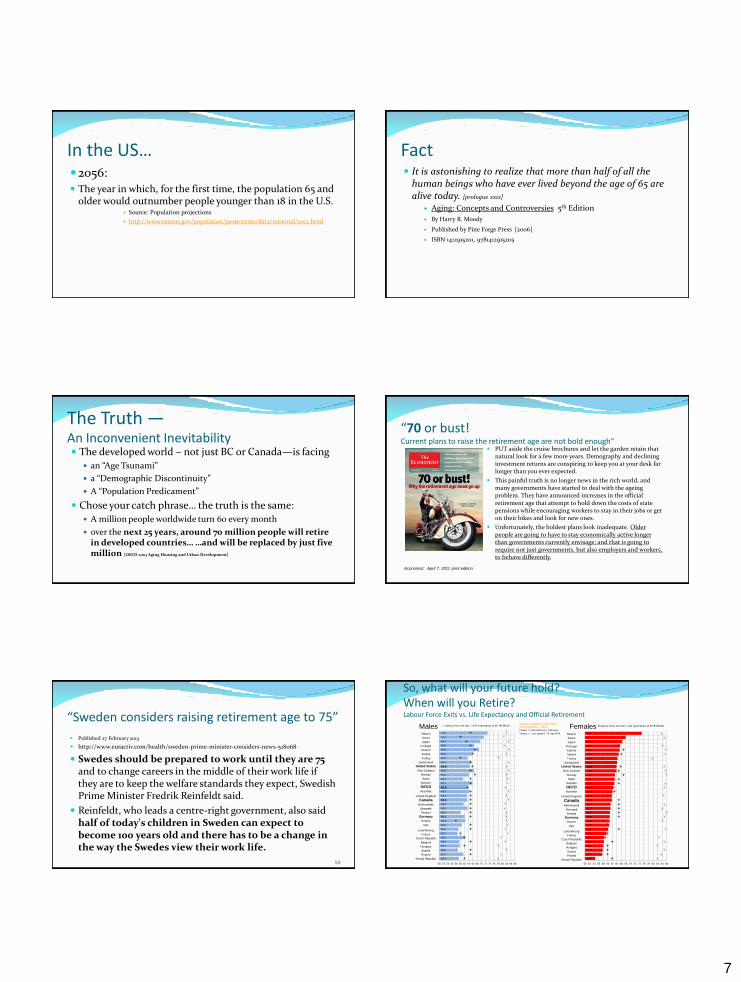
In the US… 2056: The year in which, for the first time, the population 65 and
older would outnumber people younger than 18 in the U.S. Source: Population projections
http://www.census.gov/population/projections/data/national/2012.html
Fact It is astonishing to realize that more than half of all the
human beings who have ever lived beyond the age of 65 are alive today. [prologue xxix]
Aging: Concepts and Controversies 5th Edition
By Harry R. Moody
Published by Pine Forge Press [2006]
ISBN 1412915201, 9781412915205
The Truth — An Inconvenient Inevitability The developed world – not just BC or Canada—is facing
an “Age Tsunami”
a “Demographic Discontinuity”
A “Population Predicament”
Chose your catch phrase… the truth is the same:
A million people worldwide turn 60 every month
over the next 25 years, around 70 million people will retire in developed countries… …and will be replaced by just five million [OECD 2003 Aging Housing and Urban Development]
“70 or bust! Current plans to raise the retirement age are not bold enough”
PUT aside the cruise brochures and let the garden retain that natural look for a few more years. Demography and declining investment returns are conspiring to keep you at your desk far longer than you ever expected.
This painful truth is no longer news in the rich world, and many governments have started to deal with the ageing problem. They have announced increases in the official retirement age that attempt to hold down the costs of state pensions while encouraging workers to stay in their jobs or get on their bikes and look for new ones.
Unfortunately, the boldest plans look inadequate. Older people are going to have to stay economically active longer than governments currently envisage; and that is going to require not just governments, but also employers and workers, to behave differently.
Economist: April 7, 2011 print edition
“Sweden considers raising retirement age to 75”
Published 27 February 2013
http://www.euractiv.com/health/sweden-prime-minister-considers-news-518068
Swedes should be prepared to work until they are 75 and to change careers in the middle of their work life if they are to keep the welfare standards they expect, Swedish Prime Minister Fredrik Reinfeldt said.
Reinfeldt, who leads a centre-right government, also said half of today's children in Sweden can expect to become 100 years old and there has to be a change in the way the Swedes view their work life.
53
So, what will your future hold? When will you Retire? Labour Force Exits vs. Life Expectancy and Official Retirement
75.0
67.9
66.5
65.5
65.3
64.9
64.3
64.1
63.9
63.9
63.2
63.1
62.9
62.3
62.2
61.9
61.9
61.3
61.3
61.0
61.0
60.9
60.8
60.3
59.5
58.5
58.3
58.2
57.9
57.7
54.5
50 52 54 56 58 60 62 64 66 68 70 72 74 76 78 80 82 84 86
Labour force exit rate Life expectancy at 65 Official
73.0
71.2
69.5
66.6
68.9
65.6
63.5
65.2
64.6
66.5
64.2
61.4
65.7
63.5
64.4
63.2
63.3
61.6
63.5
60.2
62.1
62.4
60.8
59.2
58.7
62.2
59.6
59.7
58.9
61.4
59.3
50 52 54 56 58 60 62 64 66 68 70 72 74 76 78 80 82 84 86
Labour force exit rate Life expectancy at 65 Official
Mexico
Korea
Japan
Portugal
Iceland
Ireland
Turkey
Switzerland
United States
New Zealand
Norway
Spain
Sweden
OECD Australia
United Kingdom
Canada Netherlands
Denmark
Finland
Germany
Greece
Italy
Luxembourg
France
Czech Republic
Belgium
Hungary
Austria
Poland
Slovak Republic
Mexico
Korea
Japan
Portugal
Iceland
Ireland
Turkey
Switzerland
United States
New Zealand
Norway
Spain
Sweden
OECD Australia
United Kingdom
Canada Netherlands
Denmark
Finland
Germany
Greece
Italy
Luxembourg
France
Czech Republic
Belgium
Hungary
Austria
Poland
Slovak Republic
Society at a Glance 2009: OECD
Social Indicators - OECD
Chapter 5. Self-sufficiency Indicators.
Version 1 - Last updated: 29-Apr-2009
Males Females
8
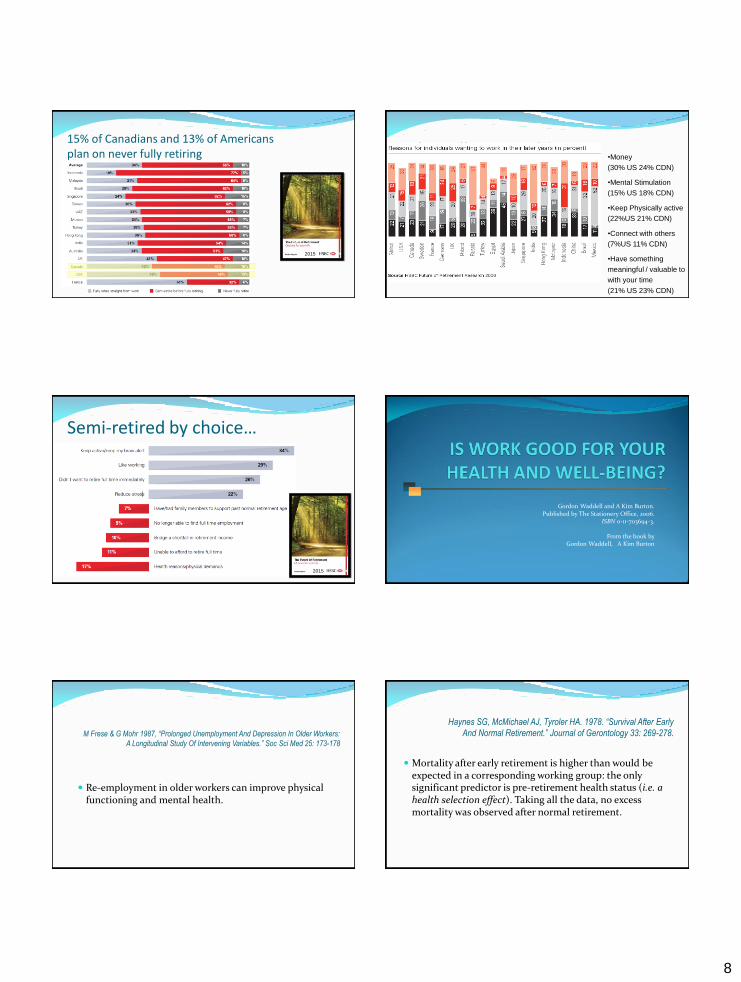
15% of Canadians and 13% of Americans plan on never fully retiring
2015
Why will you work?
•Money
(30% US 24% CDN)
•Mental Stimulation
(15% US 18% CDN)
•Keep Physically active
(22%US 21% CDN)
•Connect with others
(7%US 11% CDN)
•Have something
meaningful / valuable to
with your time
(21% US 23% CDN)
Semi-retired by choice…
2015
Gordon Waddell and A Kim Burton. Published by The Stationery Office, 2006.
ISBN 0-11-703694-3.
From the book by Gordon Waddell, A Kim Burton
M Frese & G Mohr 1987, “Prolonged Unemployment And Depression In Older Workers:
A Longitudinal Study Of Intervening Variables.” Soc Sci Med 25: 173-178
Re-employment in older workers can improve physical functioning and mental health.
Haynes SG, McMichael AJ, Tyroler HA. 1978. “Survival After Early
And Normal Retirement.” Journal of Gerontology 33: 269-278.
Mortality after early retirement is higher than would be expected in a corresponding working group: the only significant predictor is pre-retirement health status (i.e. a health selection effect). Taking all the data, no excess mortality was observed after normal retirement.
9
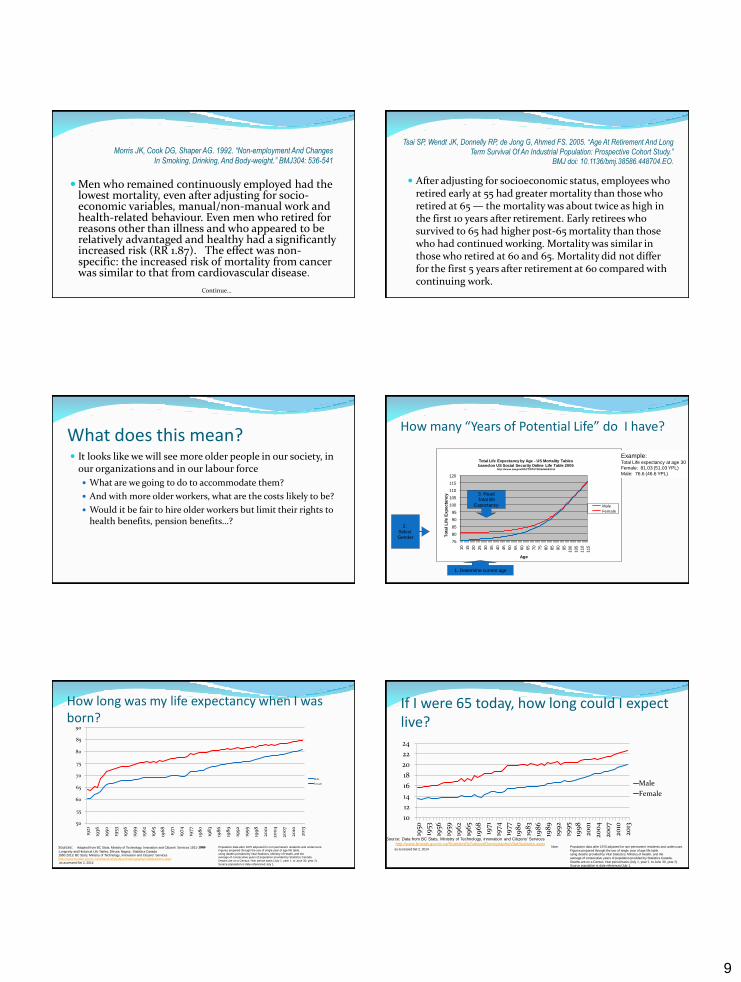
Morris JK, Cook DG, Shaper AG. 1992. “Non-employment And Changes
In Smoking, Drinking, And Body-weight.” BMJ304: 536-541
Men who remained continuously employed had the lowest mortality, even after adjusting for socio-economic variables, manual/non-manual work and health-related behaviour. Even men who retired for reasons other than illness and who appeared to be relatively advantaged and healthy had a significantly increased risk (RR 1.87). The effect was non-specific: the increased risk of mortality from cancer was similar to that from cardiovascular disease.
Continue…
Tsai SP, Wendt JK, Donnelly RP, de Jong G, Ahmed FS. 2005. “Age At Retirement And Long
Term Survival Of An Industrial Population: Prospective Cohort Study.”
BMJ doi: 10.1136/bmj.38586.448704.EO.
After adjusting for socioeconomic status, employees who retired early at 55 had greater mortality than those who retired at 65 — the mortality was about twice as high in the first 10 years after retirement. Early retirees who survived to 65 had higher post-65 mortality than those who had continued working. Mortality was similar in those who retired at 60 and 65. Mortality did not differ for the first 5 years after retirement at 60 compared with continuing work.
What does this mean? It looks like we will see more older people in our society, in
our organizations and in our labour force
What are we going to do to accommodate them?
And with more older workers, what are the costs likely to be?
Would it be fair to hire older workers but limit their rights to health benefits, pension benefits…?
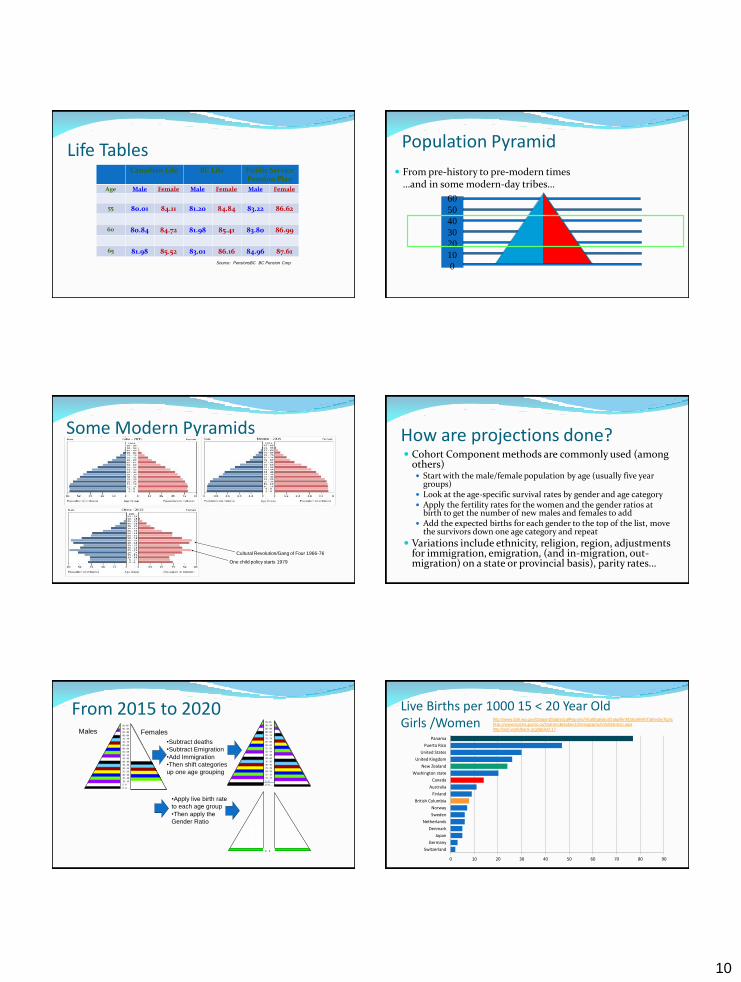
How many “Years of Potential Life” do I have?
75
80
85
90
95
100
105
110
115
120
10
15
20
25
30
35
40
45
50
55
60
65
70
75
80
85
90
95
100
105
110
115
To
tal
Lif
e E
xp
ecta
ncy
Age
Total Life Expectancy by Age - US Mortality Tablesbased on US Social Security Online Life Table 2005
http://www.ssa.gov/OACT/STATS/table4c6.html
Male
Female
1. Determine current age
2. Select Gender
3. Read Total life
Expectancy
Example: Total Life expectancy at age 30 Female: 81.03 (51.03 YPL)
Male: 76.6 (46.6 YPL)
How long was my life expectancy when I was born?
Sources: Adapted from BC Stats, Ministry of Technology, Innovation and Citizens' Services 1921-1946
:Longevity and Historical Life Tables, Dhruva Nagnur, Statistics Canada 1950-2013: BC Stats, Ministry of Technology, Innovation and Citizens' Services
http://www.bcstats.gov.bc.ca/StatisticsBySubject/Demography/VitalStatistics.aspx as accessed Set 2, 2014
50
55
60
65
70
75
80
85
90
1921
1936
1950
1953
1956
1959
196
2
196
5
196
8
1971
1974
1977
198
0
198
3
198
6
198
9
199
2
199
5
199
8
200
1
200
4
200
7
2010
2013
Male
Female
Note: Population data after 1970 adjusted for non-permanent residents and undercount. Figures prepared through the use of single year of age life table.
using deaths provided by Vital Statistics, Ministry of Health, and the average of consecutive years of population provided by Statistics Canada.
Deaths are on a Census Year period basis (July 1, year 1, to June 30, year 2).
Source population is date referenced July 1.
If I were 65 today, how long could I expect live?
10
12
14
16
18
20
22
24
1950
1953
1956
1959
196
2
196
5
196
8
1971
1974
1977
198
0
198
3
198
6
198
9
199
2
199
5
199
8
200
1
200
4
200
7
2010
2013
Male
Female
Source: Data from BC Stats, Ministry of Technology, Innovation and Citizens' Services
http://www.bcstats.gov.bc.ca/StatisticsBySubject/Demography/VitalStatistics.aspx
as accessed Set 2, 2014 Note: Population data after 1970 adjusted for non-permanent residents and undercount.
Figures prepared through the use of single year of age life table. using deaths provided by Vital Statistics, Ministry of Health, and the
average of consecutive years of population provided by Statistics Canada.
Deaths are on a Census Year period basis (July 1, year 1, to June 30, year 2). Source population is date referenced July 1.
10
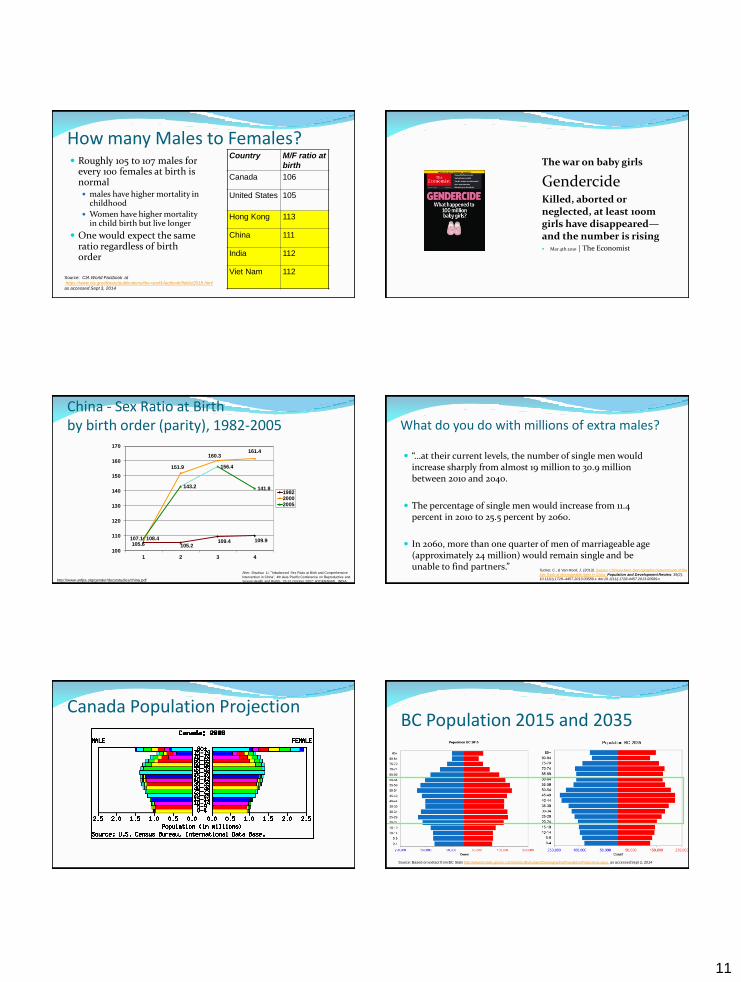
Life Tables Canadian Life BC Life Public Service
Pension Plan
Age Male Female Male Female Male Female
55 80.01 84.11 81.20 84.84 83.22 86.62
60 80.84 84.72 81.98 85.41 83.80 86.99
65 81.98 85.52 83.01 86.16 84.96 87.61
Source: PensionsBC BC Pension Corp.
60
50
40
30
20
10
0
Population Pyramid
From pre-history to pre-modern times …and in some modern-day tribes…
Some Modern Pyramids
One child policy starts 1979
Cultural Revolution/Gang of Four 1966-76
How are projections done? Cohort Component methods are commonly used (among
others) Start with the male/female population by age (usually five year
groups) Look at the age-specific survival rates by gender and age category Apply the fertility rates for the women and the gender ratios at
birth to get the number of new males and females to add Add the expected births for each gender to the top of the list, move
the survivors down one age category and repeat
Variations include ethnicity, religion, region, adjustments for immigration, emigration, (and in-migration, out-migration) on a state or provincial basis), parity rates…
95 -99
90 - 94
85 - 89
80 - 84
75 - 79
70 - 74
65 - 69
60 - 64
55 - 59
50 - 54
45 - 49
40 - 44
35 - 39
30 - 34
25 - 29
20 - 24
15 - 19
10 - 14
5 - 9
0 - 4
From 2015 to 2020
•Subtract deaths
•Subtract Emigration
•Add Immigration
•Then shift categories
up one age grouping
????????????????????????????????????????????????????????????????????????????????????
95 -99
90 - 94
85 - 89
80 - 84
75 - 79
70 - 74
65 - 69
60 - 64
55 - 59
50 - 54
45 - 49
40 - 44
35 - 39
30 - 34
25 - 29
20 - 24
15 - 19
10 - 14
5 - 9
0 - 4
•Apply live birth rate
to each age group
•Then apply the
Gender Ratio
0 - 4
Males Females
0 10 20 30 40 50 60 70 80 90
Switzerland
Germany
Japan
Denmark
Netherlands
Sweden
Norway
British Columbia
Finland
Australia
Canada
Washington state
New Zealand
United Kingdom
United States
Puerto Rico
Panama
Live Births per 1000 15 < 20 Year Old Girls /Women http://www.doh.wa.gov/DataandStatisticalReports/VitalStatisticsData/BirthData/BirthTablesbyTopic
http://www.bcstats.gov.bc.ca/StatisticsBySubject/Demography/VitalStatistics.aspx http://wdi.worldbank.org/table/2.17
11
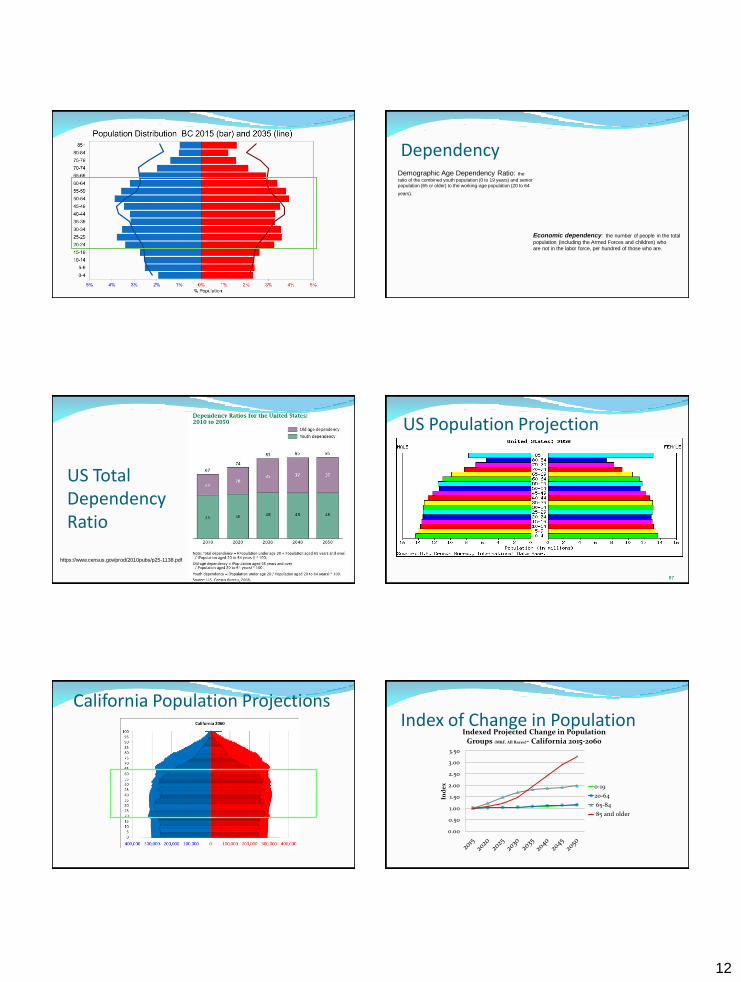
How many Males to Females? Roughly 105 to 107 males for
every 100 females at birth is normal males have higher mortality in
childhood
Women have higher mortality in child birth but live longer
One would expect the same ratio regardless of birth order
Country M/F ratio at
birth
Canada 106
United States 105
Hong Kong 113
China 111
India 112
Viet Nam
112 Source: CIA World Factbook at
https://www.cia.gov/library/publications/the-world-factbook/fields/2018.html
as accessed Sept 3, 2014
The war on baby girls
Gendercide Killed, aborted or neglected, at least 100m girls have disappeared—and the number is rising Mar 4th 2010 | The Economist
China - Sex Ratio at Birth by birth order (parity), 1982-2005
105.6 105.2 109.4 109.9 107.1
151.9
160.3 161.4
108.4
143.2
156.4
141.8
100
110
120
130
140
150
160
170
1 2 3 4
198220002005
http://www.unfpa.org/gender/docs/studies/china.pdf
After: Shuzhuo Li, “Imbalanced Sex Ratio at Birth and Comprehensive
Intervention in China”, 4th Asia Pacific Conference on Reproductive and
Sexual Health and Rights, 29-31 October 2007; HYDERABAD, INDIA
What do you do with millions of extra males?
“…at their current levels, the number of single men would increase sharply from almost 19 million to 30.9 million between 2010 and 2040.
The percentage of single men would increase from 11.4 percent in 2010 to 25.5 percent by 2060.
In 2060, more than one quarter of men of marriageable age (approximately 24 million) would remain single and be unable to find partners.”
Tucker, C., & Van Hook, J. (2013). Surplus Chinese Men: Demographic Determinants of the
Sex Ratio at Marriageable Ages in China. Population and Development Review, 39(2),
10.1111/j.1728–4457.2013.00589.x. doi:10.1111/j.1728-4457.2013.00589.x
Canada Population Projection BC Population 2015 and 2035
Source: Based on extract from BC Stats http://www.bcstats.gov.bc.ca/StatisticsBySubject/Demography/PopulationProjections.aspx as accessed Sept 2, 2014
12
Dependency Demographic Age Dependency Ratio: the
ratio of the combined youth population (0 to 19 years) and senior population (65 or older) to the working-age population (20 to 64
years).
Economic dependency: the number of people in the total
population (including the Armed Forces and children) who
are not in the labor force, per hundred of those who are.
US Total Dependency Ratio
https://www.census.gov/prod/2010pubs/p25-1138.pdf
US Population Projection
87
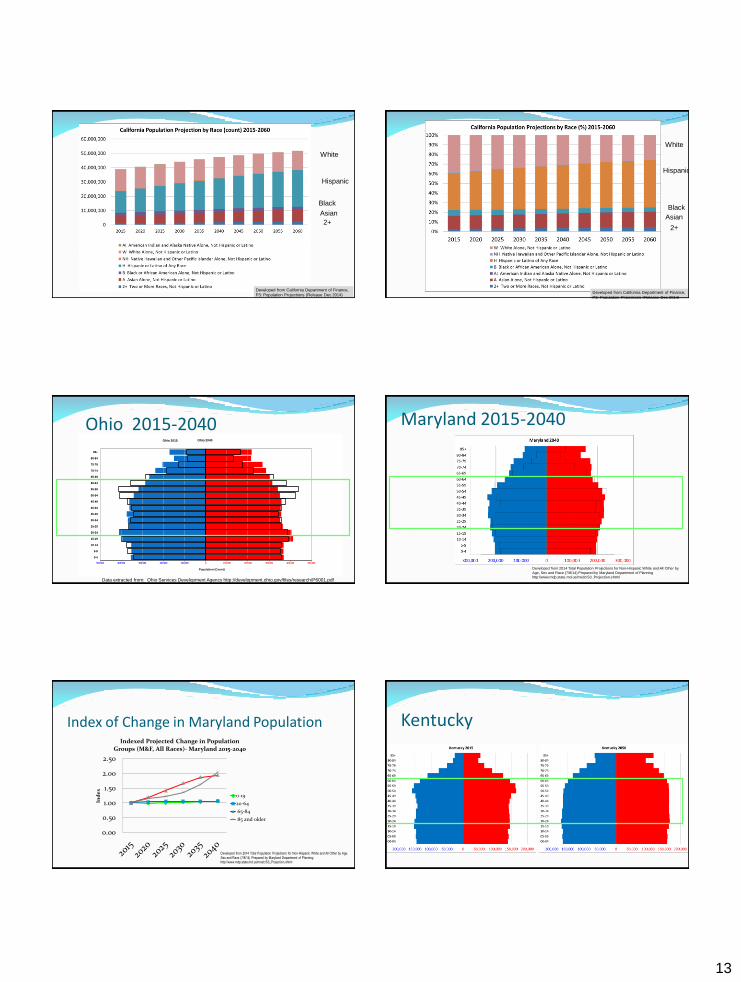
California Population Projections Index of Change in Population
0.00
0.50
1.00
1.50
2.00
2.50
3.00
3.50
Ind
ex
Indexed Projected Change in Population Groups (M&F, All Races)- California 2015-2060
0-19
20-64
65-84
85 and older
13
White
Hispanic
Black
2+
Asian
Developed from California Department of Finance,
P3: Population Projections (Release Dec 2014)
White
Hispanic
Black
2+
Asian
Developed from California Department of Finance,
P3: Population Projections (Release Dec 2014)
Ohio 2015-2040
500,000 400,000 300,000 200,000 100,000 0 100,000 200,000 300,000 400,000 500,000
0-4
5-9
10-14
15-19
20-24
25-29
30-34
35-39
40-44
45-49
50-54
55-59
60-64
65-69
70-74
75-79
80-84
85+
Population (Count)
Ohio 2015
500,000 400,000 300,000 200,000 100,000 0 100,000 200,000 300,000 400,000 500,000
0-4
5-9
10-14
15-19
20-24
25-29
30-34
35-39
40-44
45-49
50-54
55-59
60-64
65-69
70-74
75-79
80-84
85+
Population (Count)
Ohio 2020
500,000 400,000 300,000 200,000 100,000 0 100,000 200,000 300,000 400,000 500,000
0-4
5-9
10-14
15-19
20-24
25-29
30-34
35-39
40-44
45-49
50-54
55-59
60-64
65-69
70-74
75-79
80-84
85+
Population (Count)
Ohio 2025
500,000 400,000 300,000 200,000 100,000 0 100,000 200,000 300,000 400,000 500,000
0-4
5-9
10-14
15-19
20-24
25-29
30-34
35-39
40-44
45-49
50-54
55-59
60-64
65-69
70-74
75-79
80-84
85+
Population (Count)
Ohio 2030
500,000 400,000 300,000 200,000 100,000 0 100,000 200,000 300,000 400,000 500,000
0-4
5-9
10-14
15-19
20-24
25-29
30-34
35-39
40-44
45-49
50-54
55-59
60-64
65-69
70-74
75-79
80-84
85+
Population (Count)
Ohio 2035
500,000 400,000 300,000 200,000 100,000 0 100,000 200,000 300,000 400,000 500,000
0-4
5-9
10-14
15-19
20-24
25-29
30-34
35-39
40-44
45-49
50-54
55-59
60-64
65-69
70-74
75-79
80-84
85+
Population (Count)
Ohio 2040
500,000 400,000 300,000 200,000 100,000 0 100,000 200,000 300,000 400,000 500,000
0-4
5-9
10-14
15-19
20-24
25-29
30-34
35-39
40-44
45-49
50-54
55-59
60-64
65-69
70-74
75-79
80-84
85+
Ohio 2015
Data extracted from: Ohio Services Development Agency http://development.ohio.gov/files/research/P6001.pdf
Maryland 2015-2040
Developed from 2014 Total Population Projections for Non-Hispanic White and All Other by
Age, Sex and Race (7/8/14) Prepared by Maryland Department of Planning
http://www.mdp.state.md.us/msdc/S3_Projection.shtml
Index of Change in Maryland Population
0.00
0.50
1.00
1.50
2.00
2.50
Ind
ex
Indexed Projected Change in Population Groups (M&F, All Races)- Maryland 2015-2040
0-19
20-64
65-84
85 and older
Developed from 2014 Total Population Projections for Non-Hispanic White and All Other by Age,
Sex and Race (7/8/14) Prepared by Maryland Department of Planning
http://www.mdp.state.md.us/msdc/S3_Projection.shtml
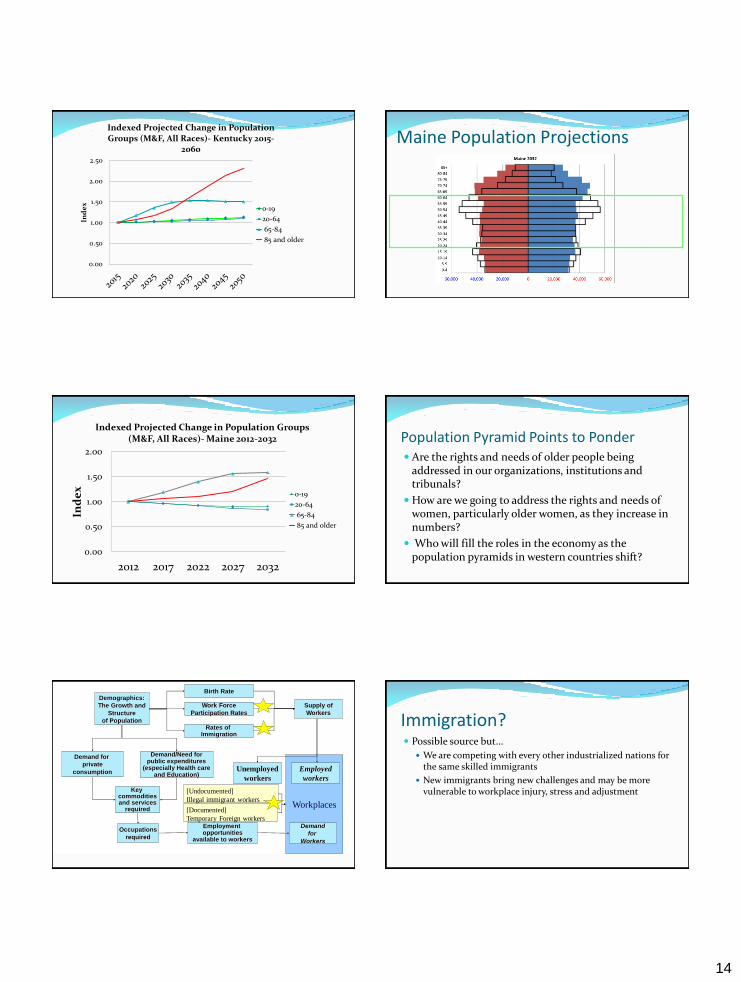
Kentucky
14
0.00
0.50
1.00
1.50
2.00
2.50
Ind
ex
Indexed Projected Change in Population Groups (M&F, All Races)- Kentucky 2015-
2060
0-19
20-64
65-84
85 and older
Maine Population Projections
0.00
0.50
1.00
1.50
2.00
2012 2017 2022 2027 2032
Ind
ex
Indexed Projected Change in Population Groups (M&F, All Races)- Maine 2012-2032
0-19
20-64
65-84
85 and older
Population Pyramid Points to Ponder Are the rights and needs of older people being
addressed in our organizations, institutions and tribunals?
How are we going to address the rights and needs of women, particularly older women, as they increase in numbers?
Who will fill the roles in the economy as the population pyramids in western countries shift?
Workplaces
Demographics:
The Growth and
Structure
of Population
Key commodities and services
required
Employment opportunities
available to workers
Demand
for
Workers
Occupations
required
Rates of Immigration
Work Force
Participation Rates
Birth Rate
Supply of
Workers
Demand for
private
consumption
Demand/Need for public expenditures
(especially Health care and Education)
Unemployed
workers
Employed
workers
[Undocumented]
Illegal immigrant workers
[Documented]
Temporary Foreign workers
Immigration? Possible source but…
We are competing with every other industrialized nations for the same skilled immigrants
New immigrants bring new challenges and may be more vulnerable to workplace injury, stress and adjustment
15
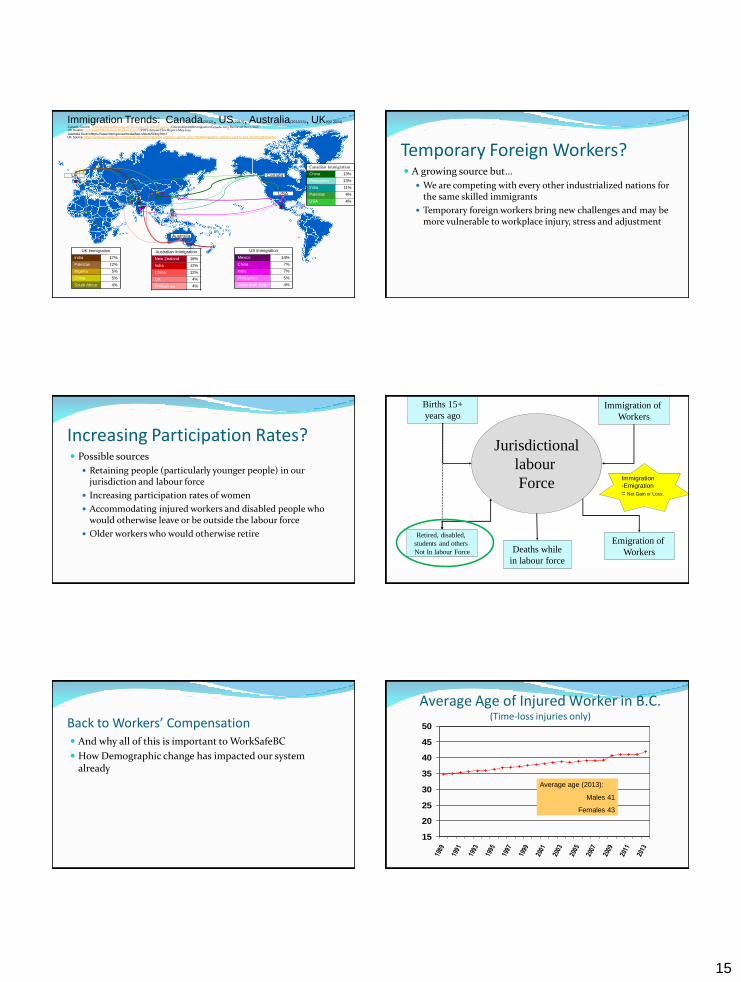
Canada Source: "Citizenship and Immigration Canada, Facts and Figures". Citizenship and Immigration Canada. 2013. Retrieved Dec 7, 2013.
Canada
Canadian Immigration
China 13%
Philippines 13%
India 11%
Pakistan 4%
USA 4%
USA
US Immigration
Mexico 14%
China 7%
India 7%
Philippines 5%
Dominican Rep 4%
US Source: U.S. Lawful Permanent Residents: 2013" (PDF). Annual Flow Report, May 2014
Australian Immigration
New Zealand 18%
India 12%
China 12%
UK 4%
Philippines 4%
Australia Sourcehttps://www.immi.gov.au/media/fact-sheets/02key.htm /
Australia
UK
UK Source: https://www.gov.uk/government/publications/immigration-statistics-april-to-june-2014/immigration-statistics-april-to-june-2014#settlement-1
UK Immigration
India 17%
Pakistan 12%
Nigeria 5%
China 5%
South Africa 4%
Immigration Trends: Canada(2012), US(2013), Australia(2012/13), UK(Q2 2014)
Temporary Foreign Workers? A growing source but…
We are competing with every other industrialized nations for the same skilled immigrants
Temporary foreign workers bring new challenges and may be more vulnerable to workplace injury, stress and adjustment
Increasing Participation Rates? Possible sources
Retaining people (particularly younger people) in our jurisdiction and labour force
Increasing participation rates of women
Accommodating injured workers and disabled people who would otherwise leave or be outside the labour force
Older workers who would otherwise retire
Jurisdictional
labour
Force
Births 15+
years ago
Retired, disabled,
students and others
Not In labour Force Deaths while
in labour force
Immigration of
Workers
Emigration of
Workers
Immigration
-Emigration
= Net Gain or Loss.
Back to Workers’ Compensation And why all of this is important to WorkSafeBC
How Demographic change has impacted our system already
15
20
25
30
35
40
45
50
1989
1991
1993
1995
1997
1999
2001
2003
2005
2007
2009
2011
2013
Average age (2013):
Males 41
Females 43
Average Age of Injured Worker in B.C. (Time-loss injuries only)
16
http://pwhr.sites.olt.ubc.ca/files/2012/02/Annual-Report-1011.pdf
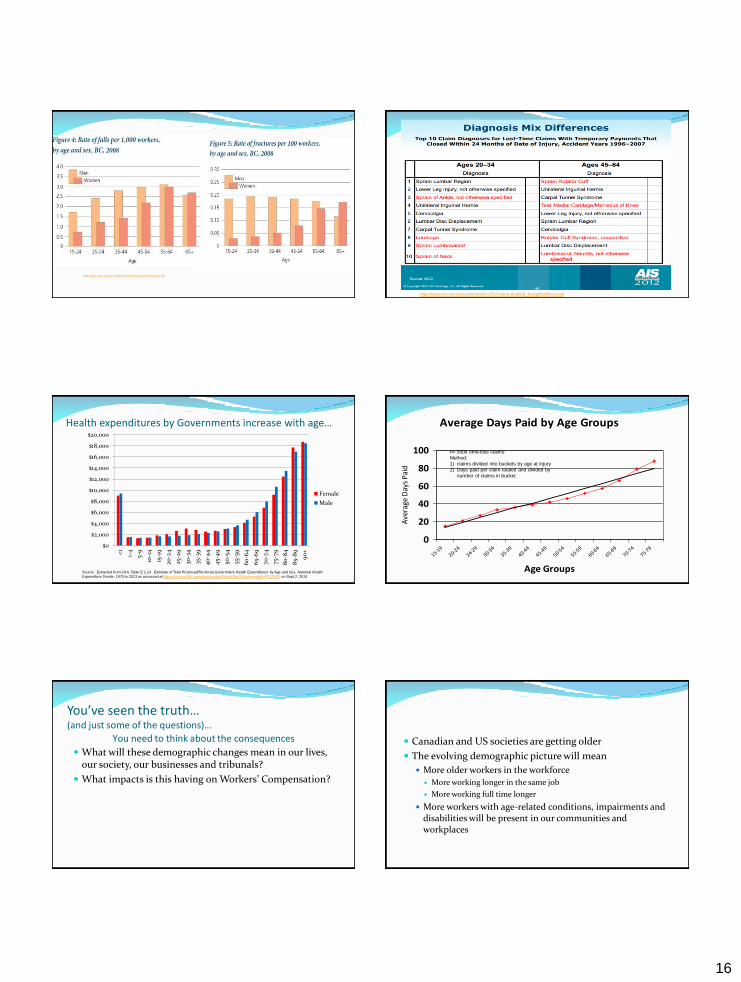
Source: http://www.ncci.com/Documents/AIS-2012-Harry-Shuford_AgingWorkforce.pdf
Health expenditures by Governments increase with age…
Source: Extracted from CIHI, Table E 1.14 Estimate of Total Provincial/Territorial Government Health Expenditures by Age and Sex, National Health
Expenditure Trends, 1975 to 2013 as accessed at https://secure.cihi.ca/estore/productFamily.htm?locale=en&pf=PFC2400 on Sept 2, 2014
$0
$2,000
$4,000
$6,000
$8,000
$10,000
$12,000
$14,000
$16,000
$18,000
$20,000
<1
1-4
5-9
10-1
4
15-1
9
20-2
4
25-2
9
30-3
4
35-3
9
40
-44
45-
49
50-5
4
55-5
9
60
-64
65-
69
70-7
4
75-7
9
80
-84
85-
89
90
+
Female
Male
Average Days Paid by Age Groups
0
20
40
60
80
100
15-19
20-24
24-29
30-34
35-39
40-44
45-49
50-54
55-59
60-64
65-69
70-74
75-79
Age Groups
Ave
rage
Day
s Pa
id
n= 500k time-loss claims
Method:
1) claims divided into buckets by age at injury
2) Days paid per claim totaled and divided by
number of claims in bucket
You’ve seen the truth… (and just some of the questions)…
What will these demographic changes mean in our lives, our society, our businesses and tribunals?
What impacts is this having on Workers’ Compensation?
You need to think about the consequences Canadian and US societies are getting older
The evolving demographic picture will mean
More older workers in the workforce
More working longer in the same job
More working full time longer
More workers with age-related conditions, impairments and disabilities will be present in our communities and workplaces
17
And… Dementia, Alzheimer's, depression will
Become more prevalent
Require direct and indirect departures from the labour force
Increase demands for health care services
Normal aging for an increasing proportion of the population will
Increase demand for physiotherapy, medication, home care, and hospital services
Drive up costs for wages, recruitment, retention
Result in increased competition for scarce resources
Further… We will see more people from outside Canada and the US
come to live permanently and temporarily to fill many occupations…
and see other countries recruiting young North Americans to move to their countries.
Older workers will become more prevalent in the labour force
More workers will be vulnerable to work-related injury due to “newness” to the job (major risk factor for injury)
Language and culture (communications issues)
Economics (need to work longer hours, years, multiple jobs)
Precariousness of employment (part-time contingent employment)
Some final thoughts Be sensitive…
Take care of your health…
Be very nice to your children…
Be very generous to your retirement savings… AASCIF Convention 2015: Bridging the Future
San Francisco July 6
Terrance J. Bogyo
Independent Researcher | Speaker | Consultant


![Category 1: Print Marketing Piece - AASCIF 2017 Communications Awards Results[1].pdf · Category 1: Print Marketing Piece 3rd Place: California State Compensation Insurance Fund Process](https://img.pdfslide.us/doc/110x75/5e684d5005112d5d2660d75d/category-1-print-marketing-piece-2017-communications-awards-results1pdf.jpg)