Embed Size (px)
Citation preview
Punitiveness in the Imprisonment of Women, 1977-2004
Natasha A. FrostNortheastern University
Previous Research
Extensive previous research on the growth in imprisonment over the past several decades.
Substantial previous research on state level variations in imprisonment.
Very few studies have parsed the growth in imprisonment by gender.
Purpose of the Punitiveness Project
Document growth in the imprisonment of female offenders by state and over time (Punitiveness Phase I).
http://www.wpaonline.org/institute/hardhit/index.htm
Explore state level variations in punitiveness toward female offenders using both imprisonment rates and the dual determinants of those rates (Punitiveness Phase II).
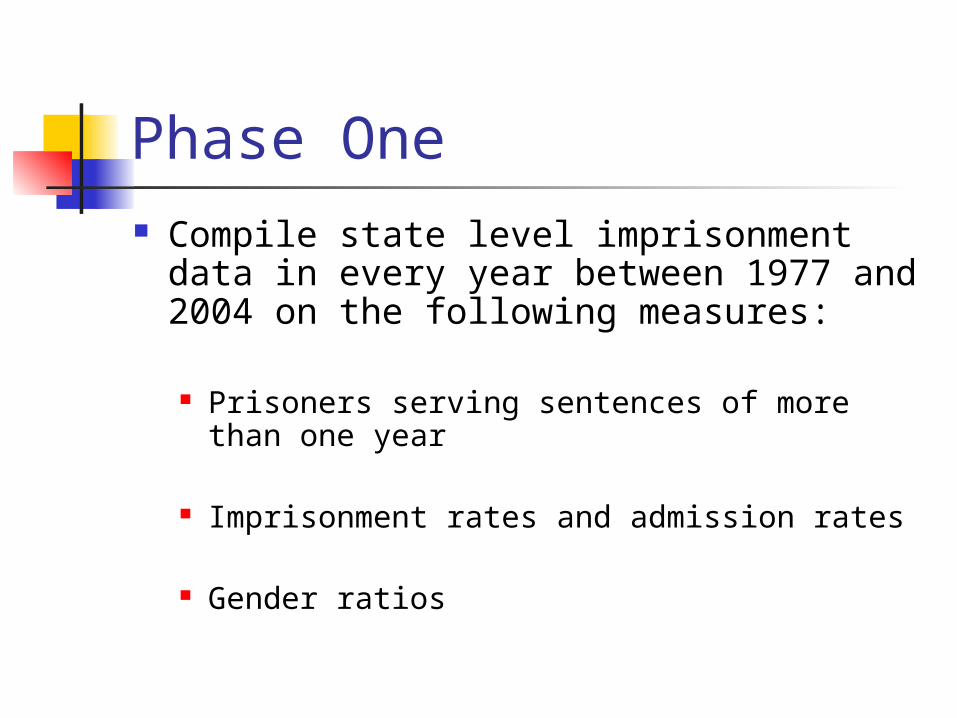
Phase One Compile state level imprisonment data
in every year between 1977 and 2004 on the following measures:
Prisoners serving sentences of more than one year
Imprisonment rates and admission rates
Gender ratios
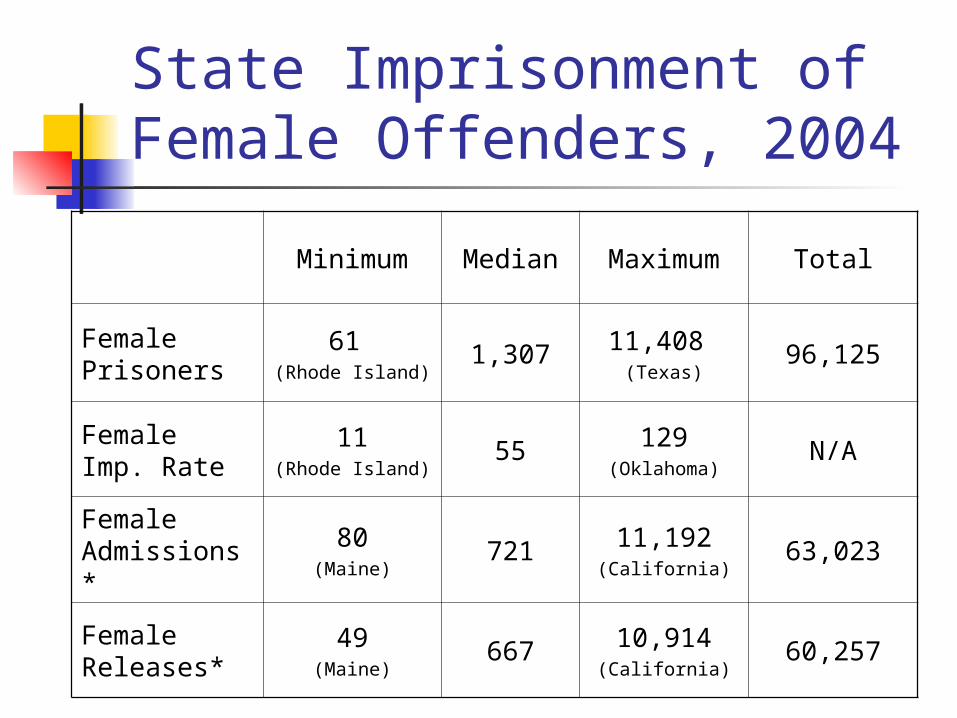
State Imprisonment of Female Offenders, 2004
Minimum Median Maximum Total
Female Prisoners
61 (Rhode Island)
1,307 11,408 (Texas)
96,125
Female Imp. Rate
11(Rhode Island)
55 129(Oklahoma)
N/A
Female Admissions*
80(Maine)
721 11,192(California)
63,023
Female Releases*
49(Maine)
667 10,914(California)
60,257
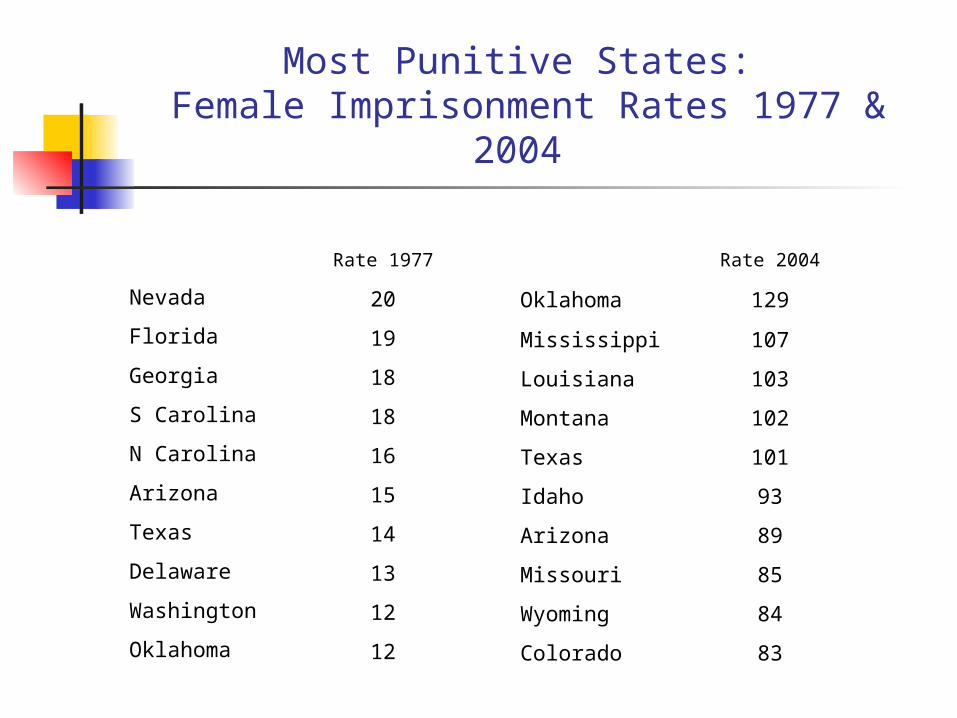
Most Punitive States: Female Imprisonment Rates 1977 & 2004
Rate 2004
Oklahoma 129
Mississippi 107
Louisiana 103
Montana 102
Texas 101
Idaho 93
Arizona 89
Missouri 85
Wyoming 84
Colorado 83
Rate 1977
Nevada 20
Florida 19
Georgia 18
S Carolina 18
N Carolina 16
Arizona 15
Texas 14
Delaware 13
Washington 12
Oklahoma 12
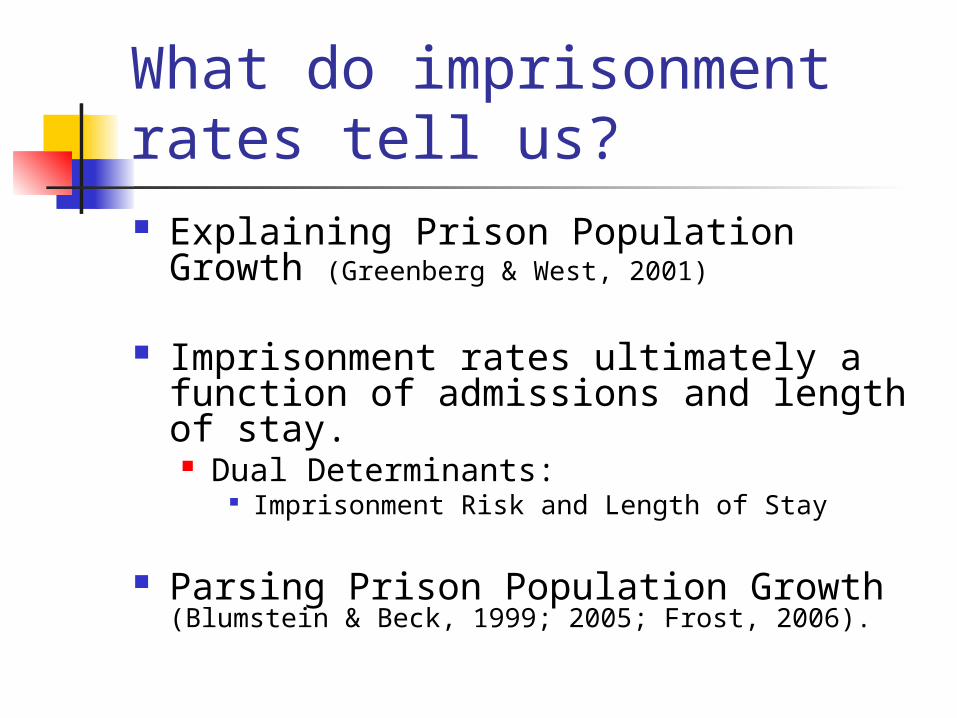
What do imprisonment rates tell us? Explaining Prison Population Growth
(Greenberg & West, 2001)
Imprisonment rates ultimately a function of admissions and length of stay. Dual Determinants:
Imprisonment Risk and Length of Stay
Parsing Prison Population Growth (Blumstein & Beck, 1999; 2005; Frost, 2006).
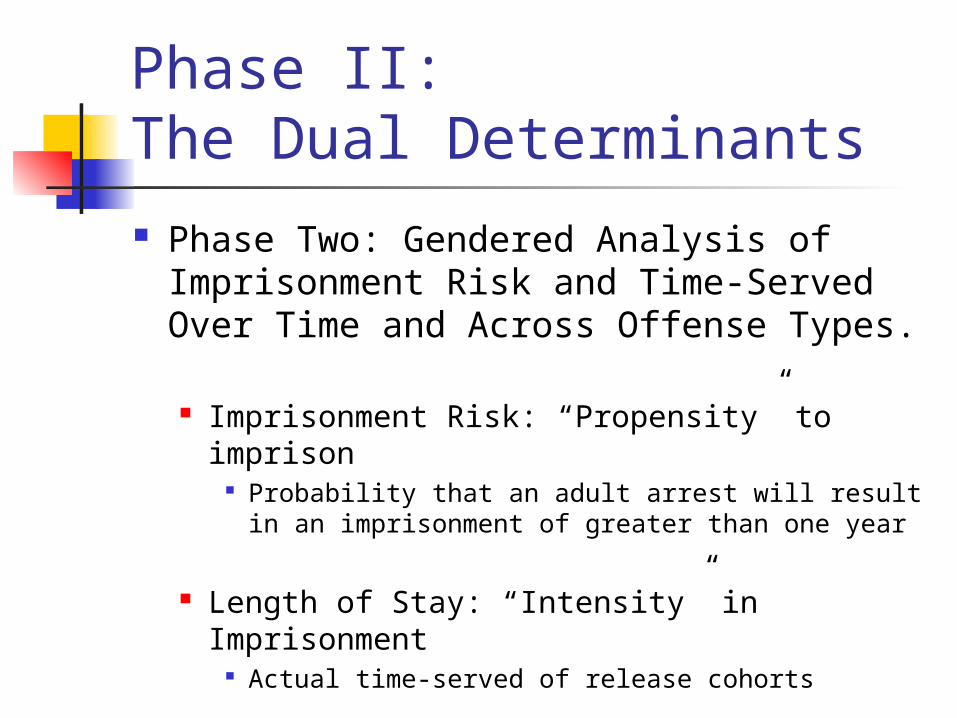
Phase II: The Dual Determinants Phase Two: Gendered Analysis of
Imprisonment Risk and Time-Served Over Time and Across Offense Types.
Imprisonment Risk: “Propensity” to imprison Probability that an adult arrest will result in an
imprisonment of greater than one year
Length of Stay: “Intensity” in Imprisonment Actual time-served of release cohorts
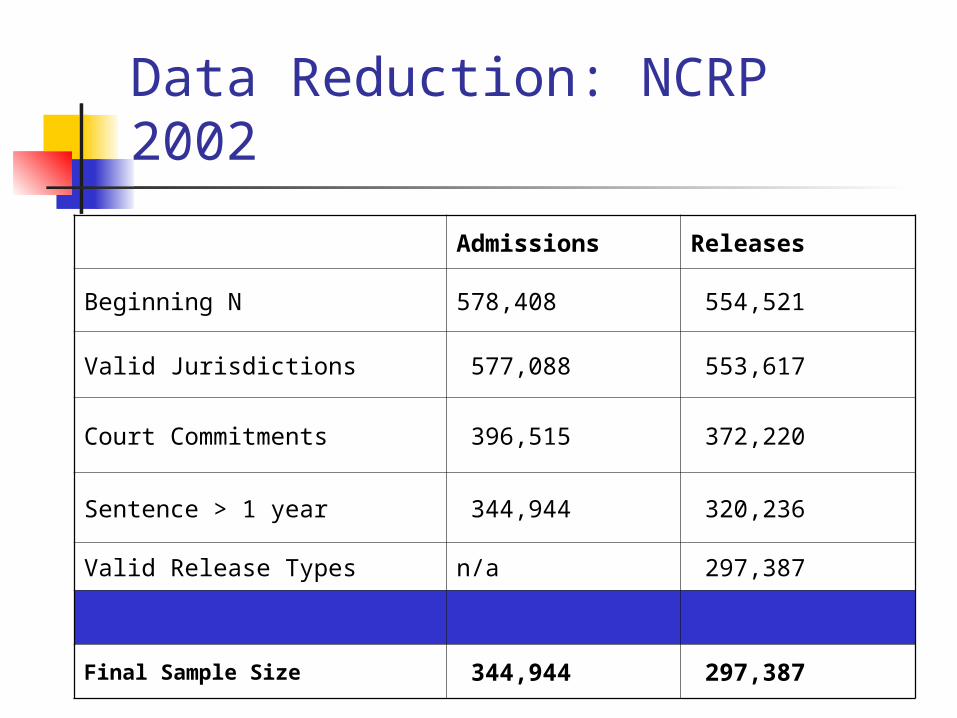
Data Reduction: NCRP 2002
Admissions Releases
Beginning N 578,408 554,521
Valid Jurisdictions 577,088 553,617
Court Commitments 396,515 372,220
Sentence > 1 year 344,944 320,236
Valid Release Types n/a 297,387
Final Sample Size 344,944 297,387
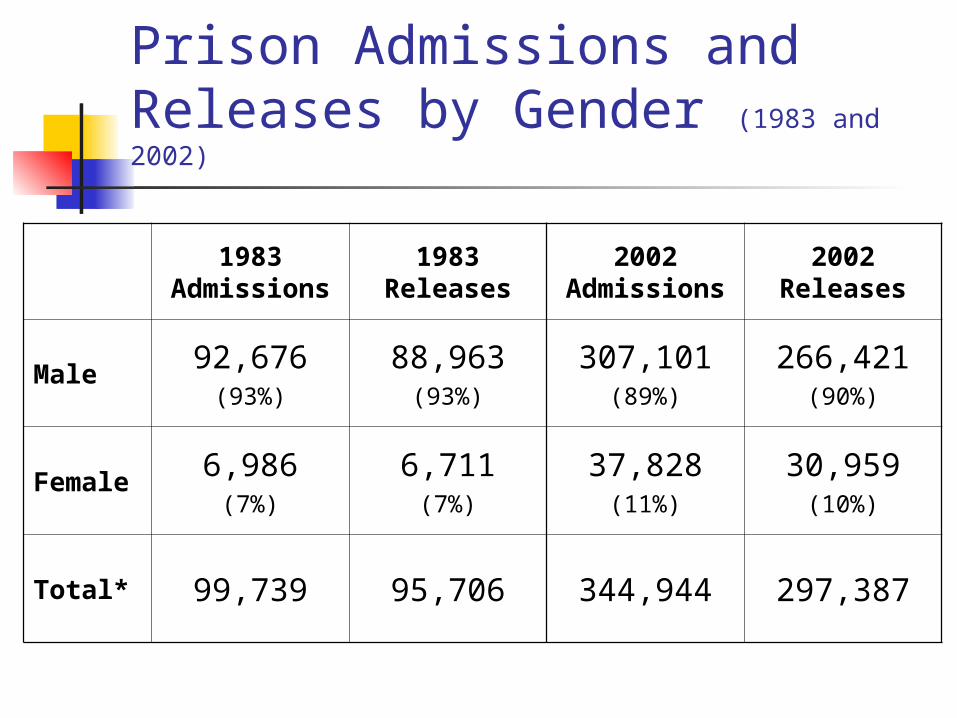
Prison Admissions and Releases by Gender (1983 and 2002)
1983 Admissions
1983 Releases
2002 Admissions
2002 Releases
Male 92,676(93%)
88,963(93%)
307,101(89%)
266,421(90%)
Female
6,986(7%)
6,711(7%)
37,828(11%)
30,959(10%)
Total* 99,739 95,706 344,944 297,387
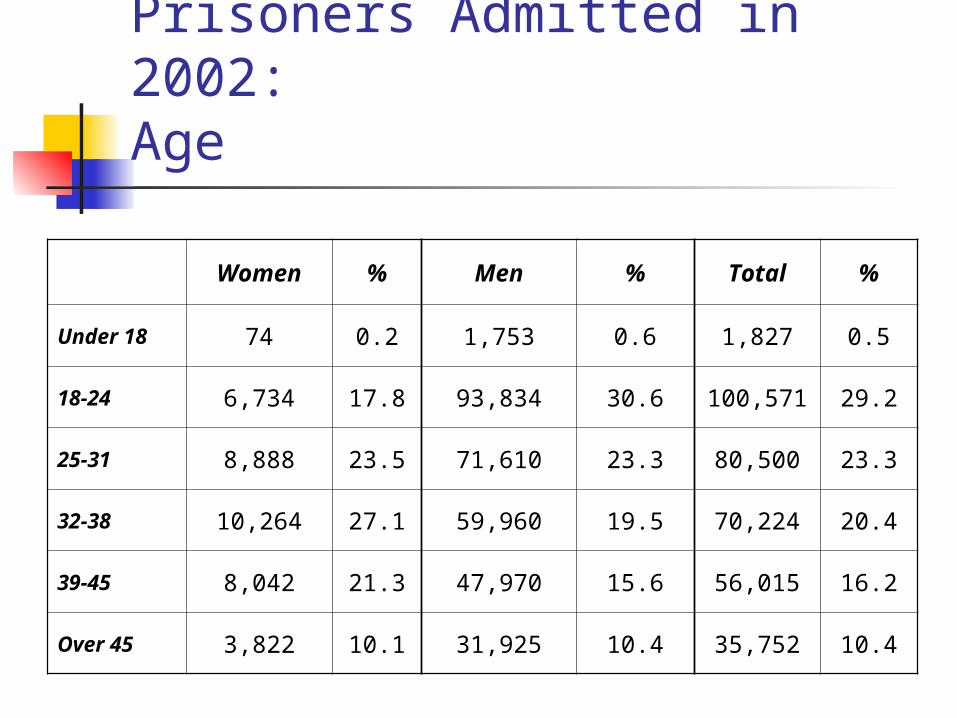
Prisoners Admitted in 2002: Age
Women % Men % Total %
Under 18 74 0.2 1,753 0.6 1,827 0.5
18-24 6,734 17.8 93,834 30.6 100,571 29.2
25-31 8,888 23.5 71,610 23.3 80,500 23.3
32-38 10,264 27.1 59,960 19.5 70,224 20.4
39-45 8,042 21.3 47,970 15.6 56,015 16.2
Over 45 3,822 10.1 31,925 10.4 35,752 10.4
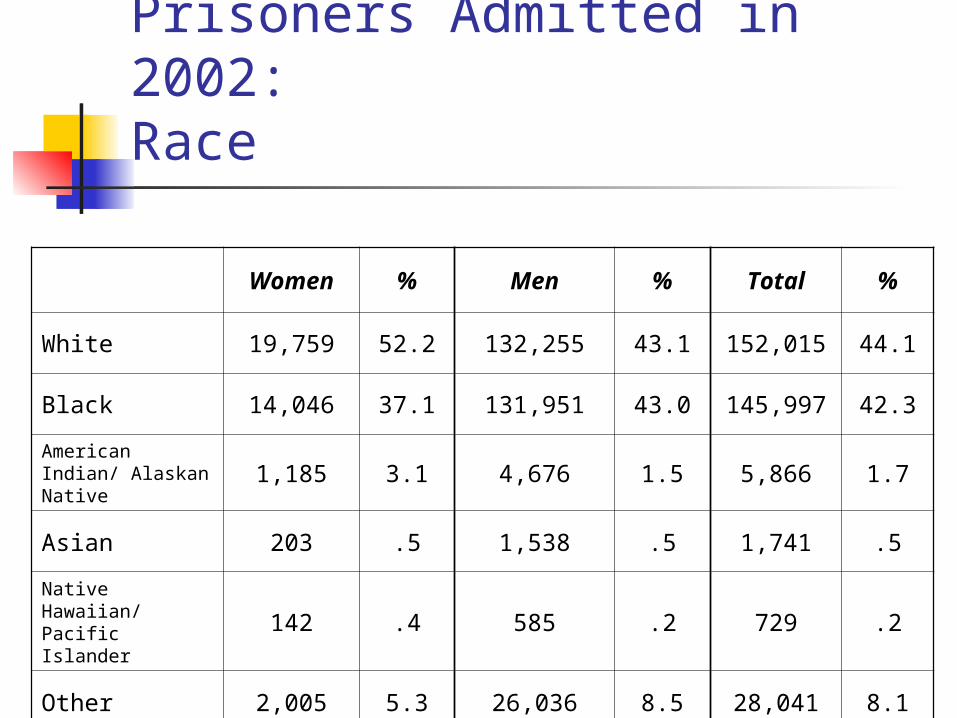
Prisoners Admitted in 2002: Race
Women % Men % Total %
White 19,759 52.2 132,255 43.1 152,015 44.1
Black 14,046 37.1 131,951 43.0 145,997 42.3
American Indian/ Alaskan Native 1,185 3.1 4,676 1.5 5,866 1.7
Asian 203 .5 1,538 .5 1,741 .5
Native Hawaiian/ Pacific Islander 142 .4 585 .2 729 .2
Other 2,005 5.3 26,036 8.5 28,041 8.1
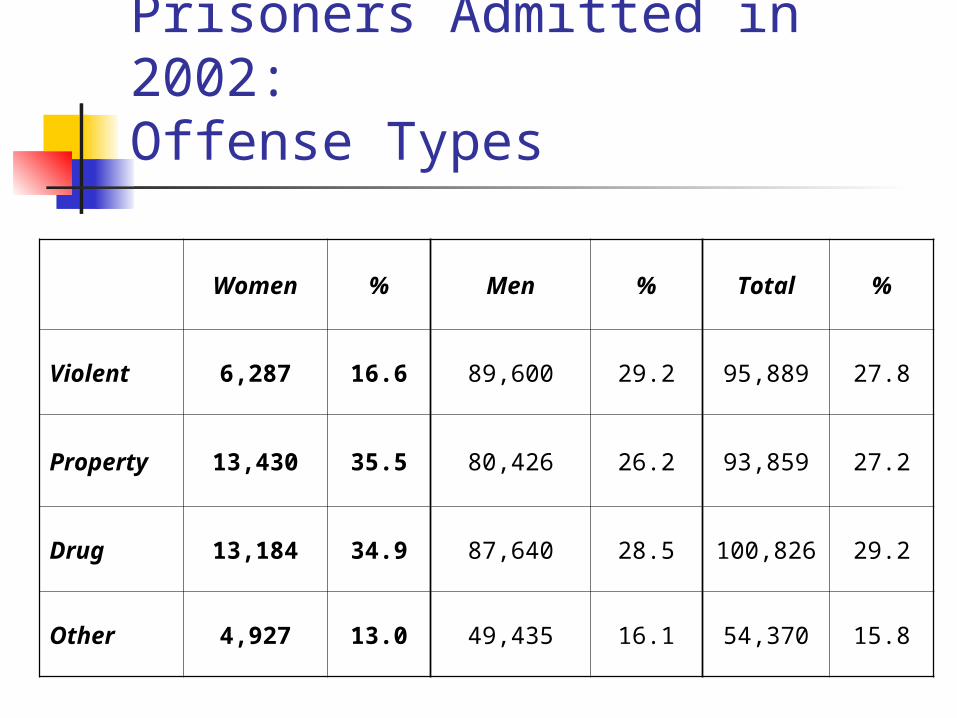
Prisoners Admitted in 2002:Offense Types
Women % Men % Total %
Violent 6,287 16.6 89,600 29.2 95,889 27.8
Property 13,430 35.5 80,426 26.2 93,859 27.2
Drug 13,184 34.9 87,640 28.5 100,826 29.2
Other 4,927 13.0 49,435 16.1 54,370 15.8
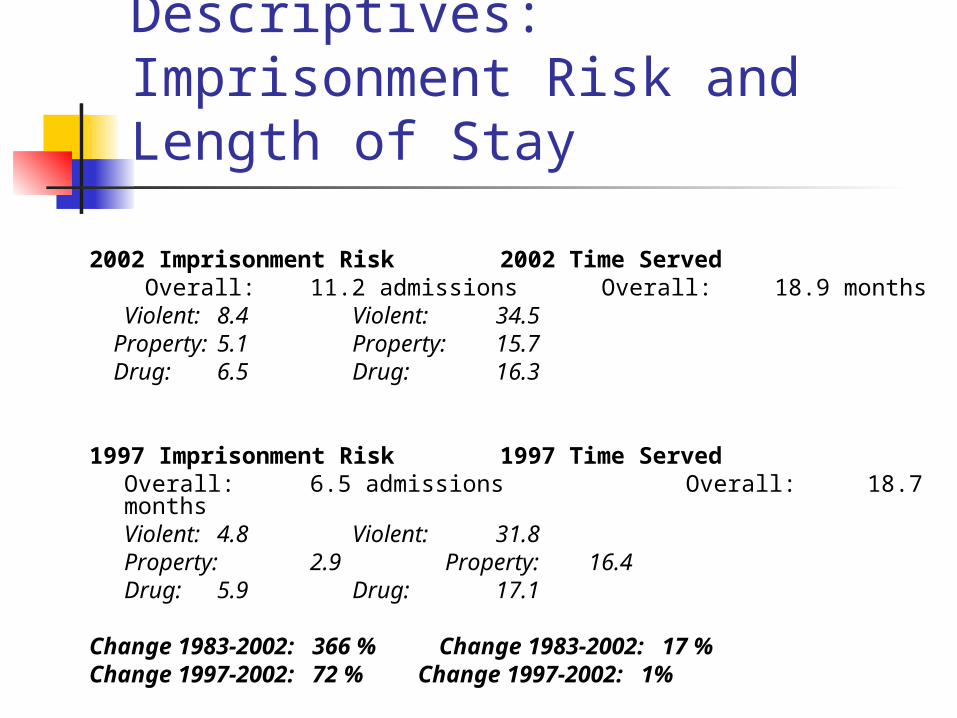
Descriptives: Imprisonment Risk and Length of Stay
2002 Imprisonment Risk 2002 Time Served Overall: 11.2 admissions Overall: 18.9
monthsViolent: 8.4 Violent: 34.5
Property: 5.1 Property: 15.7 Drug: 6.5 Drug: 16.3
1997 Imprisonment Risk 1997 Time ServedOverall: 6.5 admissions Overall: 18.7 monthsViolent: 4.8 Violent: 31.8Property: 2.9 Property: 16.4Drug: 5.9 Drug: 17.1
Change 1983-2002: 366 % Change 1983-2002: 17 %Change 1997-2002: 72 % Change 1997-2002: 1%
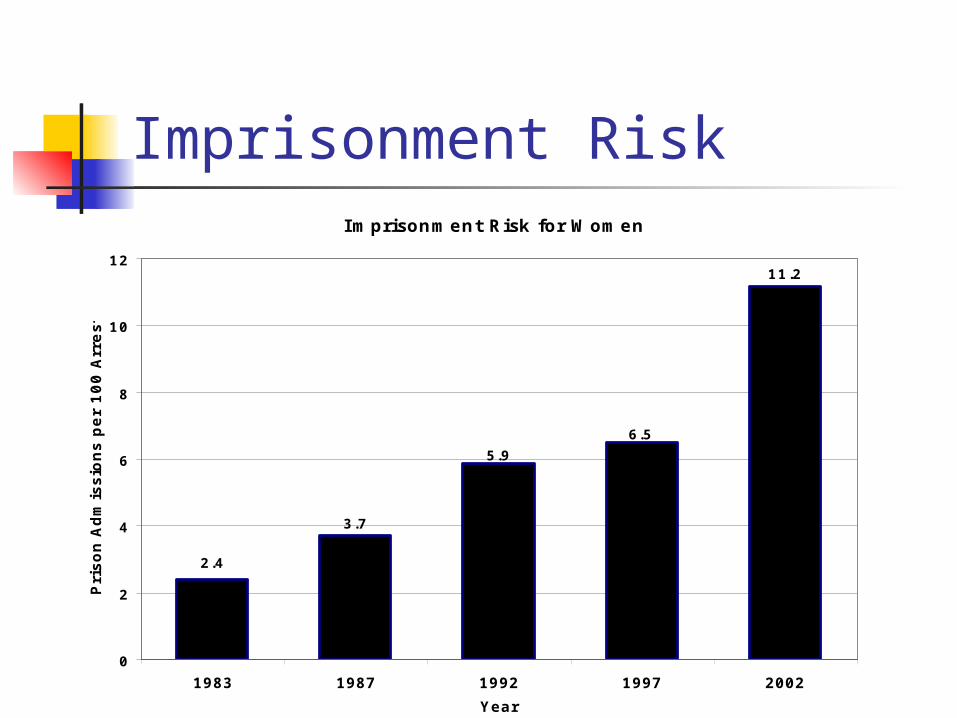
Imprisonment RiskImprisonment Risk for Women
3.7
11.2
6.5
5.9
2.4
0
2
4
6
8
10
12
1983 1987 1992 1997 2002
Year
Pri
son A
dm
issio
ns p
er
100 A
rrests
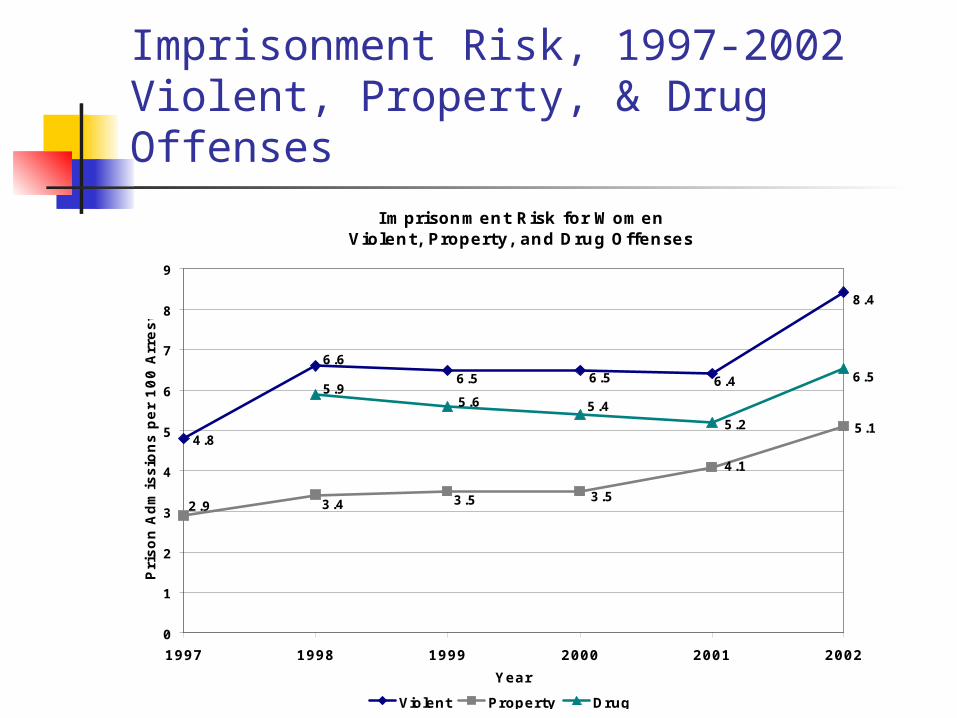
Imprisonment Risk, 1997-2002 Violent, Property, & Drug Offenses
Imprisonment Risk for Women Violent, Property, and Drug Offenses
4.85.1
6.5 6.4
6.6
8.4
6.5
4.1
2.93.53.53.4
5.25.45.6
5.96.5
0
1
2
3
4
5
6
7
8
9
1997 1998 1999 2000 2001 2002
Year
Pri
son A
dm
issio
ns p
er
100 A
rrests
Violent Property Drug
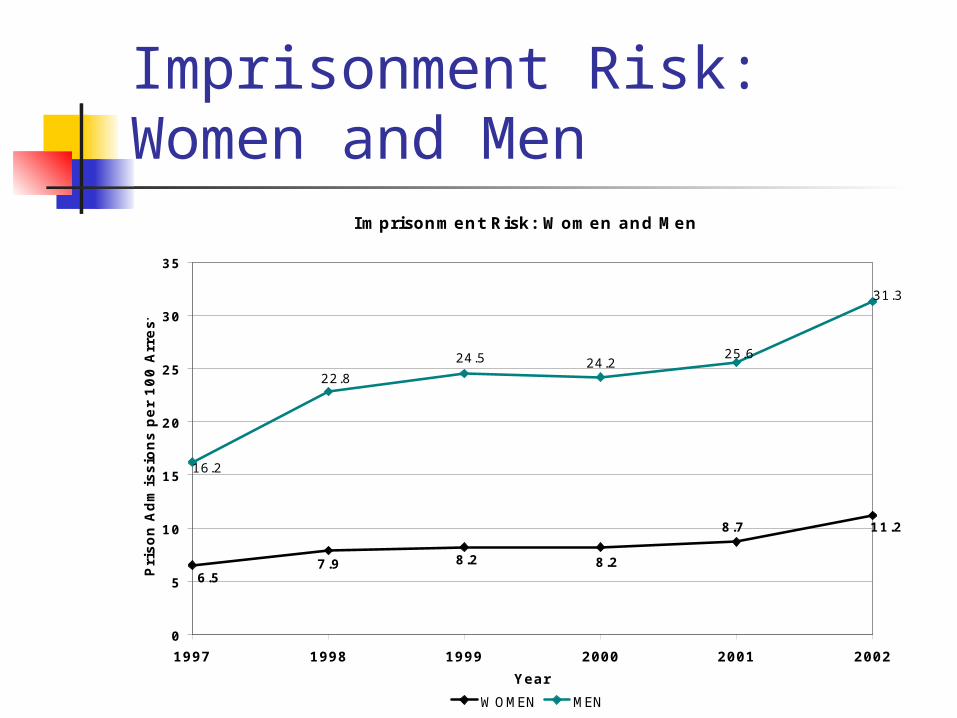
Imprisonment Risk:Women and Men
Imprisonment Risk: Women and Men
8.28.2
11.2
7.96.5
8.7
31.3
25.624.5
22.8
16.2
24.2
0
5
10
15
20
25
30
35
1997 1998 1999 2000 2001 2002
Year
Pri
son A
dm
issio
ns p
er
100 A
rrests
WOMEN MEN
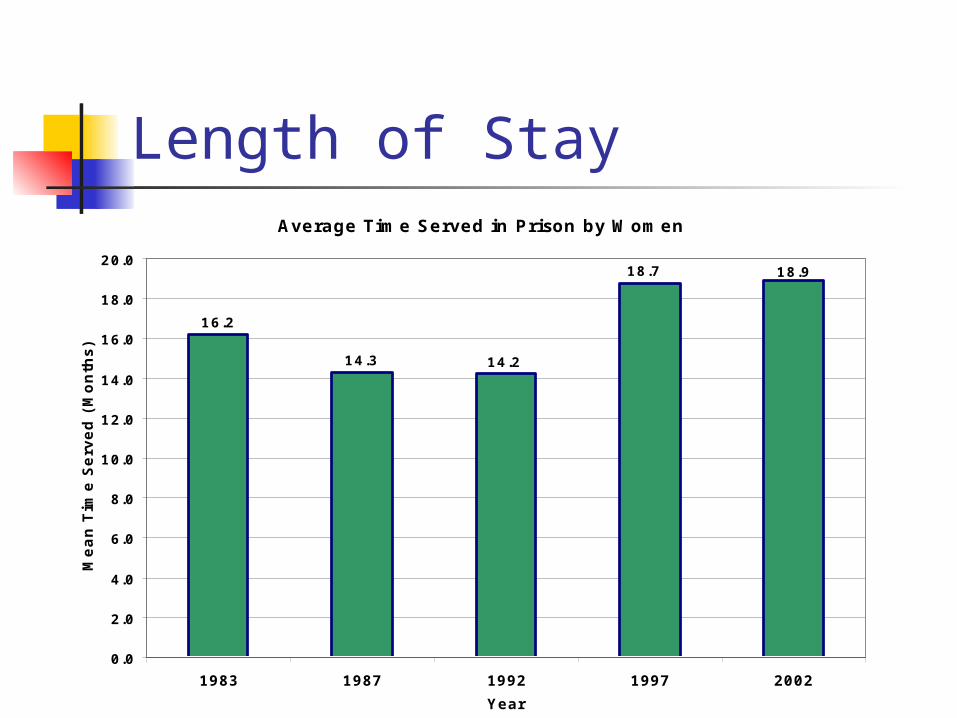
Length of StayAverage Time Served in Prison by Women
16.2
14.3
18.7
14.2
18.9
0.0
2.0
4.0
6.0
8.0
10.0
12.0
14.0
16.0
18.0
20.0
1983 1987 1992 1997 2002
Year
Mean T
ime S
erv
ed (
Month
s)
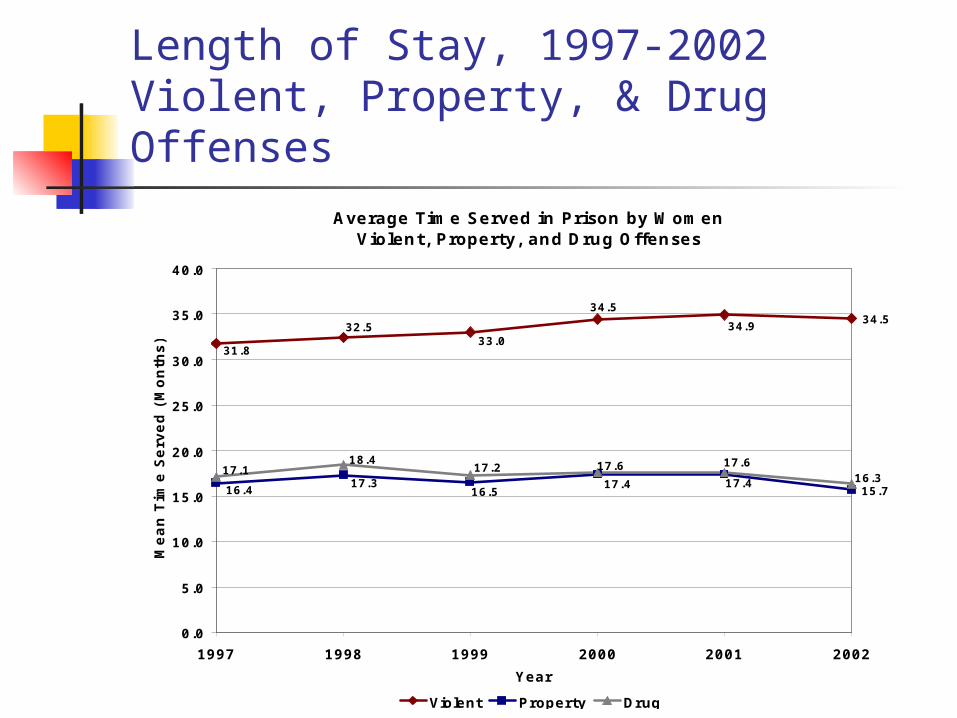
Length of Stay, 1997-2002 Violent, Property, & Drug Offenses
Average Time Served in Prison by Women Violent, Property, and Drug Offenses
34.5
15.7
34.5
33.031.8
34.932.5
17.417.416.5
17.316.4
16.317.617.617.217.1
18.4
0.0
5.0
10.0
15.0
20.0
25.0
30.0
35.0
40.0
1997 1998 1999 2000 2001 2002
Year
Mean T
ime S
erv
ed (
Month
s)
Violent Property Drug
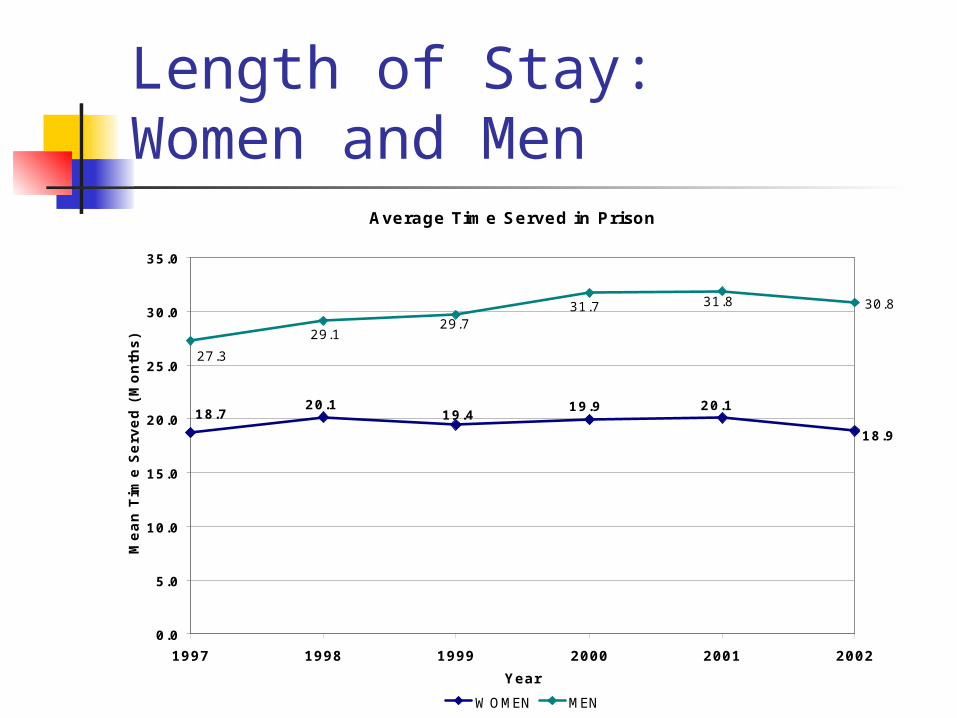
Length of Stay:Women and Men
Average Time Served in Prison
30.8
20.1 20.118.7
18.9
19.419.9
27.3
29.129.7
31.7 31.8
0.0
5.0
10.0
15.0
20.0
25.0
30.0
35.0
1997 1998 1999 2000 2001 2002
Year
Mean T
ime S
erv
ed (
Month
s)
WOMEN MEN

Future Phases in the Punitiveness Project Individual State Reports
Imprisonment Rates, Imprisonment Risk, and Length of Stay
Across Offense Types and Over Time Underlying Trends (Arrests and Admissions) Legislative Changes and State Initiatives
Gender and Race Analyses Detailed Offense Type Analyses
Underlying Violent, Property, and Drug Offenses


![Alternative to Imprisonment- Mashhood11[1]](https://img.pdfslide.us/doc/110x75/577d296d1a28ab4e1ea6c400/alternative-to-imprisonment-mashhood111.jpg)