Embed Size (px)
Citation preview

Pumping Tests andHydrogeologic Data
Daniel O. Niemela P.G.

Topics
• Well and aquifer basics• Pumping tests• Data analysis• Projecting well performance

Water Well 101
• Water level in wellis lower than waterlevel in aquifer
• Greater welldrawdown results ingreater flow
• Well yield anddrawdown can bepredictable
Static Water Level
Pumping Water Level

Hydrogeologic Terms
• Static Water Level(SWL)
• Pumping Water Level(PWL)
• Drawdown(PWL) – (SWL) = s
• Available Drawdown(Max PWL) – (SWL)
s
SWL
PWL
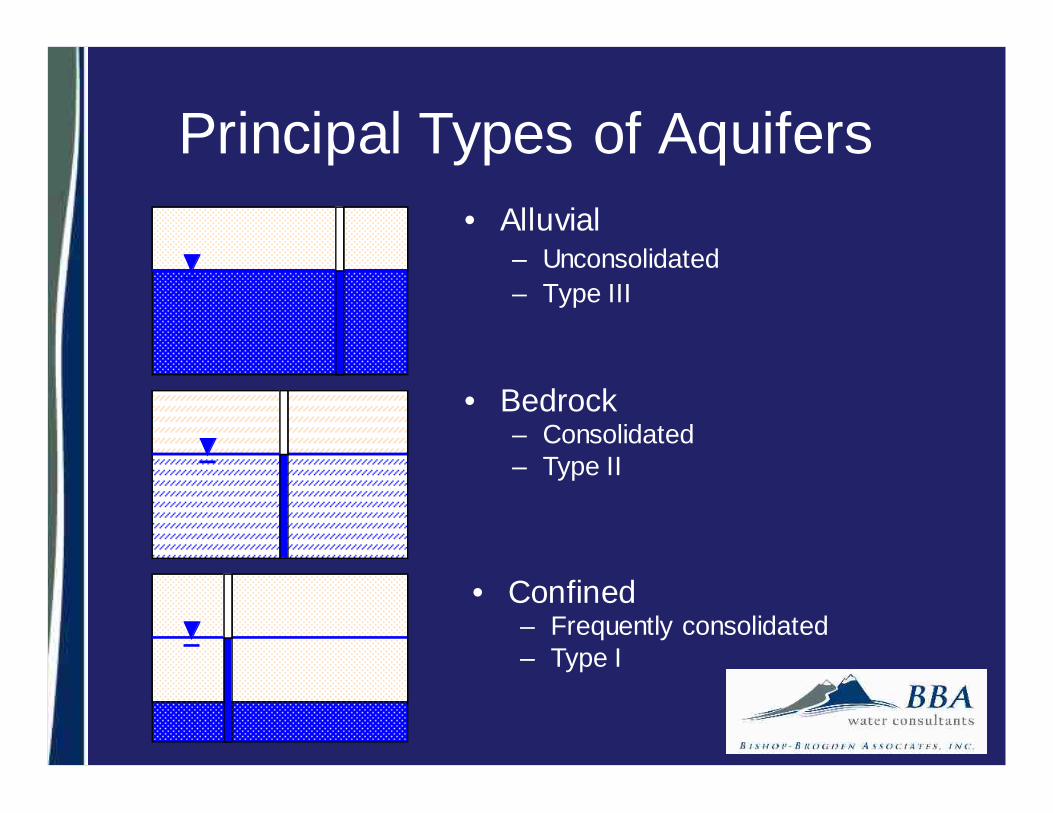
Principal Types of Aquifers• Alluvial
– Unconsolidated– Type III
• Bedrock– Consolidated– Type II
• Confined– Frequently consolidated– Type I

• Measure flow rate and water level• Determine yield for permanent pump
setting• Collect aquifer data• Pumping development (remove fines)• Water rights (document use rate)
Pumping Test Objectives

Manners of Well Testing
• Pumping (submersible, turbine, etc.)• Airlift (Baski)• Bailer (Low flow rate)• “Slug” (only for aquifer properties)

Pumping Test Field Measurements
• Flow rates– Totalizing flow meter, instantaneous flow meter,
orifice, flume/weir, 5-gallon bucket– Stop watch– Redundant
• Water levels– M-Scope, pressure transducer, airline, sounder– Redundant– 1” PVC tube(s) for easy access downhole

Dan’s Six Pump Test Essentials
1. M-Scope2. 5-gallon bucket3. Stopwatch4. 2 pens5. Notepad6. Calculator
Graduated Bucket
M-Scope

Measurements and Observations• Well construction
– Borehole depth, diameter– Casing and screen size diameter– Screened interval
• SWL, PWL’s• Recovery WL’s *** especially for low yield wells ***• Observation well WL’s (Nearby Wells)• Total well depth before and after testing• Flow rates• Sand production• Color of discharge• Location of discharge• Water quality• Temperature• Weather• Time, date• Nearby streams, ditches, etc.
You only get onechance todocument apumping test!

Constant-Discharge Pumping Test
• Easiest to data to evaluate because only WL’s change• Constant flow during duration of test (<10% change)• Most water level change occurs early in test• Measure flow rate and water levels at specific intervals
– 1 to 10 minutes : Every 1 minute– 10 to 20 minutes: Every 2 minutes– 20 to 50 minutes: Every 5 minutes– 50 to 90 minutes: Every 10 minutes– 1.5 to 4 hours: Every ½ hour– 4 to 24 hours: Every 1 hour
• Most important: Write down WHEN the measurement iscollected, even if it is late

0.0
50.0
100.0
150.0
200.0
0 240 480 720 960 1200 1440
Ti me (mi n)
Dra
wdo
wn
(ft)
Constant Discharge Pumping TestLinear Graph (24 – hours)
675 gpmArapahoe Aquifer

0.0
50.0
100.0
150.0
200.0
0.1 1 10 100 1000 10000Ti me (min)
Dra
wdo
wn
(ft)
Transducer Theis Type-Curve
Constant Discharge Pumping TestSemi-Log Graph (24 – hours)
675 gpmArapahoe Aquifer

Constant Discharge Pumping TestLog-Log Graph (24 – hours)
675 gpmArapahoe Aquifer
1.0
10.0
100.0
1000.0
0.1 1 10 100 1000 10000Time (min)
Dra
wdo
wn
(ft)
Transducer T heis Type-Curve
Theis -Curve

Consistent Response for LongerPumping Periods (7 – days)
1.0
10.0
100.0
1000.0
1 10 100 1000 10000 100000Time (min)
Dra
wdo
wn
(ft)
MiniT roll Dat a Match P oint T heis Type-Curve
150 gpmArapahoe Aquifer

Step Pumping Test
0.00
100.00
200.00
300.00
0 20 40 60 80 100 120 140 160
Ti me (min)
Dra
wdo
wn
(ft)
40 gpm, 70 gpm, 100 gpmLower Arapahoe Aquifer

Water Level Recovery
0.0
5.0
10.0
15.0
2 0.0
0 2 40 480 720 960 1200 144 0
T im e ( mi n)
0. 0
50.0
100.0
150.0
200.0
0 240 480 720 960 1200 1440
Time (m in)
Dra
wdow
n (ft
)
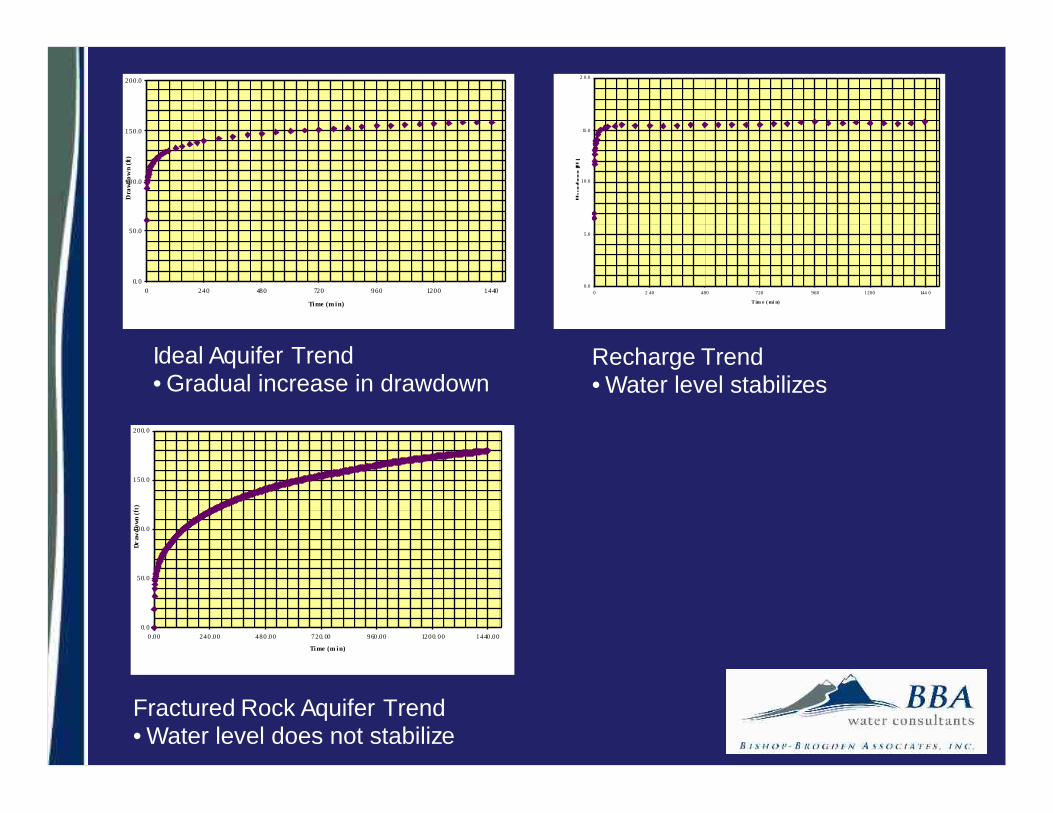
Ideal Aquifer Trend• Gradual increase in drawdown
Recharge Trend• Water level stabilizes
0. 0
50. 0
100. 0
150. 0
200. 0
0.00 240.00 480.00 720. 00 960.00 1200. 00 1440.00
Time (m in)
Draw
down
(ft)
Fractured Rock Aquifer Trend• Water level does not stabilize

Constant Discharge Pumping Test(80 – minutes)
0.0
0.1
1.0
10.0
100.0
0 .10 1.00 10.00 100.00 1000.00 10000.00Time (min )
Dra
wdo
wn
(ft)
Transducer Match Point Theis Type-Curve
25 gpmMountain Alluvial Aquifer

Plot Data in the Field
• Identify for trends• Watch out for changes in trends

Plot Data in the Field (cont.)
ProjectedDrawdown

Well Performance Projections
1.0
10.0
100.0
1000.0
0.1 1 10 100 1000 10000Time (min)
Dra
wdo
wn
(ft)
Transducer Theis T ype-Curve 200 gpm 400 gpm
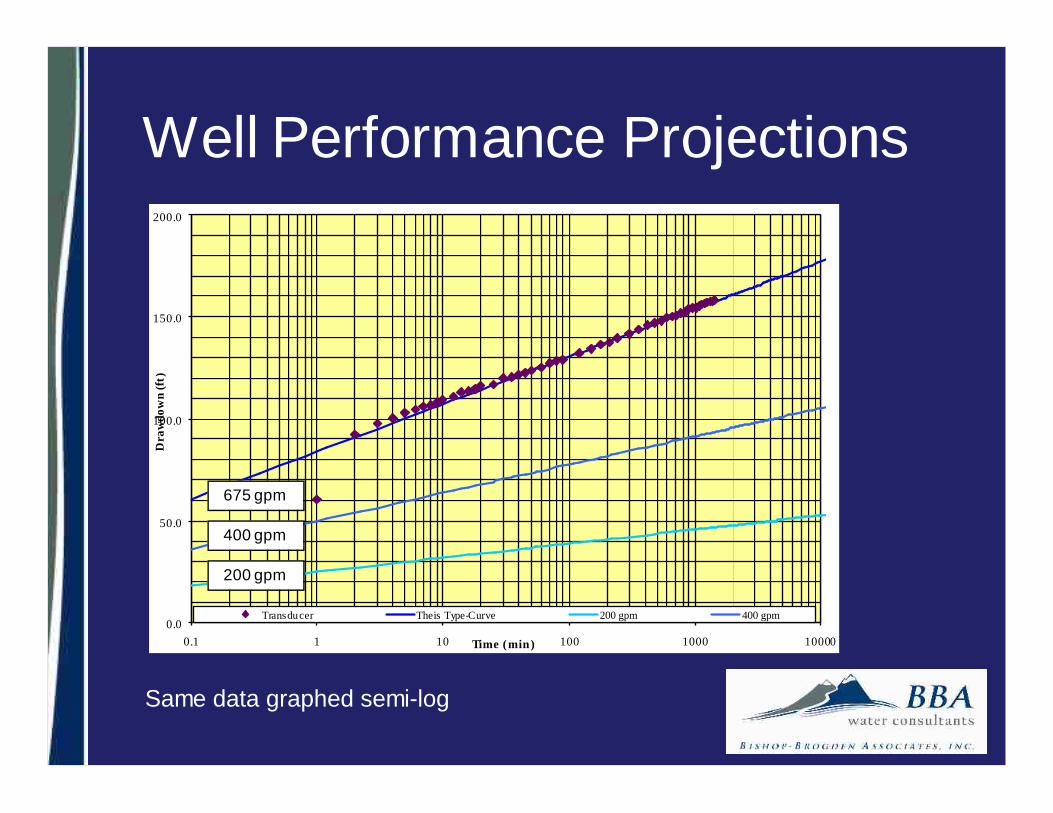
Estimate drawdown for different pumping rates usingcalculated transmissivity and storativity
675 gpm
400 gpm
200 gpm
0.0
50.0
100.0
150.0
200.0
0.1 1 10 100 1000 10000Time (min)
Dra
wdo
wn
(ft)
Transducer Theis Type-Curve 200 gpm 400 gpm
Well Performance Projections
Same data graphed semi-log
675 gpm
400 gpm
200 gpm

1.0
10.0
100.0
1000.0
0.1 1 10 100 1000 10000Time (days)
Dra
wdo
wn
(ft)
Transducer 600 gpm 200 gpm 400 gpm
Well Performance Projections
Estimate drawdown for different pumping periodsusing calculated transmissivity and storativity
600 gpm
400 gpm
200 gpm

Specific CapacitySimple Measure of Well Efficiency
• (Pumping Rate) / (Drawdown) = Q/s• Compare pumping tests at different pumping rates• Evaluate changes in well efficiency• Forecast drawdown at different pumping rates
– Pump sizing• Limitation: need to compare Q/s at same time after
pumping begins– E.g. Q/s at 4 hours– E.g. Q/s at 12 hours

Specific Capacity
0.0
50.0
100.0
150.0
200.0
0 240 480 720 960 1200 1440
Time (min )
Dra
wdo
wn
(ft)
Pumping Rate = 100 gpm
Q/s = 0.83
Q/s = 0.71Q/s = 0.67 Q/s = 0.63
40min 6hrs 12hrs 24hrs

Specific Capacity
• Say well test at 15 gpm with 100 ft drawdown after4 hours: (15 gpm) / (100 ft) = 0.15 gpm/ft
Then, how much drawdown at 5 gpm after 4 hours?(5 gpm) / (0.15 gpm/ft) = 33 ft drawdown
Say only 70 ft drawdown acceptable?(70 ft) x (0.15 gpm/ft) = 10.5 gpm

Mountain Domestic Well• Estimate well yield in gallons per day
– Recovery data is crucial (how long to recover to swl?)
• Compare yield with demand– 50 to 100 gallons per day per person demand– 150 to 350 gallons per day demand for a family– Lawn/garden irrigation at 0.1 gallons per day per
square foot (conservative)
• Storage to accommodate peak demand
• Consider seasonal WL changes

SWL Changes
• Alluvial aquifers & fractured rock aquifers– Seasonal changes– Wet year vs. dry year
• Aquifers with limited recharge (DenverBasin & High Plains)– Regional decline– Irrigation season well-to-well impact

Jefferson County Mountain WaterWell Water Levels
Thanks to Roy Laws
100 ft
120 ft
• Large seasonalWL changes
• Wet year vs. dryyear
Wet
Wet
Dry
Dry

Denver Basin Water Level Decline
Appx. 38 ft/yr

Declining Denver Basin WaterLevels (cont.)
AvailableDrawdown
SWL2000 - 100 gpm
AvailableDrawdown
SWL
pump
PWL
AvailableDrawdown
SWL
2015 – 50 gpm
PWL
PWL
2010 - 75 gpm
pump
•Pumping water levelabove well screens•Well is efficient
•Pumping water level topwell screens•Well efficiencycompromised
pump
•Pumping water levelbelow most well screens•Well efficiencysignificantly compromised

Confined AquiferWell-to-Well Interference
700
900
1100
1300
1500
1700
6 /1/01
12/1/01
6 /1/02
12/1/02
6 /1/03
12/1/03
6 /1/04
12/1/04
6 /1/05
12/1/05
6 /1/06
1 2/1/06
6 /1/07
12/1/07
Dep
th to
Wat
er L
evel
(ft)
Static Water Level (ft) Pumping Water Level (ft) Top S creen (ft) Bottom of Well (ft) Pump (ft)
• Non-Pumping (Static) water level declinesduring summer due to well-to-well interferenceand recovers during winter and spring
• 175.5 ft irrigation season decline, in example
• Value to frequent water level data collection
1100
1200
1300
1400
1500
1600
1700
9/1/05
3/1/06
9/1/06
3 /1/07
Dep
th t
o W
ater
Lev
el (ft
)
Static Water Level (ft) Pumping Water Level (ft) Top Screen (ft ) Bottom of Well (ft) Pump (ft)
175 ft

Rules of Thumb• Maximum drawdown
– Alluvial and Unconfined Bedrock: 2/3 water column inwell
– Confined: 1/2 water column in well– Keep PWL above principal well production zone
• (Max 24-hour rate during testing) x (60%) = SafeWell Yield
• Test well at greater rate than plannedpermanent equipment
• Consider water level recovery

Summary• Aquifers are predictable (not all wells are
predictable!)• Consider future static water levels• Prepare for a successful test
– Redundant water level and flow rate measurements• Collect data and note the time• Plot data by hand to understand water level
trends• There are simple ways to forecast drawdown
and pumping rates