Embed Size (px)
Citation preview

PUMP PROJECT
Germania Unit Rate Forecasting Based on Other Waterflood Pilots in the Spraberry Area
PUMP PROJECT
Objectives
• To propose the location of new injection wells in the Germania Unit.
• To forecast the incremental oil recovery due to waterflooding in other waterflood Pilot area. The rate forecast is applied to Germania Unit for economic purpose.
PUMP PROJECT
Coupling between injector and producer Injector Waterflood
period On-trend well
Responding Off-trend well Responding Remarks
G.S.U. #6 01/72 - 05/89 GSU#12 Oil, gas and water
GSU#3 GSU#13
None None
G.S.U. #8 08/71 - 02/77 GSU#2 None GSU #1
GSU #7 Water None
G.S.U. #11 12/65 - 01/68
02/70 - 02/75 GSU#31 GSU#13 GSU#3 GSU#20 GSU#19
None None None None None
GSU#10 GSU#17 GSU#12 GSU#7
None None Oil, gas and water None
#19 was converted to WIW #12 was affected by WIW#6
G.S.U. #15 09/71 - 01/92 GSU#14 None
None GSU#13 GSU#16
None None
G.S.U. #19 06/70 - 01/77 GSU#10 Oil, gas and
water GSU#20 GSU#9
None Oil, gas and water ???
G.S.U. #22 06/70 - 01/76
GSU#16 GSU#26
Oil, gas and water Oil, gas and water
GSU#21 GSU#23 GSU#17 GSU#25
Water None None None
#21 was affected by WIW#27
G.S.U. #27 06/70 – 01/77 GSU#21 water GSU#26
GSU#20 None None
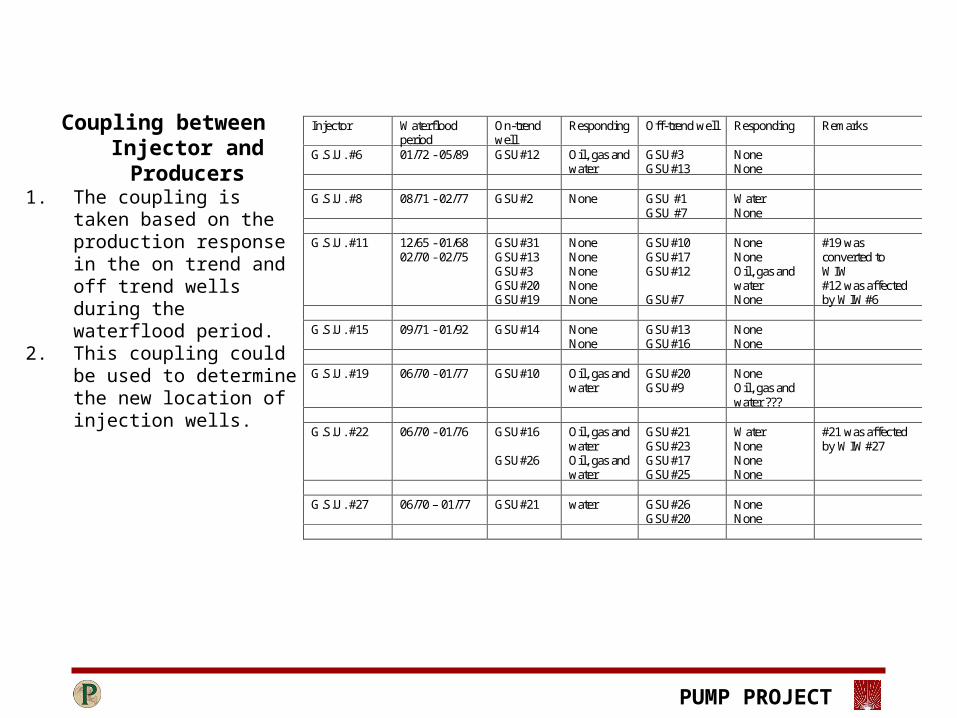
Coupling between Injector and Producers
1. The coupling is taken based on the production response in the on trend and off trend wells during the waterflood period.
2. This coupling could be used to determine the new location of injection wells.

PUMP PROJECT
1
11
1
11
1
2
1
1
11
1
2 8
1 61 6
1 71 7
1 5
1
1 81 8
2 1
2 62 6
2 7
2 02 0
2 3
2 52 5
2 22 2
1
22
1
1
34
2
9
2 4
1 0
1 91 9
11
1 2
2 9
2
1 3
1
2
1
3
1
1
1
1
1
1
1
3 0
11
4
1
2
1 41 4
1
3 1
1
1 6
1
6
1
1
1
1
1
4 0 7 A4 0 7 A
1 1 7 A
2 0 6 A
1 1 6 A
6 0 2 A
4 0 6 A
1 1 3 A
4 0 5 A
2 0 7 A
1 1 8 A
4 0 8 A
1 2 1 A
2 0 8 A
3 1 0 A
1 1 9 A
5 0 2 A
4 0 9 A
1 2 3 A
3 1 3 A
1 2 4 A
2
1 2 6 A
1 2 5 A2 0 9 A
4 1 0 A
1 2 9 A
4 1 1 A
1 3 0 A
2 1 0 A
1 3 1 A
2 1 1 A
6 0 3 A
3 1 8 A
3 1 7 A
1 3 2 A
5 0 3 A
1
11
1
2
1
411
2
11
2
2
1
3 1 4 A
3 1 5 A
1
1
1
1
1
1 31 3
7
2
8
1 6
5
1 4
3
1
1
1
1
2
1
3
1
1
3
1
3
11
2 0 5 A
3 0 8 A
1 1 4 A
3 0 9 A
1 1 5 A
3 1 1 A
1 2 0 A
1 2 2 A
3 1 2 A
1 2 7 A
1 2 8 A
3 1 6 A
1 3 3 A
1 3 4 A
1 3 5 A
1 3 6 A
1 3 7 A
1 3 8 A
1 3 9 A
1 4 0 A
1 4 1 A
1 4 2 A
1 4 3 A
1 4 4 A
1 4 5 A
1 4 6 A
2 1 3 A
2 1 2 A
2 1 4 A
2 1 5 A
2 1 6 A
4 1 2 A
4 1 3 A
4 1 5 A
4 1 4 A
5 0 4 A
6 0 4 A
3 1 9 A3 2 0 A
3 2 1 A
3 2 2 A
3 2 3 A
3 2 4 A
3 2 5 A
3 2 6 A
3 2 7 A
3 3 1 A
3 2 9 A
3 3 0 A
3 2 8 A
3 3 2 A
G erm ania (Spraberry) U nit
P ro p o s ed In jec tio n W ells
M id lan d C o ., T exas
F E E T
0 2 ,0 0 0 4 ,0 0 0
P O ST E D W E L L D A T A
W ell L ab e l
A T T R I B U T E M A PP r o p o se d I n j e c to r sO ld I n j e c to r s
W E L L SY M B O L SO il W e ll
D r y H o le
Se r v ic e W e ll
T e m p . A b n ' d O il
P lu g g e d & A b n ' d
A b a n d o n e d I n j e c to r
P U D
W a te r Su p p ly
B y: C .F . R o u n d in g
Ju n e 1 3 , 2 0 0 2
PE T R A 6 / 1 3 / 2 0 0 2 2 : 5 9 : 0 6 PM
Germania (Spraberry) Unit Layout
1. The red line indicates a coupling between an injector and producers and rectangular box indicates the well has available production history.
2. WIWs #8, 11, and 15 did not have significant effect on surrounding oil production wells.
3. The production responses obtained from coupling between an injector and producers are parallel to the fracture orientation in NE-SW direction.
PUMP PROJECT
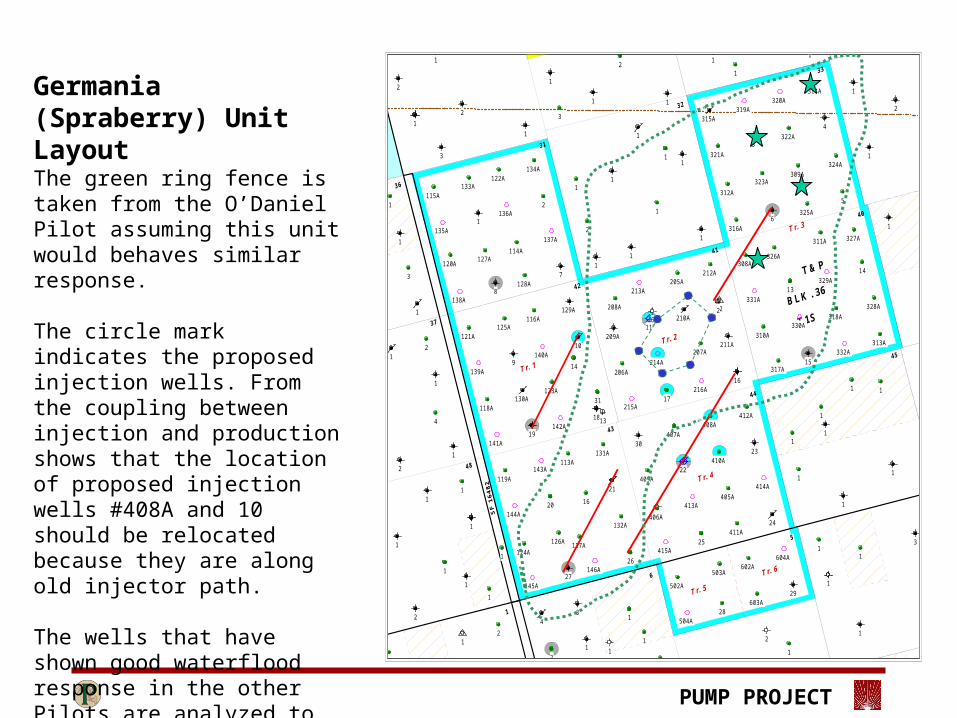
Germania (Spraberry) Unit LayoutThe green ring fence is taken from the O’Daniel Pilot assuming this unit would behaves similar response.
The circle mark indicates the proposed injection wells. From the coupling between injection and production shows that the location of proposed injection wells #408A and 10 should be relocated because they are along old injector path.
The wells that have shown good waterflood response in the other Pilots are analyzed to determine the incremental oil recovery during waterflooding. The results are applied to Germania Unit for economic purpose.
1
11
1
11
1
2
1
1
11
1
2 8
1 61 6
1 71 7
1 5
1
1 81 8
2 1
2 62 6
2 7
2 02 0
2 3
2 52 5
2 22 2
1
22
1
1
34
2
9
2 4
1 0
1 91 9
11
1 2
2 9
2
1 3
1
2
1
3
1
1
1
1
1
1
1
3 0
11
4
1
2
1 41 4
1
3 1
1
1 6
1
6
1
1
1
1
1
4 0 7 A4 0 7 A
1 1 7 A
2 0 6 A
1 1 6 A
6 0 2 A
4 0 6 A
1 1 3 A
4 0 5 A
2 0 7 A
1 1 8 A
4 0 8 A
1 2 1 A
2 0 8 A
3 1 0 A
1 1 9 A
5 0 2 A
4 0 9 A
1 2 3 A
3 1 3 A
1 2 4 A
2
1 2 6 A
1 2 5 A2 0 9 A
4 1 0 A
1 2 9 A
4 1 1 A
1 3 0 A
2 1 0 A
1 3 1 A
2 1 1 A
6 0 3 A
3 1 8 A
3 1 7 A
1 3 2 A
5 0 3 A
1
11
1
2
1
411
2
11
2
2
1
3 1 4 A
3 1 5 A
1
1
1
1
1
1 31 3
7
2
8
1 6
5
1 4
3
1
1
1
1
2
1
3
1
1
3
1
3
11
2 0 5 A
3 0 8 A
1 1 4 A
3 0 9 A
1 1 5 A
3 1 1 A
1 2 0 A
1 2 2 A
3 1 2 A
1 2 7 A
1 2 8 A
3 1 6 A
1 3 3 A
1 3 4 A
1 3 5 A
1 3 6 A
1 3 7 A
1 3 8 A
1 3 9 A
1 4 0 A
1 4 1 A
1 4 2 A
1 4 3 A
1 4 4 A
1 4 5 A
1 4 6 A
2 1 3 A
2 1 2 A
2 1 4 A
2 1 5 A
2 1 6 A
4 1 2 A
4 1 3 A
4 1 5 A
4 1 4 A
5 0 4 A
6 0 4 A
3 1 9 A3 2 0 A
3 2 1 A
3 2 2 A
3 2 3 A
3 2 4 A
3 2 5 A
3 2 6 A
3 2 7 A
3 3 1 A
3 2 9 A
3 3 0 A
3 2 8 A
3 3 2 A
G erm ania (Spraberry) U nit
P ro p o s ed In jec tio n W ells
M id lan d C o ., T exas
F E E T
0 2 ,0 0 0 4 ,0 0 0
P O ST E D W E L L D A T A
W ell L ab e l
A T T R I B U T E M A PP r o p o se d I n j e c to r sO ld I n j e c to r s
W E L L SY M B O L SO il W e ll
D r y H o le
Se r v ic e W e ll
T e m p . A b n ' d O il
P lu g g e d & A b n ' d
A b a n d o n e d I n j e c to r
P U D
W a te r Su p p ly
B y: C .F . R o u n d in g
Ju n e 1 3 , 2 0 0 2
PE T R A 6 / 1 3 / 2 0 0 2 2 : 5 9 : 0 6 PM
PUMP PROJECT
Water Injection in The Germania Unit
0
5000
10000
15000
20000
25000
Jun-68 Mar-71 Dec-73 Aug-76 May-79 Feb-82 Nov-84 Aug-87 May-90 Jan-93
TIME (DATE)
INJ
EC
TIO
N R
AT
E (
BB
LS
/MO
)
0
500000
1000000
1500000
2000000
2500000
3000000
CU
M. I
NJ
EC
TIO
N R
AT
E (
BB
LS
)
GSU-19 GSU-6 GSU-22 GSU-27 Cum. Injection
PUMP PROJECT
10
100
1000
10000
Jun-57 Dec-62 Jun-68 Dec-73 May-79 Nov-84 May-90 Oct-95
TIME (DATE)
OIL
RA
TE
(B
BL
S/M
ON
TH
)
100
1000
10000
100000
GA
S R
AT
E (
MS
CF
/MO
) AN
D W
AT
ER
RA
TE
(B
BL
S/M
O)
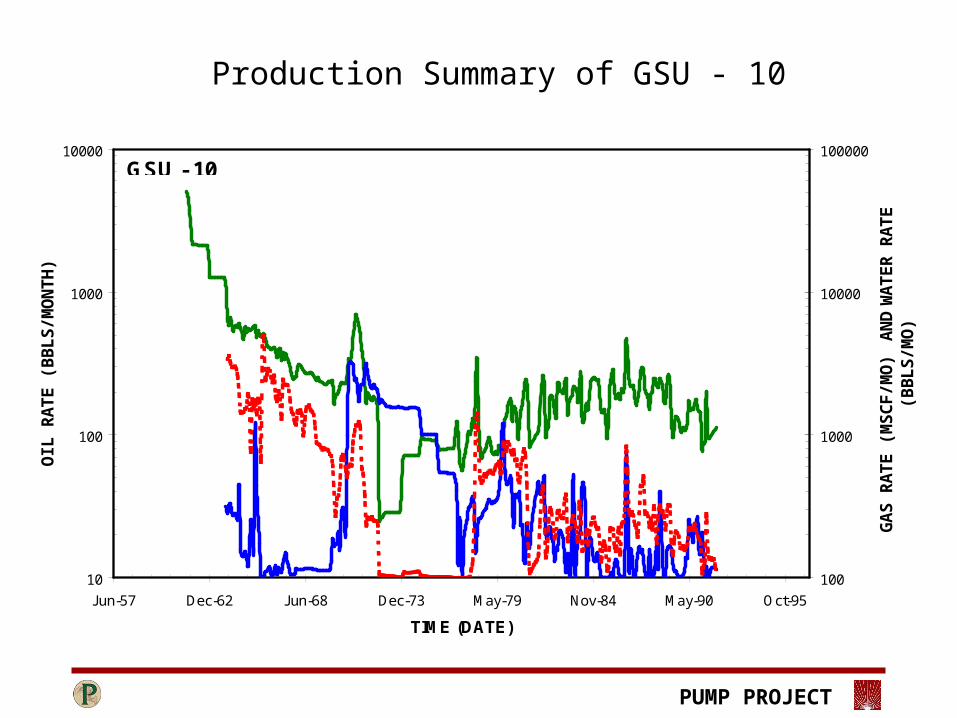
GSU - 10
Production Summary of GSU - 10
PUMP PROJECT
1
10
100
1000
Jun-57 Dec-62 Jun-68 Dec-73 May-79 Nov-84 May-90 Oct-95
TIME (DATE)
OIL
PR
OD
UC
TIO
N (
BB
LS
/D)
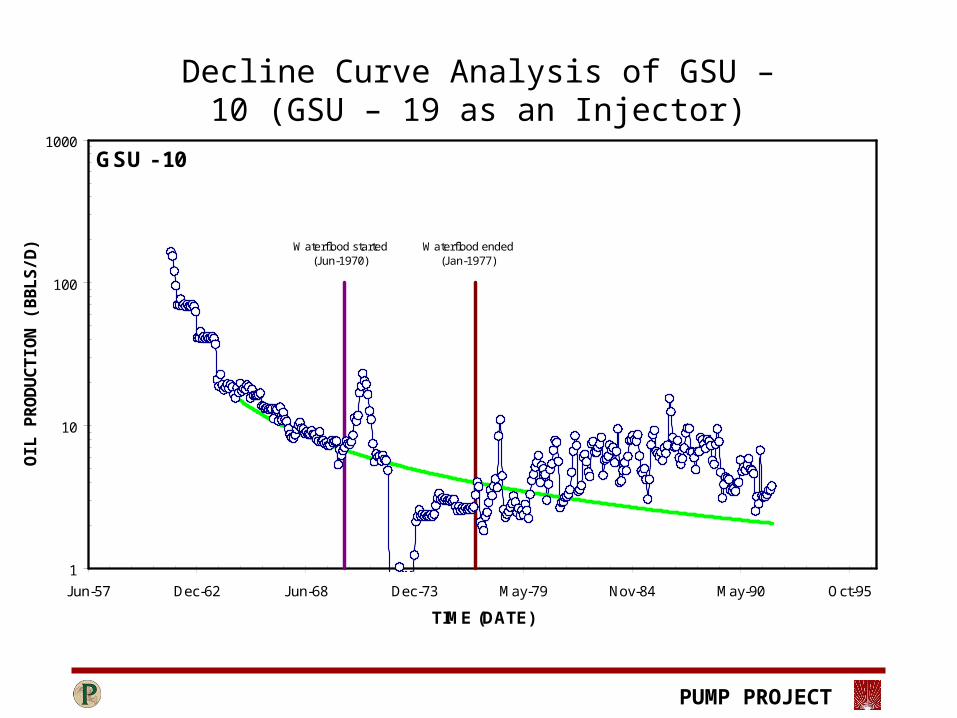
GSU - 10
Waterflood started(Jun-1970)
Waterflood ended(Jan-1977)
Decline Curve Analysis of GSU – 10 (GSU – 19 as an Injector)
PUMP PROJECT
0
500
1000
1500
2000
2500
Sep-65 Jun-68 Mar-71 Dec-73 Aug-76 May-79 Feb-82 Nov-84 Aug-87 May-90 Jan-93
Time (Date)
Tota
l Oil
Pro
du
cti
on
Ra
te (
BO
PM
)
0
1
2
3
4
5
6
No
. Of
We
lls
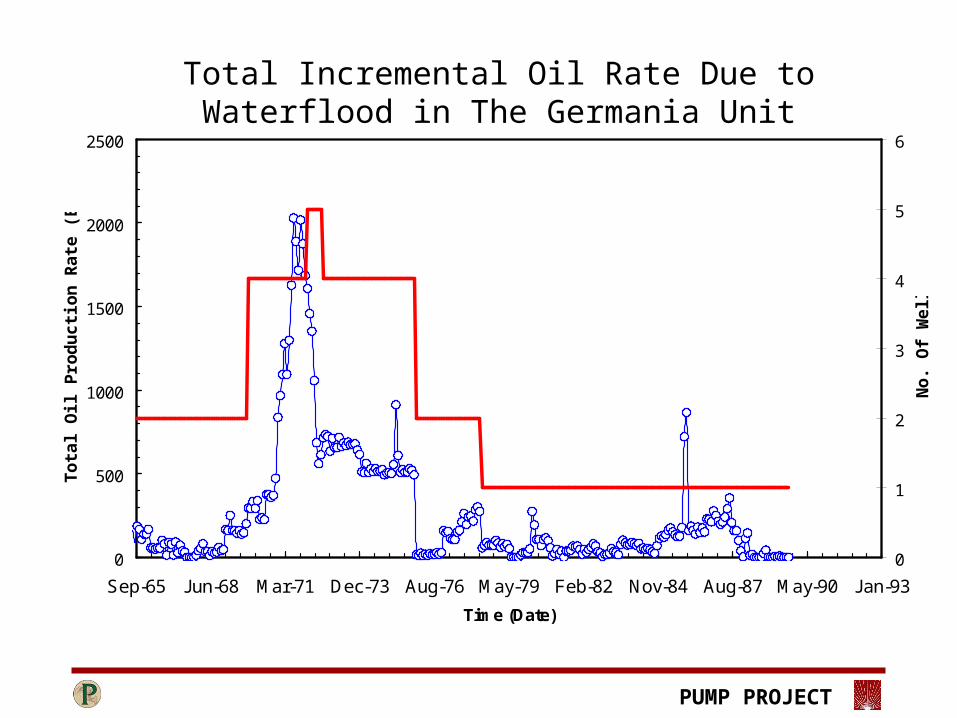
Total Incremental Oil Rate Due to Waterflood in The Germania Unit
PUMP PROJECT
0
10000
20000
30000
40000
50000
60000
70000
80000
90000
Sep-65 Jun-68 Mar-71 Dec-73 Aug-76 May-79 Feb-82 Nov-84 Aug-87 May-90 Jan-93
Time (Date)
Cu
mu
lati
ve
Oil
Pro
du
cti
on
(B
BL
S)
0
1
2
3
4
5
6
No
. Of
We
lls
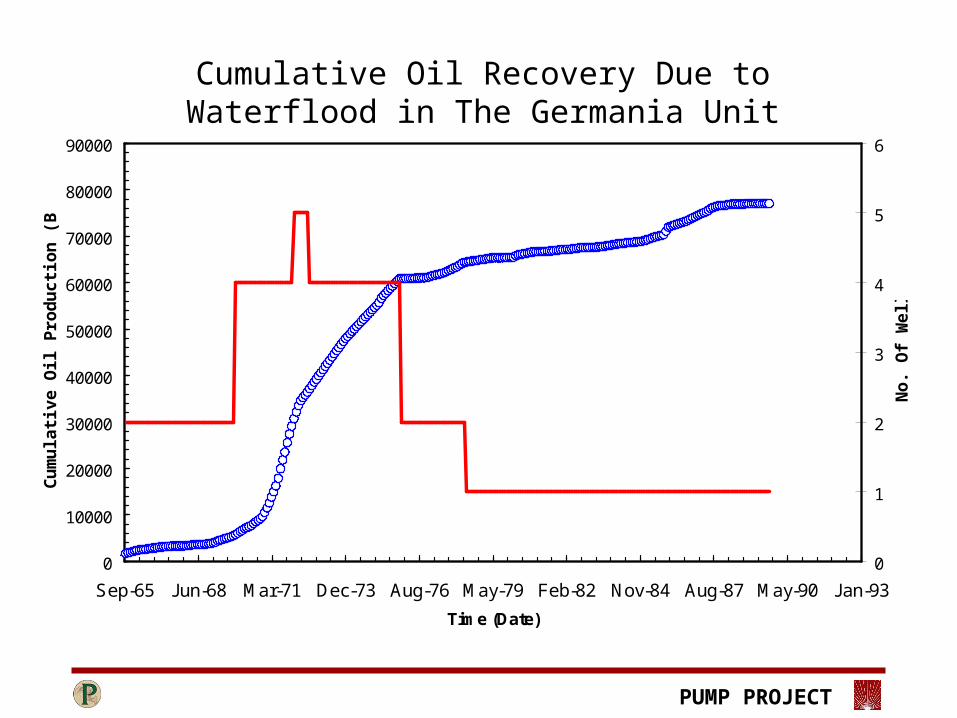
Cumulative Oil Recovery Due to Waterflood in The Germania Unit
PUMP PROJECT
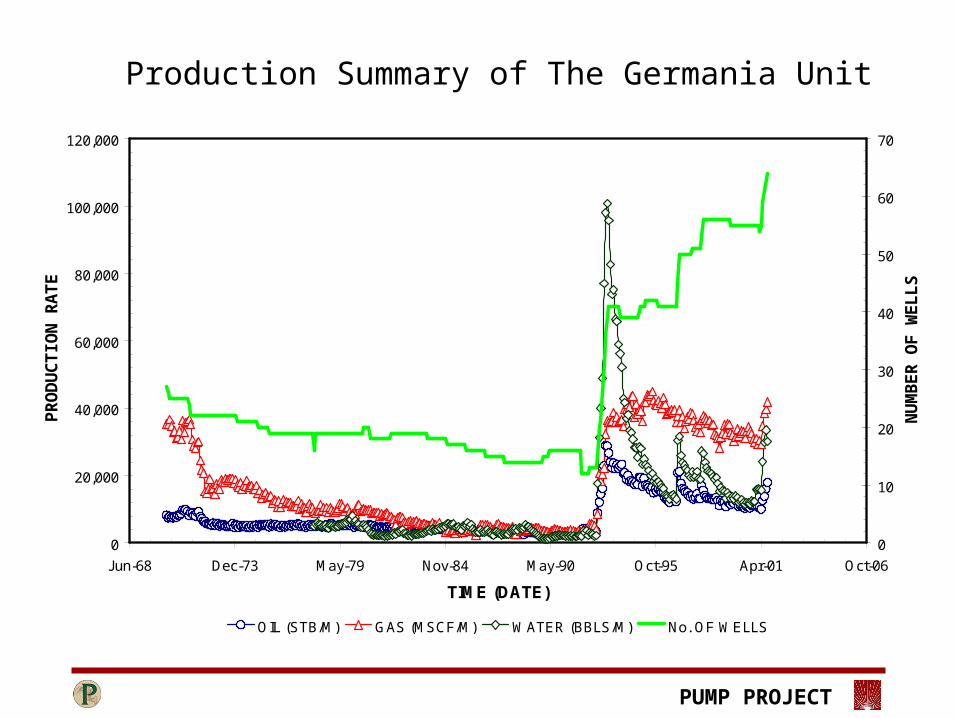
Production Summary of The Germania Unit
0
20,000
40,000
60,000
80,000
100,000
120,000
Jun-68 Dec-73 May-79 Nov-84 May-90 Oct-95 Apr-01 Oct-06
TIME (DATE)
PR
OD
UC
TIO
N R
AT
E
0
10
20
30
40
50
60
70
NU
MB
ER
OF
WE
LL
S
OIL (STB/M) GAS (MSCF/M) WATER (BBLS/M) No. OF WELLS
PUMP PROJECT
0.00
200.00
400.00
600.00
800.00
1000.00
1200.00
Sep-91 Jun-94 Mar-97 Dec-99 Sep-02 May-05 Feb-08
TIME (DATE)
PR
OD
UC
TIO
N R
AT
E
0
10
20
30
40
50
60
70
NU
MB
ER
OF
WE
LL
S
OIL (STB/D) BaseLine ET ODaniel Rate 125% Dec. Rate 75% Dec. Rate No. OF WELLS
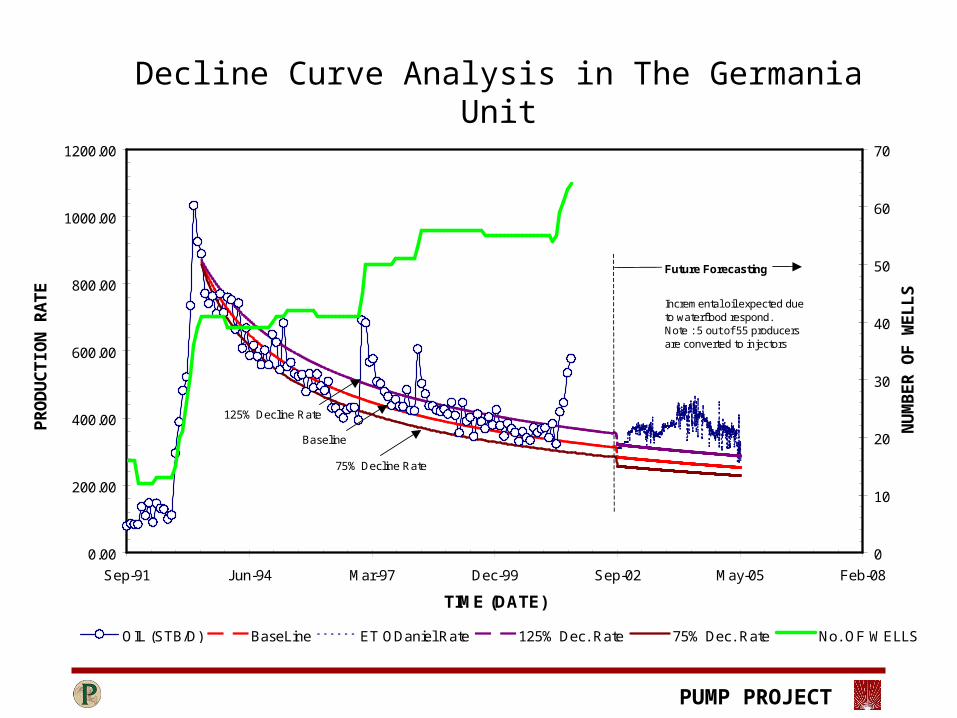
125% Decline Rate
Baseline
75% Decline Rate
Incremental oil expected due to waterflood respond. Note : 5 out of 55 producers are converted to injectors
Future Forecasting
Decline Curve Analysis in The Germania Unit
PUMP PROJECT
200.00
300.00
400.00
500.00
Nov-01 May-02 Dec-02 Jun-03 Jan-04 Aug-04 Feb-05 Sep-05
TIME (DATE)
PR
OD
UC
TIO
N R
AT
E
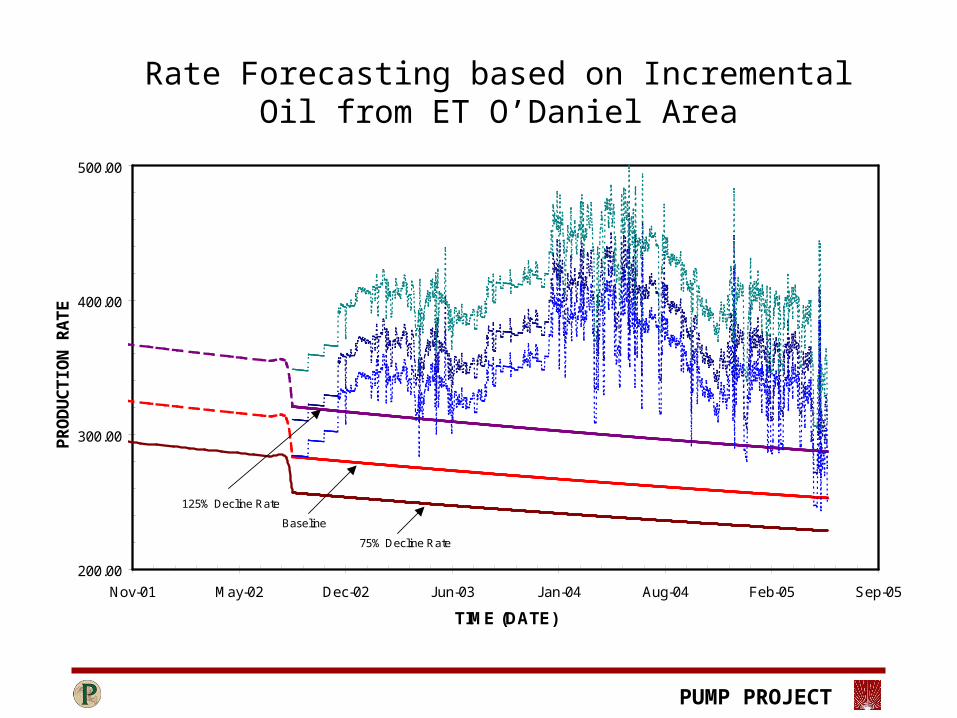
125% Decline Rate
Baseline
75% Decline Rate
Rate Forecasting based on Incremental Oil from ET O’Daniel Area
PUMP PROJECT
0.00
200.00
400.00
600.00
800.00
1000.00
1200.00
Sep-91 Jun-94 Mar-97 Dec-99 Sep-02 May-05 Feb-08
TIME (DATE)
PR
OD
UC
TIO
N R
AT
E
0
10
20
30
40
50
60
70
NU
MB
ER
OF
WE
LL
S
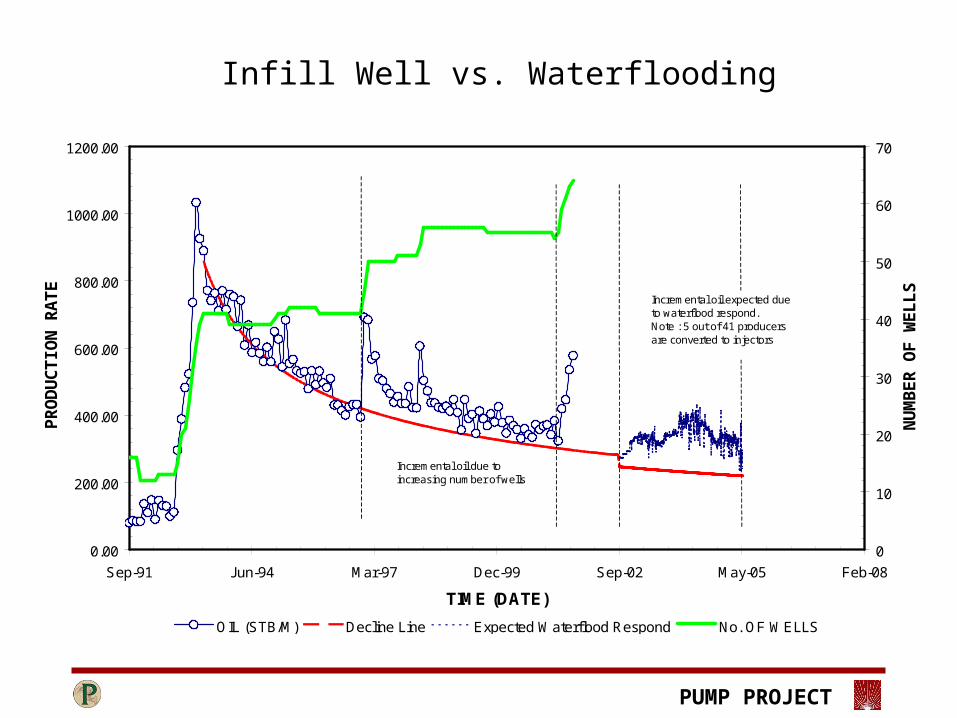
OIL (STB/M) Decline Line Expected Waterflood Respond No. OF WELLS
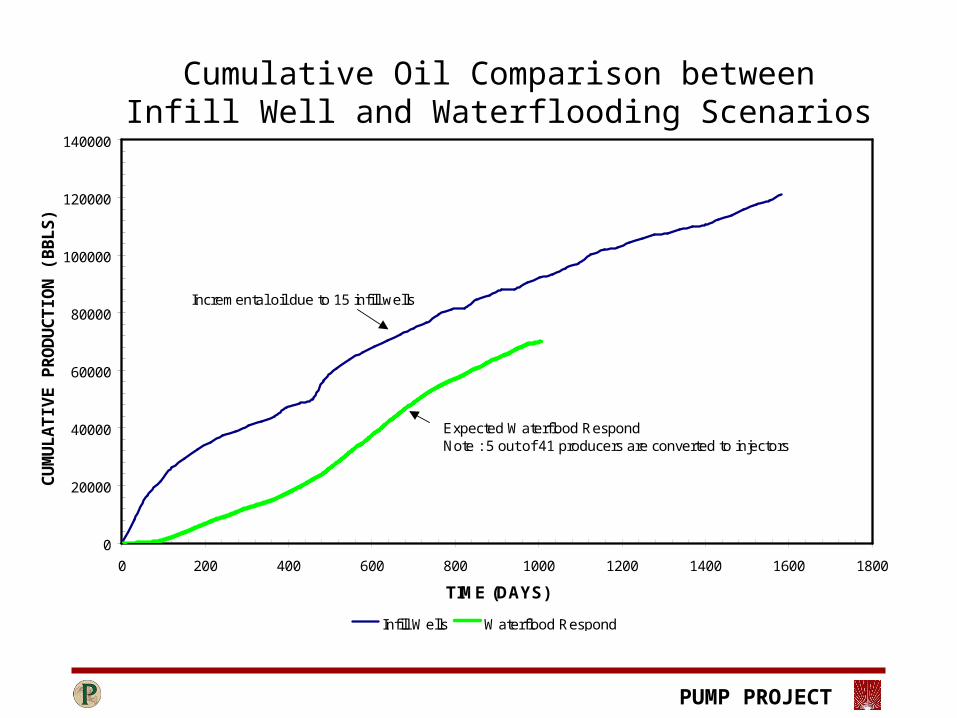
Incremental oil due to increasing number of wells
Incremental oil expected due to waterflood respond. Note : 5 out of 41 producers are converted to injectors
Infill Well vs. Waterflooding
PUMP PROJECT
0
20000
40000
60000
80000
100000
120000
140000
0 200 400 600 800 1000 1200 1400 1600 1800
TIME (DAYS)
CU
MU
LA
TIV
E P
RO
DU
CT
ION
(B
BL
S)
Infill Wells Waterflood Respond
Incremental oil due to 15 infill wells
Expected Waterflood RespondNote : 5 out of 41 producers are converted to injectors
Cumulative Oil Comparison between Infill Well and Waterflooding Scenarios

PUMP PROJECT
Decline Curve AnalysisOBrien B1, Brunson F1, Brunson C2
and Brunson G1
PUMP PROJECT
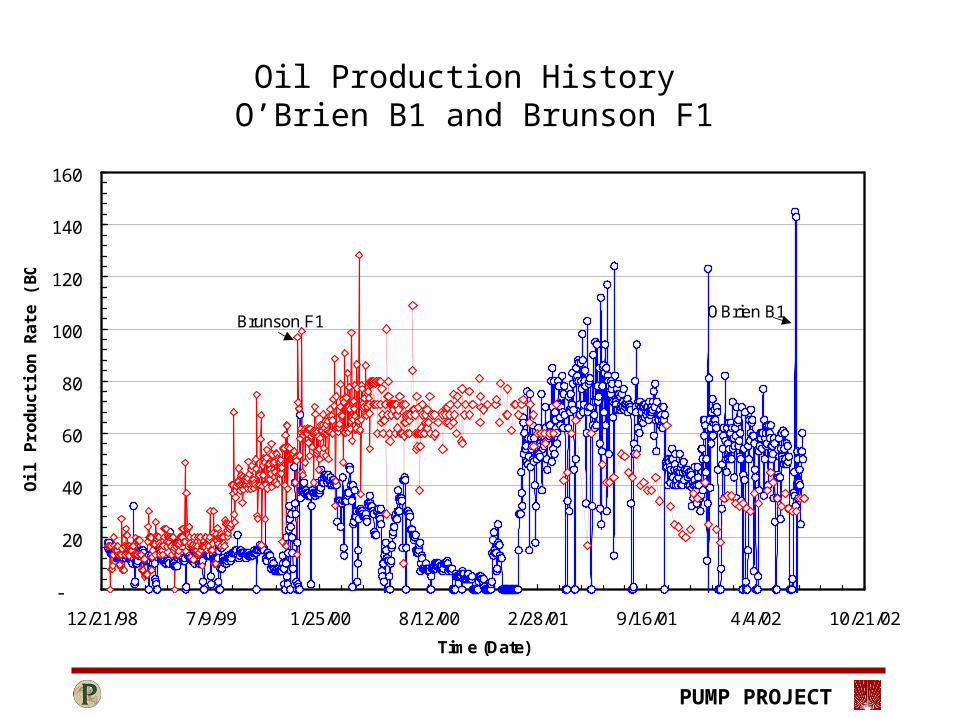
Oil Production History O’Brien B1 and Brunson F1
-
20
40
60
80
100
120
140
160
12/21/98 7/9/99 1/25/00 8/12/00 2/28/01 9/16/01 4/4/02 10/21/02
Time (Date)
Oil
Pro
du
cti
on
Ra
te (
BO
PD
)
Brunson F1OBrien B1
PUMP PROJECT
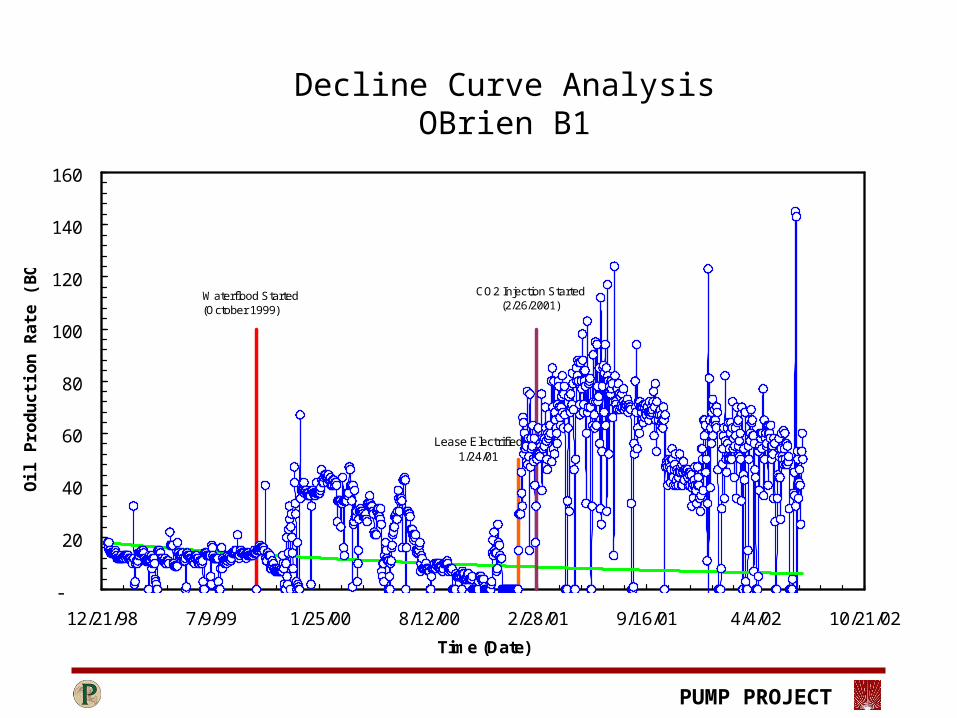
Decline Curve AnalysisOBrien B1
-
20
40
60
80
100
120
140
160
12/21/98 7/9/99 1/25/00 8/12/00 2/28/01 9/16/01 4/4/02 10/21/02
Time (Date)
Oil
Pro
du
cti
on
Ra
te (
BO
PD
)
Waterflood Started(October 1999)
CO2 Injection Started(2/26/2001)
Lease Electrified 1/24/01
PUMP PROJECT
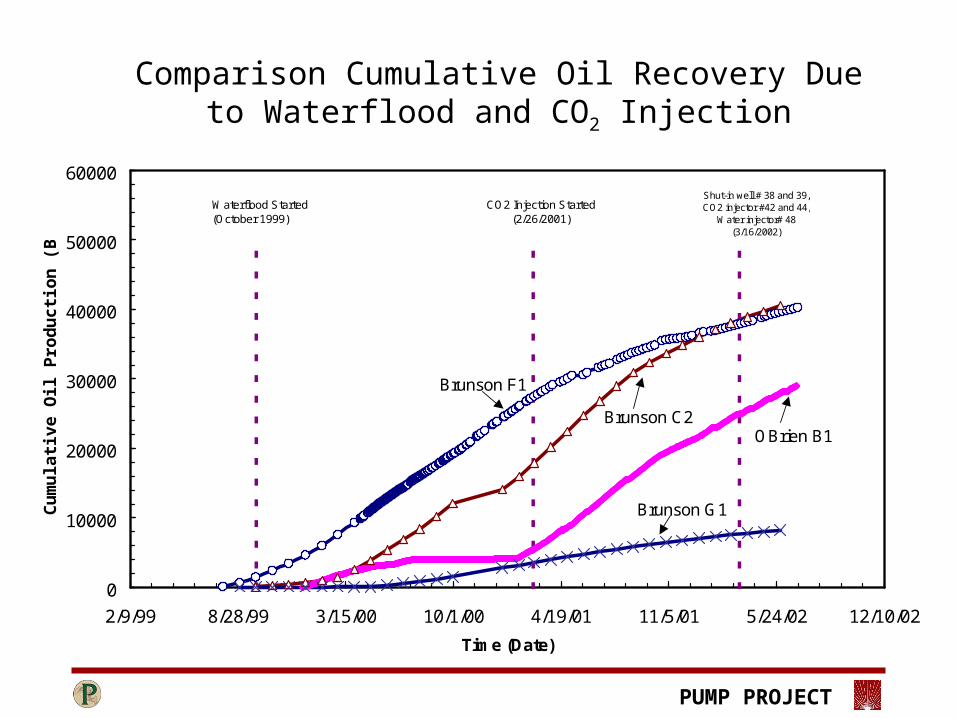
Comparison Cumulative Oil Recovery Due to Waterflood and CO2 Injection
0
10000
20000
30000
40000
50000
60000
2/9/99 8/28/99 3/15/00 10/1/00 4/19/01 11/5/01 5/24/02 12/10/02
Time (Date)
Cu
mu
lati
ve
Oil
Pro
du
cti
on
(B
BL
S)
Waterflood Started(October 1999)
CO2 Injection Started(2/26/2001)
Shut-in well # 38 and 39,CO2 injector #42 and 44,
Water injector# 48(3/16/2002)
Brunson F1
Brunson C2
Brunson G1
OBrien B1
PUMP PROJECT
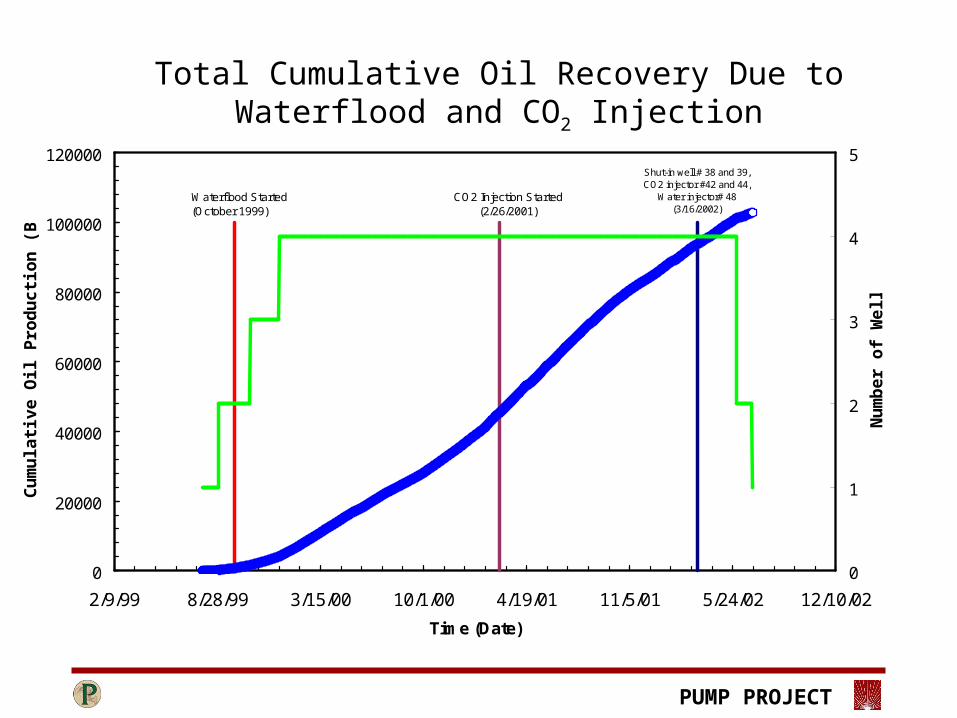
Total Cumulative Oil Recovery Due to Waterflood and CO2 Injection
0
20000
40000
60000
80000
100000
120000
2/9/99 8/28/99 3/15/00 10/1/00 4/19/01 11/5/01 5/24/02 12/10/02
Time (Date)
Cu
mu
lati
ve
Oil
Pro
du
cti
on
(B
BL
S)
0
1
2
3
4
5
Nu
mb
er
of
We
lls
Waterflood Started(October 1999)
CO2 Injection Started(2/26/2001)
Shut-in well # 38 and 39,CO2 injector #42 and 44,
Water injector# 48(3/16/2002)
PUMP PROJECT
0.00
50.00
100.00
150.00
200.00
250.00
2/9/99 8/28/99 3/15/00 10/1/00 4/19/01 11/5/01 5/24/02 12/10/02
Time (Date)
Oil
Pro
du
cti
on
Ra
te (
BO
PD
)
0
1
2
3
4
5
Nu
mb
er
of
We
lls
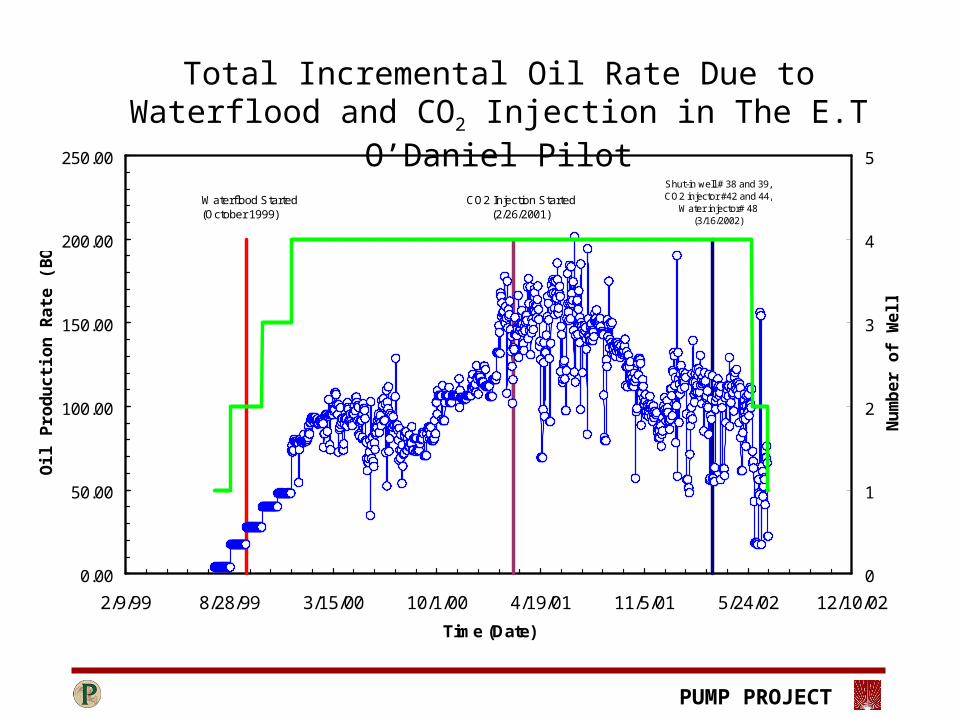
Waterflood Started(October 1999)
CO2 Injection Started(2/26/2001)
Shut-in well # 38 and 39,CO2 injector #42 and 44,
Water injector# 48(3/16/2002)
Total Incremental Oil Rate Due to Waterflood and CO2 Injection in The E.T O’Daniel Pilot
PUMP PROJECT
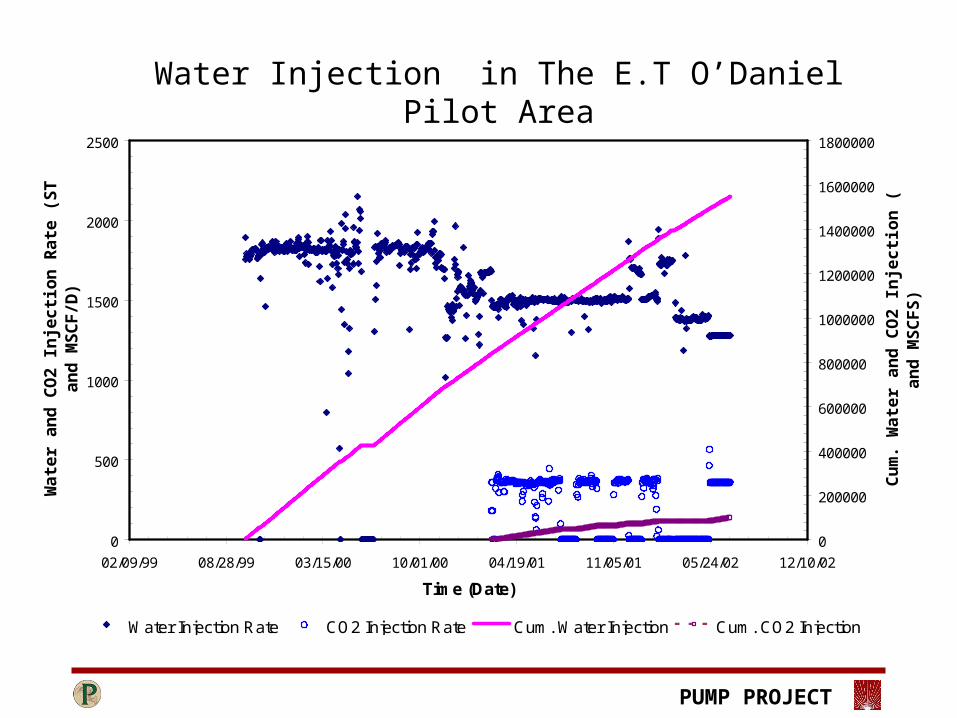
Water Injection in The E.T O’Daniel Pilot Area
0
500
1000
1500
2000
2500
02/09/99 08/28/99 03/15/00 10/01/00 04/19/01 11/05/01 05/24/02 12/10/02
Time (Date)
Wa
ter
an
d C
O2
Inje
cti
on
Ra
te (
ST
BW
/D
an
d M
SC
F/D
)
0
200000
400000
600000
800000
1000000
1200000
1400000
1600000
1800000
Cu
m. W
ater
an
d C
O2
Inje
ctio
n (
BB
LS
an
d M
SC
FS
)
Water Injection Rate CO2 Injection Rate Cum. Water Injection Cum. CO2 Injection
PUMP PROJECT
0.00
20.00
40.00
60.00
80.00
100.00
120.00
05/11/93 08/19/93 11/27/93 03/07/94 06/15/94 09/23/94 01/01/95 04/11/95 07/20/95 10/28/95 02/05/96
Time (Date)
Oil
Pro
du
cti
on
Ra
te (
BO
PD
)
0
2
4
6
8
10
12
14
16
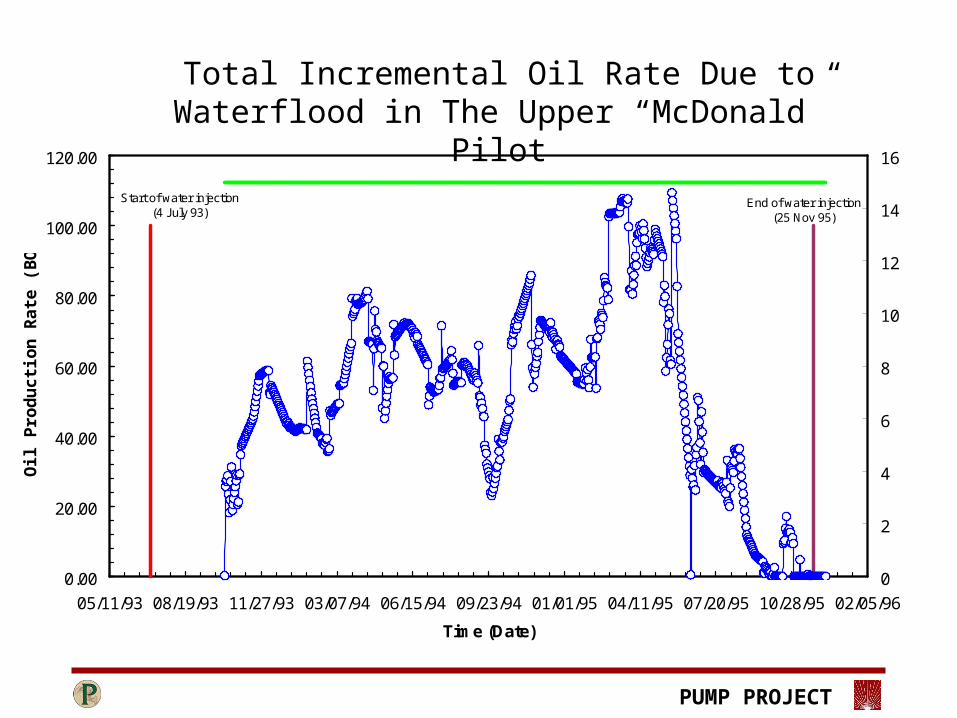
Start of water injection(4 July 93)
End of water injection(25 Nov 95)
Total Incremental Oil Rate Due to Waterflood in The Upper “McDonald” Pilot
PUMP PROJECT
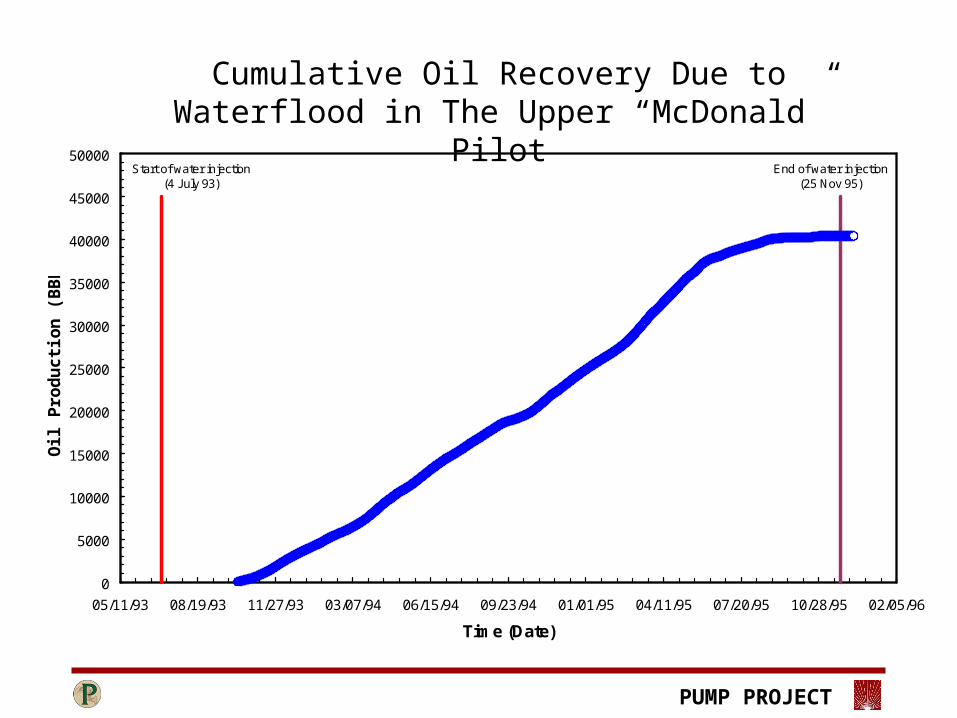
Cumulative Oil Recovery Due to Waterflood in The Upper “McDonald” Pilot
0
5000
10000
15000
20000
25000
30000
35000
40000
45000
50000
05/11/93 08/19/93 11/27/93 03/07/94 06/15/94 09/23/94 01/01/95 04/11/95 07/20/95 10/28/95 02/05/96
Time (Date)
Oil
Pro
du
cti
on
(B
BL
S)
Start of water injection(4 July 93)
End of water injection(25 Nov 95)
PUMP PROJECT
0
200
400
600
800
1000
1200
1400
31-Jan-93 19-Aug-93 7-Mar-94 23-Sep-94 11-Apr-95 28-Oct-95 15-May-96
Time (Date)
Inje
cti
on
Ra
te (
ST
BW
/D)
0
200000
400000
600000
800000
1000000
1200000
1400000
1600000
Tota
l In
jec
tio
n (
BB
LS
)
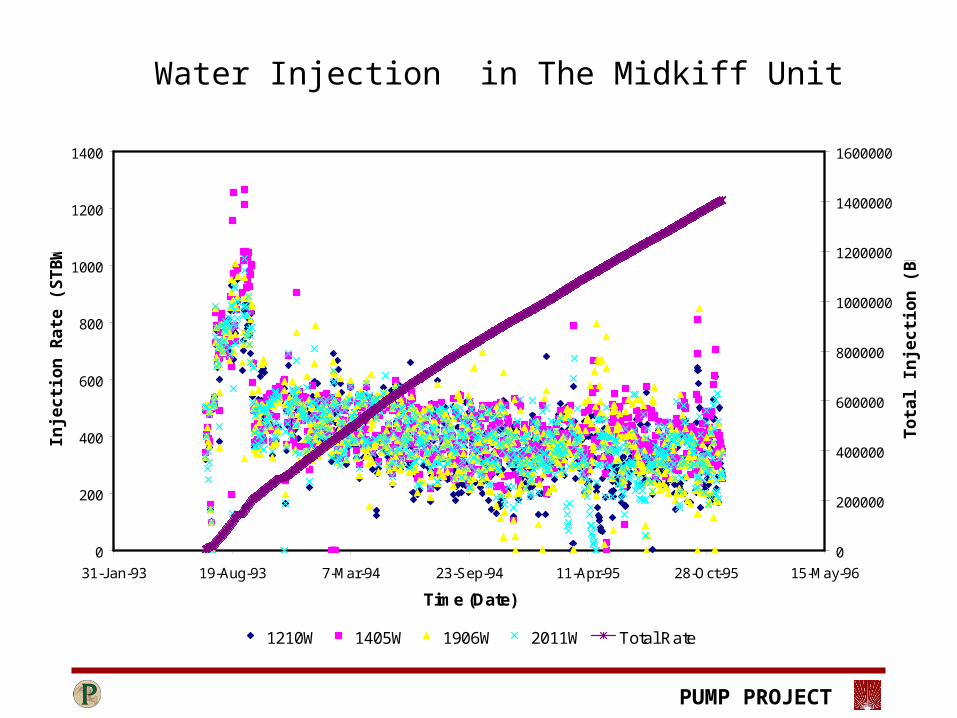
1210W 1405W 1906W 2011W Total Rate
Water Injection in The Midkiff Unit
PUMP PROJECT
0
20
40
60
80
100
120
140
160
04/11/95 10/28/95 05/15/96 12/01/96 06/19/97 01/05/98 07/24/98
Time (Date)
Oil
Pro
du
cti
on
Ra
te (
BO
PD
)
0
2
4
6
8
10
12
14
16
18
20
Nu
mb
er
of
We
lls
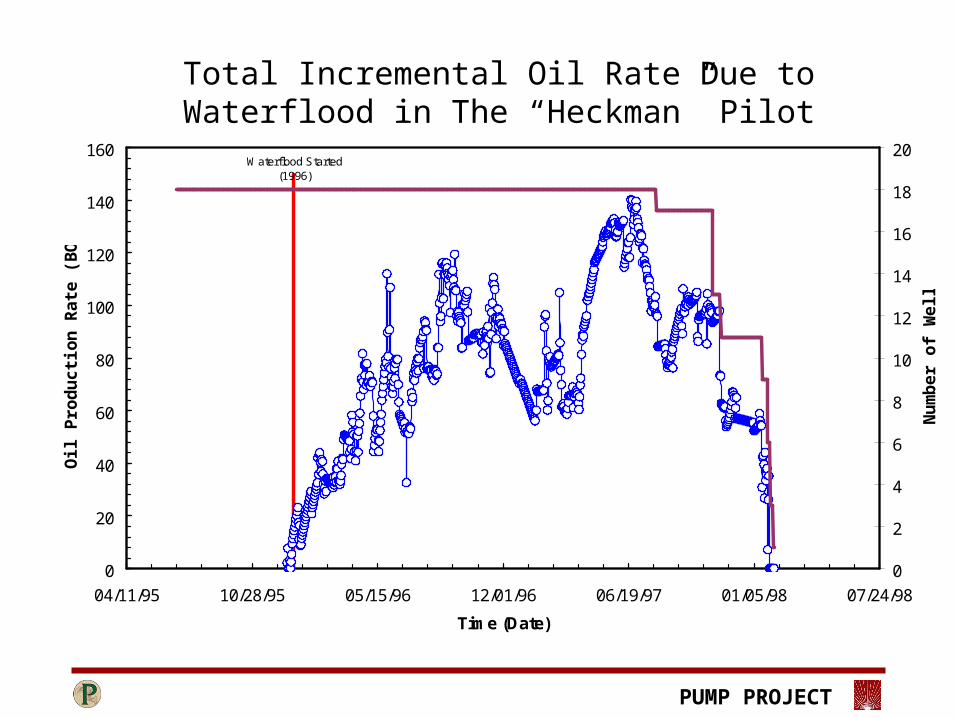
Waterflood Started(1996)
Total Incremental Oil Rate Due to Waterflood in The “Heckman” Pilot
PUMP PROJECT
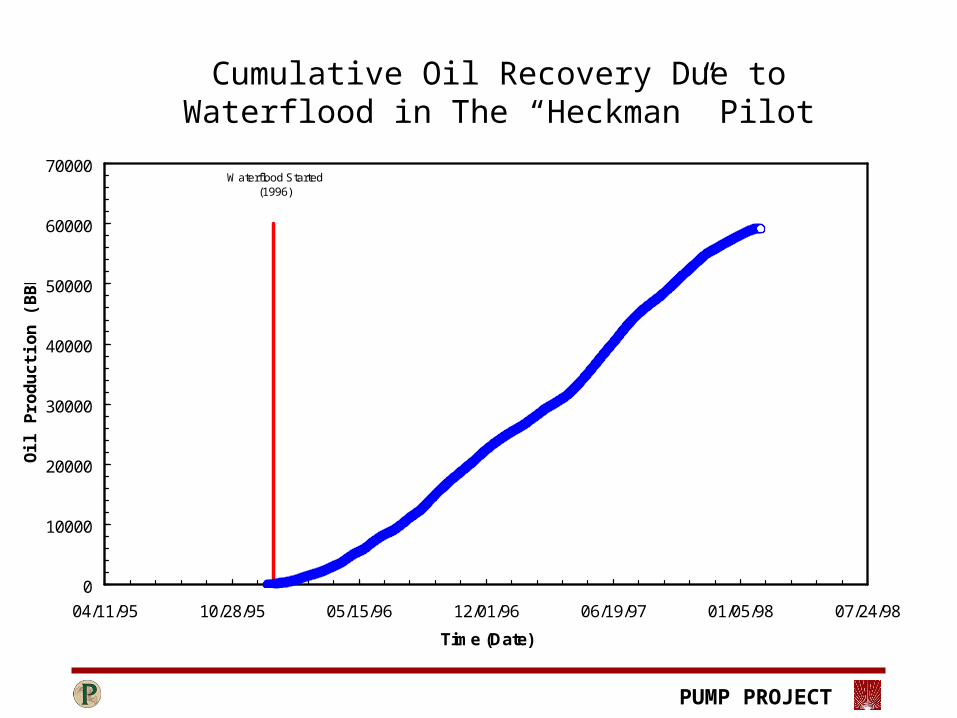
Cumulative Oil Recovery Due to Waterflood in The “Heckman” Pilot
0
10000
20000
30000
40000
50000
60000
70000
04/11/95 10/28/95 05/15/96 12/01/96 06/19/97 01/05/98 07/24/98
Time (Date)
Oil
Pro
du
cti
on
(B
BL
S)
Waterflood Started(1996)
PUMP PROJECT
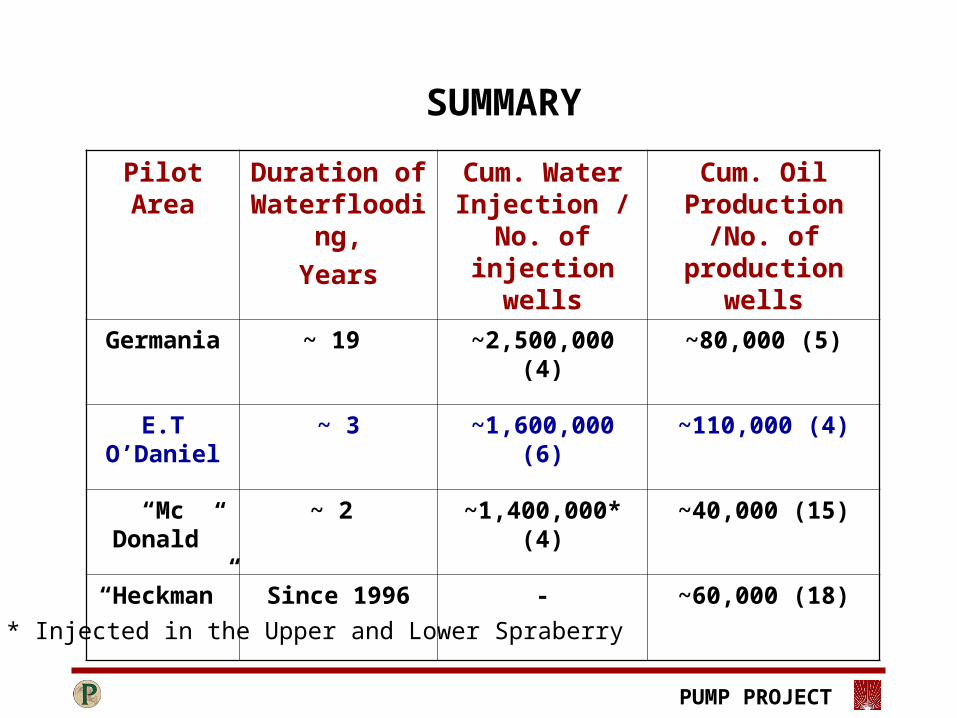
Pilot Area Duration of Waterflooding,
Years
Cum. Water Injection /No. of injection wells
Cum. Oil Production /No. of production wells
Germania ~ 19 ~2,500,000 (4) ~80,000 (5)
E.T O’Daniel
~ 3 ~1,600,000 (6) ~110,000 (4)
“Mc Donald”
~ 2 ~1,400,000* (4) ~40,000 (15)
“Heckman” Since 1996 - ~60,000 (18)
SUMMARY
* Injected in the Upper and Lower Spraberry
PUMP PROJECT
OFM PRELIMINARY RESULTS
PUMP PROJECT
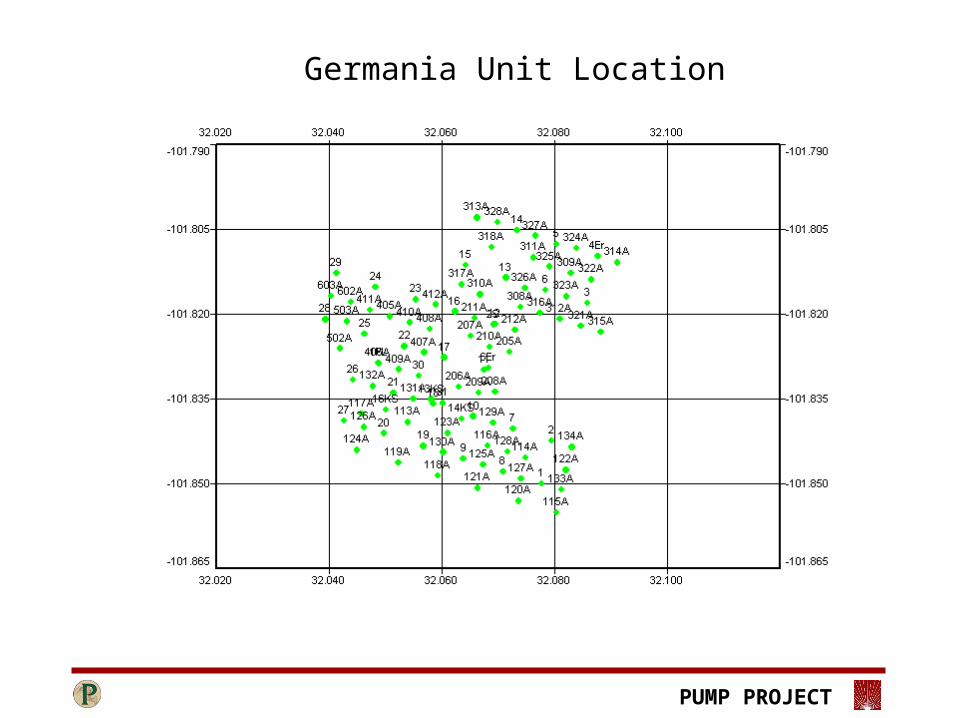
Germania Unit Location
PUMP PROJECT
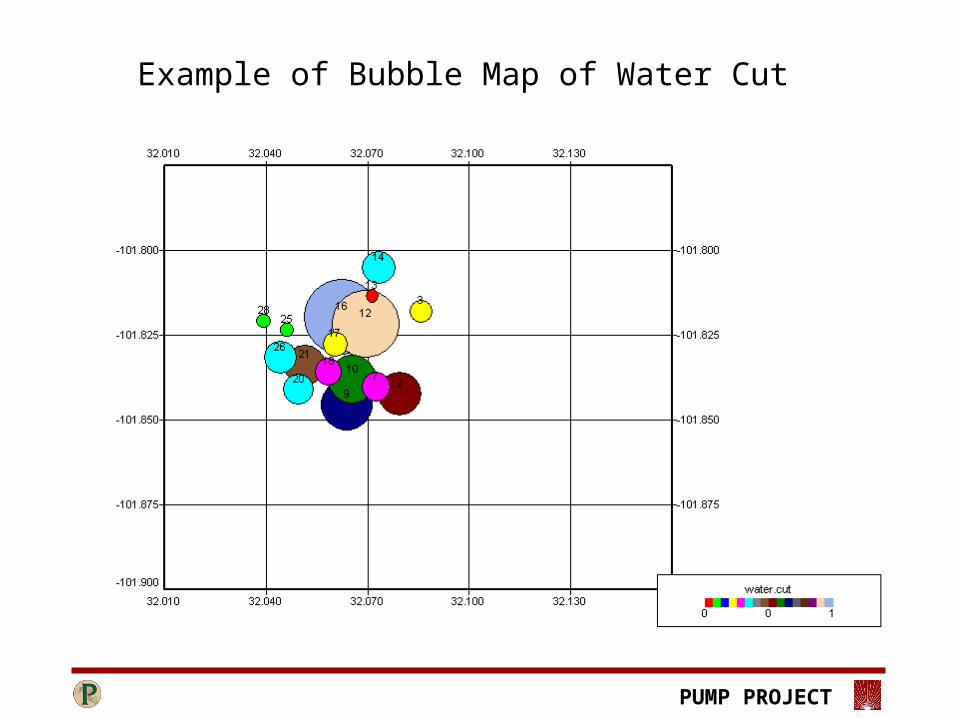
Example of Bubble Map of Water Cut
PUMP PROJECT
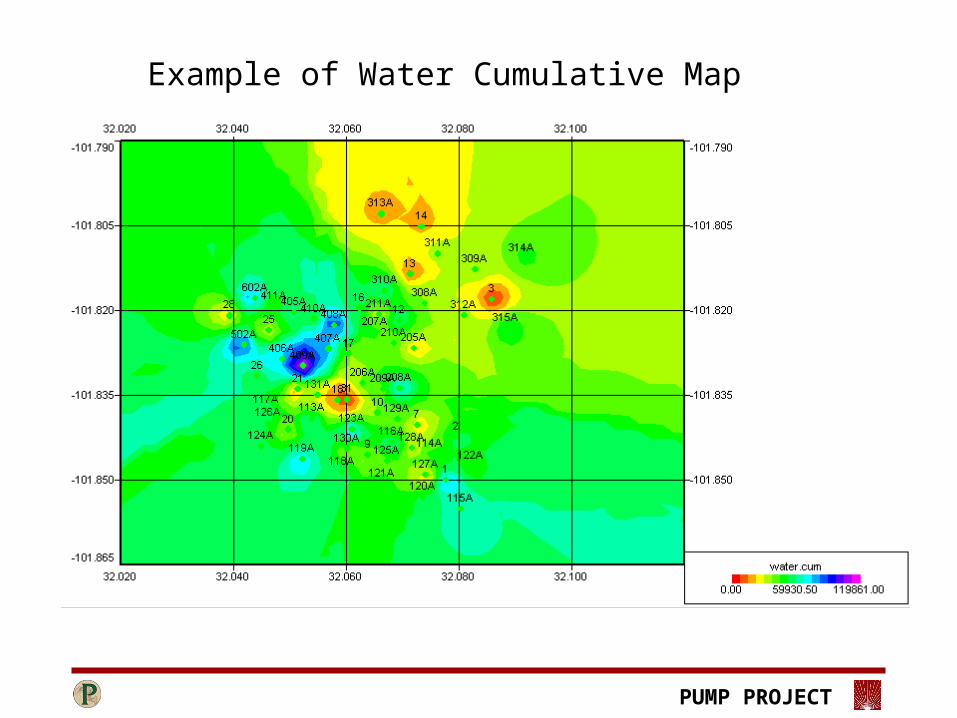
Example of Water Cumulative Map
PUMP PROJECT
FUTURE WORK
• Improve OFM model to get external data from other Database systems, such as ODBC (Microsoft Access, Dwights and PI).
• Perform similar tasks for ET O’Daniel Pilot Area (Gokul is responsible for this task)
• Perform reservoir simulation