Embed Size (px)
Citation preview

POWERWAVE - WATERFLOODCase History, ALBERTA, CANADA
Les Garner & John WarrenAccount Manager Vice President
www.onthewavefront.com symbol: WEE.TSX.VSeptember 2010

Presentation Outline
• Introduction and Powerwave Overview
• Waterflood Case History
• Conclusions and Forward Plan for this Operator/Project
• Questions and Answers
Wavefront specializes in designing and developing leading-edge techniques for oil well stimulation, improved oil recovery, and environmental groundwater remediation.

All porous media are heterogeneous and one of the biggest issues in maximizing flood recovery is effectively placing the injected fluids where we want them (injection conformance).
Flooding and Stimulation Issues
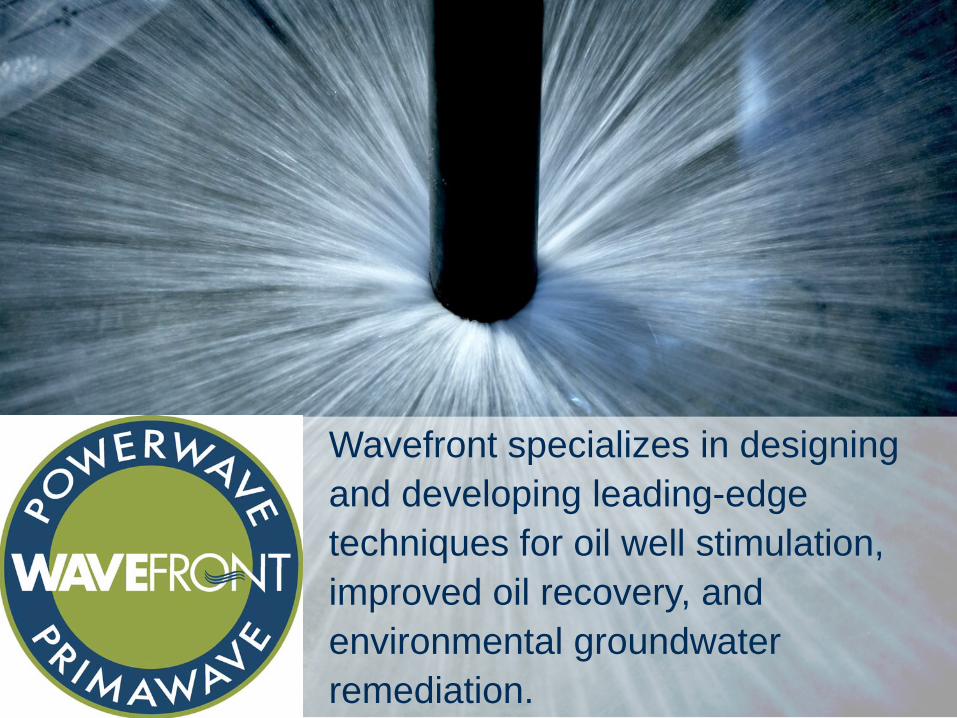
Tubing Deployment
accumulator
tubing
fluidsupply
controller
wellhead
flowmeter
flowswitch
casing
Injection packer
Tubing String Detail
pulsation dampener
control line
Powerwave tool water discharge
pressuresensor
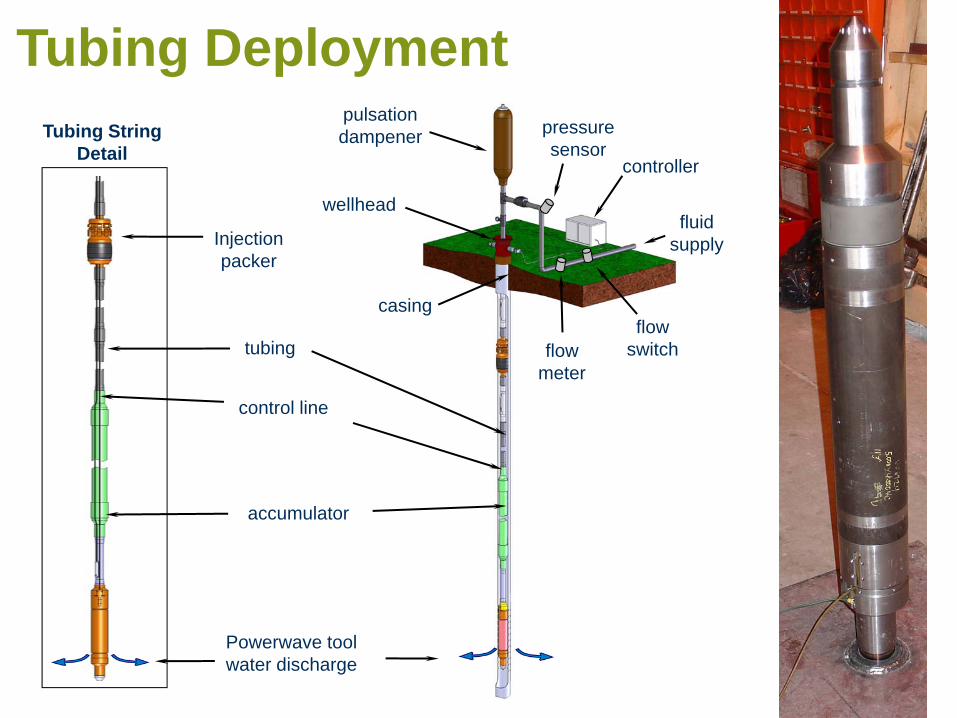
The Powerwave Process -Forced Injectivity
• An oriented pressure pulse is created at the perforations
• As the wave travels the pore space dilates or flexes propagating the wave further in to the reservoir
RiseTime
Period
Baseline Fluid Pressure in Borehole for Static Injection
Pbh = Pwh + ΔPhyd
Pressure Decay Rate
Time
Fluid Pressure
AmplitudeTypically ~250 psi for waterfloods
Minimum Pressure in Borehole during pulsing
Powerwave Mechanisms
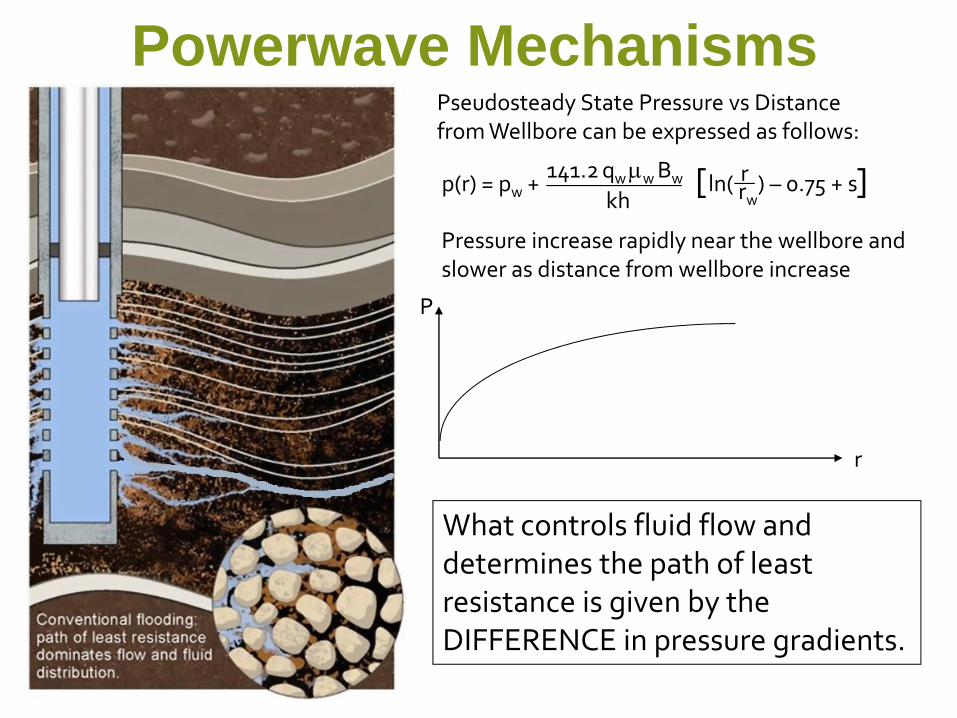
[ ]p(r) = pw + ln( ) – 0.75 + s r rw
141.2qwμwBw
kh
Pseudosteady State Pressure vs Distance from Wellbore can be expressed as follows:
Pressure increase rapidly near the wellbore and slower as distance from wellbore increase
P
r
What controls fluid flow and determines the path of least resistance is given by the DIFFERENCE in pressure gradients.
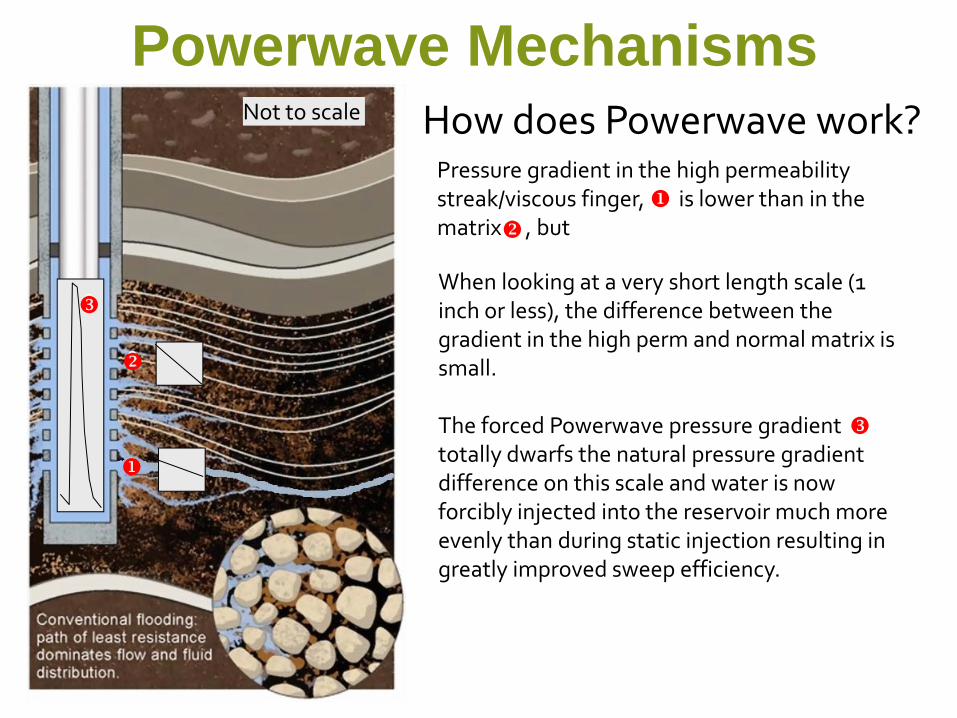
Powerwave MechanismsHow does Powerwave work?
When looking at a very short length scale (1 inch or less), the difference between the gradient in the high perm and normal matrix is small.
Pressure gradient in the high permeability streak/viscous finger, is lower than in the matrix , but
Not to scale
The forced Powerwave pressure gradient totally dwarfs the natural pressure gradient difference on this scale and water is now forcibly injected into the reservoir much more evenly than during static injection resulting in greatly improved sweep efficiency.
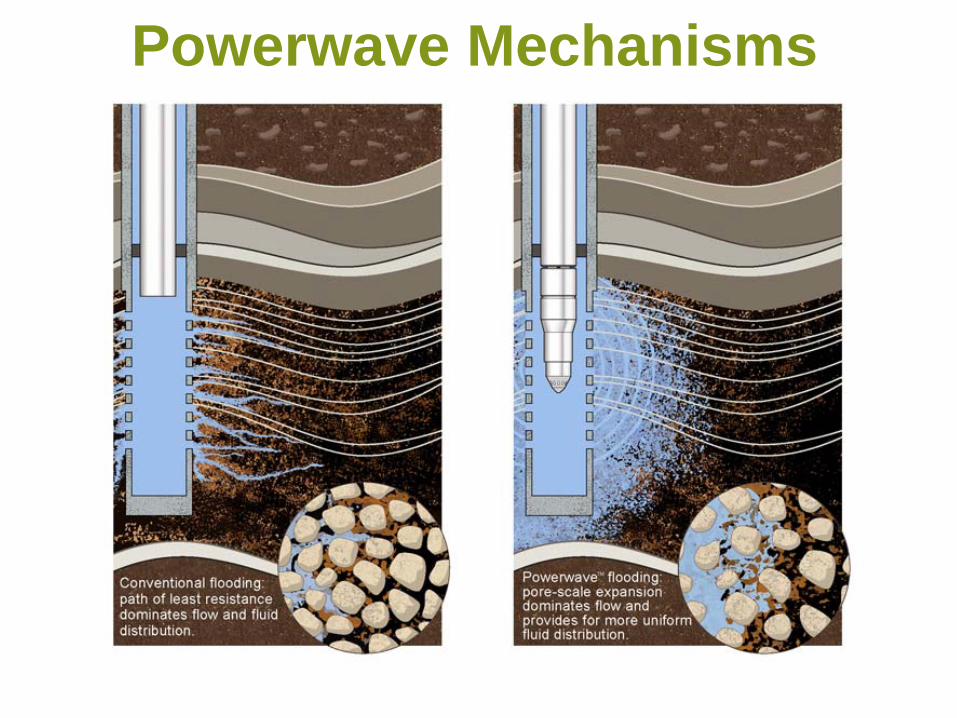
Powerwave Mechanisms
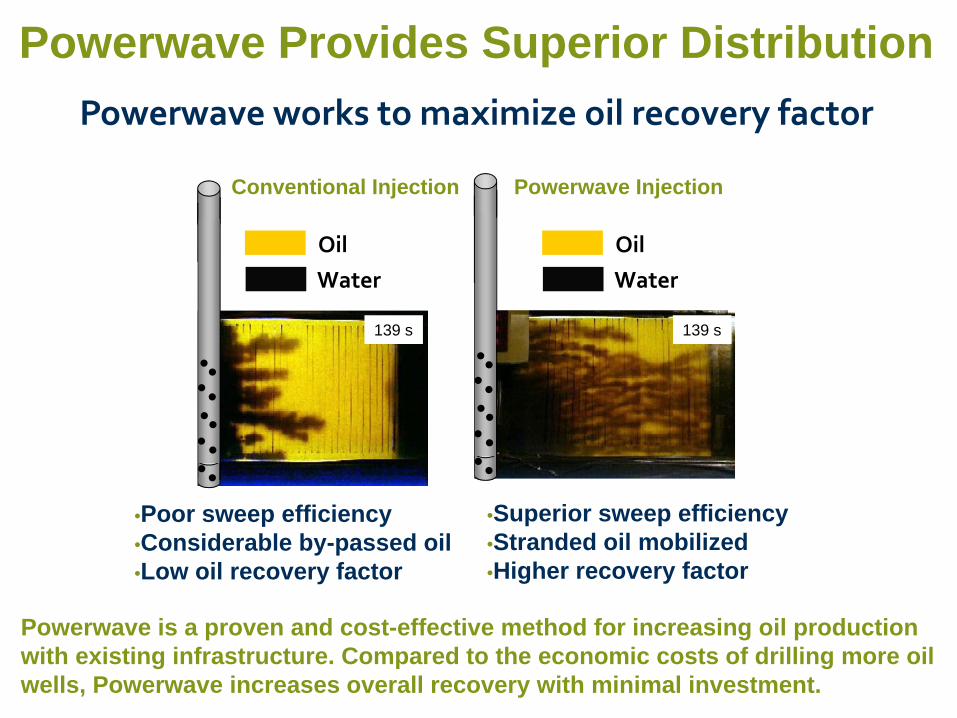
Powerwave works to maximize oil recovery factor
Powerwave Provides Superior Distribution
••••••••••
139 s 139 s
Conventional Injection Powerwave Injection
••••••••••
OilWater
OilWater
•Poor sweep efficiency•Considerable by-passed oil•Low oil recovery factor
•Superior sweep efficiency•Stranded oil mobilized•Higher recovery factor
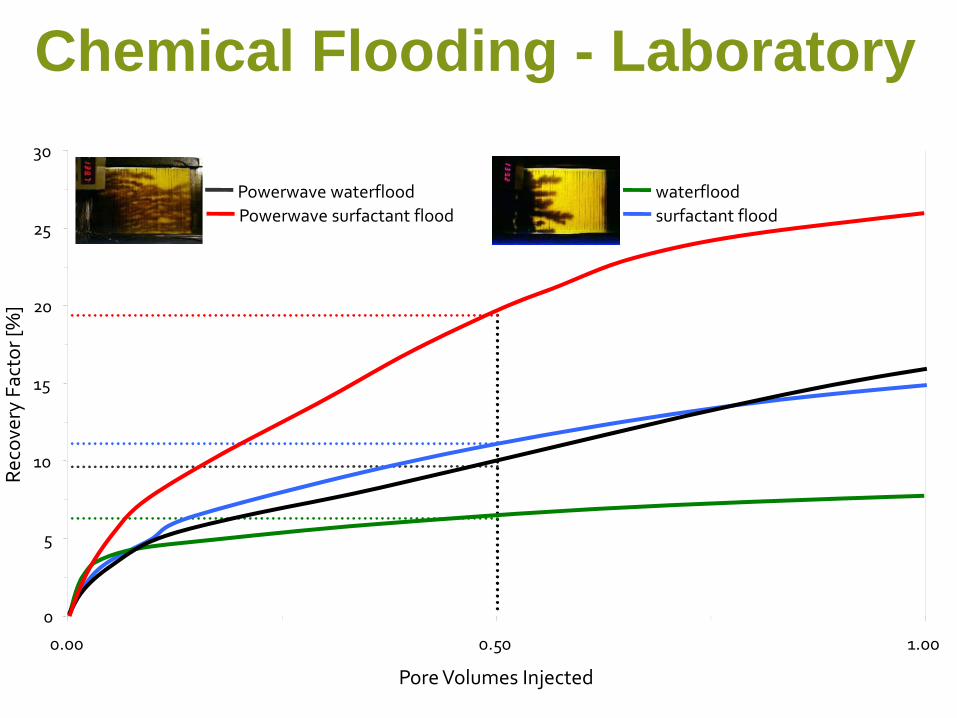
Powerwave is a proven and cost-effective method for increasing oil production with existing infrastructure. Compared to the economic costs of drilling more oil wells, Powerwave increases overall recovery with minimal investment.
0
5
10
15
20
25
30
0.00 0.50 1.00
Pore Volumes Injected
Reco
very Fac
tor [%]
waterfloodPowerwave waterfloodPowerwave surfactant flood surfactant flood
Chemical Flooding - Laboratory

Presentation Outline
• Introduction and Powerwave Overview
• Waterflood Case History• Conclusions and Forward Plan for
this Operator/Project
• Questions and Answers
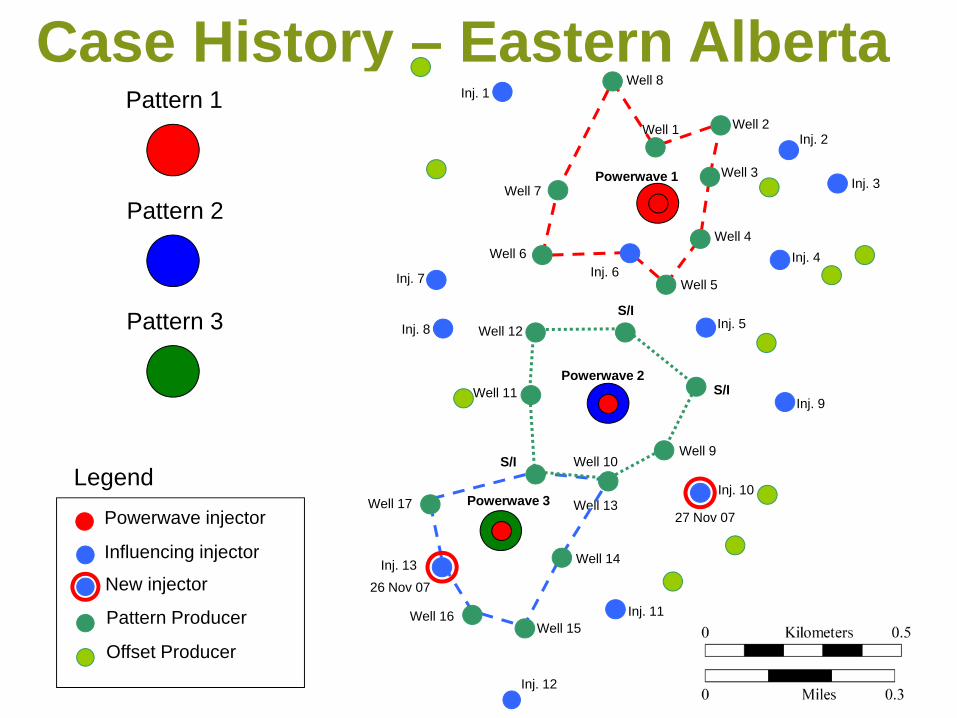
Case History – Eastern Alberta
Powerwave Pilot Area
LegendPowerwave injector
Influencing injector
Pattern Producer
Offset Producer
New injector
Pattern 1
Pattern 2
Pattern 3
Well 1 Well 2
Well 3
Well 4
Well 5
Well 6
Well 7
Well 8
Well 9Well 10
Well 11
Well 13
Well 12
Well 15
Well 14
Well 16
S/I
S/I
S/I
Well 17
Powerwave 1
Powerwave 2
Powerwave 3
26 Nov 07
27 Nov 07
Inj. 1
Inj. 4
Inj. 3
Inj. 2
Inj. 7 Inj. 6
Inj. 5
Inj. 10
Inj. 9
Inj. 8
Inj. 11
Inj. 12
Inj. 13
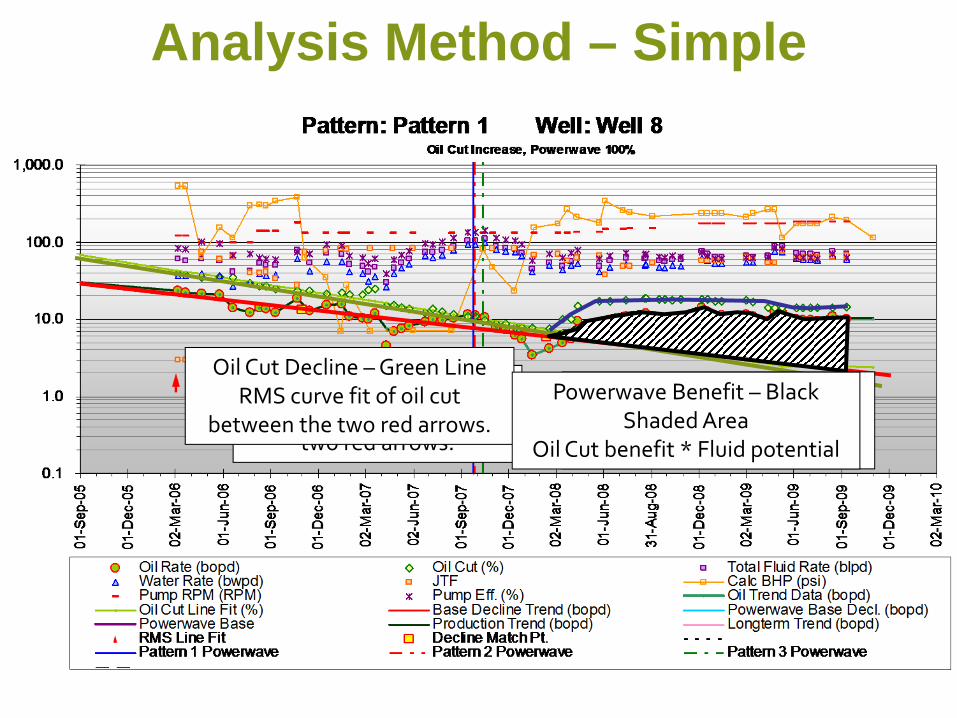
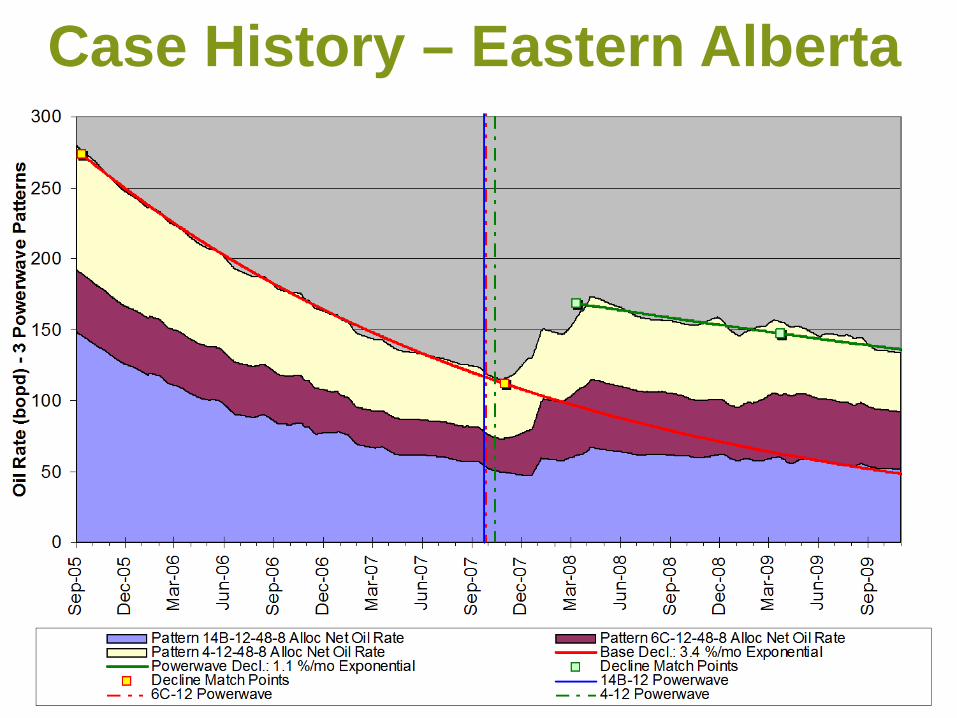
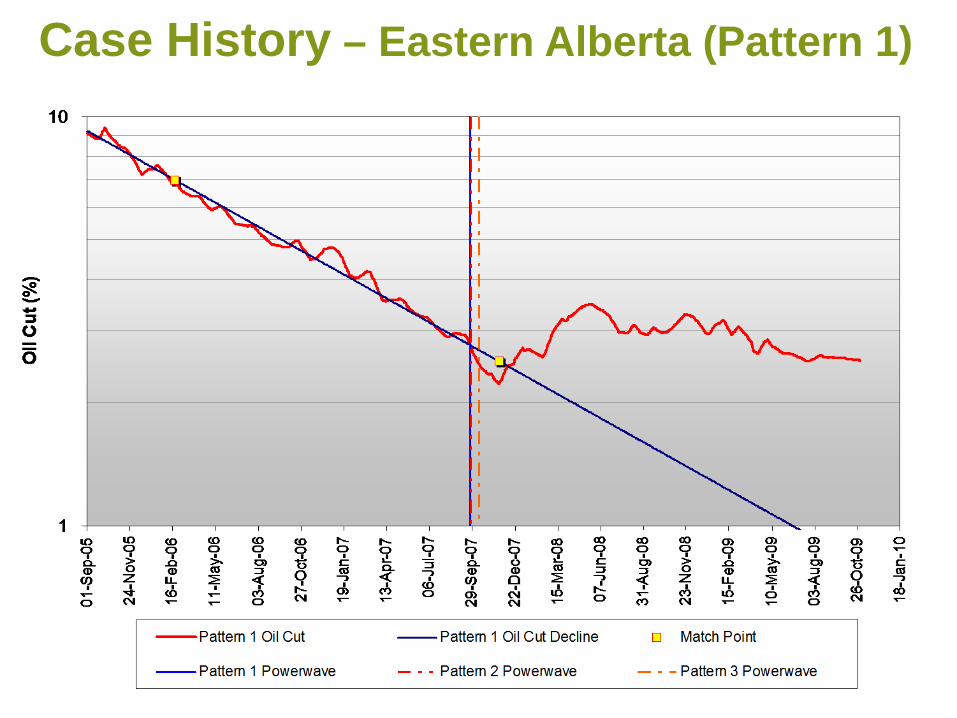
Analysis Method – Simple
Base Decline – Red LineRMS curve fit between the
two red arrows.
Oil Cut Decline –Green LineRMS curve fit of oil cut
between the two red arrows.Oil Cut Benefit – Blue LineDefined by Oil Cut points
above the oil cut trend line.
Powerwave Benefit – Black Shaded Area
Oil Cut benefit * Fluid potential
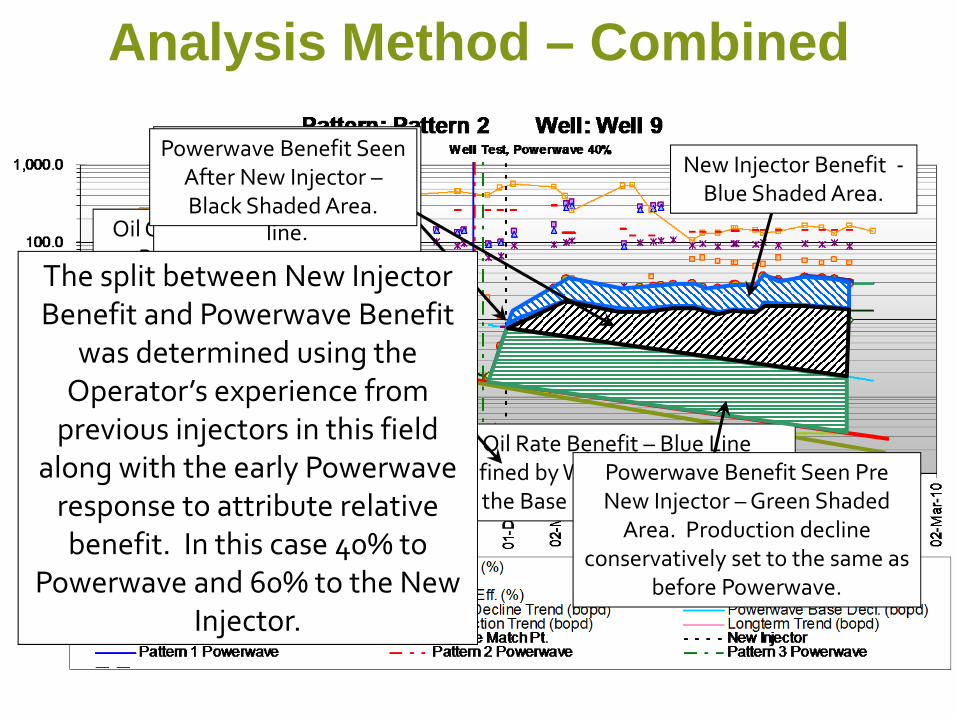
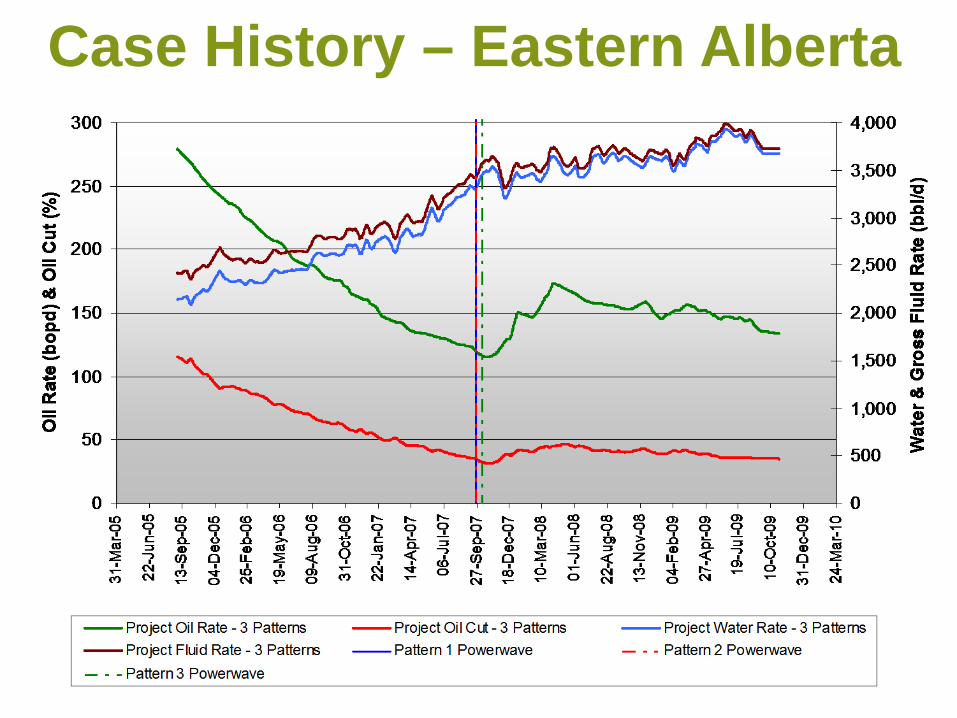
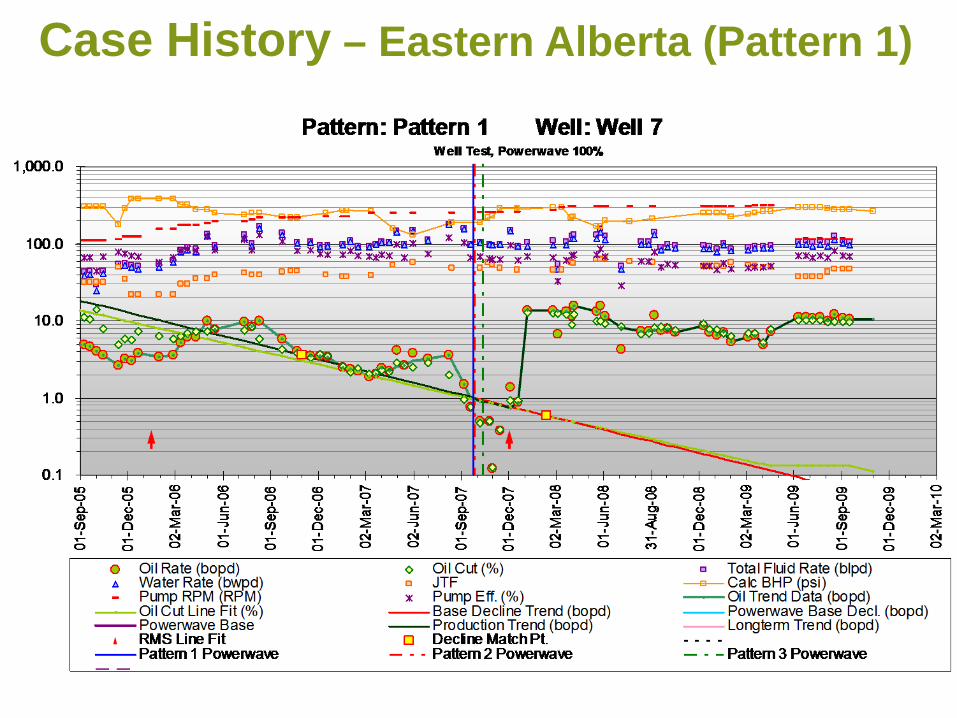
Analysis Method – Combined
Base Decline – Red LineRMS curve fit between the two red arrows.
Oil Cut Decline –Green LineRMS curve fit of oil cut
between the two red arrows.
Oil Rate Benefit – Blue LineDefined by Well Test points above
the Base Decline trend line.
New Injector Online that will impact well production.
Clear benefit seen from Powerwave prior to the new injector coming on‐
line.
Powerwave Benefit Seen Pre New Injector –Green Shaded Area. Production decline
conservatively set to the same as before Powerwave.
New Injector Benefit ‐Blue Shaded Area.
Powerwave Benefit Seen After New Injector –Black Shaded Area.
The split between New Injector Benefit and Powerwave Benefit
was determined using the Operator’s experience from previous injectors in this field
along with the early Powerwave response to attribute relative benefit. In this case 40% to
Powerwave and 60% to the New Injector.
Case History – Eastern Alberta
Case History – Eastern Alberta
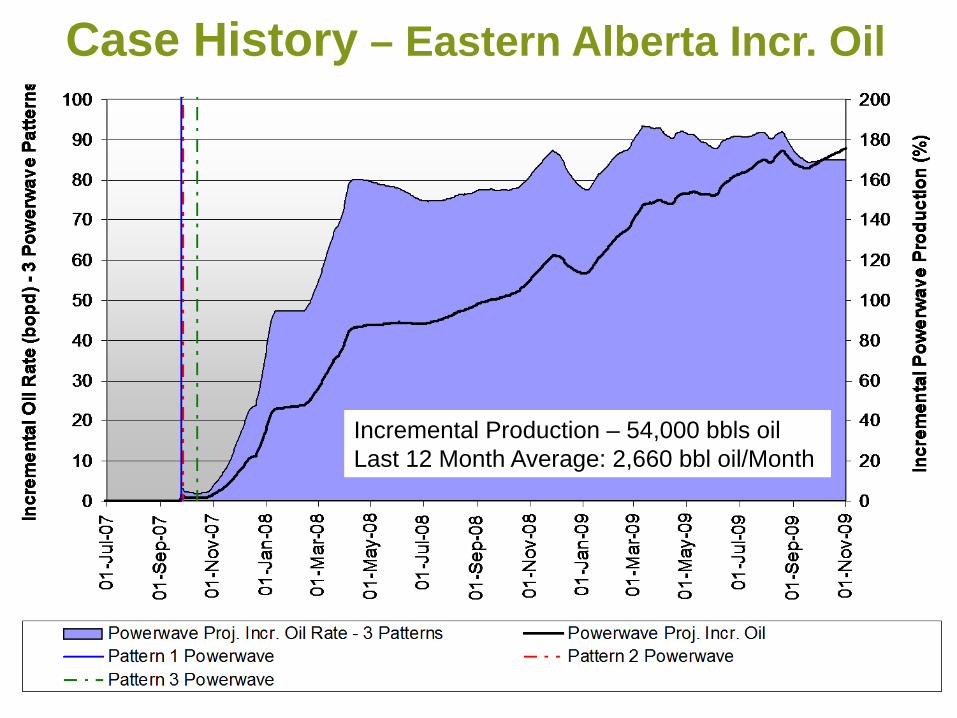
Case History – Eastern Alberta Incr. Oil
Incremental Production – 54,000 bbls oilLast 12 Month Average: 2,660 bbl oil/Month
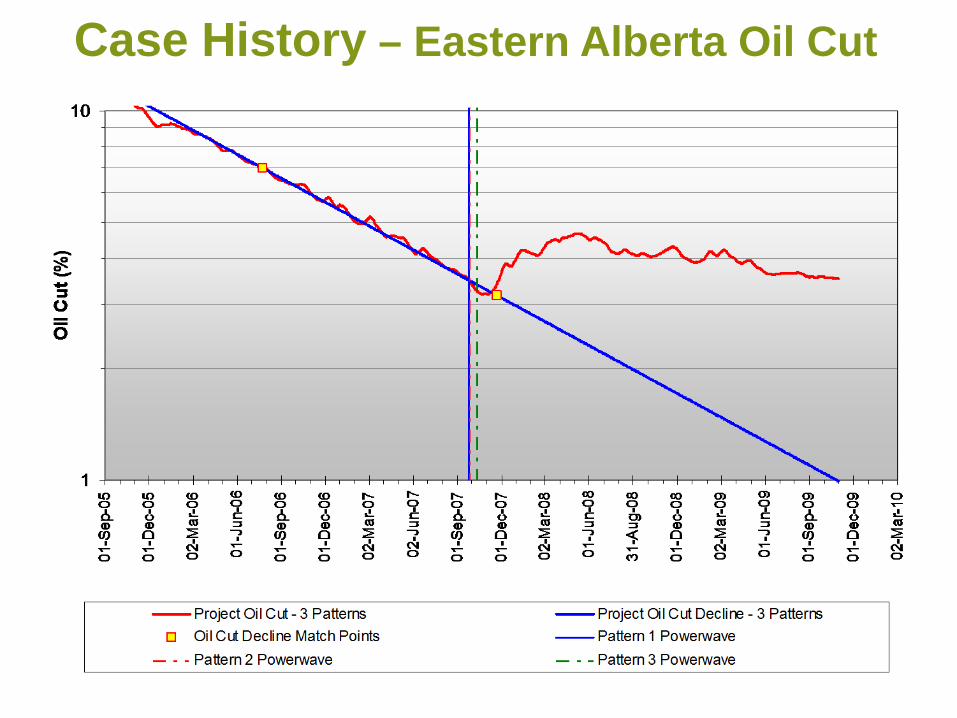
Case History – Eastern Alberta Oil Cut
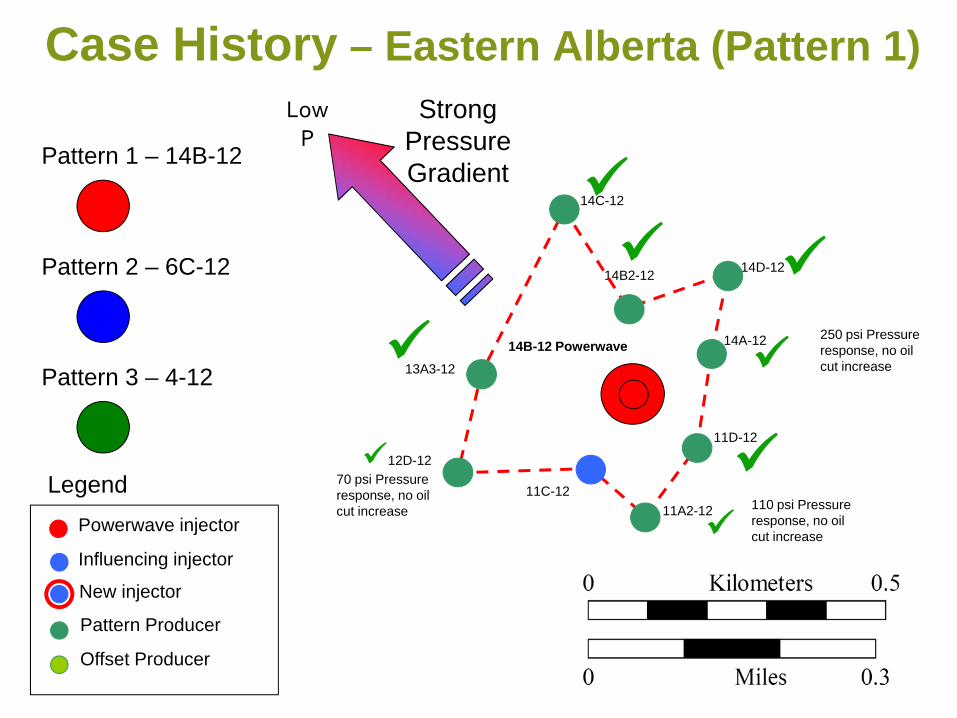
Case History – Eastern Alberta (Pattern 1)
LegendPowerwave injector
Influencing injector
Pattern Producer
Offset Producer
New injector
Pattern 1 – 14B-12
Pattern 2 – 6C-12
Pattern 3 – 4-12
14B2-12 14D-12
14A-12
11D-12
11A2-12
12D-12
13A3-12
14C-12
14B-12 Powerwave
11C-12
250 psi Pressure response, no oil cut increase
110 psi Pressure response, no oil cut increase
70 psi Pressure response, no oil cut increase
Strong Pressure Gradient
LowP
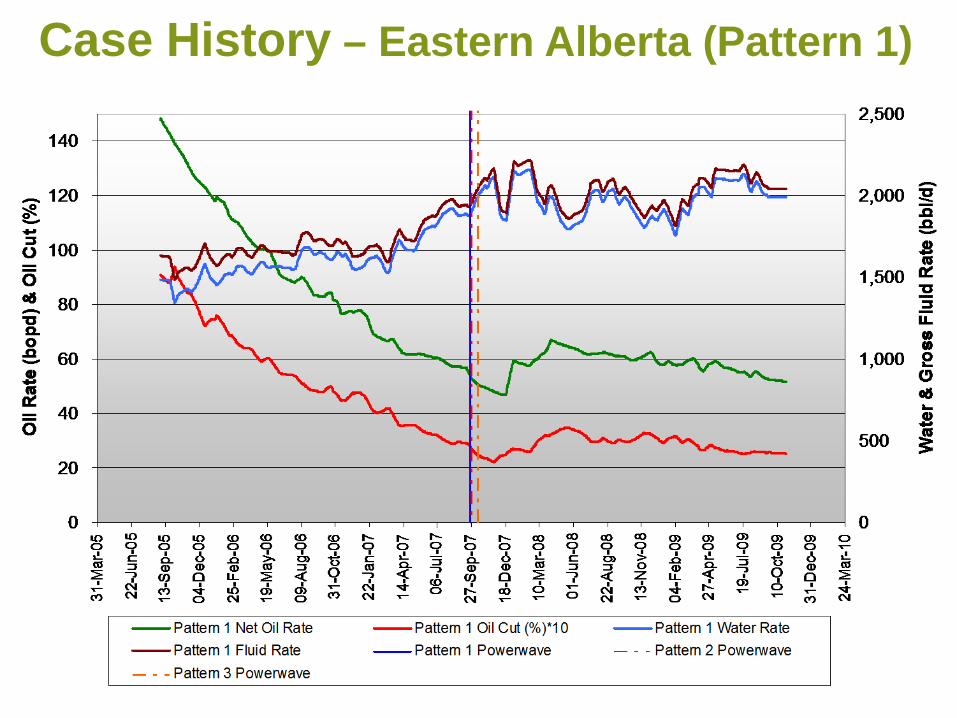
Case History – Eastern Alberta (Pattern 1)
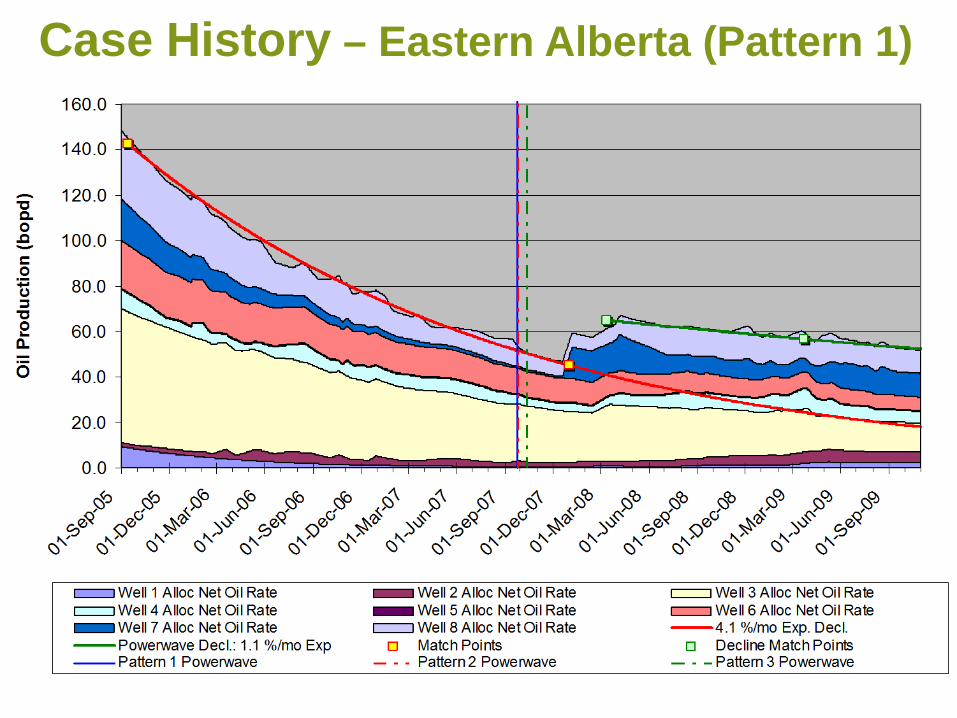
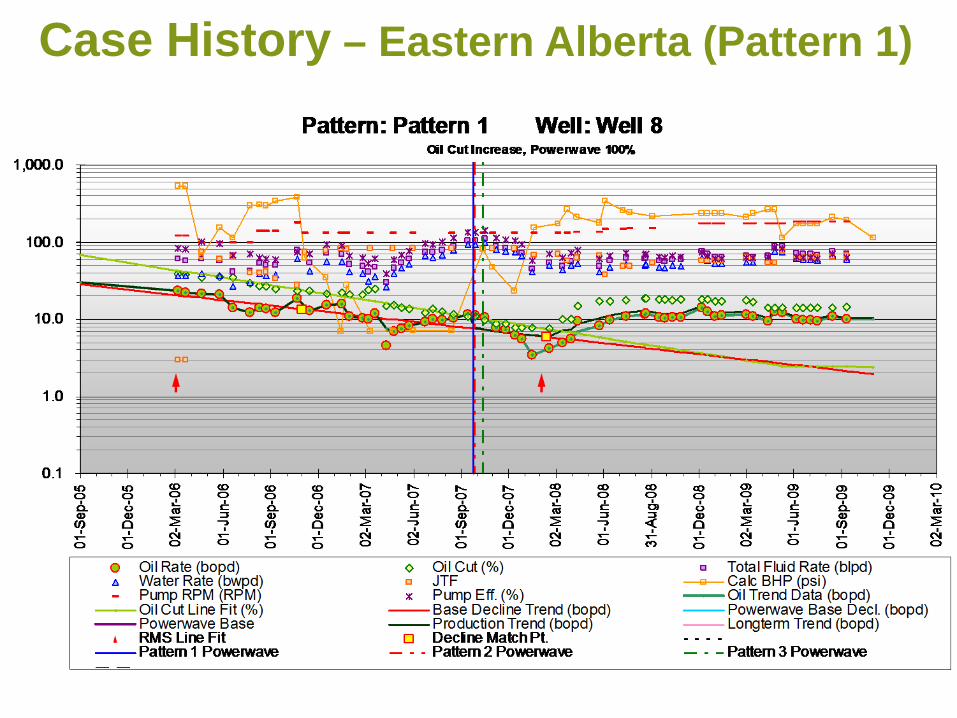
Case History – Eastern Alberta (Pattern 1)
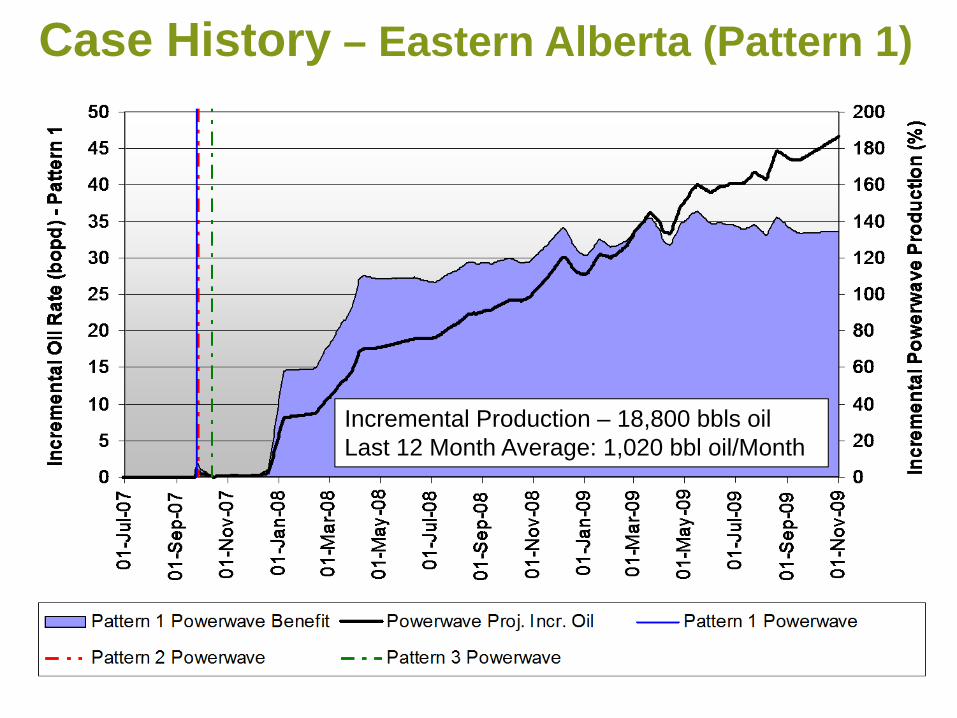
Case History – Eastern Alberta (Pattern 1)
Incremental Production – 18,800 bbls oilLast 12 Month Average: 1,020 bbl oil/Month
Case History – Eastern Alberta (Pattern 1)
Case History – Eastern Alberta (Pattern 1)
Case History – Eastern Alberta (Pattern 1)
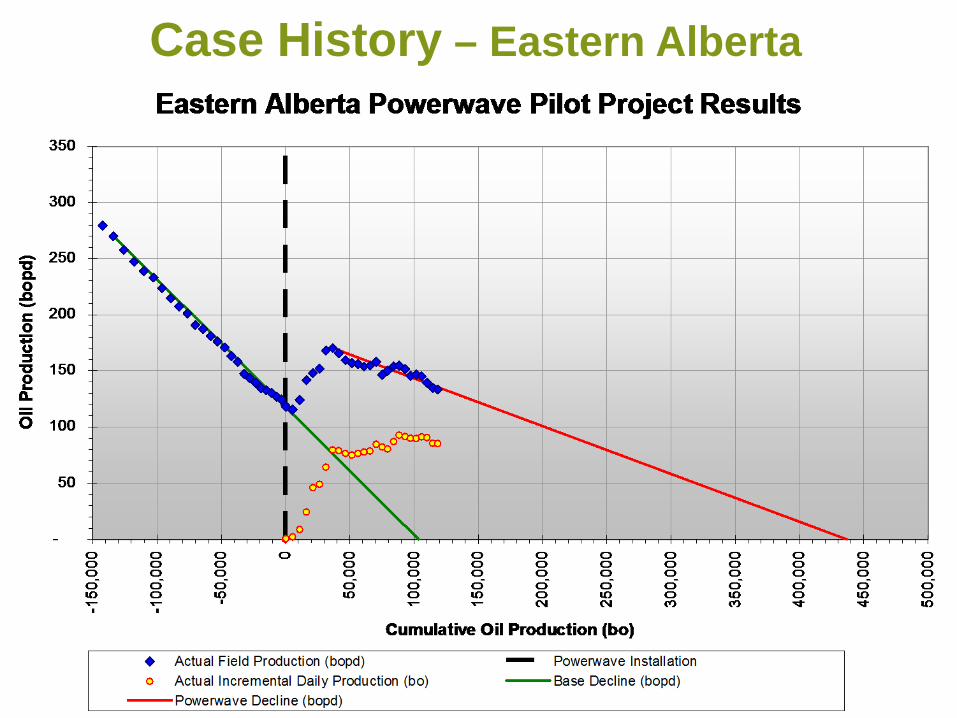
Case History – Eastern Alberta

Case History – Eastern Alberta

Presentation Outline
• Introduction and Powerwave Overview
• Waterflood Case History
• Conclusions and Forward Plan for this Operator/Project
• Questions and Answers
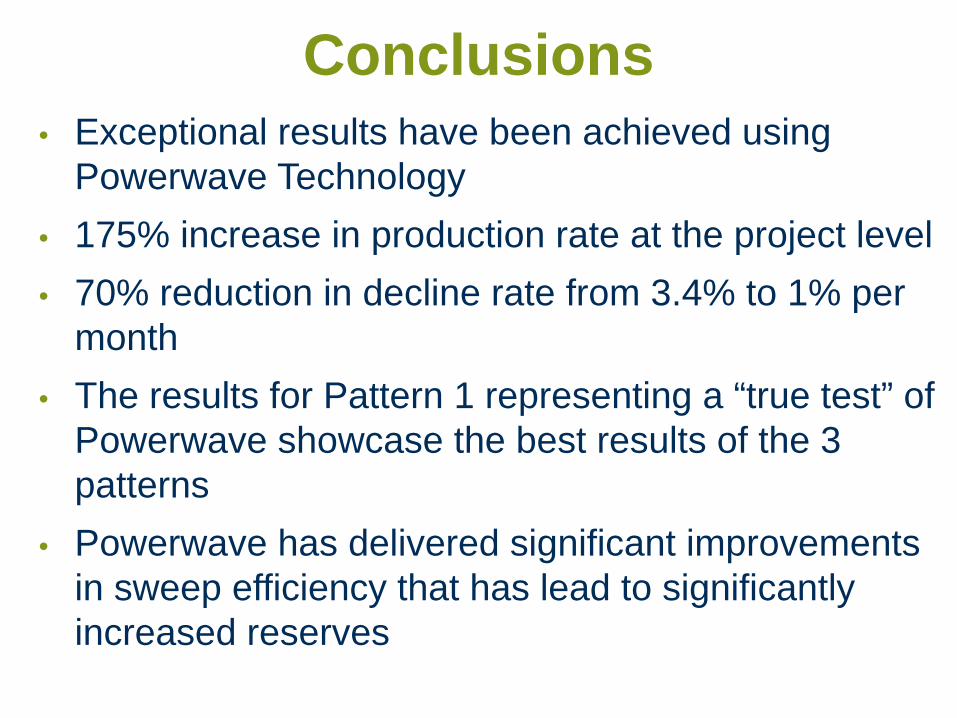
Conclusions• Exceptional results have been achieved using
Powerwave Technology• 175% increase in production rate at the project level• 70% reduction in decline rate from 3.4% to 1% per
month• The results for Pattern 1 representing a “true test” of
Powerwave showcase the best results of the 3 patterns
• Powerwave has delivered significant improvements in sweep efficiency that has lead to significantly increased reserves
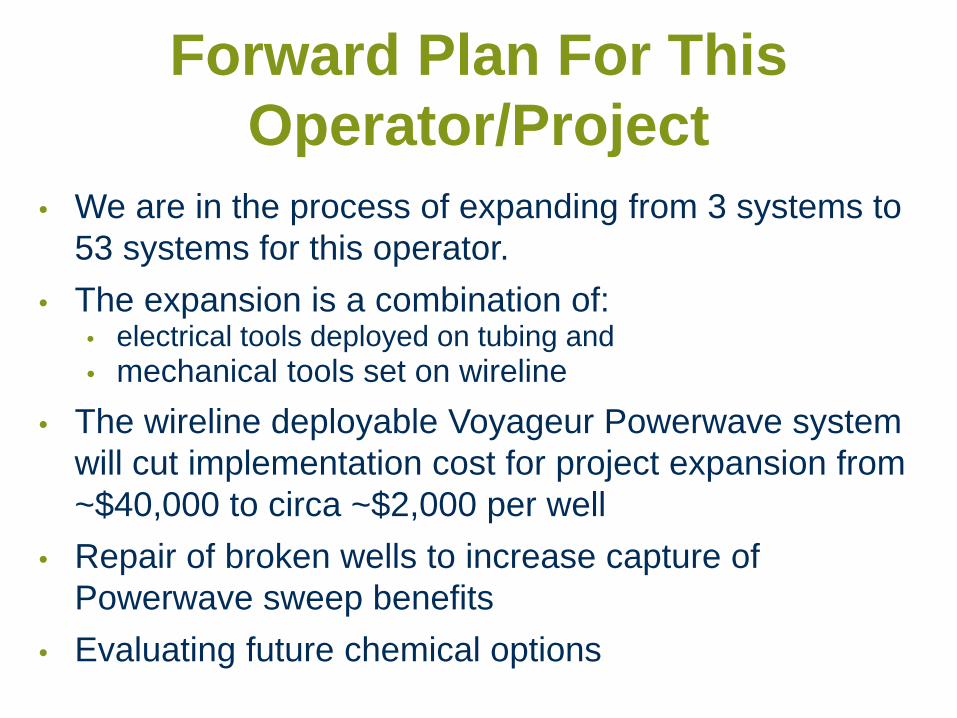
Forward Plan For This Operator/Project
• We are in the process of expanding from 3 systems to 53 systems for this operator.
• The expansion is a combination of:• electrical tools deployed on tubing and• mechanical tools set on wireline
• The wireline deployable Voyageur Powerwave system will cut implementation cost for project expansion from ~$40,000 to circa ~$2,000 per well
• Repair of broken wells to increase capture of Powerwave sweep benefits
• Evaluating future chemical options
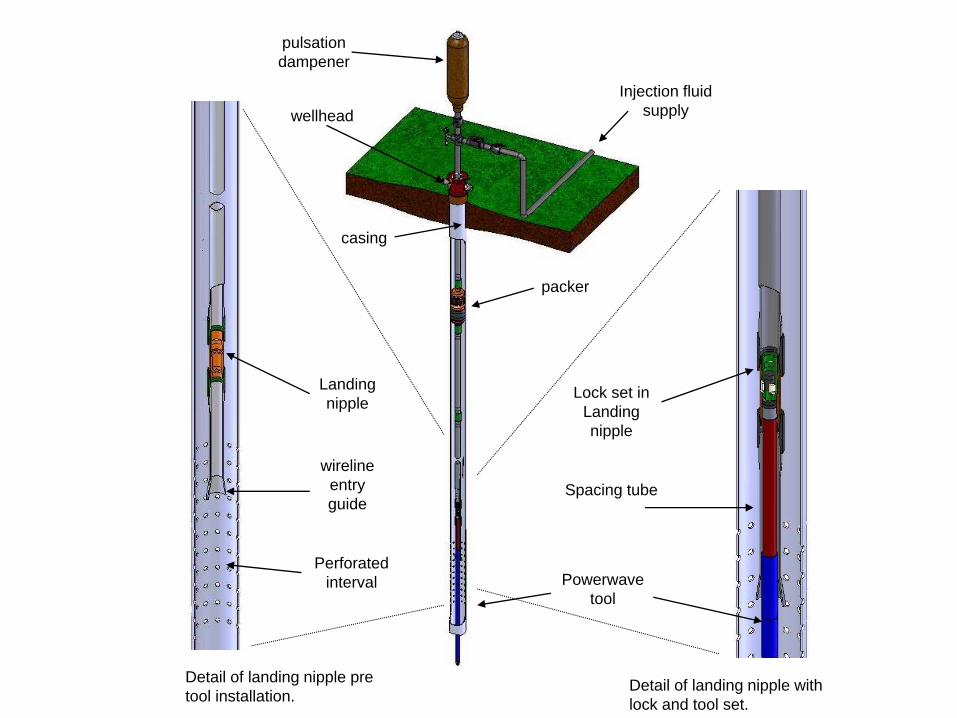
Detail of landing nipple pre tool installation.
Detail of landing nipple with lock and tool set.
Landingnipple
wireline entry guide
pulsation dampener
wellheadInjection fluid
supply
casing
packer
Perforated interval
Lock set in Landingnipple
Powerwave tool
Spacing tube