Embed Size (px)
Citation preview
PUMA SE
FINANCIAL REPORT
January - March of 2014
- 2 -
CONTENT
Key Figures 3
Interim Management Report
- General Economic Conditions 4
- Strategy 4
- Sales and Earnings Development 5 - 8
- Net Assets and Financial Position 9
- Outlook 10
Interim Consolidated Financial Statements
- Balance Sheet 11
- Income Statement 12
- Statement of Comprehensive Income 13
- Cashflow Statement 14
- Changes in Equity 15
- Operating Segments 16
- Notes to the Financial Report 17 – 19
Managing Directors / Administrative Board 20
Financial Calendar 21
0
10
20
30
40
50
60
70
0
20
40
60
80
100
120
140
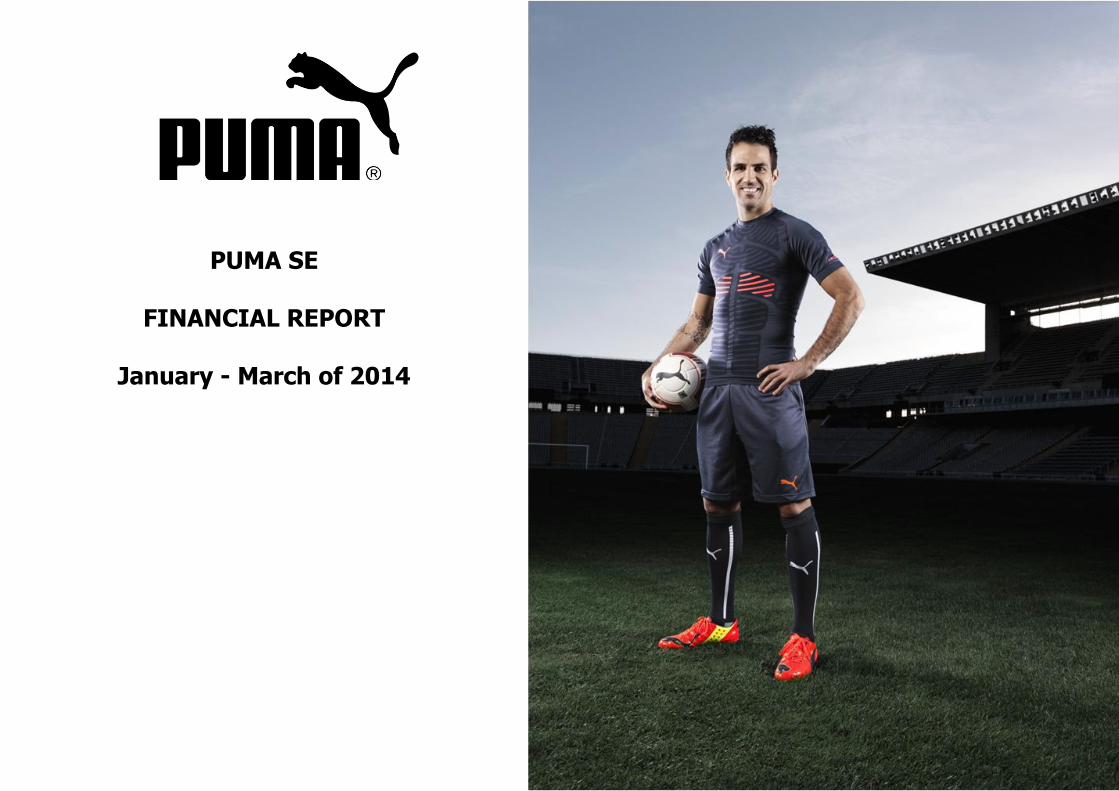
Development of the PUMA ShareRebased Development incl. Trading Volume (Xetra)
Xetra Trading Volume PUMA Share SDAX Index
A pr May June July Aug Sep Oct Nov Dec Jan Feb Mar
- 3 -
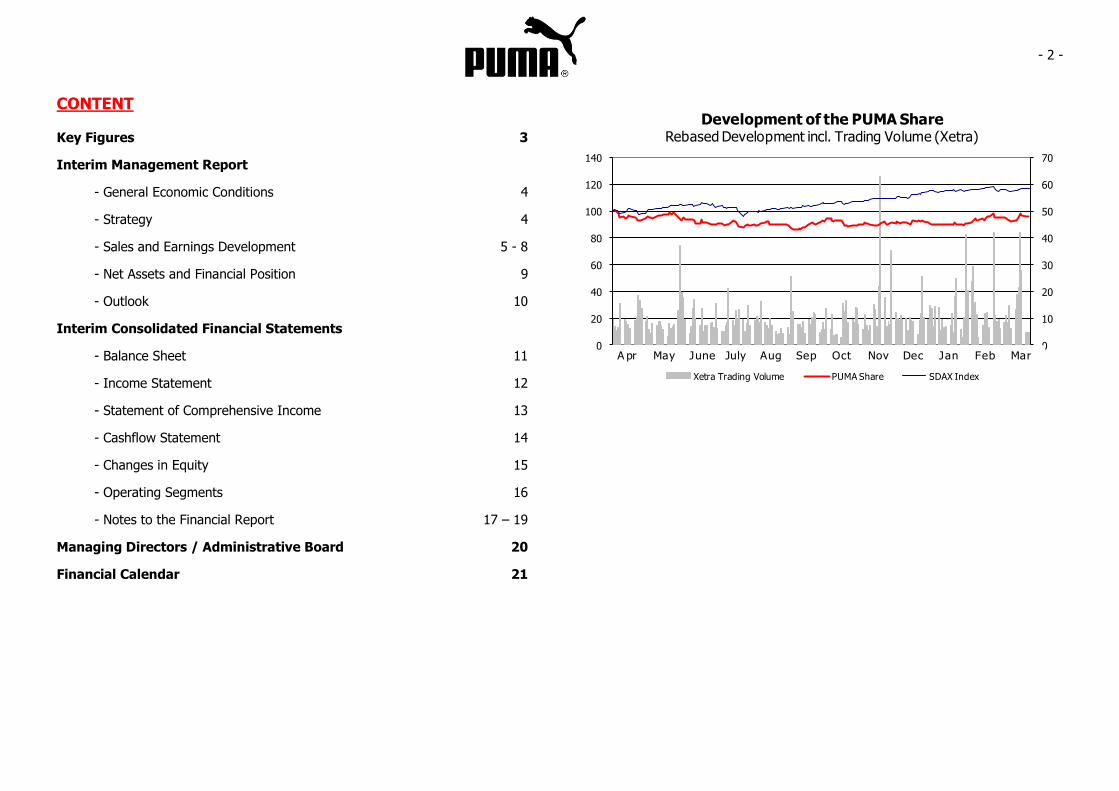
721
811
856821
764
2010 2011 2012 2013 2014
BRAND SALES Jan. - Mar. (€ million)
683773 821 782 726
2010 2011 2012 2013 2014
CONSOLIDATED SALES Jan. - Mar. (€ million)
4,81 5,17 4,92
3,36
2,38
2010 2011 2012 2013 2014
EARNINGS PER SHAREJan. - Mar. (€)
Bjoern Gulden, CEO:
“PUMA‟s currency adjusted sales and operating
margin for the first quarter were in line with our expectations – yet negatively impacted by adverse
currency affects. During the quarter, we continued to make progress towards our mission to become
the Fastest Sports Brand in the world and achieved
all our key project milestones in this pursuit. We know that the repositioning of PUMA and the
turnaround of the business will take time, but I am convinced that we are progressing well on all our
key strategic priorities and that we have initiated the right projects to make 2014 the start of the
turnaround.”
Key Figures 1-3/2014 1-3/2013 Devi-
€ million € million ation
Brand Sales 763,7 820,5 -6,9%
Consolidated net sales 725,7 781,6 -7,1%
Gross profit in % 48,5% 49,1%
Operating result 58,6 79,0 -25,8%
Net earnings 35,6 50,3 -29,2%
- in % 4,9% 6,4%
Total assets 2.310,3 2.513,9 -8,1%
Equity ratio in % 65,7% 66,7%
Working capital 673,5 774,7 -13,1%
Cashflow - gross 69,0 88,7 -22,2%
Free cashflow (before acquisition) -132,0 -134,0 -1,5%
Earnings per share (in €) 2,38 3,36 -29,1%
Cashflow - gross per share (in €) 4,62 5,93 -22,1%
Free cashflow per share (in €) (before acquisition) -8,83 -8,96 -1,4%
Share price at end of the period 204,25 242,89 -15,9%
Market capitalization at end of the period 3.052 3.629 -15,9%
Investments in tangible and intangible assets (excluding goodwill) 12,4 8,9 38,4%
- 4 -
Interim Management Report
GENERAL ECONOMIC CONDITIONS
The spring forecast published on March 13, 2014 by the Kiel World Economic Institute (IfW)
indicates that the world economy has been
improving since mid-2013 despite the ongoing headwinds. The positive momentum is, however,
still moderate and remains susceptible to setbacks. In contrast to western economies, emerging
markets have not provided any positive economic
trends in recent months. Global economic growth is therefore currently reliant on the upward
momentum provided by the western economies.
STRATEGY
In line with PUMA‟s mission to become the Fastest Sports Brand in the World, we have continued our
efforts to make PUMA faster and more efficient.
This strategy encompasses the repositioning of PUMA as the World‟s Fastest Sports Brand, the
improvement of our product engine, the optimization of our distribution quality, and
increasing the speed within our organization and
infrastructure.
In terms of our brand repositioning, we have completed the definition of our brand platform and
are now translating them into a marketing campaign, which will be launched in August 2014 –
the biggest campaign for PUMA ever. The
campaign will showcase many of our great athletes like Usain Bolt, Mario Balotelli, Rickie Fowler, Marta
and Lexi Thompson in their pursuit of our brand mantra Forever Faster.
To improve our product engine, we have adapted our design language in accordance with our new
brand platform. Torsten Hochstetter, our Global Creative Director, translated our brand mantra
“Forever Faster” into a new distinctive design
language for PUMA, which takes its clear inspirations from our heritage and our roots in
sports. With innovative products and a more commercial focus, we are convinced that we will
have a strong product offering in place to excite the market in Spring/Summer 2015.
We have also started to improve the quality of our revenues and distribution. Our current focus is to
reestablish the relationships with our Key Accounts
using dedicated product and marketing programs. With the PUMA Lab at Foot Locker, we have a
large scale program in more than 100 doors in the US in place, which provide a great opportunity to
showcase our brand and great products in this
opinion-leading retailer. We are satisfied with the results as our comparable sales are significantly
up. Furthermore, we are currently adapting our direct-to-consumer channels to our new brand
direction: Our new unified eCommerce site will be launched in the USA, Europe and Russia by mid
2014 and our new retail format will launch with our
new full-price store opening in Dubai in the fourth quarter of 2014.
We have also continued to make our organizational
structure and setup faster. As of 2 May, our PUMA
Village development center in Vietnam is closed. Our developers have moved into the sample rooms
of our suppliers‟ factories to speed up our development process, while our office employees
moved into our new offices in central Ho Chi Minh.
The property sale of PUMA Village is currently ongoing. Our relocations of the Lifestyle Business
Unit from London and of the Global and European Retail Organization from Oensingen, Switzerland,
to our headquarters in Herzogenaurach are in process and will be finalized by the end of May and
September respectively.
- 5 -
782
692
813
698726
Q1 Q2 Q3 Q4
CONSOLIDATED SALES (€ million)
152
256
373
159
246
321
Accessories Apparel Footwear
CONSOLIDATED SALES Jan. - Mar. (€ million)
173
260
348
153
235
337
Asia/Pacific Americas EMEA
SALES BY REGIONJan. - Mar. (€ million)
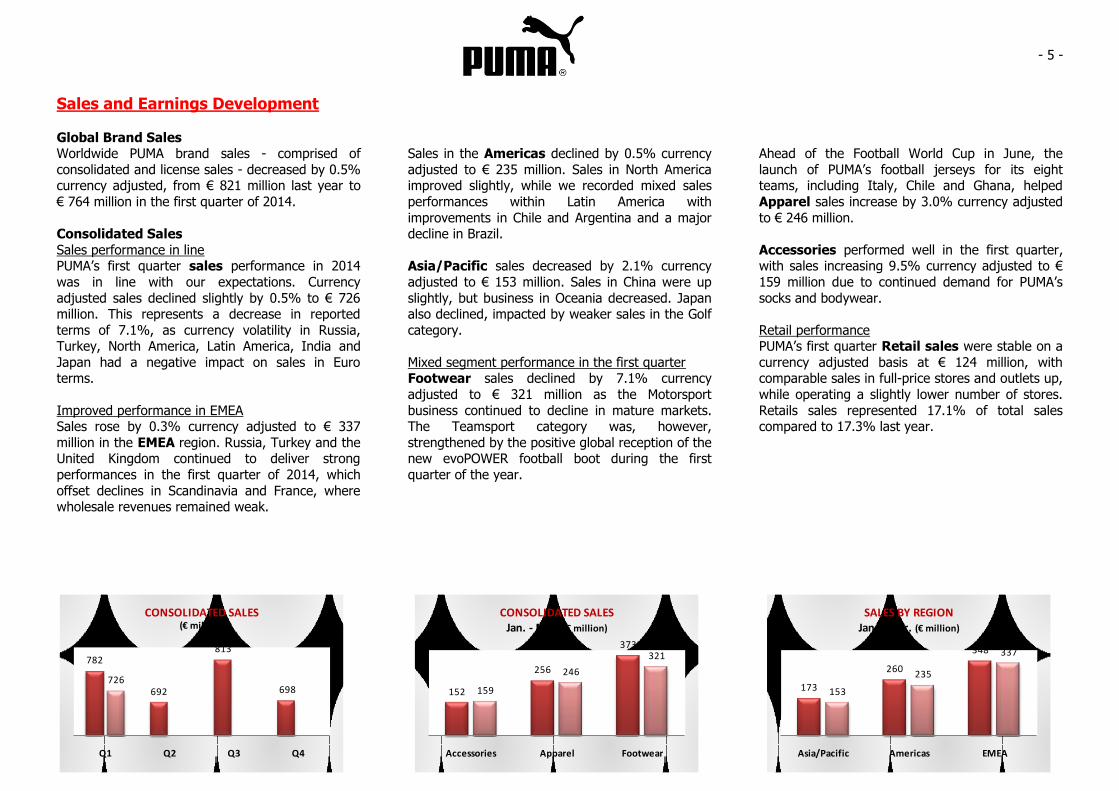
Sales and Earnings Development
Global Brand Sales Worldwide PUMA brand sales - comprised of
consolidated and license sales - decreased by 0.5% currency adjusted, from € 821 million last year to
€ 764 million in the first quarter of 2014.
Consolidated Sales
Sales performance in line PUMA‟s first quarter sales performance in 2014
was in line with our expectations. Currency
adjusted sales declined slightly by 0.5% to € 726 million. This represents a decrease in reported
terms of 7.1%, as currency volatility in Russia, Turkey, North America, Latin America, India and
Japan had a negative impact on sales in Euro terms.
Improved performance in EMEA Sales rose by 0.3% currency adjusted to € 337
million in the EMEA region. Russia, Turkey and the United Kingdom continued to deliver strong
performances in the first quarter of 2014, which
offset declines in Scandinavia and France, where wholesale revenues remained weak.
Sales in the Americas declined by 0.5% currency
adjusted to € 235 million. Sales in North America improved slightly, while we recorded mixed sales
performances within Latin America with
improvements in Chile and Argentina and a major decline in Brazil.
Asia/Pacific sales decreased by 2.1% currency
adjusted to € 153 million. Sales in China were up
slightly, but business in Oceania decreased. Japan also declined, impacted by weaker sales in the Golf
category.
Mixed segment performance in the first quarter Footwear sales declined by 7.1% currency
adjusted to € 321 million as the Motorsport
business continued to decline in mature markets. The Teamsport category was, however,
strengthened by the positive global reception of the new evoPOWER football boot during the first
quarter of the year.
Ahead of the Football World Cup in June, the
launch of PUMA‟s football jerseys for its eight teams, including Italy, Chile and Ghana, helped
Apparel sales increase by 3.0% currency adjusted
to € 246 million.
Accessories performed well in the first quarter, with sales increasing 9.5% currency adjusted to €
159 million due to continued demand for PUMA‟s
socks and bodywear.
Retail performance PUMA‟s first quarter Retail sales were stable on a
currency adjusted basis at € 124 million, with comparable sales in full-price stores and outlets up,
while operating a slightly lower number of stores.
Retails sales represented 17.1% of total sales compared to 17.3% last year.
- 6 -
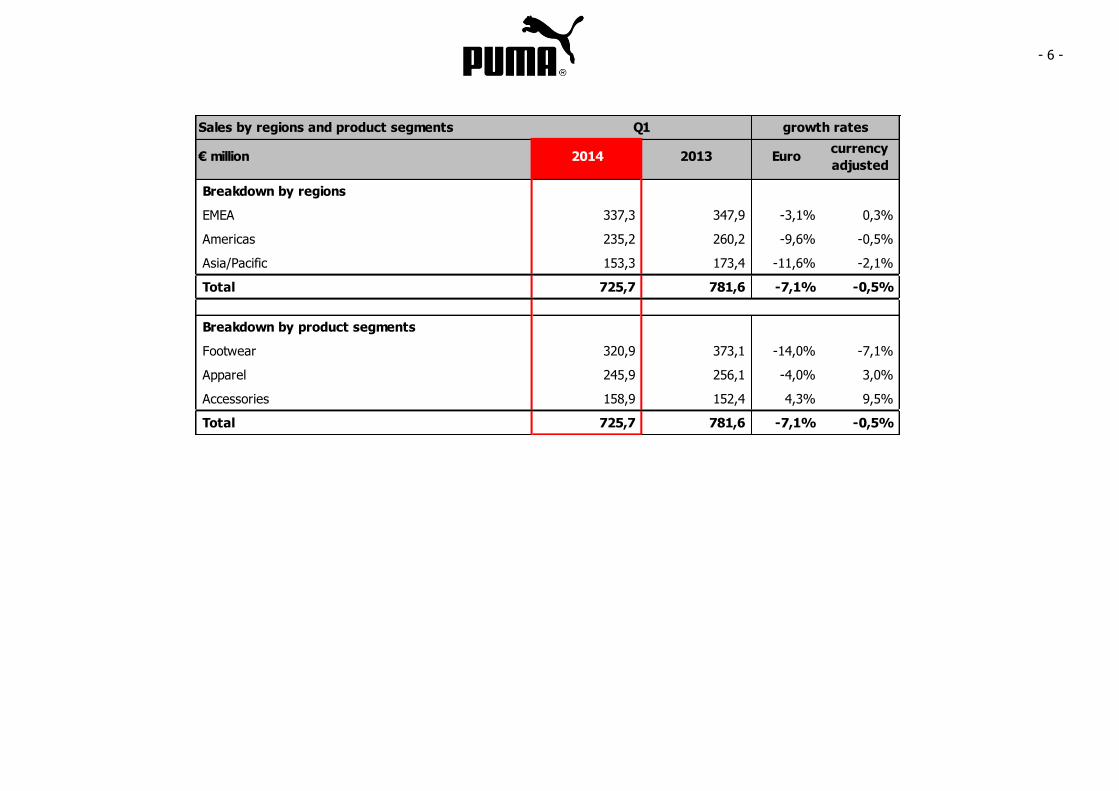
Sales by regions and product segments
€ million 2014 2013 Eurocurrency
adjusted
Breakdown by regions
EMEA 337,3 347,9 -3,1% 0,3%
Americas 235,2 260,2 -9,6% -0,5%
Asia/Pacific 153,3 173,4 -11,6% -2,1%
Total 725,7 781,6 -7,1% -0,5%
Breakdown by product segments
Footwear 320,9 373,1 -14,0% -7,1%
Apparel 245,9 256,1 -4,0% 3,0%
Accessories 158,9 152,4 4,3% 9,5%
Total 725,7 781,6 -7,1% -0,5%
Q1 growth rates
- 7 -
49,1%
46,0%
47,1%
43,2%
48,5%
Q1 Q2 Q3 Q4
GROSS PROFIT MARGIN(in %)
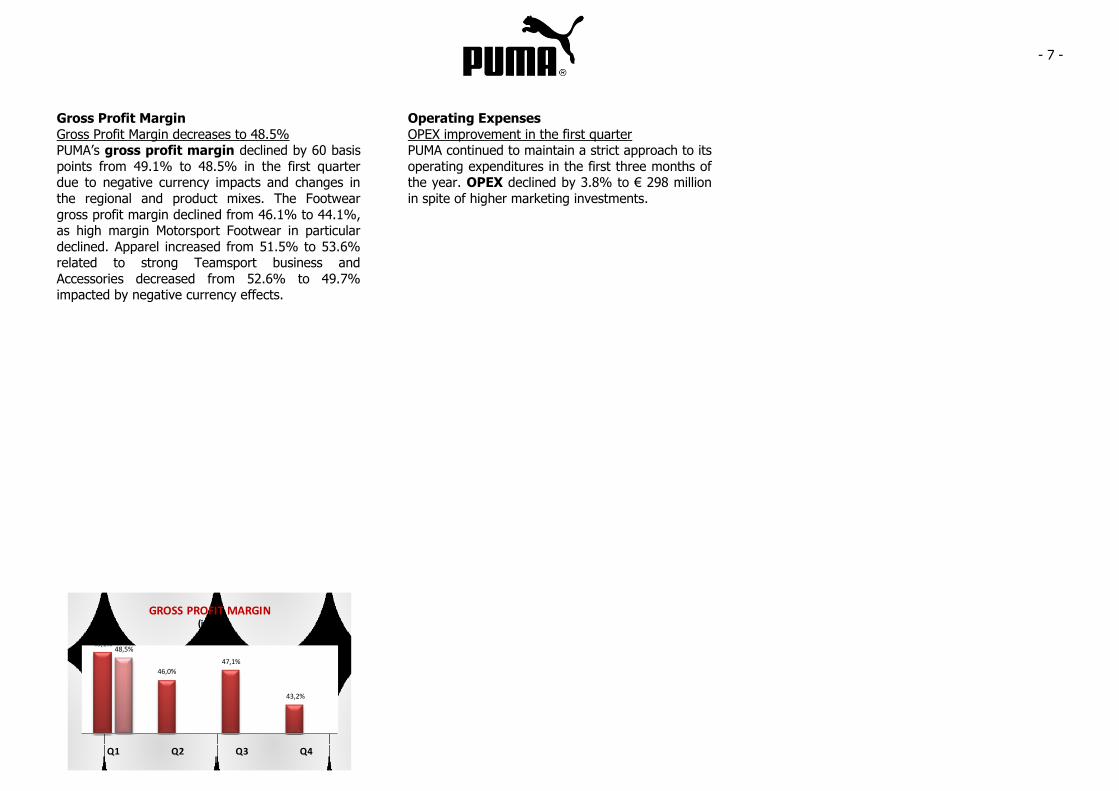
Gross Profit Margin
Gross Profit Margin decreases to 48.5% PUMA‟s gross profit margin declined by 60 basis
points from 49.1% to 48.5% in the first quarter due to negative currency impacts and changes in
the regional and product mixes. The Footwear
gross profit margin declined from 46.1% to 44.1%, as high margin Motorsport Footwear in particular
declined. Apparel increased from 51.5% to 53.6% related to strong Teamsport business and
Accessories decreased from 52.6% to 49.7% impacted by negative currency effects.
Operating Expenses
OPEX improvement in the first quarter PUMA continued to maintain a strict approach to its
operating expenditures in the first three months of the year. OPEX declined by 3.8% to € 298 million
in spite of higher marketing investments.
- 8 -
79
31
80
1
59
Q1 Q2 Q3 Q4
EBIT before special items(€ million)
3,36
1,17
3,53
-7,71
2,38
Q1 Q2 Q3 Q4
EARNINGS PER SHARE(€)
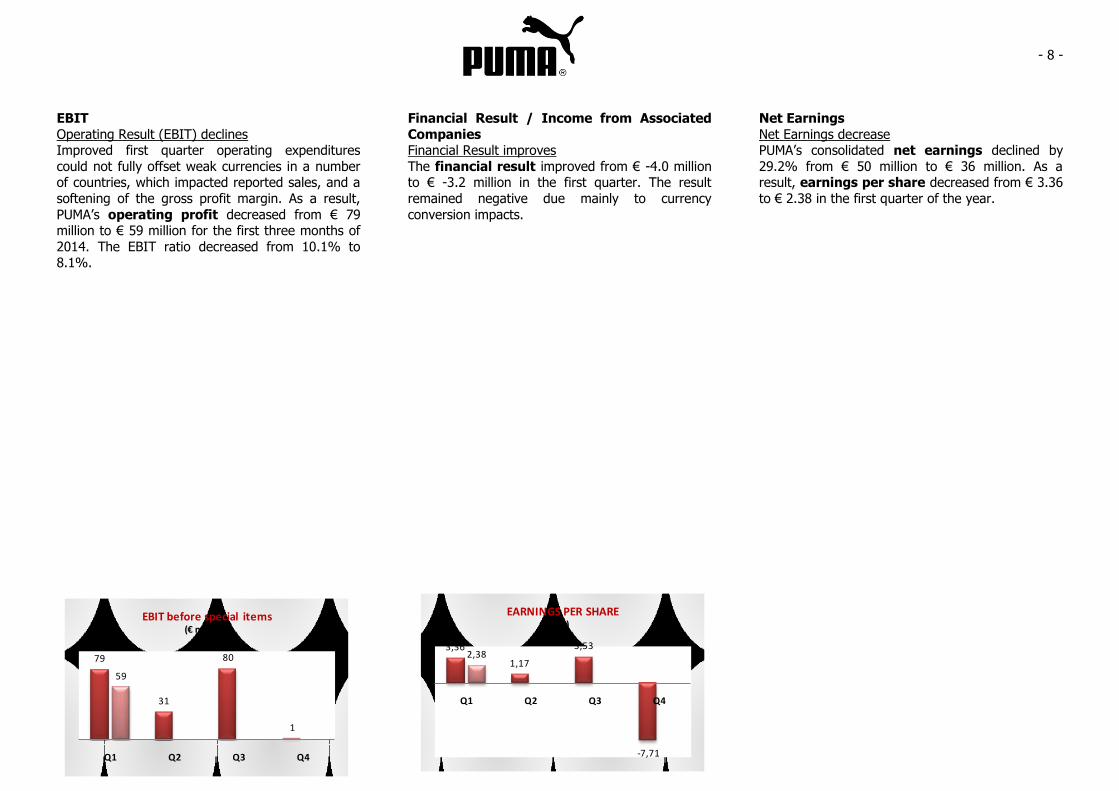
EBIT
Operating Result (EBIT) declines Improved first quarter operating expenditures
could not fully offset weak currencies in a number of countries, which impacted reported sales, and a
softening of the gross profit margin. As a result,
PUMA‟s operating profit decreased from € 79 million to € 59 million for the first three months of
2014. The EBIT ratio decreased from 10.1% to 8.1%.
Financial Result / Income from Associated
Companies Financial Result improves
The financial result improved from € -4.0 million to € -3.2 million in the first quarter. The result
remained negative due mainly to currency
conversion impacts.
Net Earnings
Net Earnings decrease PUMA‟s consolidated net earnings declined by
29.2% from € 50 million to € 36 million. As a result, earnings per share decreased from € 3.36
to € 2.38 in the first quarter of the year.
- 9 -
Net Assets and Financial Position
Working Capital
Working Capital improves The company‟s continued strong balance sheet
management resulted in an 11.5% decrease in
inventory to € 524 million and a 14.8% decrease in trade receivables to € 506 million. With the
decline in trade payables also taken into account, PUMA‟s working capital improved by 13.1% from
€ 775 million to € 674 million at the end of March.
Cashflow / Capex
The Free Cashflow before acquisitions improved slightly to € -132 million in spite of lower
operational cashflows.
Capex increased from € 9 million to € 12 million,
which was mainly invested in the opening and refitting of selected retail stores as well as office
and IT equipment.
Cash Position
Cash Position improved PUMA‟s net cash position improved from € 207
million to € 229 million at the end of the first
quarter.
- 10 -
Outlook 2014
Global Economy
The spring forecast published on March 13, 2014 by the Kiel World Economic Institute (IfW) projects
that the global economy will continue to improve
moderately over the forecast period. In particular growth in western economies is going to improve
this year and next. In contrast, economic momentum in the emerging economies will
continue to be held back by structural deficiencies
and adverse developments in financial markets. As a result, the experts of the IfW expect world output
to increase by 3.6% this year, slightly less than envisaged in the December forecast (3.7%).
Growth in 2015 is projected to be unchanged at 4%.
Investments
Investments totaling around € 70 million are planned for 2014. The majority of these funds have
been allocated to infrastructure investments which
are necessary to help drive the sustainable growth, as well as the expansion of our core markets and
selective investments in retail stores.
Outlook 2014
2014 will be a turnaround year for PUMA, where the brand will be re-established in the market place
and brought back to a path of profitable and
sustainable growth in the mid-term. To support this turnaround, PUMA will continue to invest strongly
in marketing and sports assets, while maintaining tight control on other operating expenditures.
Based on the results of the first quarter and our assumptions at the beginning of the year, which
foresaw stable currencies, our expectations for full year net sales (flat), gross profit (slight increase),
OPEX (increase due to Marketing Investments) and EBIT/Net Earnings (approx. 5% / 3% of net sales
respectively) remain unchanged. Given the current
currency volatility, which is weighing negatively on our results, there may be a correspondingly
negative impact of around 50 basis points on the EBIT and Net Earnings margin for the full year.
- 11 -
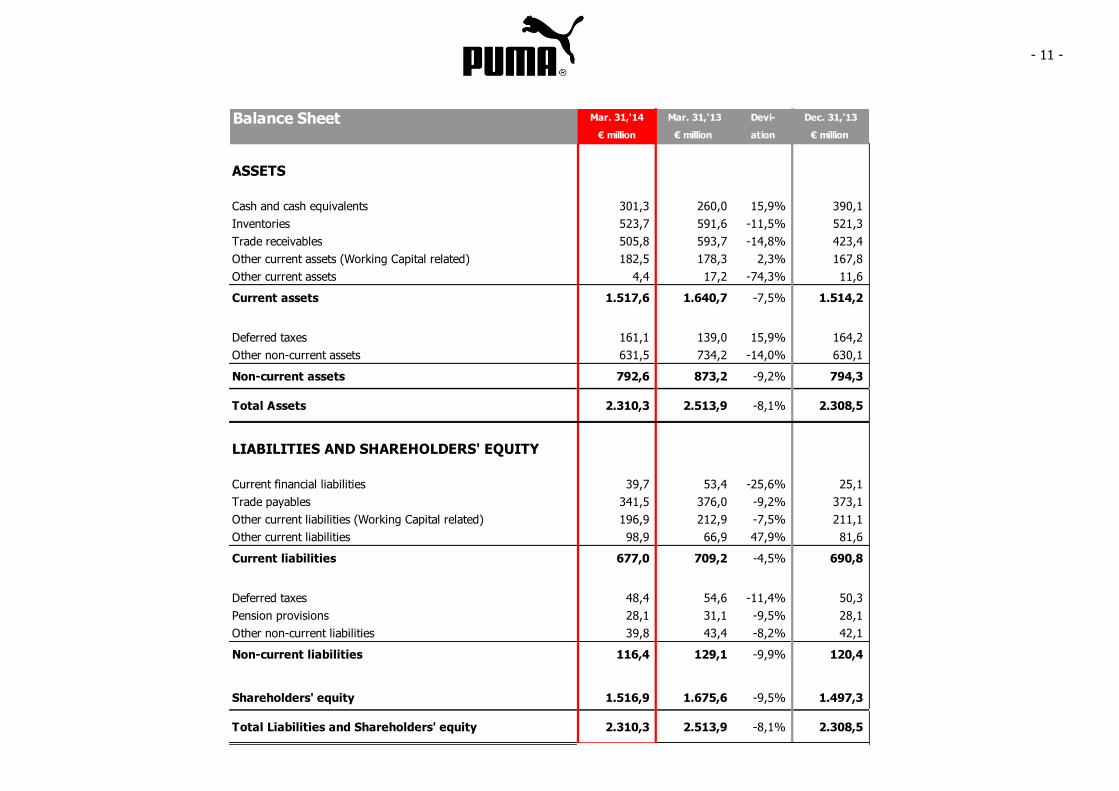
Balance Sheet Mar. 31,'14 Mar. 31,'13 Devi- Dec. 31,'13
€ million € million ation € million
ASSETS
Cash and cash equivalents 301,3 260,0 15,9% 390,1
Inventories 523,7 591,6 -11,5% 521,3
Trade receivables 505,8 593,7 -14,8% 423,4
Other current assets (Working Capital related) 182,5 178,3 2,3% 167,8
Other current assets 4,4 17,2 -74,3% 11,6
Current assets 1.517,6 1.640,7 -7,5% 1.514,2
Deferred taxes 161,1 139,0 15,9% 164,2
Other non-current assets 631,5 734,2 -14,0% 630,1
Non-current assets 792,6 873,2 -9,2% 794,3
Total Assets 2.310,3 2.513,9 -8,1% 2.308,5
LIABILITIES AND SHAREHOLDERS' EQUITY
Current financial liabilities 39,7 53,4 -25,6% 25,1
Trade payables 341,5 376,0 -9,2% 373,1
Other current liabilities (Working Capital related) 196,9 212,9 -7,5% 211,1
Other current liabilities 98,9 66,9 47,9% 81,6
Current liabilities 677,0 709,2 -4,5% 690,8
Deferred taxes 48,4 54,6 -11,4% 50,3
Pension provisions 28,1 31,1 -9,5% 28,1
Other non-current liabilities 39,8 43,4 -8,2% 42,1
Non-current liabilities 116,4 129,1 -9,9% 120,4
Shareholders' equity 1.516,9 1.675,6 -9,5% 1.497,3
Total Liabilities and Shareholders' equity 2.310,3 2.513,9 -8,1% 2.308,5
- 12 -
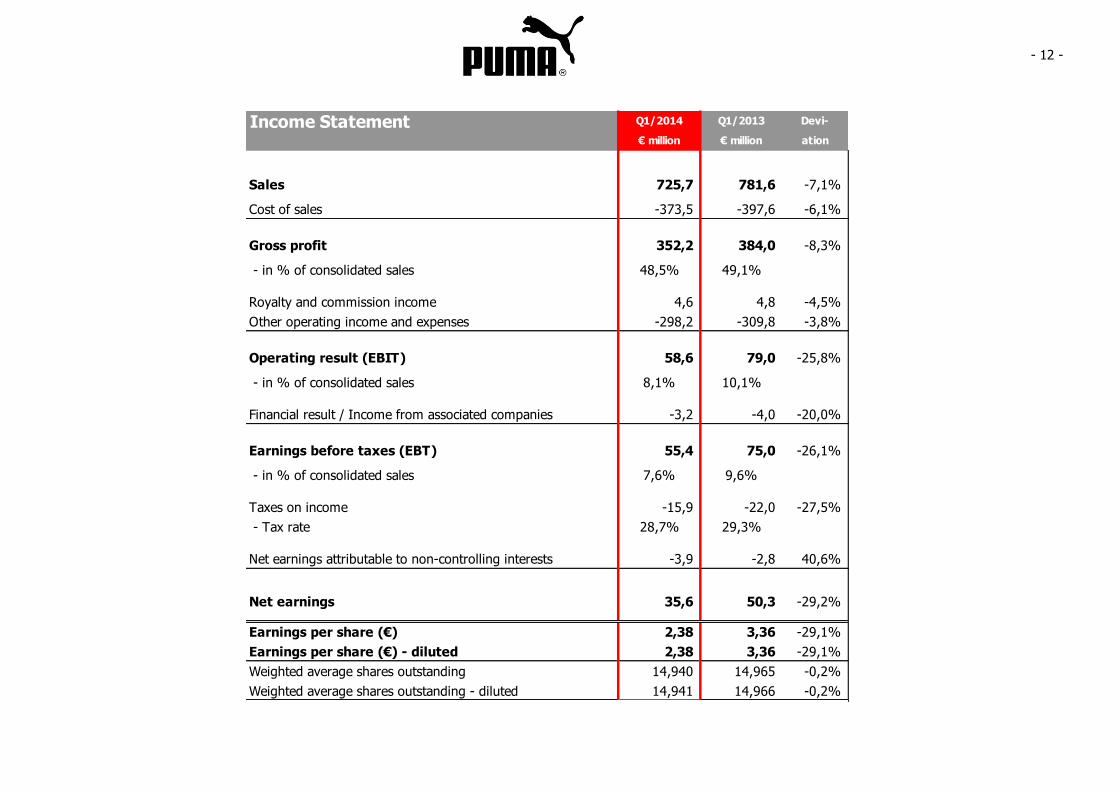
Income Statement Q1/2014 Q1/2013 Devi-
€ million € million ation
Sales 725,7 781,6 -7,1%
Cost of sales -373,5 -397,6 -6,1%
Gross profit 352,2 384,0 -8,3%
- in % of consolidated sales 48,5% 49,1%
Royalty and commission income 4,6 4,8 -4,5%
Other operating income and expenses -298,2 -309,8 -3,8%
Operating result (EBIT) 58,6 79,0 -25,8%
- in % of consolidated sales 8,1% 10,1%
Financial result / Income from associated companies -3,2 -4,0 -20,0%
Earnings before taxes (EBT) 55,4 75,0 -26,1%
- in % of consolidated sales 7,6% 9,6%
Taxes on income -15,9 -22,0 -27,5%
- Tax rate 28,7% 29,3%
Net earnings attributable to non-controlling interests -3,9 -2,8 40,6%
Net earnings 35,6 50,3 -29,2%
Earnings per share (€) 2,38 3,36 -29,1%
Earnings per share (€) - diluted 2,38 3,36 -29,1%
Weighted average shares outstanding 14,940 14,965 -0,2%
Weighted average shares outstanding - diluted 14,941 14,966 -0,2%
- 13 -
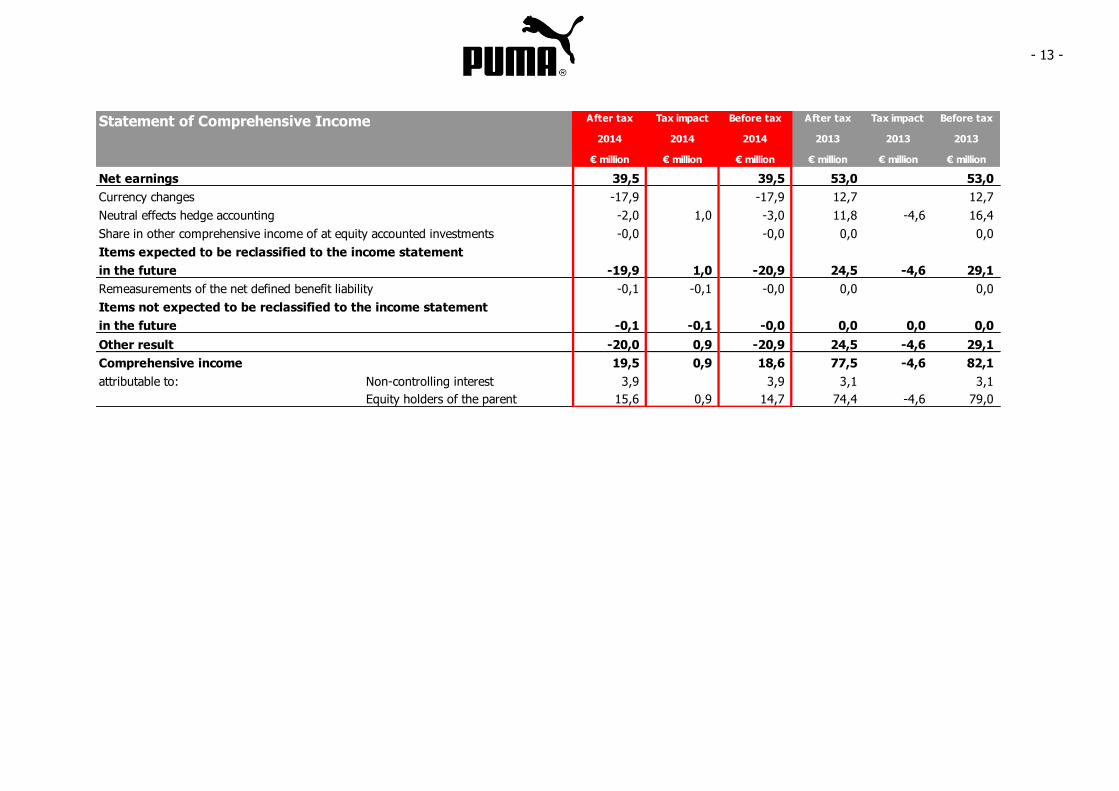
Statement of Comprehensive Income After tax Tax impact Before tax After tax Tax impact Before tax
2014 2014 2014 2013 2013 2013
€ million € million € million € million € million € million
Net earnings 39,5 39,5 53,0 53,0
Currency changes -17,9 -17,9 12,7 12,7
Neutral effects hedge accounting -2,0 1,0 -3,0 11,8 -4,6 16,4
Share in other comprehensive income of at equity accounted investments -0,0 -0,0 0,0 0,0
Items expected to be reclassified to the income statement
in the future -19,9 1,0 -20,9 24,5 -4,6 29,1
Remeasurements of the net defined benefit liability -0,1 -0,1 -0,0 0,0 0,0
Items not expected to be reclassified to the income statement
in the future -0,1 -0,1 -0,0 0,0 0,0 0,0
Other result -20,0 0,9 -20,9 24,5 -4,6 29,1
Comprehensive income 19,5 0,9 18,6 77,5 -4,6 82,1
attributable to: Non-controlling interest 3,9 3,9 3,1 3,1
Equity holders of the parent 15,6 0,9 14,7 74,4 -4,6 79,0
- 14 -
+
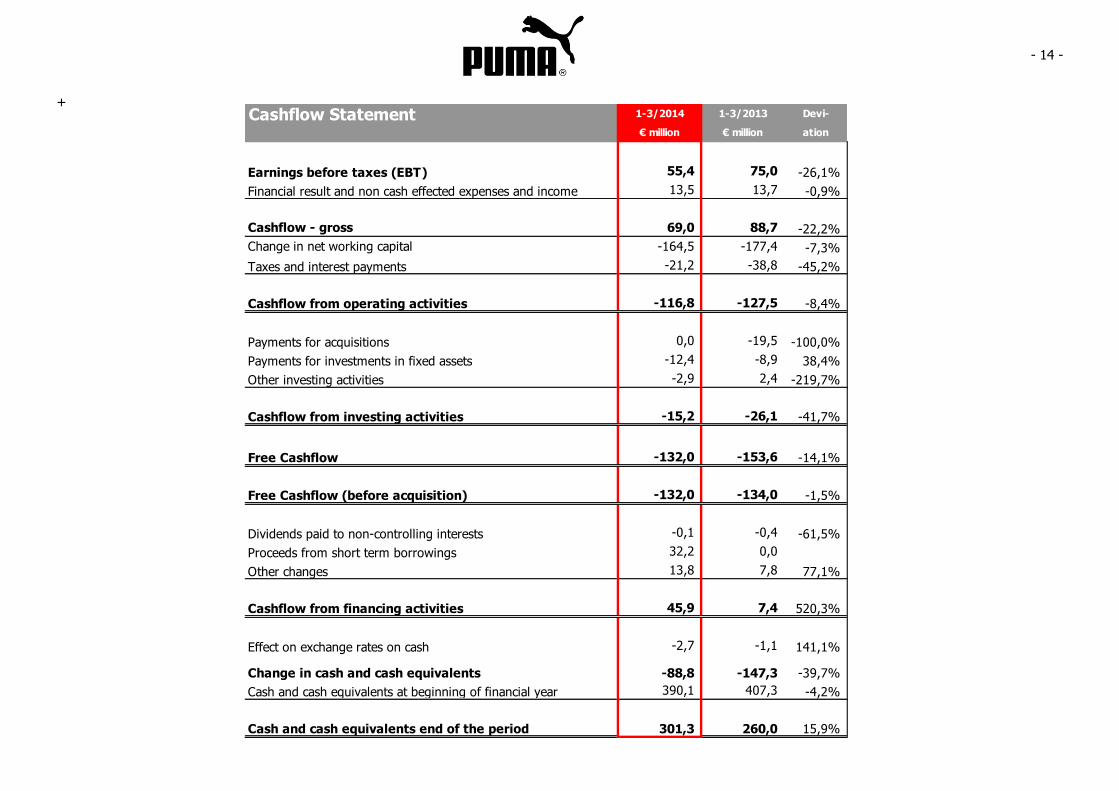
Cashflow Statement 1-3/2014 1-3/2013 Devi-
€ million € million ation
Earnings before taxes (EBT) 55,4 75,0 -26,1%
Financial result and non cash effected expenses and income 13,5 13,7 -0,9%
Cashflow - gross 69,0 88,7 -22,2%
Change in net working capital -164,5 -177,4 -7,3%
Taxes and interest payments -21,2 -38,8 -45,2%
Cashflow from operating activities -116,8 -127,5 -8,4%
Payments for acquisitions 0,0 -19,5 -100,0%
Payments for investments in fixed assets -12,4 -8,9 38,4%
Other investing activities -2,9 2,4 -219,7%
Cashflow from investing activities -15,2 -26,1 -41,7%
Free Cashflow -132,0 -153,6 -14,1%
Free Cashflow (before acquisition) -132,0 -134,0 -1,5%
Dividends paid to non-controlling interests -0,1 -0,4 -61,5%
Proceeds from short term borrowings 32,2 0,0
Other changes 13,8 7,8 77,1%
Cashflow from financing activities 45,9 7,4 520,3%
Effect on exchange rates on cash -2,7 -1,1 141,1%
Change in cash and cash equivalents -88,8 -147,3 -39,7%
Cash and cash equivalents at beginning of financial year 390,1 407,3 -4,2%
Cash and cash equivalents end of the period 301,3 260,0 15,9%
- 15 -
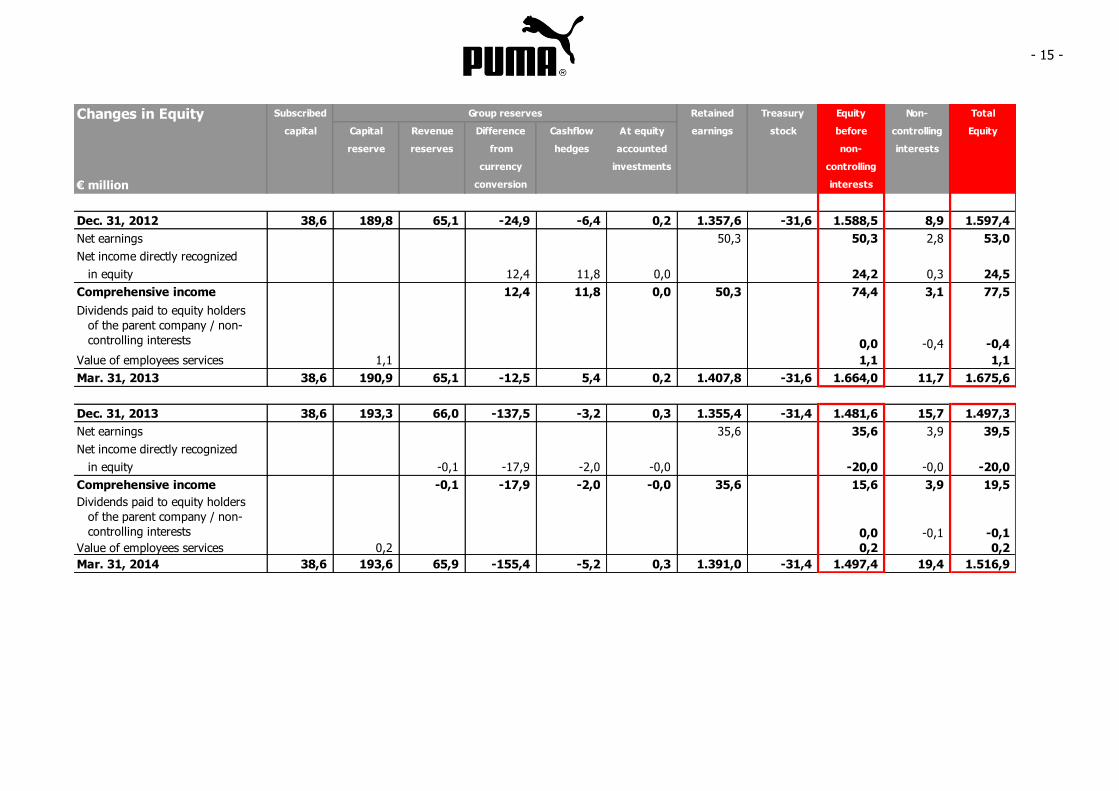
Changes in Equity Subscribed Retained Treasury Equity Non- Total
capital Capital Revenue Difference Cashflow At equity earnings stock before controlling Equity
reserve reserves from hedges accounted non- interests
currency investments controlling
€ million conversion interests
Dec. 31, 2012 38,6 189,8 65,1 -24,9 -6,4 0,2 1.357,6 -31,6 1.588,5 8,9 1.597,4
Net earnings 0,0 0,0 0,0 0,0 0,0 0,0 50,3 0,0 50,3 2,8 53,0
Net income directly recognized
in equity 0,0 0,0 0,0 12,4 11,8 0,0 0,0 0,0 24,2 0,3 24,5
Comprehensive income 0,0 0,0 0,0 12,4 11,8 0,0 50,3 0,0 74,4 3,1 77,5
0,0 -0,4 -0,4
Value of employees services 1,1 1,1 1,1
Mar. 31, 2013 38,6 190,9 65,1 -12,5 5,4 0,2 1.407,8 -31,6 1.664,0 11,7 1.675,6
Dec. 31, 2013 38,6 193,3 66,0 -137,5 -3,2 0,3 1.355,4 -31,4 1.481,6 15,7 1.497,3
Net earnings 0,0 0,0 0,0 0,0 0,0 0,0 35,6 0,0 35,6 3,9 39,5
Net income directly recognized
in equity 0,0 0,0 -0,1 -17,9 -2,0 -0,0 0,0 0,0 -20,0 -0,0 -20,0
Comprehensive income 0,0 0,0 -0,1 -17,9 -2,0 -0,0 35,6 0,0 15,6 3,9 19,5
0,0 -0,1 -0,1
Value of employees services 0,2 0,2 0,2
Mar. 31, 2014 38,6 193,6 65,9 -155,4 -5,2 0,3 1.391,0 -31,4 1.497,4 19,4 1.516,9
Group reserves
Dividends paid to equity holders
of the parent company / non-
controlling interests
Dividends paid to equity holders
of the parent company / non-
controlling interests
- 16 -
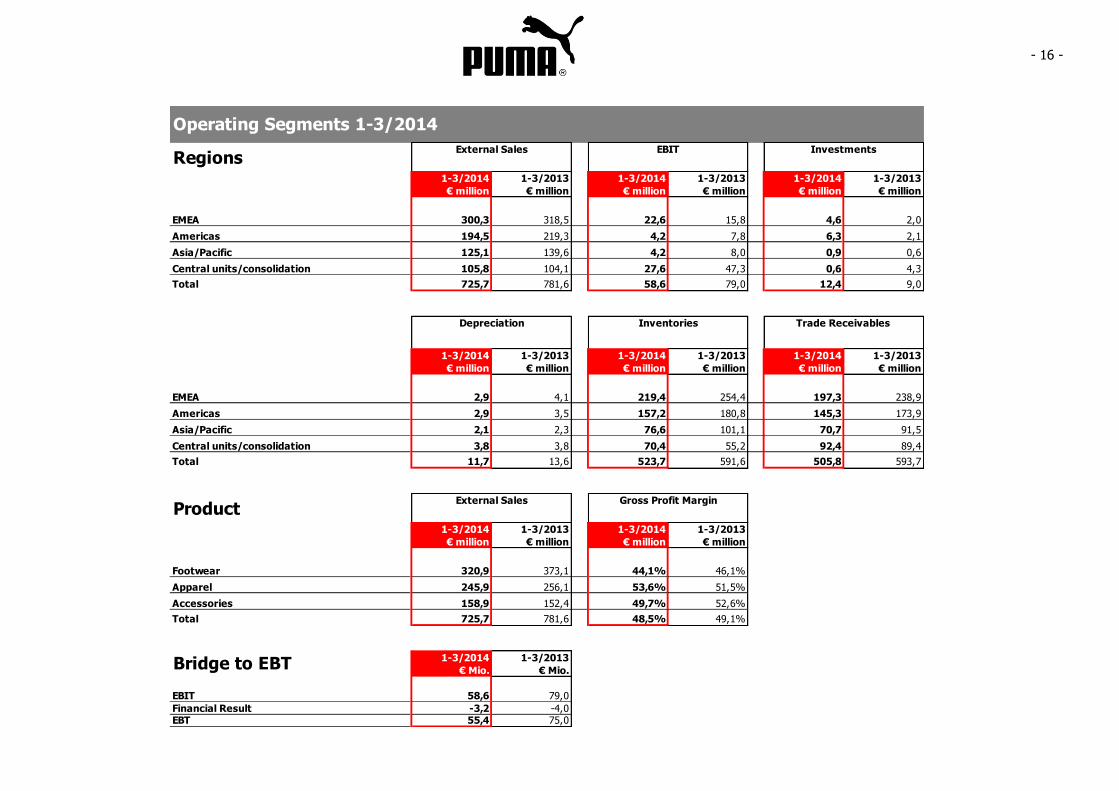
Operating Segments 1-3/2014
RegionsExternal Sales EBIT Investments
1-3/2014 1-3/2013 1-3/2014 1-3/2013 1-3/2014 1-3/2013
€ million € million € million € million € million € million
EMEA 300,3 318,5 22,6 15,8 4,6 2,0
Americas 194,5 219,3 4,2 7,8 6,3 2,1
Asia/Pacific 125,1 139,6 4,2 8,0 0,9 0,6
Central units/consolidation 105,8 104,1 27,6 47,3 0,6 4,3
Total 725,7 781,6 58,6 79,0 12,4 9,0
Depreciation Inventories Trade Receivables
1-3/2014 1-3/2013 1-3/2014 1-3/2013 1-3/2014 1-3/2013
€ million € million € million € million € million € million
EMEA 2,9 4,1 219,4 254,4 197,3 238,9
Americas 2,9 3,5 157,2 180,8 145,3 173,9
Asia/Pacific 2,1 2,3 76,6 101,1 70,7 91,5
Central units/consolidation 3,8 3,8 70,4 55,2 92,4 89,4
Total 11,7 13,6 523,7 591,6 505,8 593,7
ProductExternal Sales Gross Profit Margin
1-3/2014 1-3/2013 1-3/2014 1-3/2013
€ million € million € million € million
Footwear 320,9 373,1 44,1% 46,1%
Apparel 245,9 256,1 53,6% 51,5%
Accessories 158,9 152,4 49,7% 52,6%
Total 725,7 781,6 48,5% 49,1%
1-3/2014 1-3/2013
€ Mio. € Mio.
EBIT 58,6 79,0
Financial Result -3,2 -4,0EBT 55,4 75,0
Bridge to EBT
- 17 -
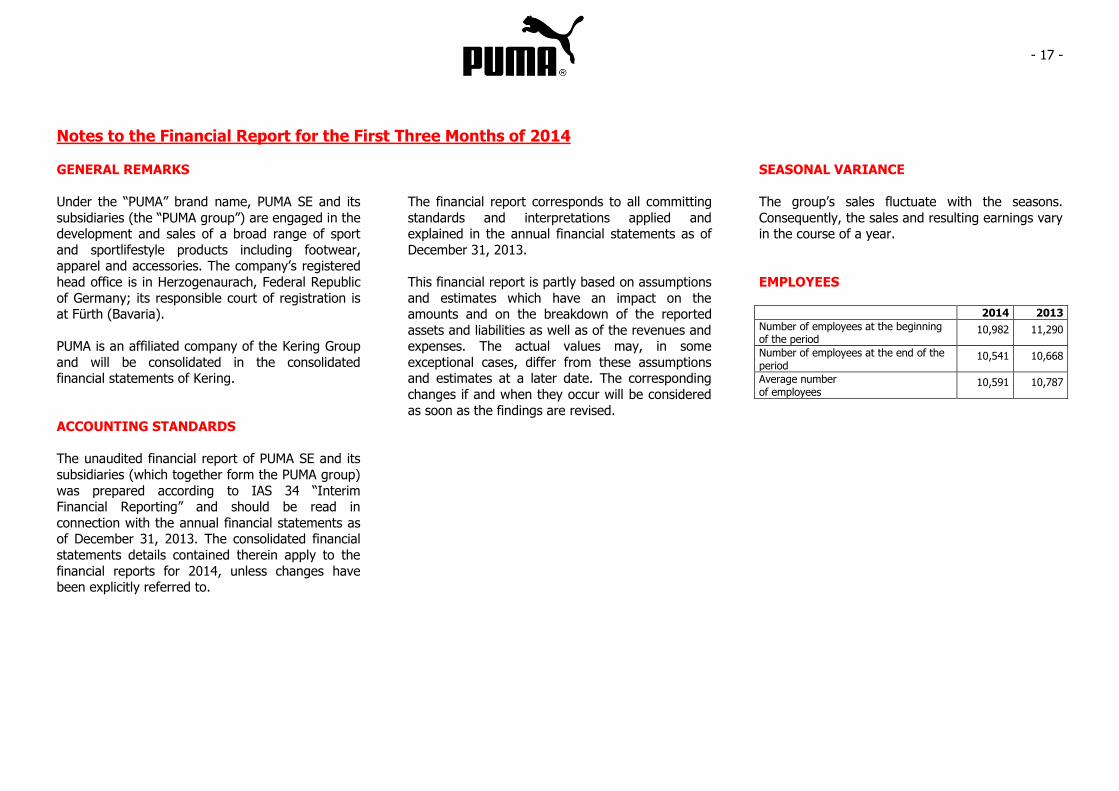
Notes to the Financial Report for the First Three Months of 2014
GENERAL REMARKS
Under the “PUMA” brand name, PUMA SE and its
subsidiaries (the “PUMA group”) are engaged in the development and sales of a broad range of sport
and sportlifestyle products including footwear, apparel and accessories. The company‟s registered
head office is in Herzogenaurach, Federal Republic
of Germany; its responsible court of registration is at Fürth (Bavaria).
PUMA is an affiliated company of the Kering Group
and will be consolidated in the consolidated financial statements of Kering.
ACCOUNTING STANDARDS
The unaudited financial report of PUMA SE and its
subsidiaries (which together form the PUMA group)
was prepared according to IAS 34 “Interim Financial Reporting” and should be read in
connection with the annual financial statements as of December 31, 2013. The consolidated financial
statements details contained therein apply to the
financial reports for 2014, unless changes have been explicitly referred to.
The financial report corresponds to all committing
standards and interpretations applied and explained in the annual financial statements as of
December 31, 2013.
This financial report is partly based on assumptions
and estimates which have an impact on the amounts and on the breakdown of the reported
assets and liabilities as well as of the revenues and expenses. The actual values may, in some
exceptional cases, differ from these assumptions and estimates at a later date. The corresponding
changes if and when they occur will be considered
as soon as the findings are revised.
SEASONAL VARIANCE
The group‟s sales fluctuate with the seasons.
Consequently, the sales and resulting earnings vary in the course of a year.
EMPLOYEES
2014 2013
Number of employees at the beginning of the period
10,982 11,290
Number of employees at the end of the period
10,541 10,668
Average number of employees
10,591 10,787
- 18 -
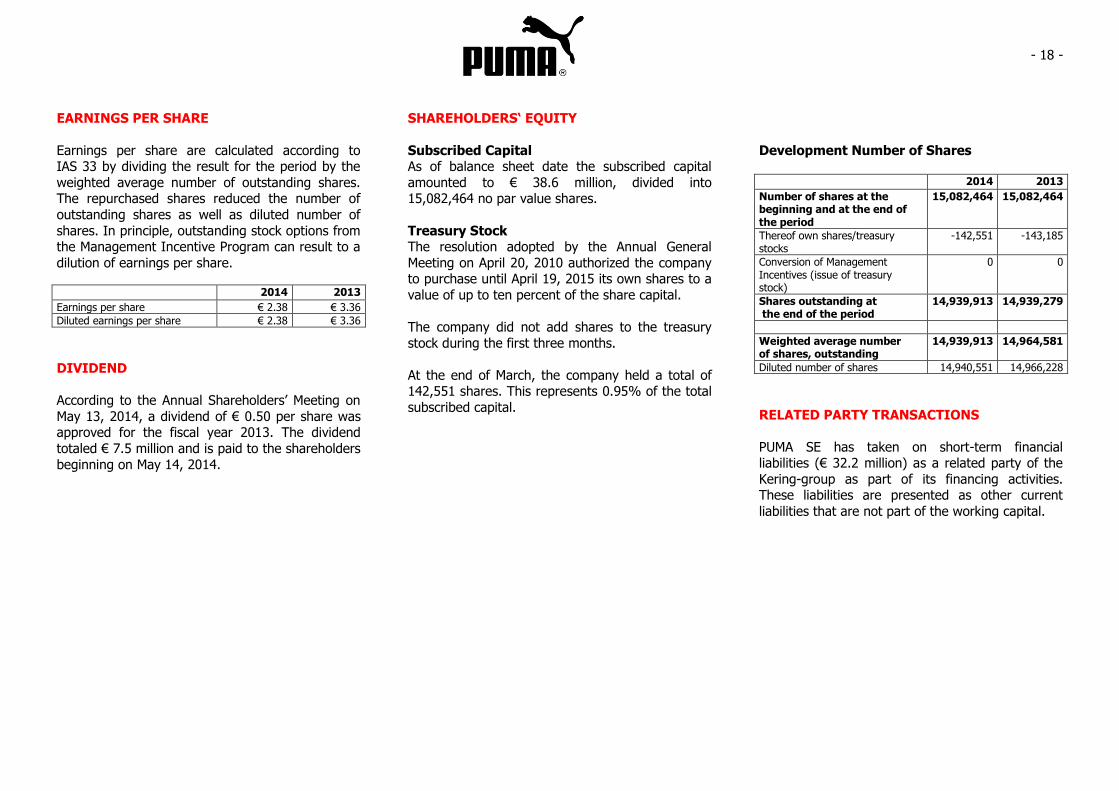
EARNINGS PER SHARE
Earnings per share are calculated according to IAS 33 by dividing the result for the period by the
weighted average number of outstanding shares. The repurchased shares reduced the number of
outstanding shares as well as diluted number of
shares. In principle, outstanding stock options from the Management Incentive Program can result to a
dilution of earnings per share.
2014 2013
Earnings per share € 2.38 € 3.36
Diluted earnings per share € 2.38 € 3.36
DIVIDEND
According to the Annual Shareholders‟ Meeting on
May 13, 2014, a dividend of € 0.50 per share was approved for the fiscal year 2013. The dividend
totaled € 7.5 million and is paid to the shareholders
beginning on May 14, 2014.
SHAREHOLDERS‘ EQUITY
Subscribed Capital As of balance sheet date the subscribed capital
amounted to € 38.6 million, divided into 15,082,464 no par value shares.
Treasury Stock The resolution adopted by the Annual General
Meeting on April 20, 2010 authorized the company to purchase until April 19, 2015 its own shares to a
value of up to ten percent of the share capital.
The company did not add shares to the treasury
stock during the first three months.
At the end of March, the company held a total of 142,551 shares. This represents 0.95% of the total
subscribed capital.
Development Number of Shares 2014 2013
Number of shares at the beginning and at the end of the period
15,082,464 15,082,464
Thereof own shares/treasury stocks
-142,551 -143,185
Conversion of Management Incentives (issue of treasury stock)
0 0
Shares outstanding at the end of the period
14,939,913 14,939,279
Weighted average number of shares, outstanding
14,939,913 14,964,581
Diluted number of shares 14,940,551 14,966,228
RELATED PARTY TRANSACTIONS
PUMA SE has taken on short-term financial liabilities (€ 32.2 million) as a related party of the
Kering-group as part of its financing activities. These liabilities are presented as other current
liabilities that are not part of the working capital.
- 19 -
SEGMENT REPORTING
Segment reporting is based on geographical regions in accordance with the internal reporting
structure. Sales and gross profit are shown according to the geographical region where the
respective group company is located (head office).
Intra-group sales are eliminated. Allocation of the remaining segment information is also determined
on the basis of the respective group company‟s head office. The sum totals equal the amounts on
the income statement or on the balance sheet, respectively.
EVENTS AFTER THE BALANCE SHEET DATE
There were no events after the balance sheet date which may have a material effect on the financial
situation and earnings position as of March 31, 2014.
Herzogenaurach, May 14, 2014
The Managing Directors
- 20 -
Managing Directors Bjoern Gulden
(CEO, Chief Executive Officer)
Stefano Caroti
(CCO, Chief Commercial Officer)
Michael Laemmermann (CFO, Chief Financial Officer)
Andy Koehler (COO, Chief Operating Officer)
Administrative Board Jean-François Palus
(Chairman)
François-Henri Pinault
(Deputy Chairman)
Thore Ohlsson
Todd Hymel
Michel Friocourt
Jean-Marc Duplaix
Bernd Illig Employees„ Representative
Martin Koeppel
Employees„ Representative
Guy Buzzard
Employees„ Representative
- 21 -
Financial Calendar FY 2014
February 20, 2014 Financial Results FY 2013
May 13, 2014 Annual Shareholders‟ Meeting
May 14, 2014 Financial Results Q1/2014
July 29, 2014 Financial Results Q2/2014
November 7, 2014 Financial Results Q3/2014
The financial releases and other financial information are available on the Internet at „about.puma.com“.
Published by PUMA SE PUMA Way 1 D-91074 Herzogenaurach Tel.: +49 (0)9132 81-0 email: [email protected] Internet: http://www.puma.com
Notes relating to forward-looking statements:
This document contains forward-looking information about the Company‟s financial status and strategic initiatives. Such information is subject to a certain level of risk and uncertainty that could cause the Company's actual results to differ significantly from the information discussed in this document. The forward-looking information is based on the current expectations and prognosis of the management team. Therefore, this document is further subject to the risk that such expectations or prognosis, or the premise of such underlying expectations or prognosis, become erroneous. Circumstances that could alter the Company's actual results and procure such results to differ significantly from those contained in forward-looking statements made by or on behalf of the Company include, but are not limited to those discussed be above.
PUMA PUMA is one of the world‟s leading Sports Brands, designing, developing, selling and marketing footwear, apparel and accessories. For over 65 years, PUMA has established a history of making fast product designs for the fastest athletes on the planet. PUMA offers performance and sport-inspired lifestyle products in categories such as Football, Running, Training and Fitness, Golf, and Motorsports. It engages in exciting collaborations with renowned design brands such as Alexander McQueen and Mihara Yasuhiro to bring innovative and fast designs to the sports world. The PUMA Group owns the brands PUMA, Cobra Golf, Tretorn, Dobotex and Brandon. The company distributes its products in more than 120 countries, employs more than 10,000 people worldwide, and is headquartered in Herzogenaurach/Germany. For more information, please visit http://www.puma.com