Embed Size (px)
Citation preview

PUMA SE
FINANCIAL REPORT
January – March of 2015

- 2 -
CONTENT
Key Figures 3
Interim Management Report
- General Economic Conditions 4
- Strategy 4 - 5
- Sales and Earnings Development 6 - 8
- Net Assets and Financial Position 9
- Outlook 10
Interim Consolidated Financial Statements
- Balance Sheet 11
- Income Statement 12
- Statement of Comprehensive Income 13
- Cashflow Statement 14
- Changes in Equity 15
- Operating Segments 16
- Notes to the Financial Report 17 – 19
Managing Directors / Administrative Board 20
Financial Calendar 21
Apr May June July Aug Sep Oct Nov Dec Jan Feb Mar

- 3 -
811
856
821
764
850
2011 2012 2013 2014 2015
BRAND SALES Jan. - Mar. (€ million)
773
821
782
726
821
2011 2012 2013 2014 2015
CONSOLIDATED SALES Jan. - Mar. (€ million)
5,17 4,92
3,36
2,38 1,66
2011 2012 2013 2014 2015
EARNINGS PER SHARE Jan. - Mar. (€)
Key Figures 1-3/2015 1-3/2014 Devi-
€ million € million ation
Brand Sales 849,6 763,7 11,2%
Consolidated net sales 821,4 725,7 13,2%
Gross profit in % 46,9% 48,5%
Operating result 37,5 58,6 -36,0%
Net earnings 24,8 35,6 -30,3%
- in % 3,0% 4,9%
Total assets 2.773,7 2.310,3 20,1%
Equity ratio in % 62,6% 65,7%
Working capital 744,7 673,5 10,6%
Cashflow - gross 55,9 69,0 -19,0%
Free cashflow (before acquisitions) -232,7 -132,0 76,4%
Earnings per share (in €) 1,66 2,38 -30,3%
Cashflow - gross per share (in €) 3,74 4,62 -19,0%
Free cashflow per share (in €) (before acquisitions) -15,58 -8,83 76,4%
Share price at end of the period 172,70 204,25 -15,4%
Market capitalization at end of the period 2.580 3.052 -15,5%
Investments in tangible and intangible assets (excluding goodwill) 15,6 12,4 26,5%
Bjørn Gulden, CEO:
“PUMA´s first quarter sales grew slightly stronger
than expected. This was mainly caused by a very positive development in footwear. We are working
very hard to improve our product offer, and although we know we have some ways to go, we
feel that this growth in footwear confirms that we
are on the right path. The negative development in currencies, had a significant negative impact on our
gross profit margin and operational expenses and therefore also on our EBIT and net earnings. We
do work hard to „counter“ these negative currency effects, but do currently not have enough leverage
to fully neutralize the impact and have therefore
adjusted our outlook for the full year EBIT and net earnings. We will continue our strategy to become
the Fastest Sports Brand in the World and will continue to invest in Product, Marketing, Retail and
IT to lay the foundation for solid profitable growth
in the future.”

- 4 -
Interim Management Report
GENERAL ECONOMIC CONDITIONS
The spring forecast published on March 11, 2015 by the Kiel World Economic Institute indicates that
world economy has moderately picked up since the
middle of 2014. Despite a steep fall in oil prices and substantial changes in the exchange rates of
major currencies, the world economy has more or less evolved as expected. The divergences of
economic growth between countries have recently
decreased and economic momentum has accelerated during the year. Economic growth in
emerging markets remained muted and advanced economies showed a moderate acceleration.
STRATEGY
We have made further progress towards becoming the Fastest Sports Brand in the World. We have
launched successful products for this year’s Spring
Summer season, including our new IGNITE running technology. Over the coming seasons we will
continue to develop the IGNITE platform with innovations, material updates and product launches
supported by dedicated media activities.
We have said that we would enhance our product communication, telling better and simpler stories to
the consumers and utilize our assets. This promise
is reflected in our ongoing marketing campaign “Forever Faster”. The current theme is more
product-focused and features Usain Bolt running in the IGNITE as well as star-footballers including
Mario Balotelli and Cesc Fàbregas in action with our
latest football boot innovation evoPOWER.
Our new multi-year partnership with Rihanna has already generated a lot of positive PR and social
media buzz. Rihanna is an ideal brand ambassador, thanks to both her personality and iconic style. She
is currently featured in an in-store marketing
campaign promoting PUMA’s key training styles of the season. In August, Rihanna will also play a key
role in the brand campaign Forever Faster, featured along PUMA’s world-class athletes such as
Usain Bolt and Sergio Aguero. Later she will be the
Creative Director for her own line of training & lifestyle products.
In terms of improving the quality of our
distribution, our sales organizations are working
hard to intensify our relationships with key strategic accounts as well as building new
partnerships with strong retailers in both established and emerging markets.
Amongst others we have continued our collaboration with Foot Locker and opened the first
European PUMA Lab at the Foot Locker store in
Milan in February. We have also added new locations to their US portfolio in Philadelphia and
Atlanta.
As for PUMA’s own retail, we have developed a
new instore concept which will ensure that our PUMA stores better tell our product stories, reveal
the technologies behind them and strengthen PUMA’s positioning as a sports brand. Last month,
we started the global roll-out with our PUMA store in Herzogenaurach. It will continue to be
implemented in our stores world-wide, with the
shops in Hong Kong and Mexico City being next in line. Continuing our efforts to improve and expand
our online presence, we have expanded the selection of our eCommerce website to include our
more exclusive PUMA Select products as of May.
We continue to work on simplifying our
organizational structure and setup. In Indonesia we have transitioned from a distributor to a new
subsidiary which will improve our presence in this
important market.

- 5 -
In terms of our IT enhancement, we continue to
work on our focus areas including standardized ERP systems, overall IT infrastructure and also
tools to enable more efficient design and planning
processes. These investments are essential in order to achieve our vision of becoming the Fastest
Sports Brand in the World. We will continue to drive our growth strategy forward with better, and
faster collections, continued investments into our brand, our organization, our distribution and our IT
infrastructure.
BRAND
Following the launch of our latest running
innovation PUMA IGNITE by the World’s Fastest Man Usain Bolt on New York City’s Times Square,
the sell-through of this innovative footwear technology has been off to a good start both in
retail and wholesale. The innovative IGNITE foam technology offers the highest energy return in the
industry and strongly represents our new “Forever
Faster” positioning.
In order to further strengthen our dominant
position in Motorsport, we recently announced a new long-term Formula 1 partnership with
INFINITI RED BULL RACING. Effective 1 January
2016, we will be the official, licensed supplier of team and race wear. In addition, we will
exclusively produce and distribute INFINITI RED BULL RACING licensed replica, fanwear and
lifestyle collections for global distribution. We will also prominently feature INFINITI RED BULL
RACING in our brand and motorsport marketing
campaigns in 2016 and beyond.
Our partnership with Red Bull will span beyond Formula 1 racing. We have also signed a new
multi-year partnership with the “Wings for Life
World Run”, which was co-founded by Red Bull founder Dietrich Mateschitz to fund scientific
research for spinal cord injuries. This will serve as a platform to promote our IGNITE running and
CELL apparel technology. As the exclusive official sportswear partner, event staff and athletes
participating in the Wings for Life World Run
sported PUMA footwear, apparel and accessories. 100% of all starting fees and donations will go
directly to spinal cord research.
Our Teamsport category saw the extension of one
of PUMA’s longest-standing and most successful partnerships in Football: through our new long-
term contract with the Italian Football Federation
(FIGC), PUMA has increased its marketing rights as well as retained the exclusive Master License to
actively manage the entire global licensing portfolio of the Federation. PUMA, who first became partner
of “Gli Azzurri” in 2003, will also continue as the official technical supplier to all associated FIGC
teams.
In March, PUMA won the “2014 Marketing Leader
Award” from Foot Locker Europe. The award has recognized PUMA’s “Forever Faster” marketing
campaign, which was launched in Autumn/Winter
2014 and the growth of brand awareness through the effective use of advertising, public relations
and event marketing. This underlines the impact of our “Forever Faster” campaign and the close
collaboration with our retail partners.
- 6 -
726 652
843 751
821
Q1 Q2 Q3 Q4
CONSOLIDATED SALES (€ million)
159
246
321
163
280
378
Accessories Apparel Footwear
CONSOLIDATED SALES Jan. - Mar. (€ million)
153
235
337
191
289 342
Asia/Pacific Americas EMEA
SALES BY REGION Jan. - Mar. (€ million)
Sales and Earnings Development
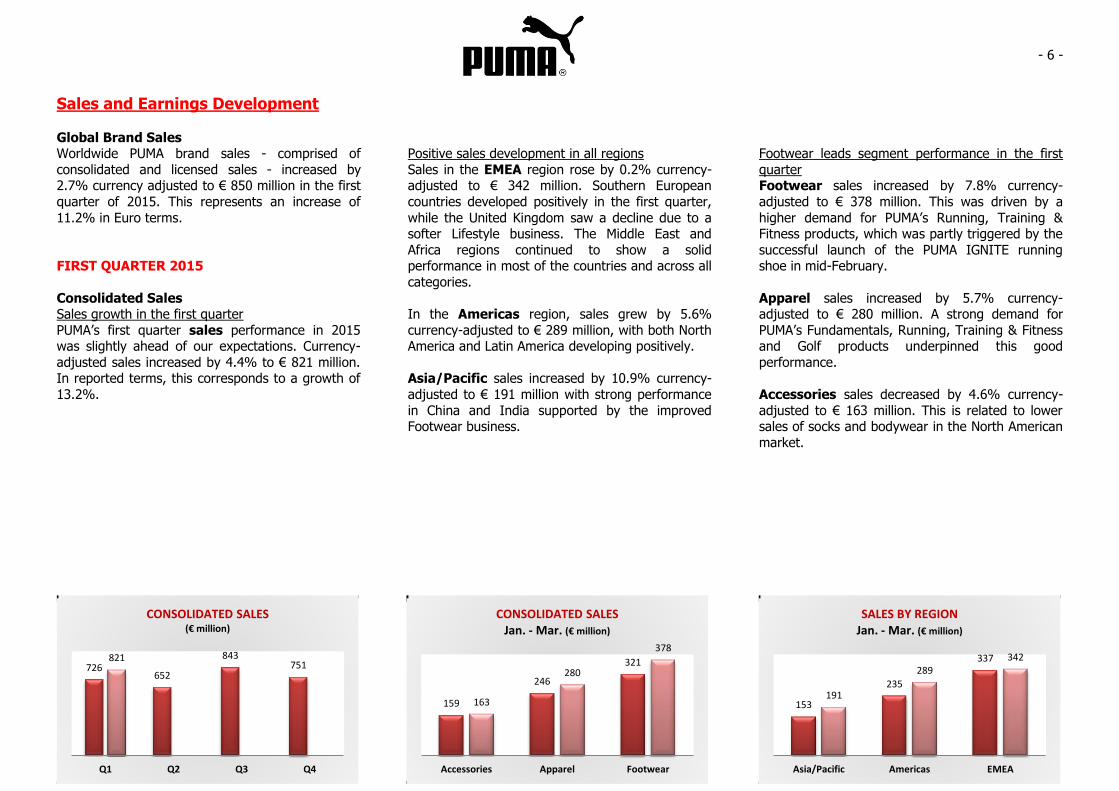
Global Brand Sales Worldwide PUMA brand sales - comprised of
consolidated and licensed sales - increased by 2.7% currency adjusted to € 850 million in the first
quarter of 2015. This represents an increase of
11.2% in Euro terms.
FIRST QUARTER 2015
Consolidated Sales Sales growth in the first quarter
PUMA’s first quarter sales performance in 2015 was slightly ahead of our expectations. Currency-
adjusted sales increased by 4.4% to € 821 million. In reported terms, this corresponds to a growth of
13.2%.
Positive sales development in all regions
Sales in the EMEA region rose by 0.2% currency-adjusted to € 342 million. Southern European
countries developed positively in the first quarter,
while the United Kingdom saw a decline due to a softer Lifestyle business. The Middle East and
Africa regions continued to show a solid performance in most of the countries and across all
categories.
In the Americas region, sales grew by 5.6%
currency-adjusted to € 289 million, with both North America and Latin America developing positively.
Asia/Pacific sales increased by 10.9% currency-
adjusted to € 191 million with strong performance
in China and India supported by the improved Footwear business.
Footwear leads segment performance in the first
quarter Footwear sales increased by 7.8% currency-
adjusted to € 378 million. This was driven by a
higher demand for PUMA’s Running, Training & Fitness products, which was partly triggered by the
successful launch of the PUMA IGNITE running shoe in mid-February.
Apparel sales increased by 5.7% currency-adjusted to € 280 million. A strong demand for
PUMA’s Fundamentals, Running, Training & Fitness and Golf products underpinned this good
performance.
Accessories sales decreased by 4.6% currency-
adjusted to € 163 million. This is related to lower sales of socks and bodywear in the North American
market.

- 7 -
Sales by regions and product segments
€ million 2015 2014 Eurocurrency
adjusted
Breakdown by regions
EMEA 341,6 337,3 1,3% 0,2%
Americas 289,0 235,2 22,9% 5,6%
Asia/Pacific 190,8 153,3 24,5% 10,9%
Total 821,4 725,7 13,2% 4,4%
Breakdown by product segments
Footwear 378,1 320,9 17,8% 7,8%
Apparel 279,8 245,9 13,8% 5,7%
Accessories 163,4 158,9 2,8% -4,6%
Total 821,4 725,7 13,2% 4,4%
Q1 growth rates

- 8 -
48,5%
46,7% 46,3%
45,0%
46,9%
Q1 Q2 Q3 Q4
GROSS PROFIT MARGIN (in %)
59
13
46
11
38
Q1 Q2 Q3 Q4
EBIT (€ million)
2,38
0,28
1,93
-0,30
1,66
Q1 Q2 Q3 Q4
EARNINGS PER SHARE (€)
Satisfying retail performance PUMA’s first quarter Retail sales increased by
7.3% on a currency-adjusted basis to € 144 million, with comparable sales in full-price stores and
outlets slightly up. PUMA also operated a higher
number of stores. Retail sales represented 17.5% of total sales compared to 17.1% last year.
Gross Profit Margin
Negative currency impacts affect gross profit margin
PUMA’s gross profit margin declined from 48.5%
to 46.9% in the first quarter, solely due to negative currency impacts. The strength of the US Dollar
compared to major “unhedged” and not fully hedged currencies including Russian Ruble,
Mexican Peso, Brazilian Real, Turkish Lira and
Argentinean Peso led to this decrease. The Footwear gross profit margin declined from 44.1%
to 42.9%. Apparel decreased from 53.6% to 50.7%, and Accessories remained at previous
year’s level of 49.6% (Q1 2014: 49.7%). In absolute figures, gross profit increased by 9.3% in
reported terms from € 352 million to € 385 million.
Operating Expenses
Higher OPEX in line with expectations As communicated previously, PUMA continued to
invest in the “Forever Faster” marketing campaign in the first quarter 2015. There was no major
campaign in the first quarter in 2014. In addition,
we have started to invest in our IT infrastructure and we continued with our retail strategy to open
additional retail stores, mainly in emerging markets. As with the gross profit margin, OPEX was
heavily impacted by the unfavorable currency developments. As a consequence, PUMA’s OPEX
increased by 17.7% to € 351 million. PUMA’s
management continues to put a strong emphasis on strict control of other operating costs. In
constant currencies, the increase in OPEX amounts to 9.5%.
EBIT Operating result (EBIT) declines
Despite the sales growth in the first quarter 2015, the lower gross profit margin and increased
operating expenditures both impacted by negative currency developments led to a decrease of PUMA’s
operating result (EBIT) from € 59 million to
€ 38 million. The EBIT ratio decreased from 8.1% to 4.6%.
Financial Result / Income from Associated
Companies Financial result improves
The financial result improved from € -3.2 million to € 0.9 million in the first quarter. The result
turned positive due to currency conversion impacts.
Net Earnings
Net earnings decrease PUMA’s consolidated net earnings declined by
30.3% from € 36 million to € 25 million. As a result, earnings per share decreased from € 2.38
to € 1.66 in the first quarter of the year.

- 9 -
Net Assets and Financial Position
Working Capital
Working capital rose in line with sales Inventories increased by 23.7% (11.9% currency
adjusted) to € 648 million due to earlier deliveries
in order to better service our key strategic accounts. Trade receivables increased by 17.9%
(6.2% currency adjusted) to € 596 million compared to 31 March 2014, which was driven by
higher sales. Trade payables were similarly
affected by currency exchange rates and increased by 36.7% to € 467 million. As a result, PUMA’s
working capital rose by 10.6% from € 674 million to € 745 million at the end of March 2015.
Cashflow / Capex
The free cashflow before acquisitions declined to € -233 million mainly due to lower cashflows
from operating activities as a result of the
increased working capital.
Capex increased from € 12 million to € 16 million, which was mainly invested in the opening of
selected retail stores as well as IT equipment.
Cash Position
Stable cash position PUMA’s cash and cash equivalents position at
€ 295 million as of 31 March 2015 remained
broadly stable at last year’s level of € 301 million.

- 10 -
Outlook 2015
Global Economy
The spring forecast published on March 11, 2015 by the Kiel World Economic Institute expects world
economic growth to accelerate in 2015 and 2016.
Economic momentum is forecast to pick up mainly in the advanced economies that benefit from
monetary stimuli, lower oil prices and debt reduction in the private sector. The emerging
economies stand to benefit from a stronger
demand of the advanced economies, but structural problems in combination with lower commodity
prices weigh on the outlook. Global gross domestic product is expected to accelerate from 3.5 percent
last year to 3.7 and 4.0 percent in 2015 and 2016 respectively. Compared to the winter forecast this
represents a slightly increased projection for 2014
and 2016 (both cases plus 0.1 percent) as well as an unchanged outlook for 2015.
Investments
Investments totaling around € 75 million are
planned for 2015. The majority of these funds have been allocated to infrastructure investments which
are necessary to help drive the sustainable growth, as well as the expansion of our core markets and
selective investments in retail stores.
Outlook 2015
In 2015, PUMA will continue its strong marketing investments to further enhance and reinforce our
brand positioning, making a further step in getting
PUMA back on a path of more profitable and sustainable growth.
After the positive sales development in the first
quarter 2015, we continue to expect an increase in
the medium single-digit range for full-year currency-adjusted net sales.
However, as already indicated in the outlook for
2015 at the beginning of this year, the continued adverse developments of foreign exchange rates
during the recent months, particularly the
strengthening of the US Dollar versus nearly all other currencies, had a significant negative impact
on PUMA’s reported gross profit margin. PUMA has already taken and will continue to take
countermeasures, but the impact will not fully
offset the negative currency impact on the gross profit margin. As a consequence, we now foresee a
drop in the gross profit margin for the full year in a range of 100 to 150 basis points versus last year
(2014: 46.6%).
As announced at the beginning of this year, we will continue to invest strongly in marketing, in the
upgrade of PUMA’s current IT infrastructure and
the extension of our own retail store network. This will result in an increase in OPEX, that will be
further exacerbated by negative currency impacts. At the same time, PUMA’s management will
continue to put a strong emphasis on strict control
of other operating costs.
As a consequence of the now expected drop in gross profit margin and adverse currency effects on
OPEX, we now expect EBIT for the full year to come in at a range between € 80 million and € 100
million. Net earnings will be impacted accordingly.

- 11 -
Balance Sheet Mar. 31,'15 Mar. 31,'14 Devi- Dec. 31,'14
€ million € million ation € million
ASSETS
Cash and cash equivalents 295,0 301,3 -2,1% 401,5
Inventories 648,0 523,7 23,7% 571,5
Trade receivables 596,4 505,8 17,9% 449,2
Other current assets (Working Capital related) 200,3 182,5 9,8% 202,4
Other current assets 104,5 4,4 2267,9% 58,0
Current assets 1.844,2 1.517,6 21,5% 1.682,5
Deferred taxes 195,4 161,1 21,3% 178,8
Other non-current assets 734,0 631,5 16,2% 688,7
Non-current assets 929,5 792,6 17,3% 867,5
Total Assets 2.773,7 2.310,3 20,1% 2.549,9
LIABILITIES AND SHAREHOLDERS' EQUITY
Current financial liabilities 59,9 39,7 50,8% 19,8
Trade payables 466,7 341,5 36,7% 515,2
Other current liabilities (Working Capital related) 233,2 196,9 18,4% 252,1
Other current liabilities 151,6 98,9 53,4% 35,5
Current liabilities 911,5 677,0 34,6% 822,6
Deferred taxes 69,8 48,4 44,3% 54,6
Pension provisions 27,0 28,1 -3,9% 26,0
Other non-current liabilities 28,1 39,8 -29,5% 28,4
Non-current liabilities 124,9 116,4 7,3% 109,0
Shareholders' Equity 1.737,2 1.516,9 14,5% 1.618,3
Total Liabilities and Shareholders' Equity 2.773,7 2.310,3 20,1% 2.549,9
- 12 -
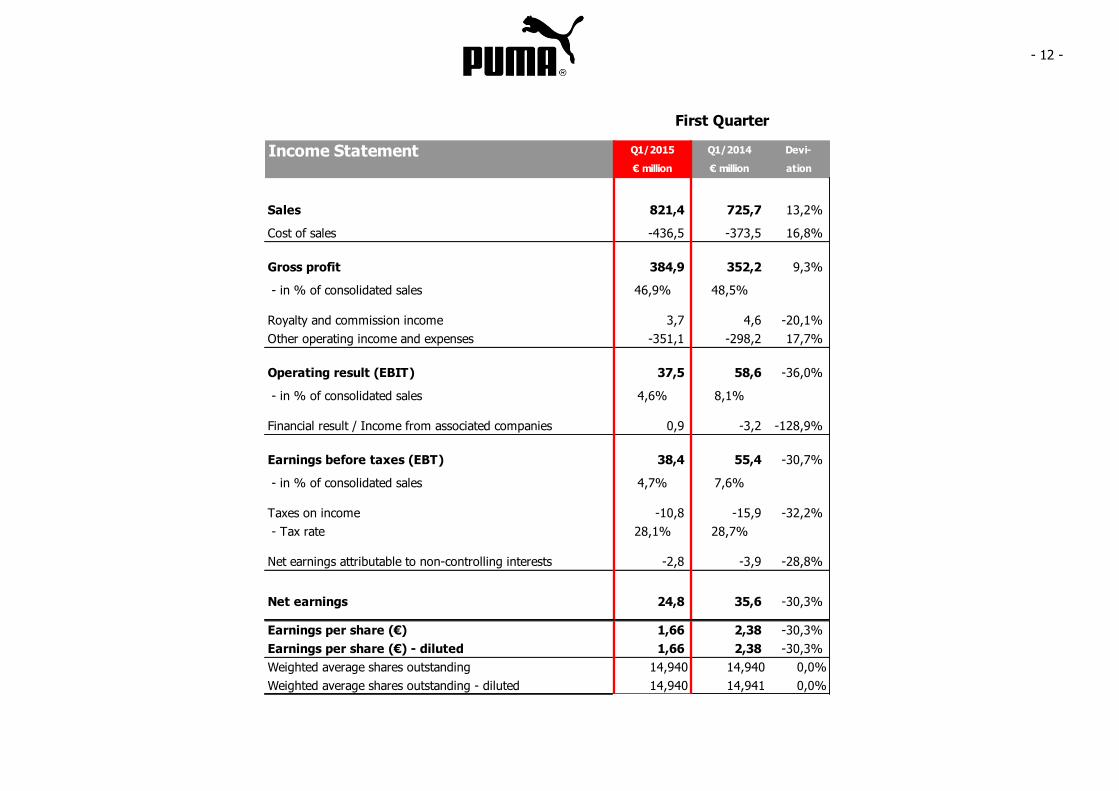
Income Statement Q1/2015 Q1/2014 Devi-
€ million € million ation
Sales 821,4 725,7 13,2%
Cost of sales -436,5 -373,5 16,8%
Gross profit 384,9 352,2 9,3%
- in % of consolidated sales 46,9% 48,5%
Royalty and commission income 3,7 4,6 -20,1%
Other operating income and expenses -351,1 -298,2 17,7%
Operating result (EBIT) 37,5 58,6 -36,0%
- in % of consolidated sales 4,6% 8,1%
Financial result / Income from associated companies 0,9 -3,2 -128,9%
Earnings before taxes (EBT) 38,4 55,4 -30,7%
- in % of consolidated sales 4,7% 7,6%
Taxes on income -10,8 -15,9 -32,2%
- Tax rate 28,1% 28,7%
Net earnings attributable to non-controlling interests -2,8 -3,9 -28,8%
Net earnings 24,8 35,6 -30,3%
Earnings per share (€) 1,66 2,38 -30,3%
Earnings per share (€) - diluted 1,66 2,38 -30,3%
Weighted average shares outstanding 14,940 14,940 0,0%
Weighted average shares outstanding - diluted 14,940 14,941 0,0%
First Quarter

- 13 -
Statement of Comprehensive Income After tax Tax impact Before tax After tax Tax impact Before tax
2015 2015 2015 2014 2014 2014
€ million € million € million € million € million € million
Net earnings 27,6 27,6 39,5 39,5
Currency changes 94,4 94,4 -17,9 -17,9
Neutral effects hedge accounting 14,7 -4,9 19,6 -2,0 1,0 -3,0
Neutral effects available-for-sale financial assets -1,1 0,4 -1,5 0,0 0,0
Share in other comprehensive income of at equity accounted investments 0,1 0,1 -0,0 -0,0
Items expected to be reclassified to the income statement
in the future 108,0 -4,5 112,5 -19,9 1,0 -20,9
Remeasurements of the net defined benefit liability 0,0 0,0 0,0 -0,1 -0,0
Items not expected to be reclassified to the income statement
in the future 0,0 0,0 0,0 -0,1 -0,1 -0,0
Other result 108,0 -4,5 112,5 -20,0 0,9 -20,9
Comprehensive income 135,6 -4,5 140,1 19,5 0,9 18,6
attributable to: Non-controlling interest 5,1 5,1 3,9 3,9
Equity holders of the parent 130,5 -4,5 135,0 15,6 0,9 14,7

- 14 -
Cashflow Statement 1-03/2015 1-03/2014 Devi-
€ million € million ation
Earnings before taxes (EBT) 38,4 55,4 -30,7%
Financial result and non cash effected expenses and income 17,5 13,5 29,1%
Cashflow - gross 55,9 69,0 -19,0%
Change in net working capital -261,9 -164,5 59,2%
Taxes and interest payments -8,4 -21,2 -60,5%
Cashflow from operating activities -214,4 -116,8 83,6%
Payments for acquisitions 0,0 0,0
Payments for investments in fixed assets -15,6 -12,4 26,5%
Other investing activities -2,7 -2,9 -5,2%
Cashflow from investing activities -18,3 -15,2 20,6%
Free Cashflow -232,7 -132,0 76,4%
Free Cashflow (before acquisitions) -232,7 -132,0 76,4%
Dividends paid to non-controlling interests -16,7 -0,1
Proceeds from short-term borrowings 90,4 32,2 180,4%
Other changes 40,1 13,8 191,7%
Cashflow from financing activities 113,8 45,9 148,2%
Effect on exchange rates on cash 12,5 -2,7 -563,5%
Change in cash and cash equivalents -106,5 -88,8 19,9%
Cash and cash equivalents at beginning of financial year 401,5 390,1 2,9%
Cash and cash equivalents end of the period 295,0 301,3 -2,1%

- 15 -
Changes in Equity Subscribed Retained Treasury Equity Non- Total
capital Capital Revenue Difference Cashflow At equity earnings stock before controlling Equity
reserve reserves from hedges accounted non- interests
currency investments controlling
€ million conversion interests
Dec. 31, 2013 38,6 193,3 66,0 -137,5 -3,2 0,3 1.355,4 -31,4 1.481,6 15,7 1.497,3
Net earnings 0,0 0,0 0,0 0,0 0,0 0,0 35,6 0,0 35,6 3,9 39,5
Net income directly recognized
in equity 0,0 0,0 -0,1 -17,9 -2,0 -0,0 0,0 0,0 -20,0 -0,0 -20,0
Comprehensive income 0,0 0,0 -0,1 -17,9 -2,0 -0,0 35,6 0,0 15,6 3,9 19,5
0,0 -0,1 -0,1
Value of employees services 0,2 0,2 0,2
Conversion of options 0,0 0,0 0,0 0,0
Mar. 31, 2014 38,6 193,6 65,9 -155,4 -5,2 0,3 1.391,0 -31,4 1.497,4 19,4 1.516,9
Dec. 31, 2014 38,6 193,7 57,9 -110,6 34,6 0,5 1.412,0 -31,4 1.595,2 23,1 1.618,3
Net earnings 0,0 0,0 0,0 0,0 0,0 0,0 24,8 0,0 24,8 2,8 27,6
Net income directly recognized
in equity 0,0 0,0 -1,1 91,9 14,7 0,1 0,0 0,0 105,7 2,3 108,0
Comprehensive income 0,0 0,0 -1,1 91,9 14,7 0,1 24,8 0,0 130,5 5,1 135,6
0,0 -16,7 -16,7
Mar. 31, 2015 38,6 193,7 56,7 -18,6 49,3 0,6 1.436,9 -31,4 1.725,7 11,5 1.737,2
Group reserves
Dividends paid to equity holders
of the parent company / non-
controlling interests
Dividends paid to equity holders
of the parent company / non-
controlling interests

- 16 -
Operating Segments 1-3/2015
RegionsExternal Sales EBIT Investments
1-3/2015 1-3/2014 1-3/2015 1-3/2014 1-3/2015 1-3/2014
€ million € million € million € million € million € million
EMEA 311,4 300,3 12,7 22,6 4,5 4,6
Americas 239,2 194,5 -5,6 4,2 7,0 6,3
Asia/Pacific 152,6 125,1 1,2 4,2 1,1 0,9
Central units/consolidation 118,1 105,8 29,3 27,6 3,0 0,6
Total 821,4 725,7 37,5 58,6 15,6 12,4
Depreciation Inventories Trade Receivables
1-3/2015 1-3/2014 1-3/2015 1-3/2014 1-3/2015 1-3/2014
€ million € million € million € million € million € million
EMEA 2,9 2,9 219,6 219,4 220,7 197,3
Americas 3,9 2,9 230,6 157,2 179,4 145,3
Asia/Pacific 2,6 2,1 101,7 76,6 89,9 70,7
Central units/consolidation 4,0 3,8 96,1 70,4 106,4 92,4
Total 13,4 11,7 648,0 523,7 596,4 505,8
ProductExternal Sales Gross Profit Margin
1-3/2015 1-3/2014 1-3/2015 1-3/2014
€ million € million € million € million
Footwear 378,1 320,9 42,9% 44,1%
Apparel 279,8 245,9 50,7% 53,6%
Accessories 163,4 158,9 49,6% 49,7%
Total 821,4 725,7 46,9% 48,5%
1-3/2015 1-3/2014
€ Mio. € Mio.
EBIT 37,5 58,6
Financial Result 0,9 -3,2EBT 38,4 55,4
Bridge to EBT

- 17 -
Notes to the Financial Report for the first three months of 2015
GENERAL REMARKS
Under the “PUMA” brand name, PUMA SE and its
subsidiaries (the “PUMA group”) are engaged in the development and sales of a broad range of sport
and sportlifestyle products including footwear,
apparel and accessories. The company’s registered head office is in Herzogenaurach, Federal Republic
of Germany; its responsible court of registration is at Fürth (Bavaria).
PUMA is an affiliated company of the Kering Group
and will be consolidated in the consolidated
financial statements of Kering.
ACCOUNTING STANDARDS
The unaudited financial report of PUMA SE and its subsidiaries (which together form the PUMA group)
was prepared according to IAS 34 “Interim Financial Reporting” and should be read in
connection with the annual financial statements as
of December 31, 2014. The consolidated financial statements details contained therein apply to the
financial reports for 2015, unless changes have been explicitly referred to.
The financial report corresponds to all committing
standards and interpretations applied and explained in the annual financial statements as of
December 31, 2014.
This financial report is partly based on assumptions
and estimates which have an impact on the amounts and on the breakdown of the reported
assets and liabilities as well as of the revenues and expenses. The actual values may, in some
exceptional cases, differ from these assumptions
and estimates at a later date. The corresponding changes if and when they occur will be considered
as soon as the findings are revised.
SEASONAL VARIANCE
The group’s sales fluctuate with the seasons. Consequently, the sales and resulting earnings vary
in the course of a year.
EMPLOYEES
2015 2014
Number of employees at the beginning of the period
11,267 10,982
Number of employees at the end of the period
10,811 10,541
Average number of employees
10,865 10,591
EARNINGS PER SHARE
Earnings per share are calculated according to IAS 33 by dividing the result for the period by the
weighted average number of outstanding shares. The repurchased shares reduced the number of
outstanding shares as well as diluted number of
shares. In principle, outstanding stock options from the Management Incentive Program can result to a
dilution of earnings per share.
2015 2014
Earnings per share € 1.66 € 2.38
Diluted earnings per share € 1.66 € 2.38
- 18 -
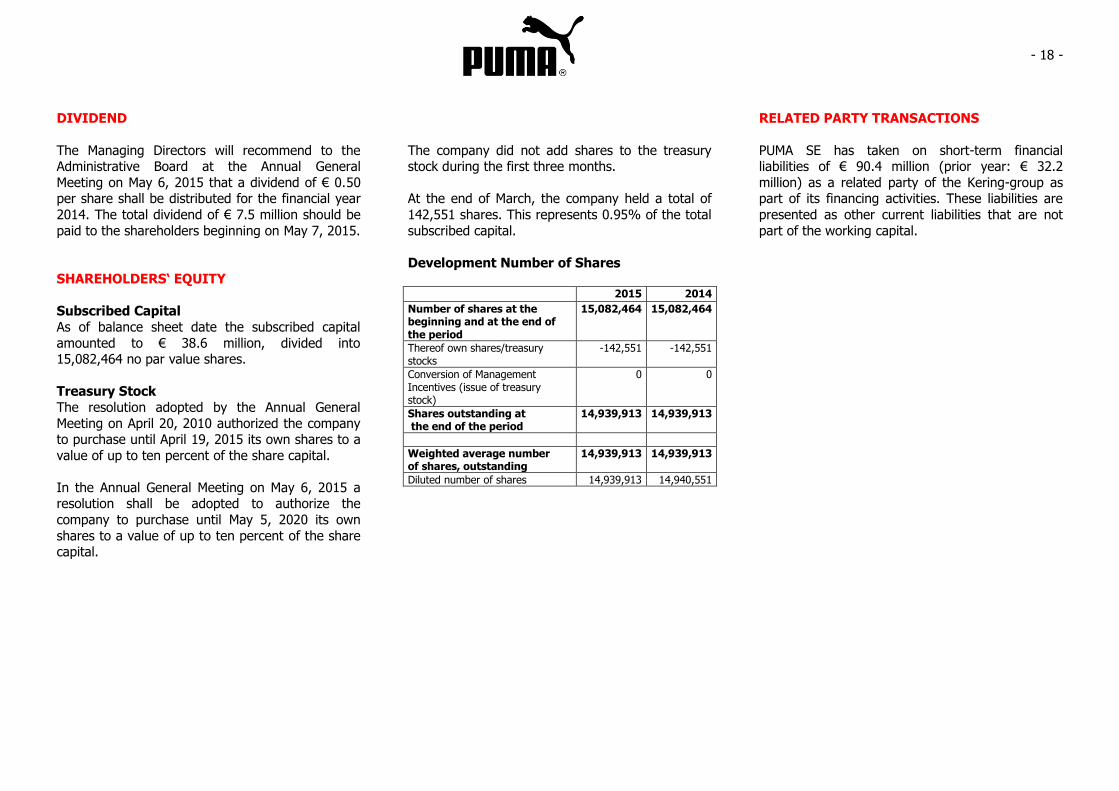
DIVIDEND
The Managing Directors will recommend to the Administrative Board at the Annual General
Meeting on May 6, 2015 that a dividend of € 0.50 per share shall be distributed for the financial year
2014. The total dividend of € 7.5 million should be
paid to the shareholders beginning on May 7, 2015.
SHAREHOLDERS‘ EQUITY
Subscribed Capital
As of balance sheet date the subscribed capital
amounted to € 38.6 million, divided into 15,082,464 no par value shares.
Treasury Stock
The resolution adopted by the Annual General
Meeting on April 20, 2010 authorized the company to purchase until April 19, 2015 its own shares to a
value of up to ten percent of the share capital.
In the Annual General Meeting on May 6, 2015 a resolution shall be adopted to authorize the
company to purchase until May 5, 2020 its own
shares to a value of up to ten percent of the share capital.
The company did not add shares to the treasury stock during the first three months.
At the end of March, the company held a total of
142,551 shares. This represents 0.95% of the total
subscribed capital.
Development Number of Shares 2015 2014
Number of shares at the beginning and at the end of the period
15,082,464 15,082,464
Thereof own shares/treasury stocks
-142,551 -142,551
Conversion of Management Incentives (issue of treasury stock)
0 0
Shares outstanding at the end of the period
14,939,913 14,939,913
Weighted average number of shares, outstanding
14,939,913 14,939,913
Diluted number of shares 14,939,913 14,940,551
RELATED PARTY TRANSACTIONS
PUMA SE has taken on short-term financial liabilities of € 90.4 million (prior year: € 32.2
million) as a related party of the Kering-group as part of its financing activities. These liabilities are
presented as other current liabilities that are not
part of the working capital.

- 19 -
SEGMENT REPORTING
Segment reporting is based on geographical regions in accordance with the internal reporting
structure. Sales and gross profit are shown according to the geographical region where the
respective group company is located (head office).
Intra-group sales are eliminated. Allocation of the remaining segment information is also determined
on the basis of the respective group company’s head office. The sum totals equal the amounts on
the income statement or on the balance sheet, respectively.
EVENTS AFTER THE BALANCE SHEET DATE
There were no events after the balance sheet date which may have a material effect on the financial
situation and earnings position as of March 31, 2015.
Herzogenaurach, May 6, 2015
The Managing Directors

- 20 -
Managing Directors Bjørn Gulden
(CEO, Chief Executive Officer)
Michael Laemmermann
(CFO, Chief Financial Officer)
Lars Radoor Sørensen (COO, Chief Operating Officer)
Administrative Board Jean-François Palus
(Chairman)
François-Henri Pinault
(Deputy Chairman)
Thore Ohlsson
Todd Hymel
Jean-Marc Duplaix
Bernd Illig
Employees‘ Representative
Martin Koeppel
Employees‘ Representative
Guy Buzzard
Employees‘ Representative

- 21 -
Financial Calendar FY 2015
February 16, 2015 Financial Results FY 2014
May 6, 2015 Annual Shareholders’ Meeting
May 6, 2015 Financial Results Q1/2015
July 24, 2015 Financial Results Q2/2015
November 6, 2015 Financial Results Q3/2015
The financial releases and other financial information are available on the Internet at „about.puma.com“.
Published by PUMA SE PUMA Way 1 D-91074 Herzogenaurach Tel.: +49 (0)9132 81-0 email: [email protected] Internet: http://www.puma.com
Notes relating to forward-looking statements:
This document contains forward-looking information about the Company’s financial status and strategic initiatives. Such information is subject to a certain level of risk and uncertainty that could cause the Company's actual results to differ significantly from the information discussed in this document. The forward-looking information is based on the current expectations and prognosis of the management team. Therefore, this document is further subject to the risk that such expectations or prognosis, or the premise of such underlying expectations or prognosis, become erroneous. Circumstances that could alter the Company's actual results and procure such results to differ significantly from those contained in forward-looking statements made by or on behalf of the Company include, but are not limited to those discussed be above.
PUMA PUMA is one of the world’s leading Sports Brands, designing, developing, selling and marketing footwear, apparel and accessories. For over 65 years, PUMA has established a history of making fast product designs for the fastest athletes on the planet. PUMA offers performance and sport-inspired lifestyle products in categories such as Football, Running, Training and Fitness, Golf, and Motorsports. It engages in exciting collaborations with renowned design brands such as Alexander McQueen and Mihara Yasuhiro to bring innovative and fast designs to the sports world. The PUMA Group owns the brands PUMA, Cobra Golf, Tretorn, Dobotex and Brandon. The company distributes its products in more than 120 countries, employs more than 10,000 people worldwide, and is headquartered in Herzogenaurach/Germany. For more information, please visit http://www.puma.com