Embed Size (px)
DESCRIPTION
Pulmonary-Allergy Drugs Advisory Committee May 1, 2007 Statistical Methods Agreed with sponsor’s statistical methods and results –Mortality (SCO30003) Log-Rank test, stratified by smoking status Other pre-specified supportive analyses –Exacerbations (SFCB3024, SCO30003) Negative Binomial model Poisson model Andersen Gill model Agreed with sponsor’s statistical methods and results –Mortality (SCO30003) Log-Rank test, stratified by smoking status Other pre-specified supportive analyses –Exacerbations (SFCB3024, SCO30003) Negative Binomial model Poisson model Andersen Gill model
Citation preview
Pulmonary-Allergy Drugs Advisory CommitteePulmonary-Allergy Drugs Advisory CommitteeMay 1, 2007May 1, 2007
OutlineOutline• History of development program History of development program
– Dr. Carol BoskenDr. Carol Bosken• Introduction to efficacy results Introduction to efficacy results
• Dr. Carol BoskenDr. Carol Bosken Efficacy results Efficacy results
Ms. Feng ZhouMs. Feng Zhou• Safety results and summary
– Dr. Carol Bosken
Pulmonary-Allergy Drugs Advisory CommitteePulmonary-Allergy Drugs Advisory CommitteeMay 1, 2007May 1, 2007
Outline of PresentationOutline of Presentation• Statistical methods
• Results– Mortality – SCO30003
• Dropout issue• SFC compared to components• US vs. Non-US
– Exacerbations• SFCB3024 • SCO30003
– Multiplicity issues• US vs. Non-US
Pulmonary-Allergy Drugs Advisory CommitteePulmonary-Allergy Drugs Advisory CommitteeMay 1, 2007May 1, 2007
Statistical MethodsStatistical Methods• Agreed with sponsor’s statistical methods and
results
– Mortality (SCO30003)• Log-Rank test, stratified by smoking
status• Other pre-specified supportive analyses
– Exacerbations (SFCB3024, SCO30003)• Negative Binomial model• Poisson model• Andersen Gill model
Pulmonary-Allergy Drugs Advisory CommitteePulmonary-Allergy Drugs Advisory CommitteeMay 1, 2007May 1, 2007
80
82
84
86
88
90
92
94
96
98
100
0 84 168 252 336 420 504 588 672 756 840 924 1008 1092Treatment Days
Surv
ival
Per
cent
age
(%)
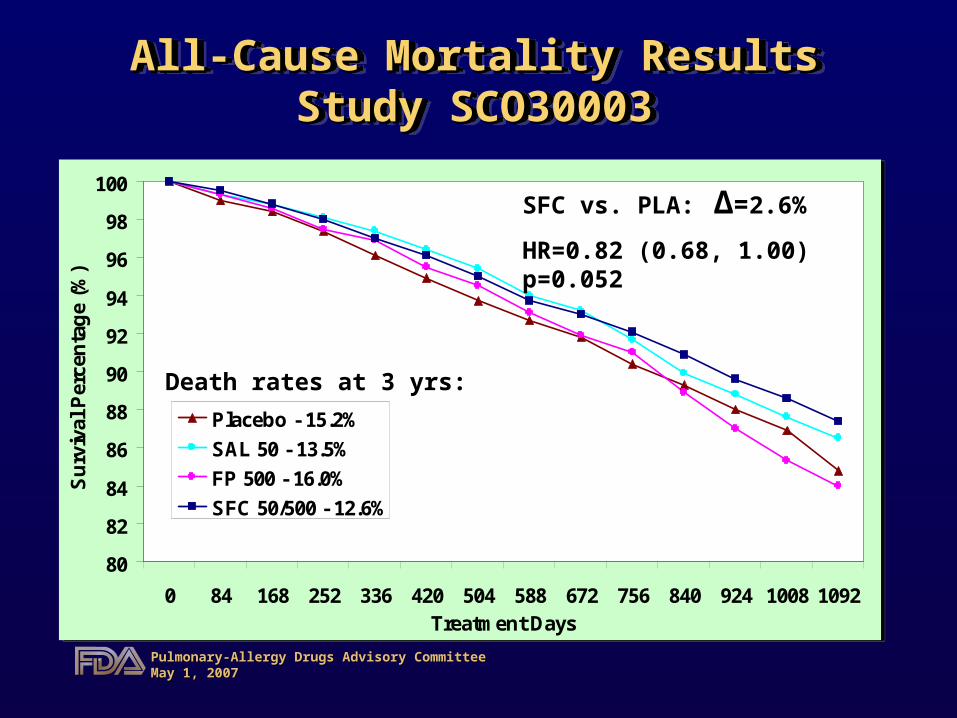
Placebo - 15.2%SAL 50 - 13.5%FP 500 - 16.0%SFC 50/500 - 12.6%
All-Cause Mortality ResultsAll-Cause Mortality ResultsStudy SCO30003Study SCO30003
SFC vs. PLA: ∆=2.6%
HR=0.82 (0.68, 1.00) p=0.052
Death rates at 3 yrs:
Pulmonary-Allergy Drugs Advisory CommitteePulmonary-Allergy Drugs Advisory CommitteeMay 1, 2007May 1, 2007
Factors Affecting Interpretation of Results Factors Affecting Interpretation of Results Study SCO30003Study SCO30003
• Dropout• Low risk vs. High risk• US vs. Non-US
Pulmonary-Allergy Drugs Advisory CommitteePulmonary-Allergy Drugs Advisory CommitteeMay 1, 2007May 1, 2007
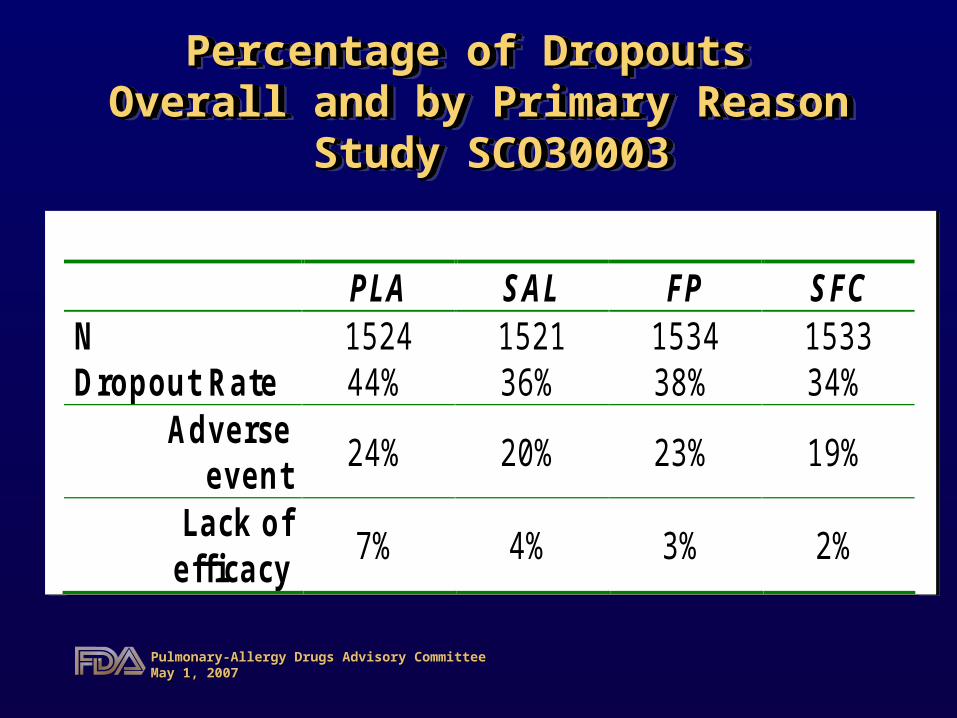
Percentage of Dropouts Percentage of Dropouts Overall and by Primary ReasonOverall and by Primary Reason
Study SCO30003 Study SCO30003
PLA SAL FP SFC N 1524 1521 1534 1533 Dropout Rate 44% 36% 38% 34%
Adverse event 24% 20% 23% 19%
Lack of efficacy 7% 4% 3% 2%
Pulmonary-Allergy Drugs Advisory CommitteePulmonary-Allergy Drugs Advisory CommitteeMay 1, 2007May 1, 2007
Dropout IssueDropout Issue Addressed dropout issue in 2 ways:
– Dropouts for low and high risk subgroups• Risk profile defined by baseline
characteristics where low risk is defined by: – No history of myocardial infarction &– No COPD exacerbation during the year previous to
baseline &– % predicted post-bron. FEV1 > 40%
• Mortality results by risk groups
– On-treatment mortality
Pulmonary-Allergy Drugs Advisory CommitteePulmonary-Allergy Drugs Advisory CommitteeMay 1, 2007May 1, 2007
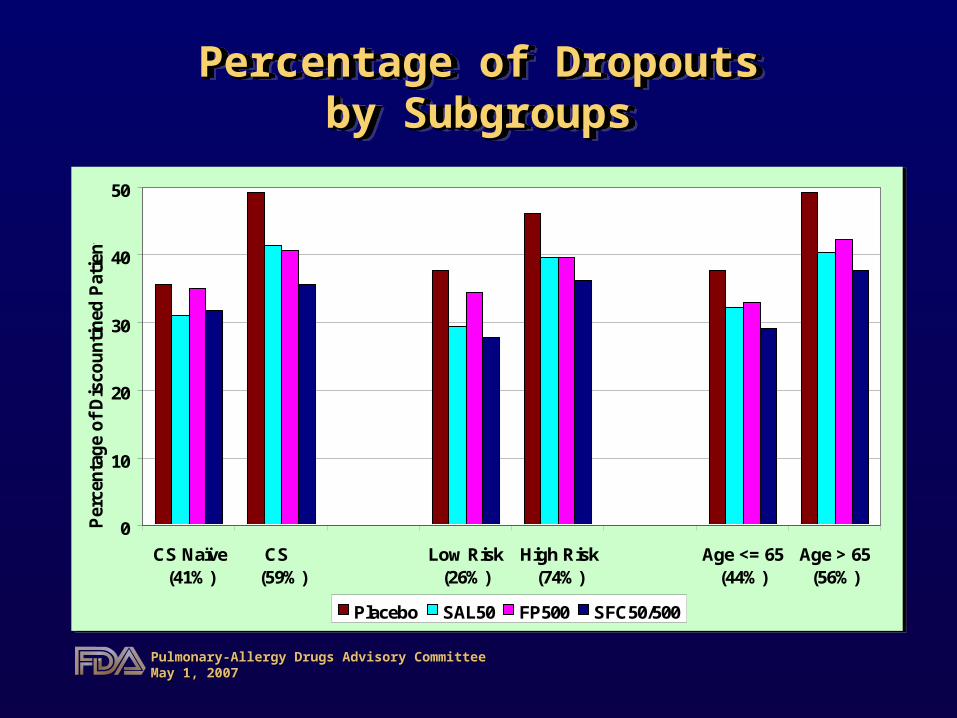
Percentage of DropoutsPercentage of Dropoutsby Subgroupsby Subgroups
0
10
20
30
40
50
CS Naïve(41%)
CS (59%)
Low Risk(26%)
High Risk(74%)
Age <= 65(44%)
Age > 65(56%)
Perc
enta
ge o
f Dis
coun
tined
Pat
ient
s
Placebo SAL50 FP500 SFC50/500
Pulmonary-Allergy Drugs Advisory CommitteePulmonary-Allergy Drugs Advisory CommitteeMay 1, 2007May 1, 2007
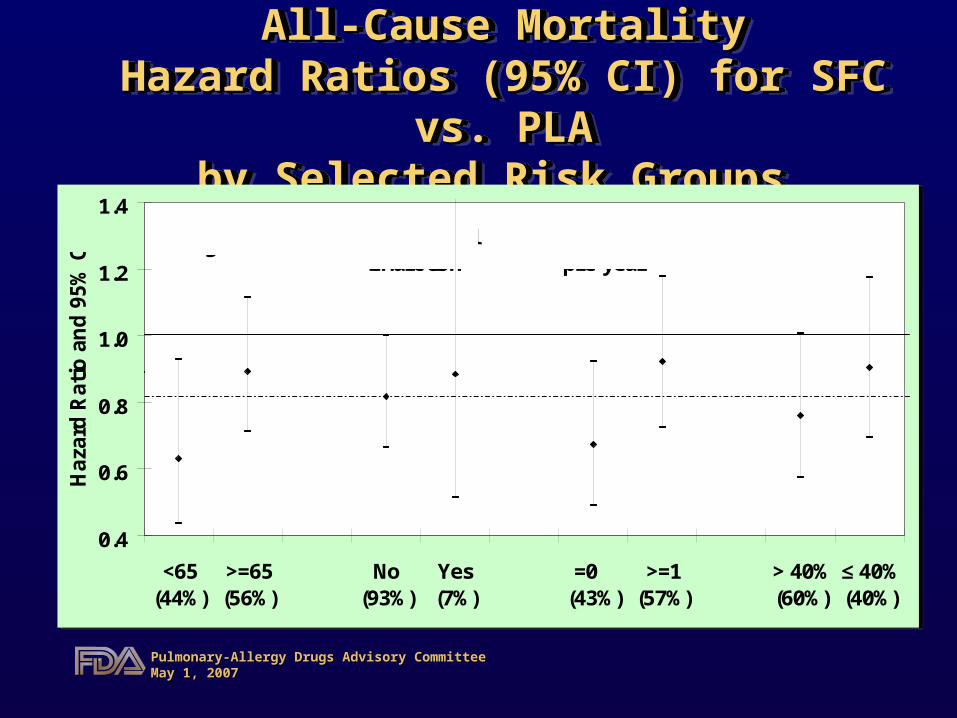
All-Cause MortalityAll-Cause MortalityHazard Ratios (95% CI) for SFC vs. PLAHazard Ratios (95% CI) for SFC vs. PLA
by Selected Risk Groups by Selected Risk Groups
0.4
0.6
0.8
1.0
1.2
1.4
<65(44%)
>=65(56%)
No(93%)
Yes(7%)
=0 (43%)
>=1(57%)
> 40%(60%)
≤ 40%(40%)
Haza
rd R
atio
and
95%
CI Age Myocardial
infarctionCOPD exac in pre-year
BL %pred post-br FEV1
Pulmonary-Allergy Drugs Advisory CommitteePulmonary-Allergy Drugs Advisory CommitteeMay 1, 2007May 1, 2007
80
82
84
86
88
90
92
94
96
98
100
0 84 168 252 336 420 504 588 672 756 840 924 1008 1092
Survival Proba
bility (%
)
80
82
84
86
88
90
92
94
96
98
100
0 84 168 252 336 420 504 588 672 756 840 924 1008 1092
Survival Proba
bility (%
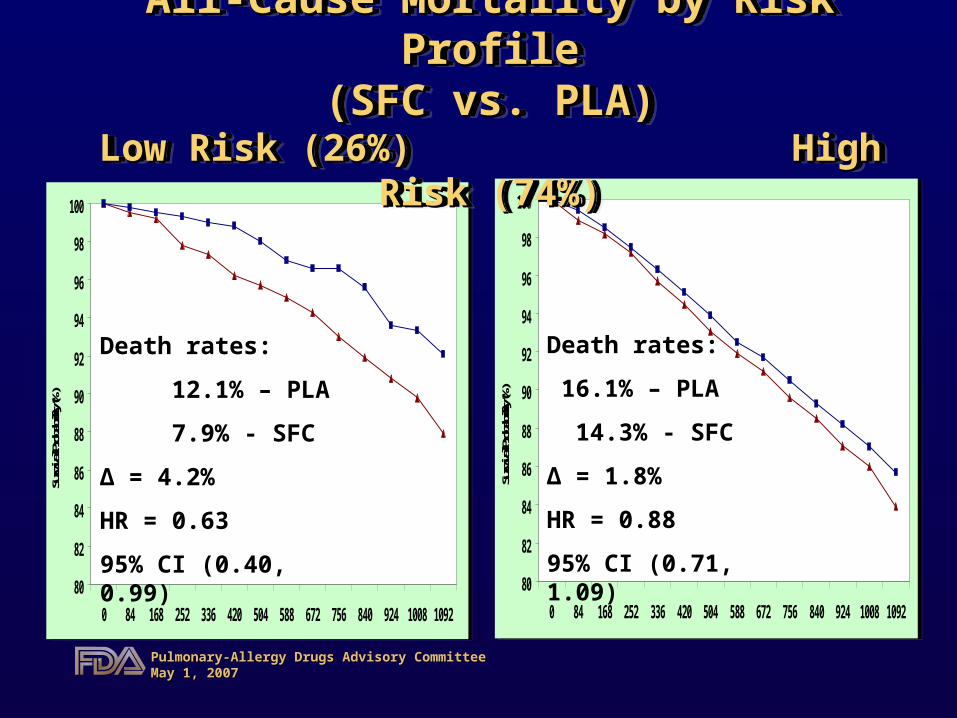
)All-Cause Mortality by Risk ProfileAll-Cause Mortality by Risk Profile
(SFC vs. PLA)(SFC vs. PLA)Low Risk (26%) High Risk (74%)Low Risk (26%) High Risk (74%)
Death rates:
12.1% – PLA
7.9% - SFC
∆ = 4.2%
HR = 0.63
95% CI (0.40, 0.99)
Death rates:
16.1% – PLA
14.3% - SFC
∆ = 1.8%
HR = 0.88
95% CI (0.71, 1.09)
Pulmonary-Allergy Drugs Advisory CommitteePulmonary-Allergy Drugs Advisory CommitteeMay 1, 2007May 1, 2007
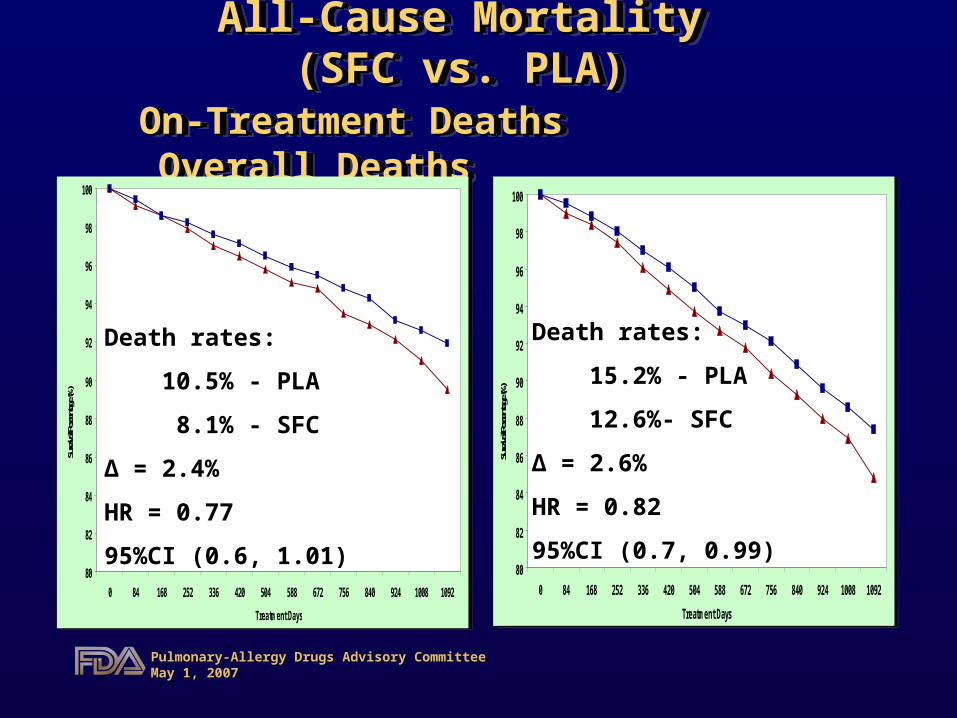
All-Cause Mortality All-Cause Mortality (SFC vs. PLA)(SFC vs. PLA)
On-Treatment Deaths Overall Deaths On-Treatment Deaths Overall Deaths
80
82
84
86
88
90
92
94
96
98
100
0 84 168 252 336 420 504 588 672 756 840 924 1008 1092
Treatment Days
Survival Percentage (%
)
80
82
84
86
88
90
92
94
96
98
100
0 84 168 252 336 420 504 588 672 756 840 924 1008 1092Treatment Days
Survival Percentage (%
)
Death rates:
15.2% - PLA
12.6%- SFC
∆ = 2.6%
HR = 0.82
95%CI (0.7, 0.99)
Death rates:
10.5% - PLA
8.1% - SFC
∆ = 2.4%
HR = 0.77
95%CI (0.6, 1.01)
Pulmonary-Allergy Drugs Advisory CommitteePulmonary-Allergy Drugs Advisory CommitteeMay 1, 2007May 1, 2007
Relationship of Risk Profile Relationship of Risk Profile to Dropout & to Outcometo Dropout & to Outcome
• Low risk patients remained on study longer than high risk patients regardless of randomized treatment
• Low risk patients show greater benefit from SFC over placebo compared to high risk patients– Supported by favorable on-treatment mortality results
• Dropouts in both treatment groups were at a higher risk of dying than patients remaining on treatment
Pulmonary-Allergy Drugs Advisory CommitteePulmonary-Allergy Drugs Advisory CommitteeMay 1, 2007May 1, 2007
0.4
0.6
0.8
1
1.2
1.4
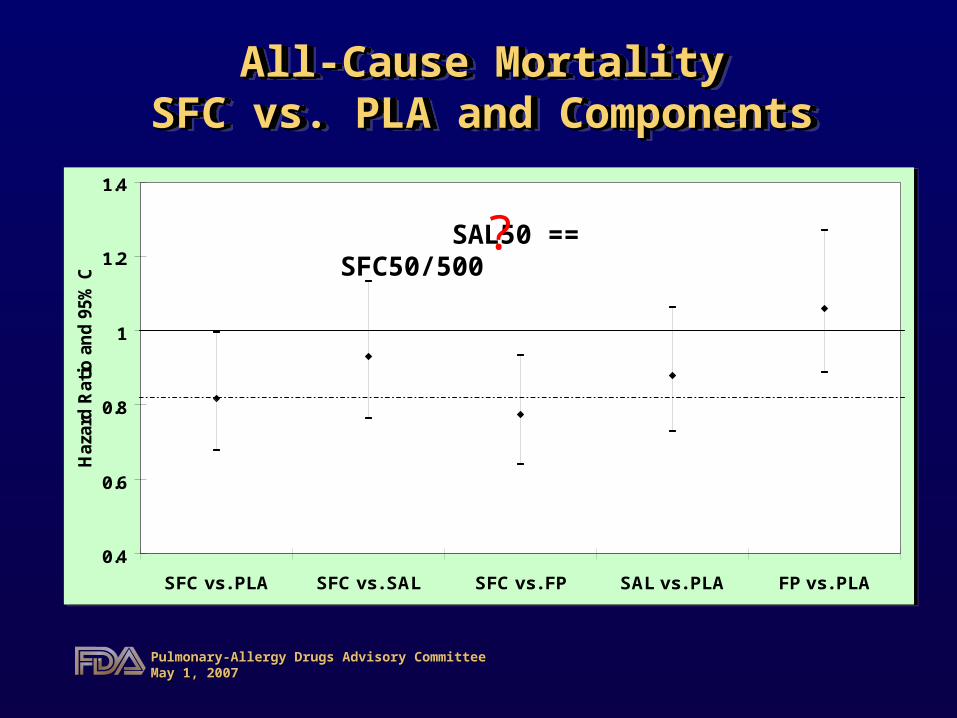
SFC vs. PLA SFC vs. SAL SFC vs. FP SAL vs. PLA FP vs. PLA
Haza
rd R
atio
and
95%
CI
All-Cause MortalityAll-Cause MortalitySFC vs. PLA and ComponentsSFC vs. PLA and Components
SAL50 == SFC50/500 ?
Pulmonary-Allergy Drugs Advisory CommitteePulmonary-Allergy Drugs Advisory CommitteeMay 1, 2007May 1, 2007
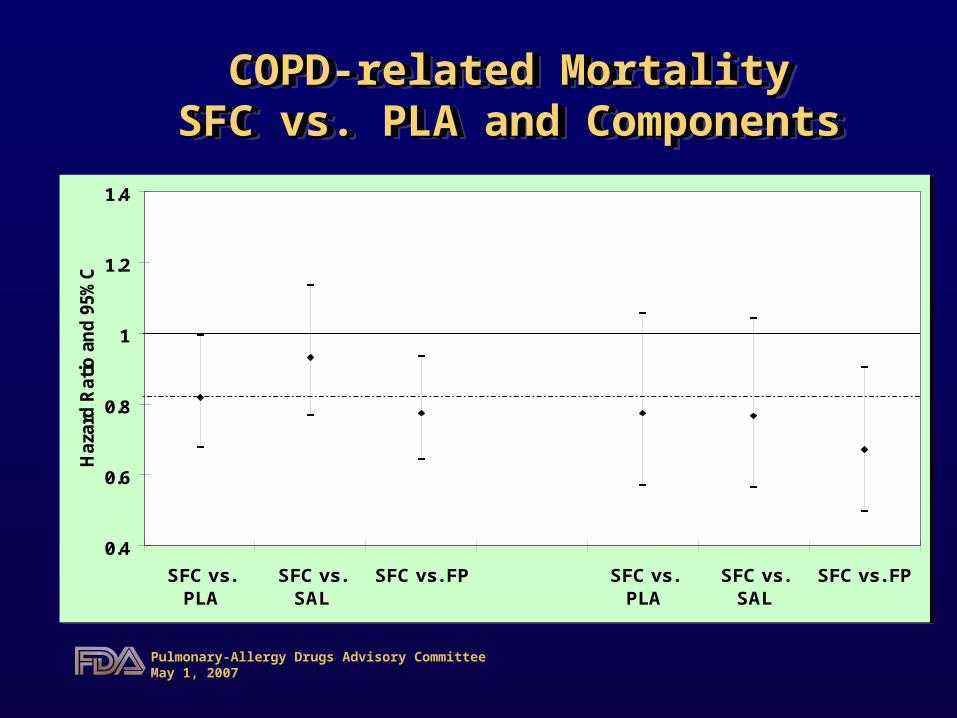
COPD-related MortalityCOPD-related Mortality SFC vs. PLA and Components SFC vs. PLA and Components
Death rate at 3 years:
6.3% - PLA, 6.4% - SAL, 7.3% - FP, 4.9% - SAL
0.4
0.6
0.8
1
1.2
1.4
SFC vs.PLA
SFC vs.SAL
SFC vs. FP SFC vs.PLA
SFC vs.SAL
SFC vs. FP
Haza
rd R
atio
and
95%
CI
All-cause MortalityDeath Rate at 3 Years:
PLA-15%, SAL-14%, FP-16%, SFC-13%
COPD-related MortalityDeath Rate at 3 Years:
PLA-6%, SAL-6%, FP-7%, SFC-5%
Pulmonary-Allergy Drugs Advisory CommitteePulmonary-Allergy Drugs Advisory CommitteeMay 1, 2007May 1, 2007
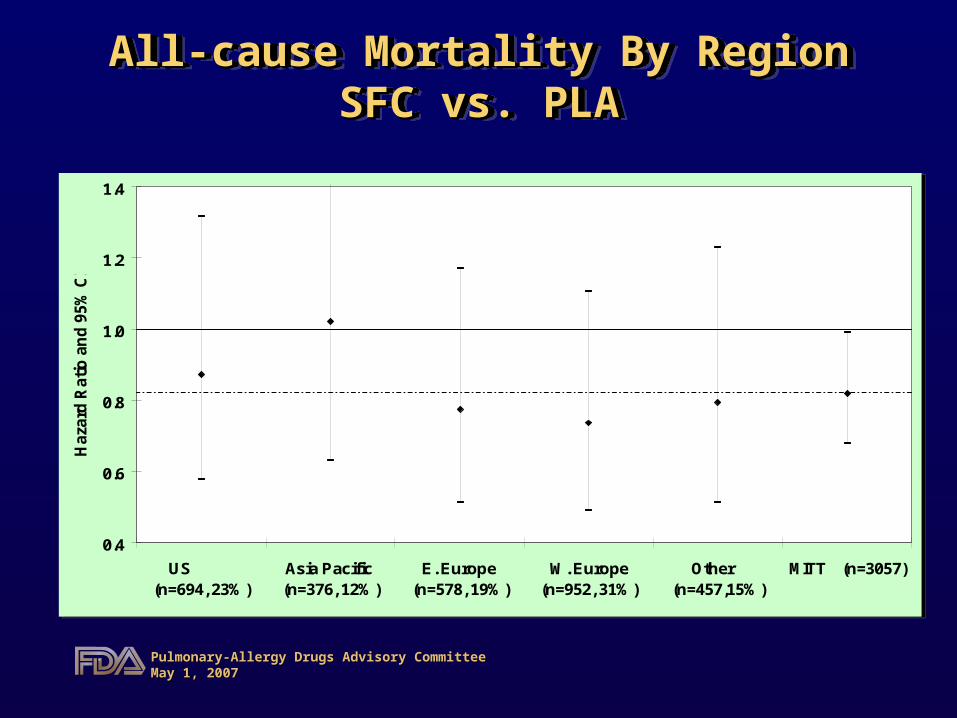
All-cause Mortality By RegionAll-cause Mortality By RegionSFC vs. PLASFC vs. PLA
0.4
0.6
0.8
1.0
1.2
1.4
US (n=694, 23%)
Asia Pacific (n=376, 12%)
E. Europe (n=578, 19%)
W. Europe(n=952, 31%)
Other (n=457,15%)
MITT (n=3057)
Haz
ard
Rat
io a
nd 9
5% C
I
Pulmonary-Allergy Drugs Advisory CommitteePulmonary-Allergy Drugs Advisory CommitteeMay 1, 2007May 1, 2007
80
82
84
86
88
90
92
94
96
98
100
0 84 168 252 336 420 504 588 672 756 840 924 1008 1092
Survival Percentage (%)
80
82
84
86
88
90
92
94
96
98
100
0 84 168 252 336 420 504 588 672 756 840 924 1008 1092
Survival Percentage (%
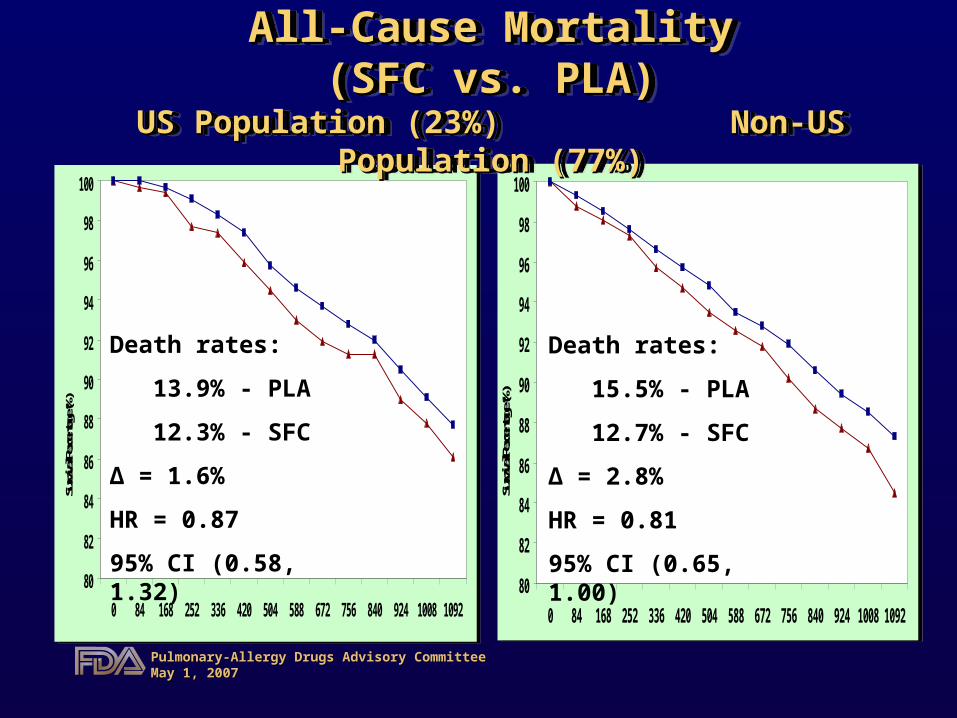
)All-Cause MortalityAll-Cause Mortality
(SFC vs. PLA)(SFC vs. PLA)US Population (23%) Non-US Population (77%)US Population (23%) Non-US Population (77%)
Death rates:
13.9% - PLA
12.3% - SFC
∆ = 1.6%
HR = 0.87
95% CI (0.58, 1.32)
Death rates:
15.5% - PLA
12.7% - SFC
∆ = 2.8%
HR = 0.81
95% CI (0.65, 1.00)
Pulmonary-Allergy Drugs Advisory CommitteePulmonary-Allergy Drugs Advisory CommitteeMay 1, 2007May 1, 2007
80
82
84
86
88
90
92
94
96
98
100
0 84 168 252 336 420 504 588 672 756 840 924 1008 1092
Survival Percentag
e (%
)
80
82
84
86
88
90
92
94
96
98
100
0 84 168 252 336 420 504 588 672 756 840 924 1008 1092
Survival Percentag
e (%
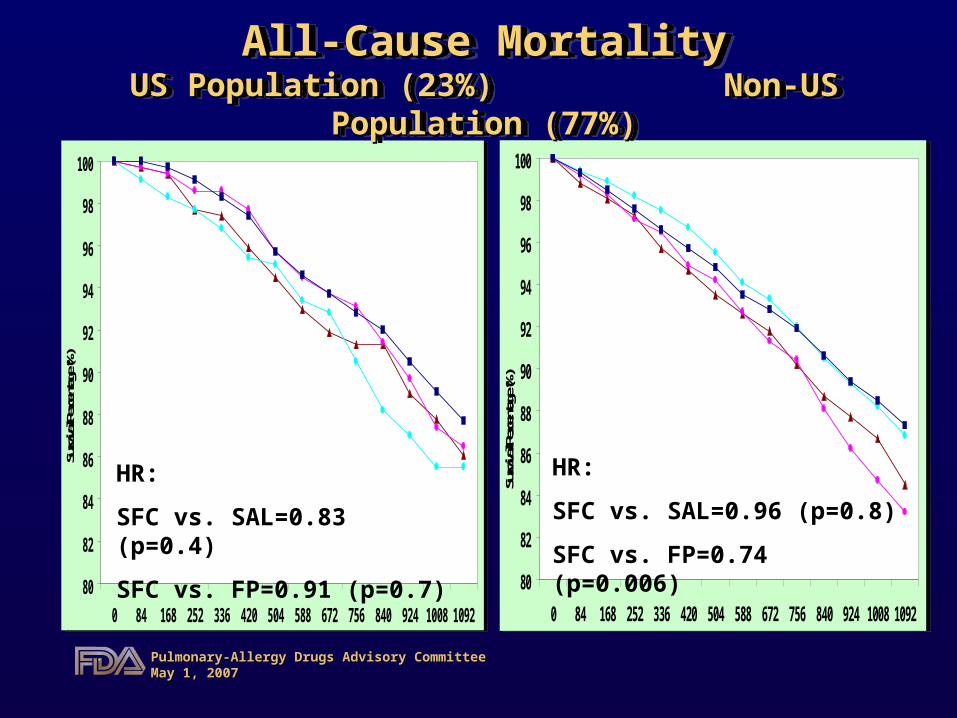
)All-Cause MortalityAll-Cause Mortality
US Population (23%) Non-US Population (77%)US Population (23%) Non-US Population (77%)
HR:
SFC vs. SAL=0.83 (p=0.4)
SFC vs. FP=0.91 (p=0.7)
HR:
SFC vs. SAL=0.96 (p=0.8)
SFC vs. FP=0.74 (p=0.006)
Pulmonary-Allergy Drugs Advisory CommitteePulmonary-Allergy Drugs Advisory CommitteeMay 1, 2007May 1, 2007
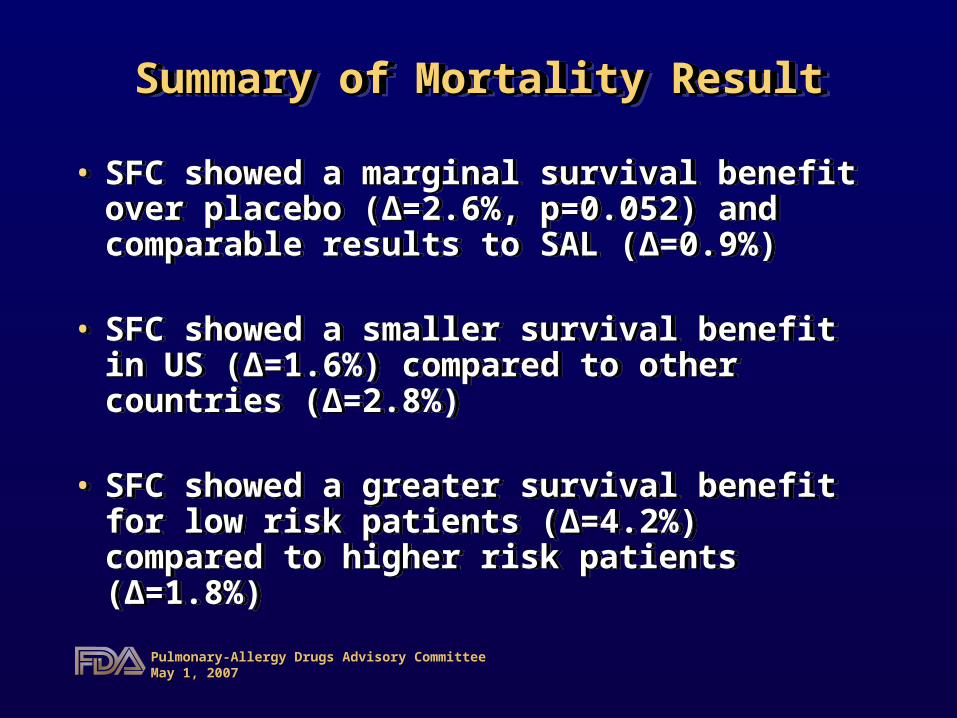
Summary of Mortality ResultSummary of Mortality Result
• SFC showed a marginal survival benefit over placebo (∆=2.6%, p=0.052) and comparable results to SAL (∆=0.9%)
• SFC showed a smaller survival benefit in US (∆=1.6%) compared to other countries (∆=2.8%)
• SFC showed a greater survival benefit for low risk patients (∆=4.2%) compared to higher risk patients (∆=1.8%)

Pulmonary-Allergy Drugs Advisory CommitteePulmonary-Allergy Drugs Advisory CommitteeMay 1, 2007May 1, 2007
COPD Exacerbation EndpointsCOPD Exacerbation Endpoints
Study SFCB3024 SCO30003 N 1462 6112 Duration 1 year 3 years US population 0% 23% Exacerbation history 100% 57% Endpoint – primary Pre-dose FEV1 All-cause mortality
- secondary Exacerbation Exacerbation Multiplicity adjustment No Yes
Pulmonary-Allergy Drugs Advisory CommitteePulmonary-Allergy Drugs Advisory CommitteeMay 1, 2007May 1, 2007
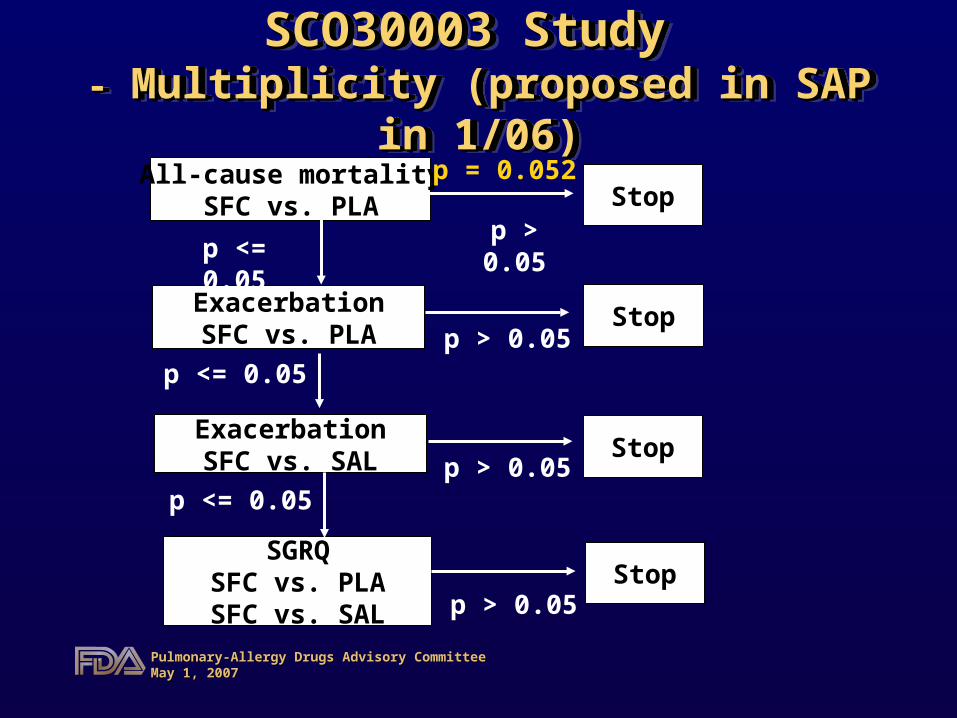
SCO30003 Study SCO30003 Study - - Multiplicity (proposed in SAP in 1/06)Multiplicity (proposed in SAP in 1/06)
All-cause mortalitySFC vs. PLA Stop
ExacerbationSFC vs. PLA Stop
StopExacerbationSFC vs. SAL
p <= 0.05
p <= 0.05
p > 0.05
p > 0.05
p > 0.05
SGRQSFC vs. PLASFC vs. SAL
Stopp > 0.05
p <= 0.05
p = 0.052

Pulmonary-Allergy Drugs Advisory CommitteePulmonary-Allergy Drugs Advisory CommitteeMay 1, 2007May 1, 2007
Exacerbation Endpoint for SFCB3024 Exacerbation Endpoint for SFCB3024 Moderately Severe and SevereModerately Severe and Severe
0.4
0.6
0.8
1
1.2
1.4
SFCvsPLA SFCvsSAL SFCvsFP SALvsPLA FPvsPLATreatment Comparison
Rate
Rat
io a
nd 9
5% C
I
Pulmonary-Allergy Drugs Advisory CommitteePulmonary-Allergy Drugs Advisory CommitteeMay 1, 2007May 1, 2007
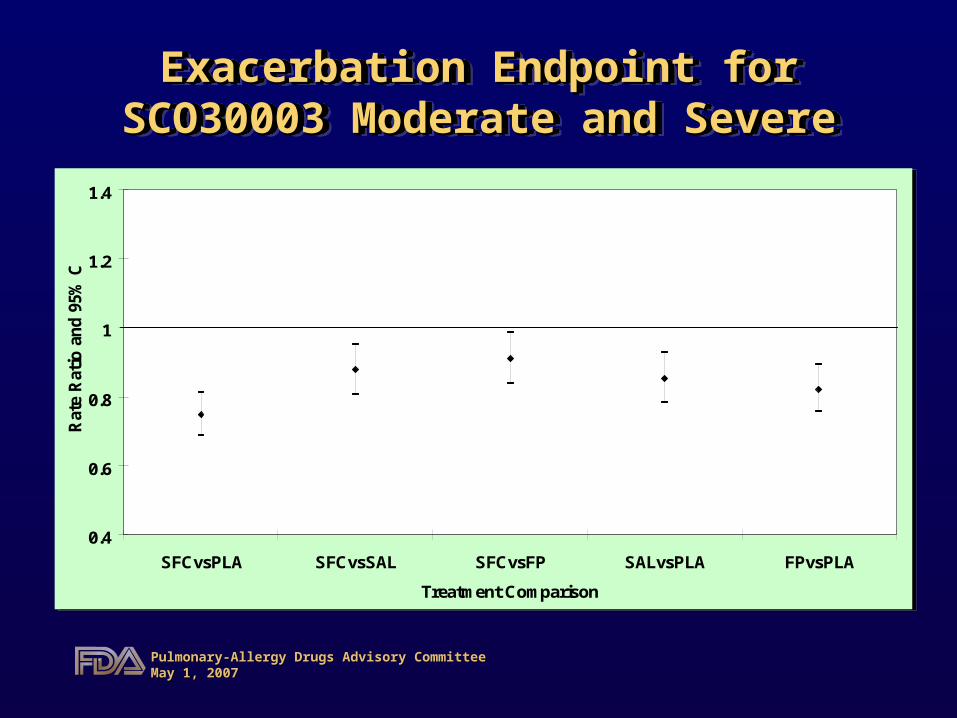
Exacerbation Endpoint for SCO30003 Exacerbation Endpoint for SCO30003 Moderate and SevereModerate and Severe
0.4
0.6
0.8
1
1.2
1.4
SFCvsPLA SFCvsSAL SFCvsFP SALvsPLA FPvsPLATreatment Comparison
Rate
Rat
io a
nd 9
5% C
I

Pulmonary-Allergy Drugs Advisory CommitteePulmonary-Allergy Drugs Advisory CommitteeMay 1, 2007May 1, 2007
COPD Exacerbation EndpointsCOPD Exacerbation Endpoints- Moderate/Severe- Moderate/Severe
Subjects had previous exacerbation historySubjects had previous exacerbation history
0.4
0.6
0.8
1
1.2
1.4
SFCvsPLA SFCvsSAL SFCvsFP SFCvsPLA SFCvsSAL SFCvsFP
Treatment Comparison
Rate
Rat
io a
nd 9
5% C
I
SCO30003 - 3 Years - Subgroup of patients (57%)
SFCB3024 - 1 Year
Pulmonary-Allergy Drugs Advisory CommitteePulmonary-Allergy Drugs Advisory CommitteeMay 1, 2007May 1, 2007
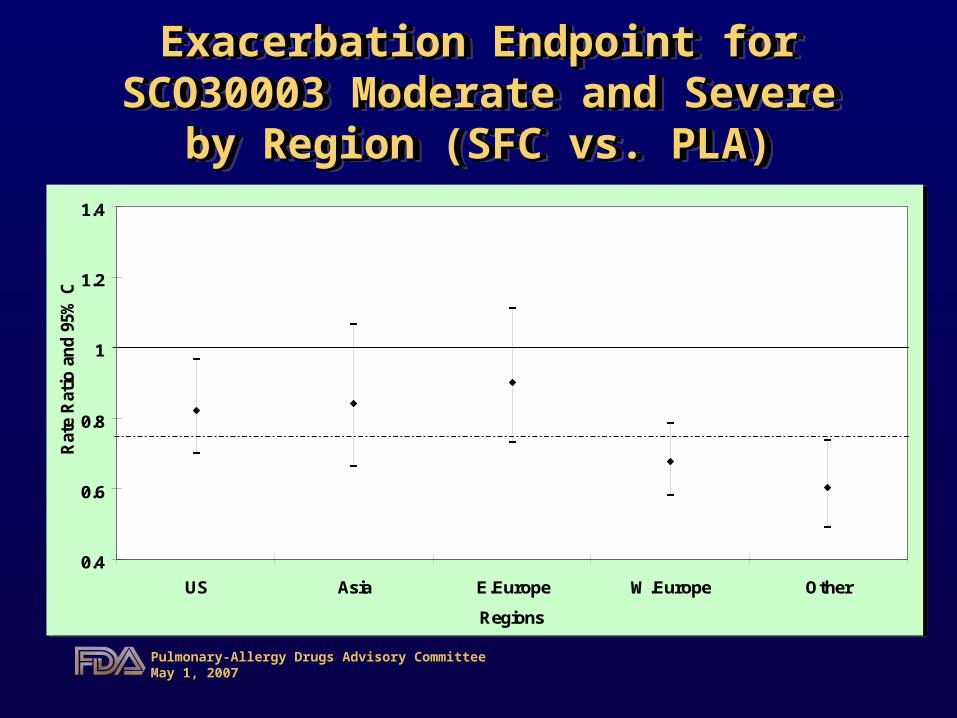
Exacerbation Endpoint for SCO30003 Exacerbation Endpoint for SCO30003 Moderate and SevereModerate and Severe
by Region (SFC vs. PLA)by Region (SFC vs. PLA)
0.4
0.6
0.8
1
1.2
1.4
US Asia E.Europe W.Europe Other
Regions
Rate
Rat
io a
nd 9
5% C
I
Pulmonary-Allergy Drugs Advisory CommitteePulmonary-Allergy Drugs Advisory CommitteeMay 1, 2007May 1, 2007
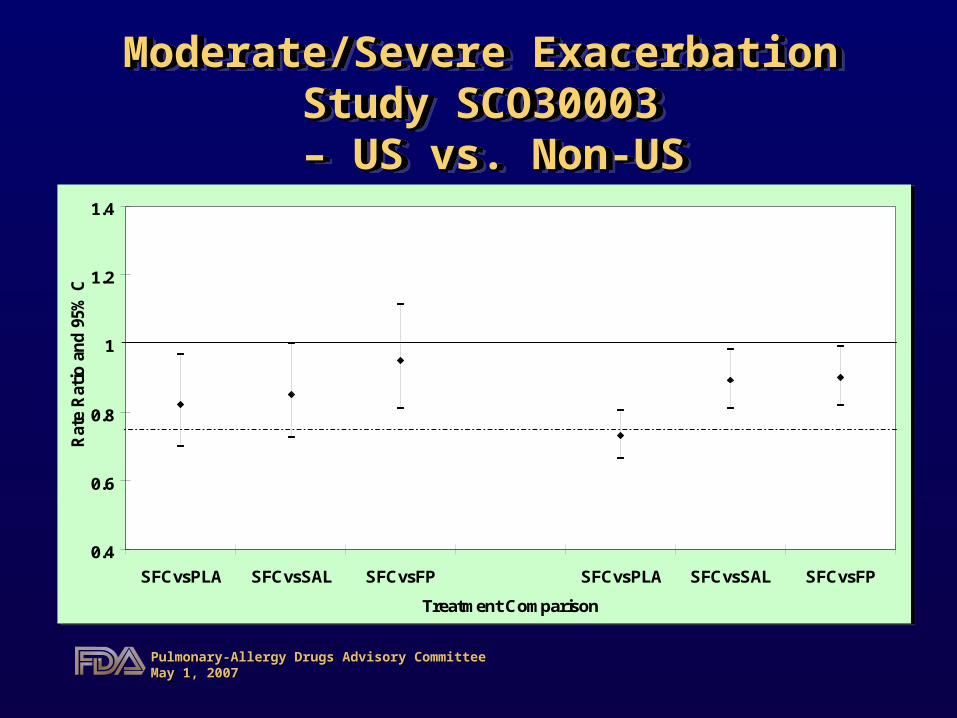
Moderate/Severe ExacerbationModerate/Severe ExacerbationStudy SCO30003Study SCO30003 – US vs. Non-US – US vs. Non-US
0.4
0.6
0.8
1
1.2
1.4
SFCvsPLA SFCvsSAL SFCvsFP SFCvsPLA SFCvsSAL SFCvsFP
Treatment Comparison
Rate
Rat
io a
nd 9
5% C
I
US (23%) Non-US (77%)
Pulmonary-Allergy Drugs Advisory CommitteePulmonary-Allergy Drugs Advisory CommitteeMay 1, 2007May 1, 2007
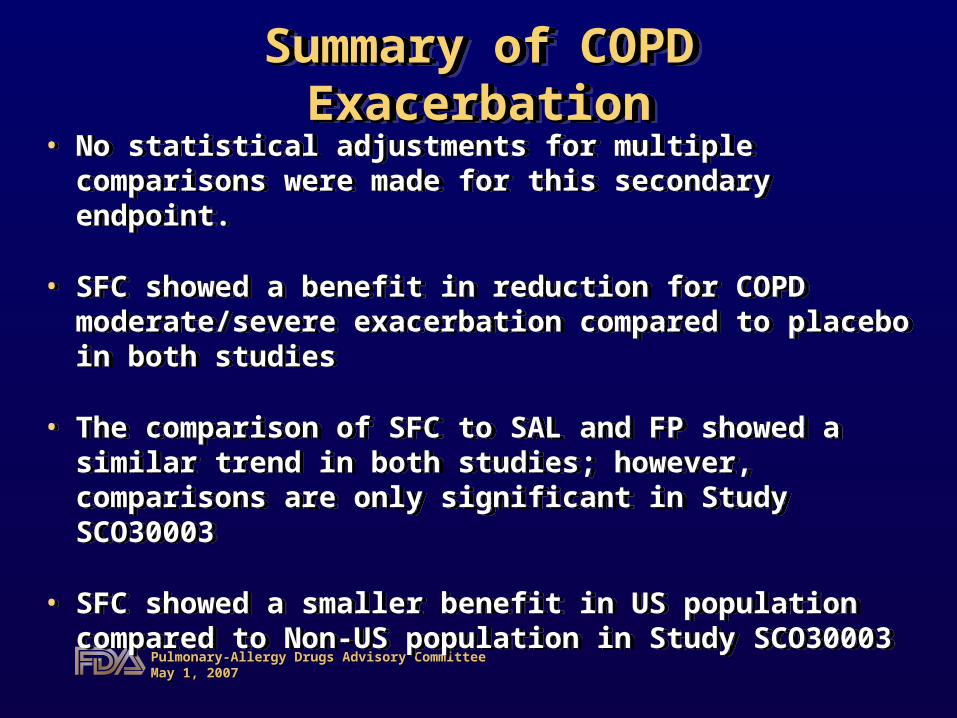
Summary of COPD ExacerbationSummary of COPD Exacerbation• No statistical adjustments for multiple comparisons
were made for this secondary endpoint.
• SFC showed a benefit in reduction for COPD moderate/severe exacerbation compared to placebo in both studies
• The comparison of SFC to SAL and FP showed a similar trend in both studies; however, comparisons are only significant in Study SCO30003
• SFC showed a smaller benefit in US population compared to Non-US population in Study SCO30003
Pulmonary-Allergy Drugs Advisory CommitteePulmonary-Allergy Drugs Advisory CommitteeMay 1, 2007May 1, 2007
Thank You!Thank You!
***


![Curriculum Vitae - University of Michigan College of Pharmacy › sites › default › files › cv...2012 Pulmonary, Allergy, Rheumatology [PHARM 5316] Lecturer, Asthma Disease Facilitator,](https://img.pdfslide.us/doc/110x75/5f0cfd687e708231d4382166/curriculum-vitae-university-of-michigan-college-of-pharmacy-a-sites-a-default.jpg)