Embed Size (px)
Citation preview

Publisher: GSA
Journal: GEOL: Geology
Article ID: G30172
Page 1 of 15
Tsunami geomorphology: erosion and deposition from the 15 1
November 2006 Kuril Island tsunami 2
Breanyn T. MacInnes1, Joanne Bourgeois
1, Tatiana K. Pinegina
2, and Ekaterina A. 3
Kravchunovskaya2 4
1Department of Earth and Space Sciences, University of Washington, Seattle, Washington 5
98195, USA 6
2 Institute of Volcanology and Seismology, Far Eastern Branch Russian Academy of 7
Sciences, 683006 Petropavlovsk-Kamchatskiy, Russia 8
*E-mail [email protected] 9
ABSTRACT 10
The 15 November 2006 Kuril earthquake (Mw 8.1–8.4) and tsunami enabled us to 11
collect a compelling data set of coastal geomorphic change in the Kuril Islands from ~3 12
months before to 9 (and 21) months after the tsunami. Our pre- and post-tsunami surveys of 13
the islands, including four topographic profiles measured in 2006 and reoccupied in 2007, 14
allow us the confidence to attribute many changes to the tsunami, in spite of an absence of 15
eyewitness accounts in the central islands. Areas with low runup, <8 m, experienced limited 16
geomorphic change, primarily confined to the beach or stream channels. Regions with high 17
runup, >15 m, experienced massive erosion that dramatically altered the coastline. Tsunami 18
deposits roughly corresponded with the extent of tsunami runup and inundation. The amount 19
of sediment eroded by the tsunami far outweighed the amount deposited on land in all cases 20
studied. The tsunami was dominantly erosive in the Kuril Islands because the high-relief 21
topography of the coastline accelerated tsunami outflow. 22
Publisher: GSA
Journal: GEOL: Geology
Article ID: G30172
Page 2 of 15
INTRODUCTION 23
To study the full impact of tsunamis on coastal geomorphology, it is essential to 24
understand their role in both addition and removal of coastal sediment. However, most 25
studies of tsunami geology have focused on tsunami deposition rather than erosion 26
(Bourgeois, 2009). Yet on certain coastlines, tsunamis may be important geomorphic agents, 27
causing long-term changes in coastal systems. Pre- and post-tsunami measurements of 28
coastal geomorphology are necessary in order to calculate coastal change and sediment 29
movement during a tsunami— topics of utmost interest to the tsunami community (c.f. 30
Gelfenbaum and Jaffe, 2003; Jaffe and Gelfenbaum, 2007; Huntington et al., 2007) and of 31
broad interest to coastal geomorphologists (Dawson, 1994; Kench et al., 2008). 32
Tsunami-induced erosional changes of coastlines have been difficult to quantify 33
because pre-event controls are lacking (c.f. Dawson, 1994; Choowong et al., 2007; Umitsu et 34
al., 2007). To date, the only quantified before-and-after studies are beach profiles and atoll-35
island surveys from the 2004 Indian Ocean tsunami in southwestern India and the Maldives 36
(Kurian et al., 2006; Kench et al., 2006; 2008). Also, Gelfenbaum and Jaffe (2003) estimated 37
depth of erosion by the 1998 Papua New Guinea tsunami from exposed tree roots. 38
Despite the few quantified studies, many qualitative observations suggest that most 39
tsunami-induced changes in coastal geomorphology are driven by erosion, during either 40
inflow or outflow. Erosional changes to a landscape can be temporary (Kurian et al., 2006), 41
permanent (Andrade, 1992), or continue an ongoing trend (Kench et al., 2006, 2008). 42
Tsunamis remove vegetation and damage man-made structures (Dawson, 1994; Maramai and 43
Tinti, 1997). Tsunami erosion causes beach retreat either as large-scale scour features or as 44
smaller scallops (Dawson, 1994; Gelfenbaum and Jaffe, 2003; Kench et al., 2006; Kurian et 45
Publisher: GSA
Journal: GEOL: Geology
Article ID: G30172
Page 3 of 15
al., 2006; Umitsu et al., 2007; Choowong et al., 2007). Tsunamis breach beach berms and 46
other ridges, or erode the surface uniformly (Andrade, 1992; Dawson, 1994; Maramai and 47
Tinti, 1997; Gelfenbaum and Jaffe, 2003; Choowong et al., 2007; Umitsu et al., 2007). They 48
also alter drainage patterns by widening river mouths and creating new drainage networks, 49
especially from topographic lows (Andrade, 1992; Maramai and Tinti, 1997; Umitsu et al., 50
2007). 51
From a geologically fortuitous series of field seasons bracketing the 15 November 52
2006 Kuril Island tsunami, we have been able to quantify tsunami erosion as well as 53
deposition. In four examples of detailed topographic profiles from before and after the 54
tsunami, as well as in numerous post-tsunami study sites, erosion was the primary response 55
of the coastline to the 2006 tsunami in the Kuril Islands. Dominant motion of sediment was 56
offshore, resulting in significant alteration of coastal geomorphology in some areas. 57
BACKGROUND 58
We surveyed coastlines on the Kuril Islands in summers of 2006-2008, focusing on 59
paleotsunami records and coastal geomorphology as a part of the multi-disciplinary Kuril 60
Biocomplexity Project (KBP). The Kurils are a volcanically active arc with many small 61
islands in the central region (Fig. 1). Accordingly, dominant coastal geomorphologies are 62
rocky cliffs or boulder to gravel beaches, with some sandy embayments. 63
Between our first and second field seasons, the 15 November 2006 earthquake (Mw 64
8.1 – 8.4) in the Kuril-Kamchatka subduction zone (Fig. 1) produced a large tsunami (Fujii 65
and Satake, 2008; Ammon et al., 2008). Following the November events, an outer-rise 66
earthquake occurred on 13 January 2007 (Mw 7.9–8.1), adjacent to the 2006 rupture zone 67
(Ammon et al., 2008; Fujii and Satake, 2008), also generating a tsunami. These tsunamis 68
Publisher: GSA
Journal: GEOL: Geology
Article ID: G30172
Page 4 of 15
partially refocused our field efforts in 2007 and 2008 to include post-tsunami surveys and 69
detailed examination of tsunami-caused change. 70
Until our post-tsunami surveys, there were no runup data from the uninhabited central 71
Kuril Islands. However, around the Pacific Rim, tide gauges recorded tsunami amplitudes 72
from the November 2006 event (archived for 113 locations by the National Geophysical Data 73
Center (NGDC) Global Tsunami Database), ranging from <0.1 m (Solomon Islands) to 1.76 74
m (Crescent City, CA). The ensuing (January 2007) tsunami was on average three times 75
smaller than the 2006 tsunami on tide gauges in the NGDC database. 76
METHODS 77
Our 2006 (pre-tsunami) survey focused on open embayments where paleotsunami 78
records could be preserved, limiting quantified pre- and post-tsunami comparisons to three 79
sandy beach-ridge plains open to the Pacific—Dushnaya Bay on northern Simushir Island, 80
and South Bay and Ainu Bay on Matua Island (Figs. 1, 2). All contain beach ridges greater 81
than 5 m above mean sea level. These sites are vegetated primarily with beach rye (Elymus 82
arenarius) and coastal-meadow grasses and flowers. All three sites were trenched by military 83
in WWII, which locally allowed enhancement of tsunami erosion and deposition; for the 84
purpose of this study, we avoided these anthropogenic effects where possible. 85
Because 10 months (September-June) passed between 2006 and 2007 field 86
observations, we must address the question of whether the 2006 tsunami was the primary 87
agent of observed changes. Other possible agents include the 2007 Kuril tsunami, storms, and 88
seasonal wave regime. Seasonal effects are controlled for by our repeat survey in 2008. 89
Moreover, there was a lack of large regional storms between field seasons (DRText; Figs. 90
Publisher: GSA
Journal: GEOL: Geology
Article ID: G30172
Page 5 of 15
DR2, DR3). We reason that the January 2007 tsunami caused little change because it was 91
much smaller and occurred when the shoreline was frozen (MacInnes et al., 2009). 92
Post-tsunami survey teams in summers of 2007 and 2008 documented tsunami 93
inundation (local maximum penetration distance), runup (elevation above mean sea level at 94
inundation), erosion, and deposition. We surveyed 9 sites visited in 2006 or earlier, and 18 95
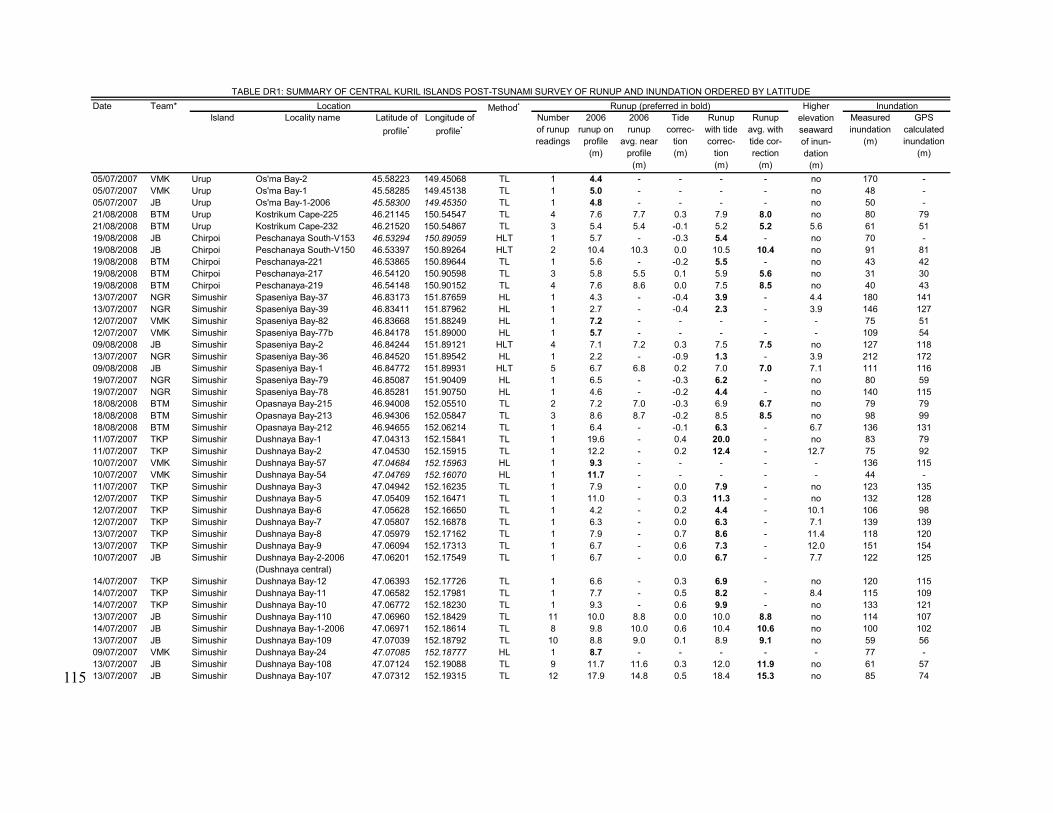
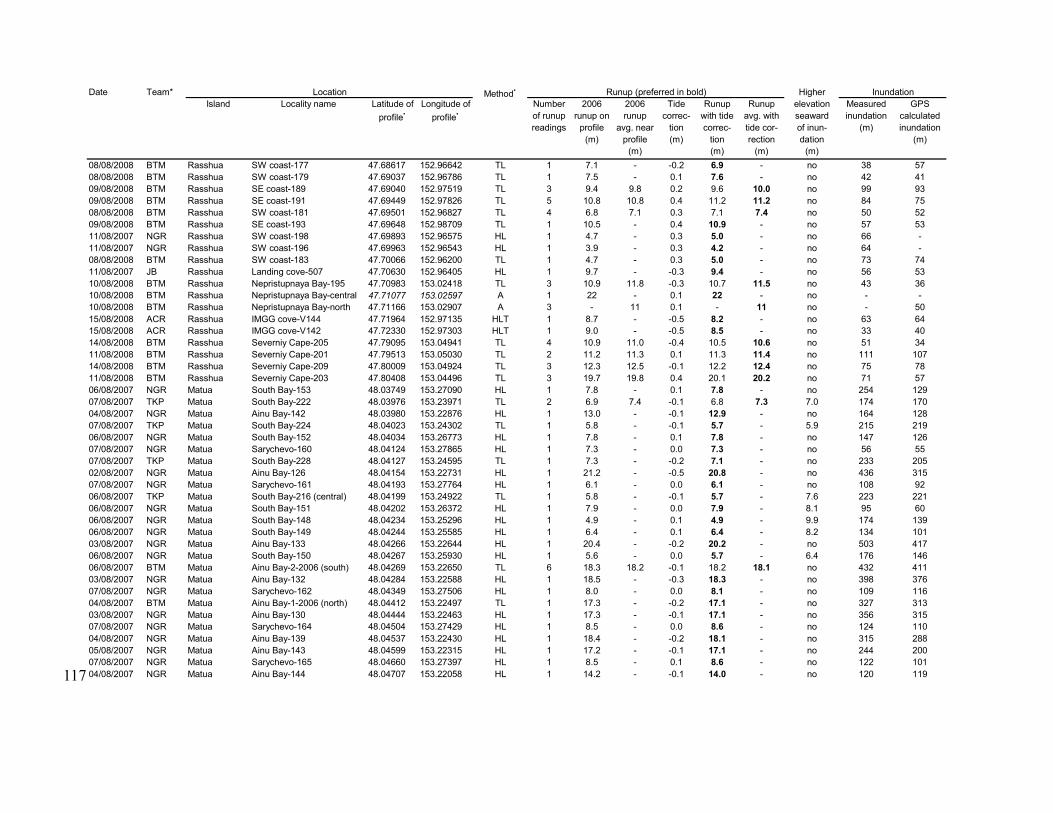
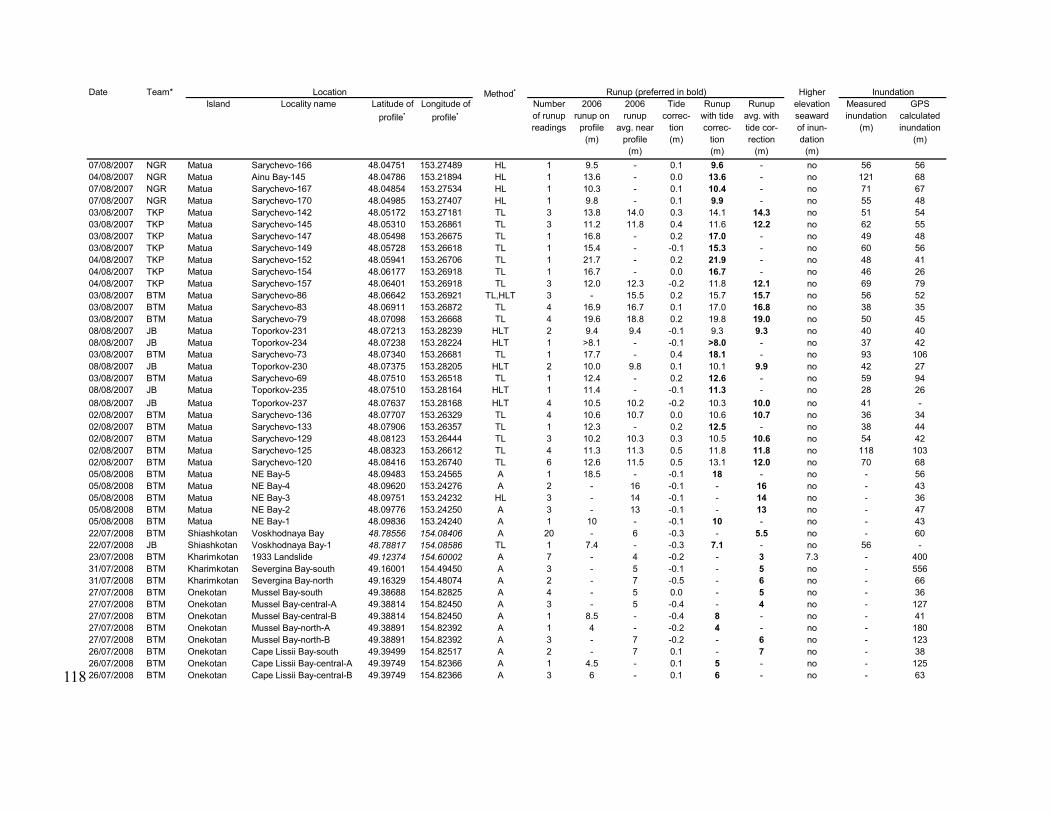
new sites, measuring in total 192 runup transects along a distance of ~600 km (Fig. 1; Table 96
DR1) We identified tsunami inundation and runup by the farthest inland wrackline of 97
floatable debris. Nearfield measurements of tsunami runup average 10 m and range up to 22 98
m (Table DR1). 99
We quantified erosional change on four 2006 topographic profiles (Figs. 1, 3) by re-100
measuring the profiles using a transit and rod; to relocate we used a combination of 101
landmarks such as trenches and ridge crests, and GPS. On many other profiles, we described 102
and recorded the position of erosional features, measured thicknesses of tsunami deposits, 103
and documented the deposit’s landward-most extent (Table 1). For more on method, see 104
Table DR1 and MacInnes et al. (2009). 105
OBSERVATIONS 106
The 2006 Kuril Island tsunami altered the coastline of the central Kurils in sandy 107
embayments and on boulder beaches. The three sandy embayments focused on in this 108
study—Dushnaya, South and Ainu bays—experienced a range of tsunami size, from low 109
runup (<8 m) to high (>15 m) and exhibited a range of erosional and depositional features. 110
We observed a greater volume of erosion and deposition where runup was higher 111
(Table 1; Fig. DR4) and fewer erosional features where runup was lower. In Dushnaya Bay, 112
the tsunami was smaller in the center (Fig. 1), with runup of 5–20 m and inundation of 40–113

Publisher: GSA
Journal: GEOL: Geology
Article ID: G30172
Page 6 of 15
150 m (Table DR1). Central Dushnaya Bay, the location of a before-and-after profile (Fig. 114
3A), recorded ~6-9 m runup and ~100-150 m inundation, erosion was limited and a sand 115
sheet preserved (Table 1). Runup in South Bay was low (5–8 m), with inundation of ~100–116
200 m (Table DR1). We found tsunami deposits almost as far as water carried debris, with 117
patches of erosion on vegetated beach ridges (Fig. 3B; Table 1). In Ainu Bay, runup was 118
typically 14–20 m, with inundation up to ~500 m (Table DR1), generating massive erosion, 119
with erosional patches extending farther inland than we found tsunami deposits (Table 1). 120
Sediment Removal and Erosional Features 121
Low Runup 122
Erosion in central Dushnaya Bay (Fig. DR1) can be generalized as small-scale retreat 123
of the back-beach scarp (Fig. DR6), surficial sediment removal in areas lacking cohesive 124
soils, and local scour associated with focused water withdrawal, especially into stream 125
channels. At one point, the tsunami breached the seaward beach ridge. Comparison of before 126
and after profiles (Fig. 3A) could not resolve landward retreat of the beach scarp, although 127
nearby we measured up to 3 m of retreat . The only quantifiable change on the profiles was 128
on the unvegetated beach (Fig. 3A), where ~5 m3 (per unit width) of sediment had been 129
removed between 2006 and 2007 (Table 1). 130
In South Bay, before and after profiles (Figs. 3B, DR10) show a significant difference 131
in the active beach, with ~50 m3 (per unit width) of sediment missing in 2007. In beach-ridge 132
troughs along the profile, our 2006 excavated turf blocks and some flagging tape remained 133
virtually undisturbed in 2007. Small, shallow patches of erosion on high points up to 160 m 134
inland (Table 1) and larger ones elsewhere in South Bay were on seaward sides of beach 135
Publisher: GSA
Journal: GEOL: Geology
Article ID: G30172
Page 7 of 15
ridges. Along the shoreline away from the profile, the tsunami removed blocks of turf off the 136
back-beach scarp. 137
High Runup 138
Much of the erosion in Ainu Bay can be considered persistent geomorphic change 139
(Figs. DR11–14). The tsunami removed ~200 m3 (per unit width) of sediment along the Ainu 140
Bay reoccupied profiles (Fig. 3C,D, Table 1). On both profiles, continuous, deep erosion of 141
vegetation and sediment occurred for ~160 m inland, including landward widening of the 142
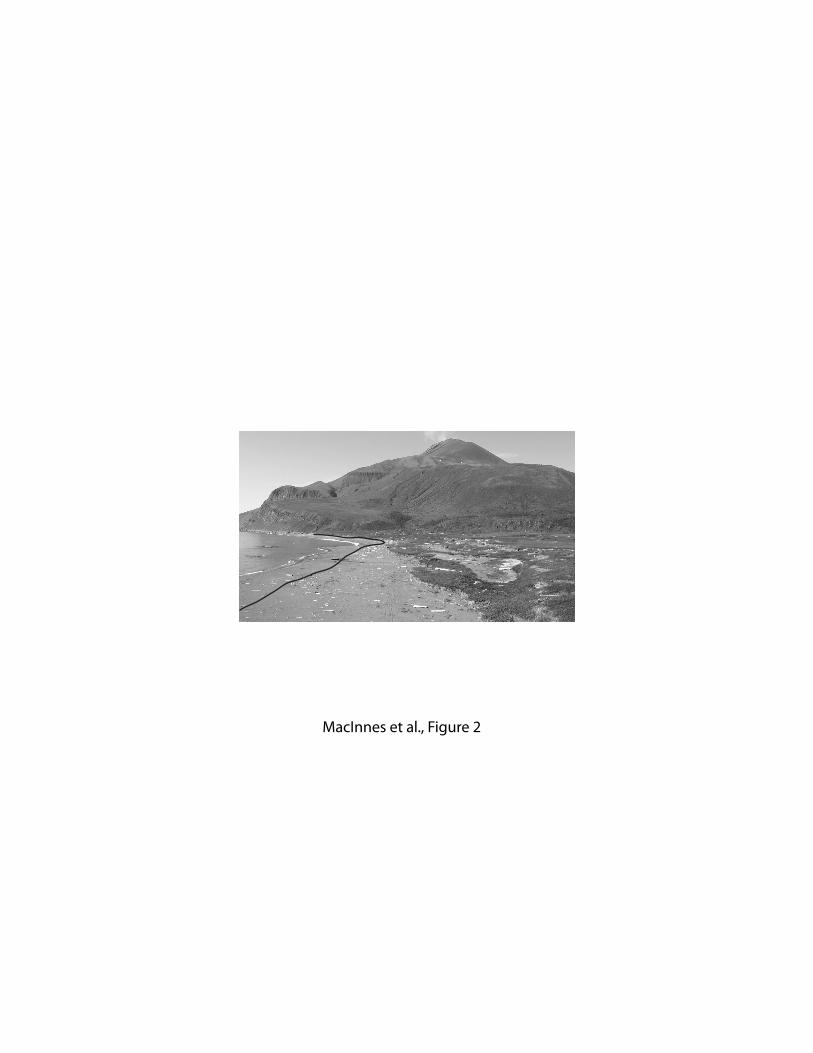
beach by up to 55 m (Figs. 2, 3D) via back-beach cliff retreat. The tsunami removed 143
seaward-most beach ridges, reduced others in size, and eroded seaward-facing slopes 144
primarily by stripping young, sandy sediment off the surface (Fig. 3C,D). As a particular 145
example, a continuous scour extending over 100 m laterally formed on a seaward-facing 146
slope of compact soil (at 160 m inland in Figure 3C; Fig. DR13). 147
Throughout Ainu Bay, smaller-scale but still dramatic erosion included patches of 148
eroded soil and stripped vegetation up to 5 m in diameter. Eroded patches were especially 149
associated with rodent burrow networks and volcanic cinder layers below the sod, both of 150
which facilitated soil stripping. These patches were common at the bases of slopes, some 151
even landward of a recognizable tsunami deposit (Table 1). In areas with sandy soils, 152
gullying and scouring were common where the tsunami was steered by low-lying 153
topography. The tsunami also breached and drained a lake (Fig. 3D, DR14). Most indicators 154
of flow direction, such as plunge pools and gullies, primarily recorded outflow; some, such 155
as a flipped-over sod, recorded inflow. 156
Sediment Deposition 157

Publisher: GSA
Journal: GEOL: Geology
Article ID: G30172
Page 8 of 15
Irrespective of tsunami runup height and inundation distance, there was evidence of 158
deposition on all studied sites (Fig. 3; Table 1). Where sand was available along the shore, 159
the tsunami deposited a landward thinning, continuous sheet of that sand across vegetated 160
surfaces. Sand deposits averaged 2.5 cm thick (20 cm maximum) and were generally thicker 161
in beach-ridge troughs than on crests. Along the sandy beach ridges of Dushnaya, South and 162
Ainu bays, the tsunami added a thin veneer of sediment, ~1-6 m3 per unit width of profile 163
(Table 1). Shorelines along boulder to gravel beaches exhibited patchy tsunami deposits of 164
pebbly gravel, and relocated cobbles and boulders generally <1 m diameter. On most 165
shorelines, the tsunami eroded and deposited blocks of sod, more abundant and larger (up to 166
3 m diameter) on coarser-grained shorelines. 167
Sandy tsunami deposits were nearly as extensive as the tsunami (Table 1). The 168
maximum elevation of deposits was on average 90% of runup elevation, and never <71% (a 169
case with limited sand supply). The landward terminus of the deposit averaged 95% of 170
tsunami inundation (as marked by floated debris); the horizontal difference was <10 m in 171
nine cases, and at most 22 m (Table 1). 172
Deposition versus Erosion 173
Even with ubiquitous deposition, less sediment was deposited than eroded on every 174
profile studied in detail. In the eight cases with measured volumes (per unit width) of both 175
erosion and deposition, the amount of tsunami-transported sand preserved on the coastal 176
plain was usually <10% of that eroded (Table 1); only one of those profiles exhibited focused 177
erosion (Profile 2 in Dushnaya Bay; Figs. DR1, DR9). Even in Dushnaya Bay, where the 178
tsunami was the smallest, erosion the least, and deposition the most extensive, about three 179
times more sediment was removed from the coast then deposited on land. 180

Publisher: GSA
Journal: GEOL: Geology
Article ID: G30172
Page 9 of 15
DISCUSSION AND CONCLUSIONS 181
Our survey of tsunami deposits in the Kuril Islands strengthens the argument that on 182
sandy shorelines tsunami-deposit extent can be used as proxy for tsunami runup and 183
inundation (Table 1; Martin et al., 2008), provided the pre-tsunami shoreline position can be 184
reconstructed. Recent post-tsunami studies of low-relief coastlines have shown that tsunami 185
deposits commonly extend to 90% of water runup and inundation limits (Table DR2). On the 186
high-relief coastlines of the Kuril Islands, tsunami deposits are equally representative of 187
onshore tsunami metrics. 188
The volume of tsunami erosion is related to tsunami runup, distance from shore, and 189
topography; vegetation and local roughness can clearly be factors as well, but in our study 190
they do not measurably vary. That greatest erosion from tsunamis occurs closer to the shore 191
is a common observation of post-tsunami surveys (cf. Gelfenbaum and Jaffe, 2003; Umitsu et 192
al., 2007). Farther from the shore (100s of m in the Ainu Bay case), patches of erosion 193
typically occur where the topography generates local water acceleration, enhancing the 194
erosive capacity of tsunamis. 195
Some erosional features generated by tsunamis should become preserved 196
geomorphology. In Ainu Bay, the removal of the seaward beach ridges, breaching of a lake 197
and development of inland scours should all be visible for decades or centuries. Indeed, 198
previous (undated) instances of deep coastal erosion and breached lakes can be seen in Ainu 199
Bay stratigraphy (Fig. DR11). Even in cases of relatively low runup, breached beach ridges 200
should remain discontinuous, and we have observed such breaches in older beach ridges in 201
Dushnaya Bay and also along the Pacific coast of Kamchatka. 202
Publisher: GSA
Journal: GEOL: Geology
Article ID: G30172
Page 10 of 15
Our findings agree with previous studies indicating that net direction of tsunami 203
sediment transport is dependent on capacity of the coastline to generate backwash or offshore 204
flow (Umitsu et al., 2007). Tsunamis flowing over low-relief coastlines (Kurian et al., 2006; 205
Gelfenbaum and Jaffe, 2003) generated net onshore transport. On high-relief coastlines such 206
as the Kuril Islands, tsunami backwash can be accelerated to a greater velocity than on low-207
relief topography, thereby generating net offshore transport. The case where a tsunami 208
completely overtops low-relief islands, as in the 2004 Indian Ocean tsunami washing over 209
the low-relief Maldives, is more complex (Kench et al., 2008). 210
For the first time, a group of tsunami geologists surveyed a coast both before and 211
after a large tsunami. Our quantitative comparison of erosional and depositional volumes is 212
this case showed that erosion clearly dominated deposition. Nevertheless, geologists 213
interpreting paleotsunamis should be reassured that deposits can be a reliable proxy for 214
tsunami runup and inundation, though the necessary paleogeographic reconstruction remains 215
challenging, especially in light of tsunami erosion. Our data and analyses are also significant 216
for geologists interested in understanding tsunami flow properties, in defining tsunami 217
erosion and deposition patterns (tsunami geomorphology), and in determining coastal 218
geologic histories in tsunami-affected regions. Moreover, while the central Kurils are 219
currently uninhabited, this study may help explain why there are fewer coastal archaeological 220
sites on the Pacific side of the Kurils. It also provides important information about tsunami 221
hazard on high-relief coastlines around the world. 222
ACKNOWLEDGMENTS 223
Funding for fieldwork was provided by the Kuril Biocomplexity Project (NSF 224
grant #0508109, PI- Ben Fitzhugh) and by the Institute of Marine Geology and 225

Publisher: GSA
Journal: GEOL: Geology
Article ID: G30172
Page 11 of 15
Geophysics, FED RAS, Yuzhno-Sahkalinsk, Russia (Director- Boris Levin). For field 226
assistance, we thank Sergei Chirkov, Misty Nikula, Mike Etnier, and Jesse Einhorn. We 227
thank Cecilia Bitz for helping us recover weather data from the region, and we appreciate 228
thorough reviews by Brian McAdoo, Martitia Tuttle and two anonymous reviewers. 229
REFERENCES CITED 230
Ammon, C.J., Kanamori, H., and Lay, T., 2008, A great earthquake doublet and seismic 231
stress transfer cycle in the central Kuril islands: Nature v. 451, p, 561–566. 232
Andrade, C., 1992, Tsunami generated forms in the Algarve Barrier Islands: Science of 233
Tsunami Hazards v. 10, p, 21–34. 234
Apel, E.V., Burgmann, R., Steblov, G., Vasilenko, N., King, R., and Prytkov, A., 2006, 235
Independent active microplate tectonics of northeast Asia from GPS velocities and block 236
modeling: Geophysical Research Letters, v. 33, p. L11303, doi: 237
10.1029/2006GL026077. 238
Bourgeois, J., 2009, Geologic effects and records of tsunamis, in The Sea: Volume 15, 239
Tsunamis (eds. Bernard, E.N. and Robinson, A.R.), Harvard University Press, 55–91. 240
Choowong, M., Murakoshi, N., Hisada, K., Charusiri, P., Daorerk, V., Charoentitirat, T., 241
Chutakositkanon, V., Jankaew, K., and Kanjanapayont, P., 2007, Erosion and Deposition 242
by the 2004 Indian Ocean Tsunami in Phuket and Phang-nga Provinces, Thailand: 243
Journal of Coastal Research v. 23, p, 1270–1276. 244
Dawson, A.G., 1994, Geomorphological effects of tsunami run-up and backwash: 245
Geomorphology v. 10, p, 83–94. 246
Fedotov, S.A., Chernyshev, S.D., and Chernysheva, G.V., 1982, The Improved 247
Determination of the Source Boundaries for Earthquakes of M>7.75, of the Properties of 248
Publisher: GSA
Journal: GEOL: Geology
Article ID: G30172
Page 12 of 15
the Seismic Cycle, and of Long-term Seismic Prediction for the Kurile-Kamchatka Arc: 249
Earthquake Prediction Research, v. 1, p. 153–171. 250
Fujii, Y., and Satake, K., 2008, Tsunami Sources of the November 2006 and January 2007 251
Great Kuril Earthquakes: Bulletin of the Seismological Society of America v. 98, p, doi: 252
10.1785/0120070221. 253
Gelfenbaum, G., and Jaffe, B., 2003, Erosion and Sedimentation from the 17 July 1998 254
Papua New Guinea Tsunami: Pure and Applied Geophysics, v. 160, p. 1969–1999, doi: 255
10.1007/s00024-003-2416-y. 256
Huntington, K., Bourgeois, J., Gelfenbaum, G., Lynett, P., Jaffe, B., Yeh, H., and Weiss, R., 257
2007, Sandy signs of a tsunami’s onshore depth and speed: Eos, Transactions, American 258
Geophysical Union, v. 88, no. 52, p. 577–578, doi: 10.1029/2007EO520001. 259
Jaffe, B., and Gelfenbaum, G., 2007, A simple model for calculating tsunami flow speed 260
from tsunami deposits: Sedimentary Geology, v. 200, p. 347–361, doi: 261
10.1016/j.sedgeo.2007.01.013. 262
Kench, P.S., McLean, R.F., Brander, R.W., Nichol, S.L., Smithers, S.G., Ford, M.R., Parnell, 263
K.E., and Aslam, M., 2006, Geological effects of tsunami on mid-ocean atoll islands: 264
The Maldives before and after the Sumatran tsunami: Geology, v. 34, p. 177–180, doi: 265
10.1130/G21907.1. 266
Kench, P.S., Nichol, S.L., Smithers, S.G., McLean, R.F., and Brander, R.W., 2008, Tsunami 267
as agents of geomorphic change in mid-ocean reef islands: Geomorphology v. 95, p, 268
361–383. 269

Publisher: GSA
Journal: GEOL: Geology
Article ID: G30172
Page 13 of 15
Kurian, N.P., Pillai, A.P., Rajith, K., Murali Krishnan, B.T., and Kalaiarasan, P., 2006, 270
Inundation characteristics and geomorphological impacts of December 2004 tsunami on 271
Kerala coast: Current Science, v. 90, p. 240–249. 272
MacInnes, B.T., Pinegina, T.K., Bourgeois, J., Razhegaeva, N.G., Kaistrenko, V.M., and 273
Kravchenovskaya, E.A., 2009, Field survey and geological effects of the 15 November 274
2006 Kuril tsunami in the middle Kuril Islands: Pure and Applied Geophysics, v. 166, 275
Maramai., A., and Tinti, S., 1997, The 3 June 1994 Java Tsunami: A Post-Event Survey 276
of the Coastal Effects: Natural Hazards v. 15, p, 31–49. 277
Martin, M.E., Weiss, R., Bourgeois, J., Pinegina, T.K., Houston, H., and Titov, V.V., 2008, 278
Combining constraints from tsunami modeling and sedimentology to untangle the 1969 279
Ozernoi and 1971 Kamchatskii tsunamis: Geophysical Research Letters, v. 35, 280
p. L01610, doi: 10.1029/2007GL032349. 281
Umitsu, M., Tanavud, C., and Patanakanog, B., 2007, Effects of landforms on tsunami flow 282
in the plains of Banda Aceh, Indonesia, and Nam Khem, Thailand: Marine Geology, 283
v. 242, p. 141–153, doi: 10.1016/j.margeo.2006.10.030. 284
FIGURE CAPTIONS 285
Figure 1. A. Historical tsunamigenic earthquakes on the Kuril-Kamchatka trench, after 286
Fedotov et al. (1982). The 2007 earthquake was an outer-rise event in the Pacific Plate; all 287
others occurred on the Pacific/Okhostk plate interface. B. Tectonic setting of the region, after 288
Apel et al. (2006); velocities on plate boundaries are in mm/yr. Area of (A) is shown by a 289
shaded rectangle. C. Runup elevation in meters from the 2007 and 2008 post-tsunami 290
surveys (Table DR1) for the shaded area of islands in (A). 291

Publisher: GSA
Journal: GEOL: Geology
Article ID: G30172
Page 14 of 15
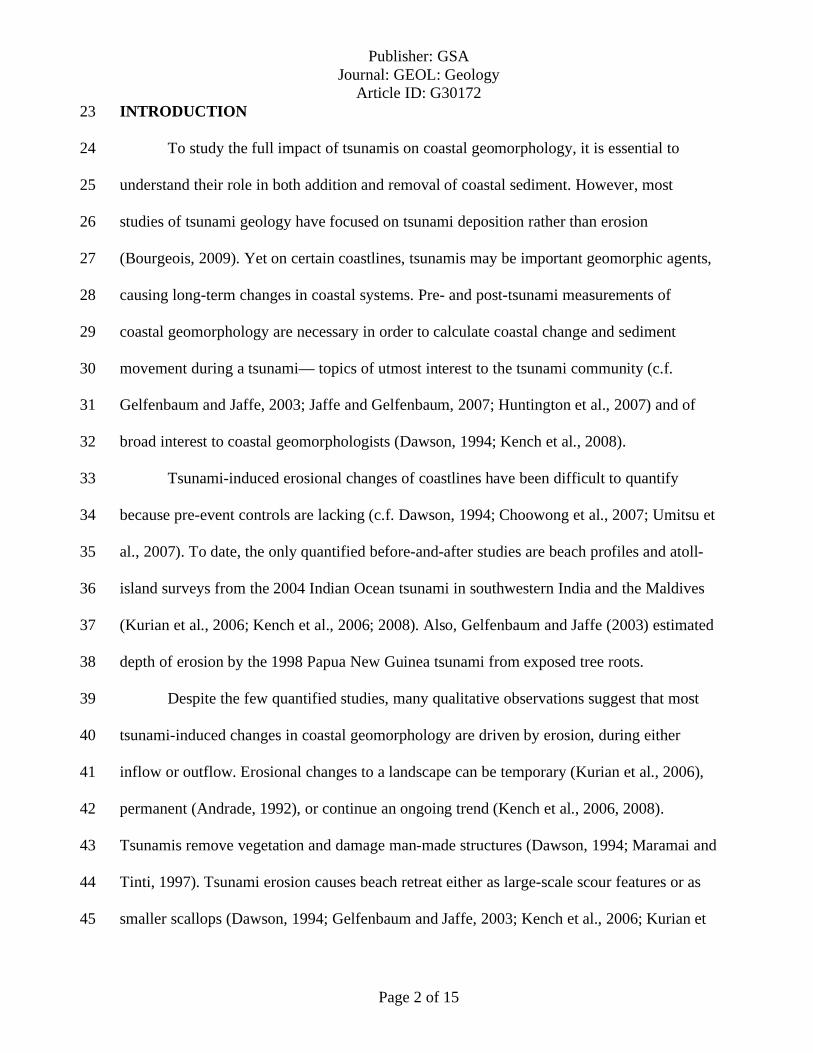
Figure 2. Post-tsunami (2007) view of Ainu Bay, Matua (Fig. 1). Black line marks seaward 292
extent of vegetation in 2006. 293
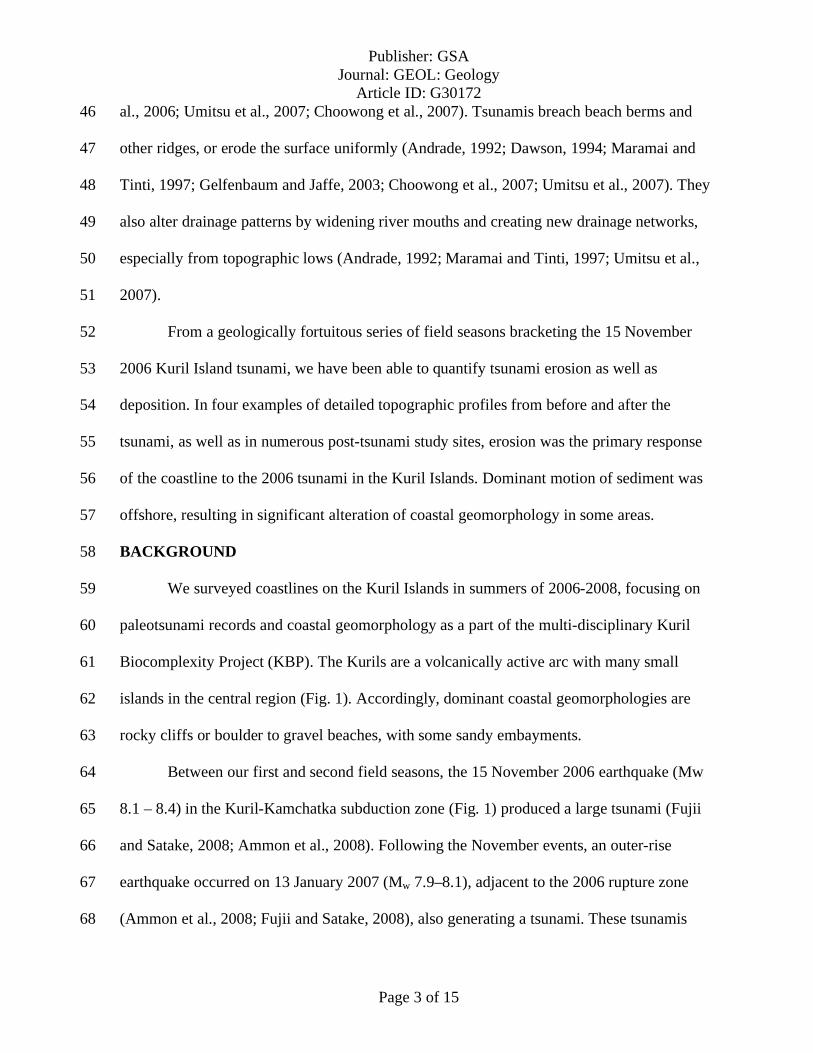
Figure 3. Before (2006) and after (2007) topographic profiles from Dushnaya Bay, Simushir 294
Island ((A)) and South Matua Island ((B), (C), (D)) (locations on Fig. 1, DR1). (A) and (B) 295
are cases of low runup and (C) and (D) of high runup. “First vegetation” refers to the 296
seaward limit of vegetation covering the surface; on (A) and (B), the location of first 297
vegetation did not significantly change between 2006 and 2007. On (D) the lake was present 298
in 2006 but not in 2007; in the area marked “not measured,” seaward-derived sand deposits 299
were mixed with locally eroded cinders and gravel. Additional images: (A): Figures DR5–6. 300
(B): Figure DR10. (C): Figures DR11–13. (D): Figure DR3, DR14. 301
302
Publisher: GSA
Journal: GEOL: Geology
Article ID: G30172
Page 15 of 15
302
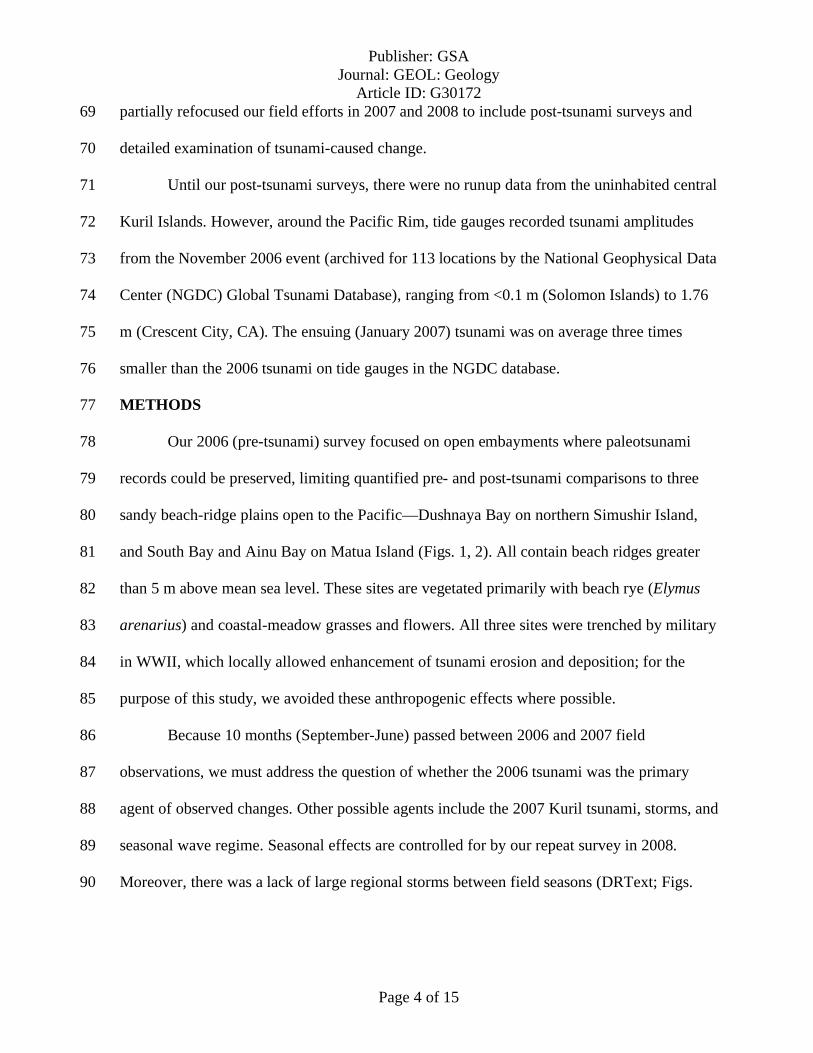
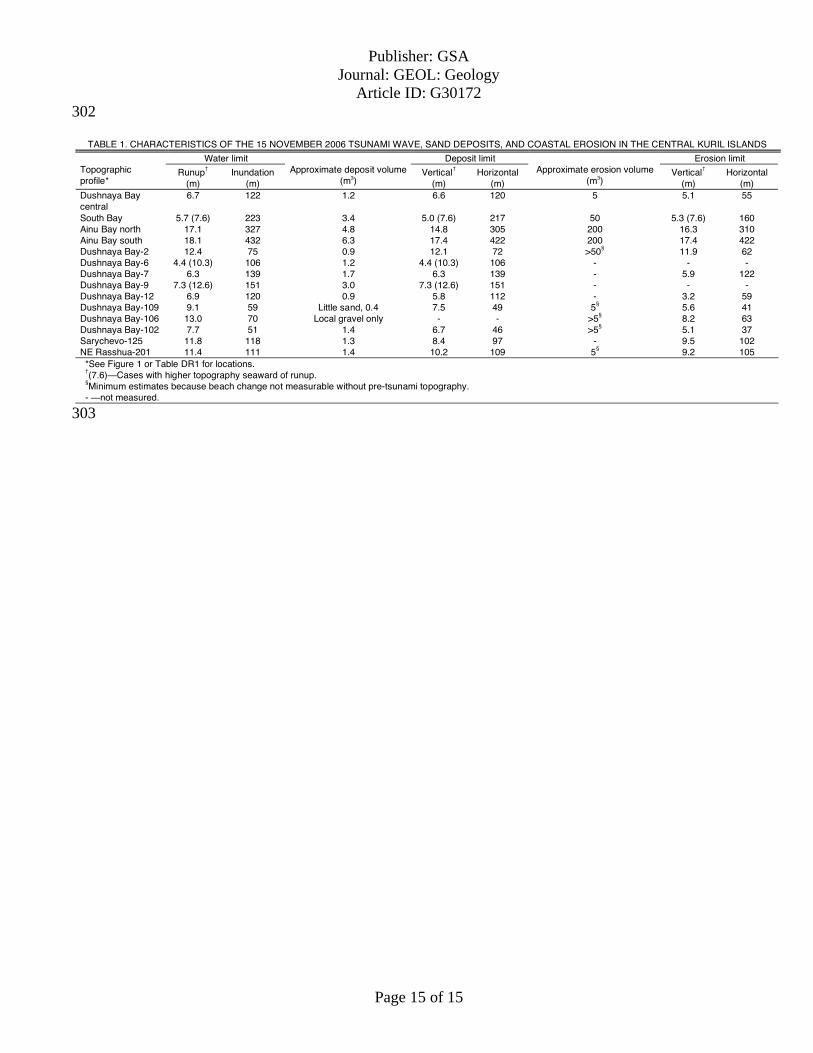
TABLE 1. CHARACTERISTICS OF THE 15 NOVEMBER 2006 TSUNAMI WAVE, SAND DEPOSITS, AND COASTAL EROSION IN THE CENTRAL KURIL ISLANDS
Water limit Deposit limit Erosion limit Topographic profile*
Runup† (m)
Inundation (m)
Approximate deposit volume (m3)
Vertical† (m)
Horizontal (m)
Approximate erosion volume (m3)
Vertical† (m)
Horizontal (m)
Dushnaya Bay central
6.7 122 1.2 6.6 120 5 5.1 55
South Bay 5.7 (7.6) 223 3.4 5.0 (7.6) 217 50 5.3 (7.6) 160 Ainu Bay north 17.1 327 4.8 14.8 305 200 16.3 310 Ainu Bay south 18.1 432 6.3 17.4 422 200 17.4 422 Dushnaya Bay-2 12.4 75 0.9 12.1 72 >50§ 11.9 62 Dushnaya Bay-6 4.4 (10.3) 106 1.2 4.4 (10.3) 106 - - - Dushnaya Bay-7 6.3 139 1.7 6.3 139 - 5.9 122 Dushnaya Bay-9 7.3 (12.6) 151 3.0 7.3 (12.6) 151 - - - Dushnaya Bay-12 6.9 120 0.9 5.8 112 - 3.2 59 Dushnaya Bay-109 9.1 59 Little sand, 0.4 7.5 49 5§ 5.6 41 Dushnaya Bay-106 13.0 70 Local gravel only - - >5§ 8.2 63 Dushnaya Bay-102 7.7 51 1.4 6.7 46 >5§ 5.1 37 Sarychevo-125 11.8 118 1.3 8.4 97 - 9.5 102 NE Rasshua-201 11.4 111 1.4 10.2 109 5§ 9.2 105 *See Figure 1 or Table DR1 for locations. †(7.6)—Cases with higher topography seaward of runup. §Minimum estimates because beach change not measurable without pre-tsunami topography. - —not measured.
303

154°E
48°
150°
Kuril-Kamchatka tre
nch
1973 1969
1958
1918
1915
1952
Kunashir
Iturup
Urup
Onekotan
Paramushir
1918
A.
1978
19631963
44°N
Simushir
Rasshua
KetoiUshishir
Matua
5101520
0
C. Simushir Matua
Shiashkotan
Kharimkotan
Chirpoi
B.
Sim
ush
ir
Matua
N
DushanyaBay
SouthBay
AinuBay
N
10 km2006
2007
MacInnes et al., Figure 1
MacInnes et al., Figure 2

Mud
cap
D. Ainu Baysouth
Lake (2006)
B. South Bay First vegetation
C. Ainu Baynorth
Last erosion
Last erosion
Last erosion
First vegetation (2006)
First vegetation (2007)
First vegetation (2006)
First vegetation (2007)
2006 profile
2007 profile
Thickness
DEPOSITION
EROSION
Key
No deposit
Runup
Samplelocation
5 cm
5 cm
5 cm
A. DushnayaBay centralFirst vegetation
Last erosion
5
10
15
20
5 cm
Ele
vatio
n (m
)
Distance (m)
Not measured
100 200 300 400
5
10
15E
leva
tion
(m)
5
10
15
20
Ele
vatio
n (m
)
5
10
15
20
Ele
vatio
n (m
)
MacInnes et al., Figure 3
Data Repositoryfor
Tsunami geomorphology: erosion and deposition from the 15 November 2006 Kuril Island tsunami
MacInnes, Breanyn T.Bourgeois, Joanne
Pinegina, Tatiana K.Kravchunovskaya, Ekaterina A.
Discussion—Were all observed changes from the 2006 tsunami? Because 10 months (September-June) passed between field observations, we must
address the question of whether the 2006 tsunami was the primary cause of observed changes. Other possible agents acting during these unobserved periods include the 2007 Kuril tsunami, erosion and deposition due to storms, and seasonal beach-profile variations. We reason that 2006 did cause most observed changes, based on the smaller size of the 2007 tsunami, on the fact that the 2007 tsunami occurred when the shoreline was frozen, and on the lack of large regional storms between field seasons.
We reason that the 2007 Kuril tsunami had little impact on the coastline because of its relative size and because of the time of year (MacInnes et al., 2009). Field observations suggest that the 2007 Kuril tsunami had runup of less than 5 m (MacInnes et al., 2009), making its influence on much of the vegetated coastline negligible. Moreover, the average temperature in the central Kurils between the 2006 and 2007 tsunamis was -3 to -6 ºC1, resulting in a frozen upper beach and coastal plain at the time of the 2007 tsunami, inhibiting marked erosion.
We also reason that all measured change above and most measured change below storm high tide (defined by the presence of dense vegetation and seaweed wracklines) resulted from the 2006 tsunami and not from storms. Storms affecting the coasts of Kurils in 2006, 2007, and 2008 were not abnormally large and therefore likely did not cause measurable changes above storm wracklines observed in 2006 or on the vegetated coastal plain. Wind speed records suggest no unusual storms occurred in the field area between the pre- and post- tsunami surveys (Fig. DR2). Also, in 2007 and 2008 surveys we observed no fresh storm effects beyond the beach on coastlines where the tsunamis also did not surpass the beach.
Below storm high tide, beaches may actively change (c.f. Shepard et al., 1950), and in our study, we did not measure winter-beach profiles, but we argue that the 2006 tsunami is also responsible for most beach-profile changes because the beaches did not recover between 2007 and 2008 (Fig. DR3).
Post-tsunami survey data—runup and inundationA compilation of all field measurements of runup and inundation from the 2007 and 2008
(post-tsunami) field seasons is presented in Table DR1. Most measurements made in 2007 were previously reported in MacInnes et al. (2009), but with fewer columns (thus omitting some observations). The data from the 2008 field season are newly reported here.
Supplemental field observations, data and photographs
1Based on four-times daily temperature records; NCEP Reanalysis data provided by the NOAA/OAR/ESRL PSD, Boulder, Colorado, USA, from their Web site at http://www.cdc.noaa.gov/
123456789
10
11121314151617181920212223242526272829303132333435363738394041424344
12
Volume of erosion and deposition. In cases where we could quantify the volume of erosion or deposition along a profile (reported as m3 per unit width), we plotted those estimates relative to runup and to runup times inundation, the latter an approximation of onland tsunami volume (Fig. DR4). We calculated the volume of tsunami erosion along a profile by measuring the area missing in 2007/2008 below profile lines measured in or reconstructed from 2006 (e.g., Figs. 3). We calculated deposit volume along a profile by taking measured thickness of fresh tsunami deposits at survey points (as in Figure 3) and integrating between them to generate the cross-sectional area covered by tsunami deposit along a given profile. We assigned ±10% error to the calculations. There is not a robust correlation of runup to volume of erosion and deposition for runup of less than 13 m (Fig. DR4A); the higher runup in Ainu Bay clearly produced greater geomorphic change. There is a better trend shown by comparing erosion and deposition volumes to runup times inundation (Fig. DR4B), which is a better overall scale of tsunami size. In Fig. DR4B, however, there is an even larger gap between the high numbers of Ainu Bay and the rest of the data.
Additional illustrations of tsunami effects. While the Dushnaya Central profile (Fig. 3) on Simushir Island was virtually unchanged across its vegetated surface (Fig. DR5), the tsunami rearranged the beach and locally eroded the beach scarp (Fig. DR6). In northern Dushnaya Bay, runup was higher, with common stripping of turf and soil (Fig. DR7) and deposition of gravel (Fig. DR8). In southern Dushnaya Bay, a very steep, sandy profile exhibited dramatic local erosional scours and enlarged drainage (Fig. DR9). The effects on the shoreline along South Bay, Matua Island (Fig. DR10), were similar to Central Dushnaya Bay, with a greater volume of beach erosion (Figure 3; Table 1). The most dramatic tsunami effects were in Ainu Bay on Matua Island, where stratigraphic analysis suggests tsunamis may have repeatedly produced coastal erosion (Fig. DR11). In the north, young landforms from the beach to 160 m inland were removed or denuded (Fig. DR12) and a long scour developed at the boundary between older and younger landforms (Fig. DR13). In the south, erosion was also severe, especially close to the shoreline (Fig. DR14).
DiscussionIn order to examine the extent to which tsunami deposits may approximate actual runup
and inundation, we compiled our own data (Table 1) with other reported cases and calculated the percent of actual runup and inundation represented by the deposit (Table DR2). We also calculated the total relief (runup/inundation) over the tsunami-affected part of each profile, and the maximum relief on each profile, in order to compare Kurils cases with others where the data are available. Table DR2 shows that Kurils profiles are higher relief than the others.
AcknowledgementsThe following people contributed to the collection of data that appears in Table DR1:
Nadezhda Razhigaeva, Kirill Ganzey, Andrew Ritchie, Sergei Chirkov, Andrei Kharlamov, Douglas Querl, Victor Kaistrenko, Misty Nikula, Mike Etnier, Natalia Slobodina, Dimitri Frolov, Nikolai Vasilenko, Ben Fitzhugh, Boris Levin, Mikhail Nosov, Molly Odell, Erik Gjesfeld, and Elena Sassorova.
References cited
Gelfenbaum, G. and Jaffe, B., 2003, Erosion and Sedimentation from the 17 July 1998 Papua New Guinea Tsunami, Pure and Applied Geophysics, v. 160, 1969–1999.
4546474849505152535455565758596061626364656667686970717273747576777879808182838485868788899091
Higman, B., and Bourgeois, J., 2008, Deposits of the 1992 Nicaragua Tsunami, in Shiki, T., Tsuji, Y., Yamazaki, T., and Minoura, K., ed., Tsunamiites: Features and Implications: San Francisco, Elsevier, p. 81–104.
Jaffe, B.E., Borrero, J.C., Prasetya, G.S., Peters, R., McAdoo, B., Gelfenbaum, G., Morton, R., Ruggiero, P., Higman, B., and Dengler, L., 2006, Northwest Sumatra and Offshore Islands Field Survey after the December 2004 Indian Ocean Tsunami: Earthquake Spectra v. 22, p, S105.
MacInnes, B.T., Pinegina, T.K., Bourgeois, J., Razhegaeva, N.G., Kaistrenko, V.M., and Kravchenovskaya, E.A., 2009, Field survey and geological effects of the 15 November 2006 Kuril tsunami in the middle Kuril Islands: Pure and Applied Geophysics, v. 166,
Nanayama, F., 2008, Sedimentary Characteristics and Depositional Processes of Onshore Tsunami Deposits: An Example of Sedimentation Associated with the 12 July 1993 Hokkaido-Nansei-oki Earthquake Tsunami, in Shiki, T., Tsuji, Y., Yamazaki, T., and Minoura, K., ed., Tsunamiites: Features and Implications: San Francisco, Elsevier, p. 63–80.
Shepard, F.P., Macdonald, G.A., and Cox, D.C., 1950, The tsunami of April 1, 1946 (Hawaii): California University, Scripps Institute of Oceanography Bulletin, v. 5, p. 391-528.
Shi, S.Z., Dawson, A.G., and Smith, D.E., 1995, Coastal sedimentation associated with the December 12th, 1992 tsunami in Flores, Indonesia: Pure and Applied Geophysics v. 144, p. 525–536.
Srinivasalu, S., Thangadurai, N., Switzer, A.D., Ram Mohan, V., and Ayyamperumal, T., 2007, Erosion and sedimentation in Kalpakkam (N Tamil Nadu, India) from the 26th December 2004 tsunami: Marine Geology v. 240, p, 65–75.
9293949596979899
100101102103104105106107108109110111112113114
Island Locality name Latitude of
profileᅠ
Longitude of
profileᅠ
Number of runup readings
2006 runup on
profile (m)
2006 runup
avg. near profile
(m)
Tide correc-
tion (m)
Runup with tide correc-
tion (m)
Runup avg. with tide cor- rection
(m)
Measured inundation
(m)
GPS calculated inundation
(m)
05/07/2007 VMK Urup Os'ma Bay-2 45.58223 149.45068 TL 1 4.4 - - - - no 170 -05/07/2007 VMK Urup Os'ma Bay-1 45.58285 149.45138 TL 1 5.0 - - - - no 48 -05/07/2007 JB Urup Os'ma Bay-1-2006 45.58300 149.45350 TL 1 4.8 - - - - no 50 -21/08/2008 BTM Urup Kostrikum Cape-225 46.21145 150.54547 TL 4 7.6 7.7 0.3 7.9 8.0 no 80 7921/08/2008 BTM Urup Kostrikum Cape-232 46.21520 150.54867 TL 3 5.4 5.4 -0.1 5.2 5.2 5.6 61 5119/08/2008 JB Chirpoi Peschanaya South-V153 46.53294 150.89059 HLT 1 5.7 - -0.3 5.4 - no 70 -19/08/2008 JB Chirpoi Peschanaya South-V150 46.53397 150.89264 HLT 2 10.4 10.3 0.0 10.5 10.4 no 91 8119/08/2008 BTM Chirpoi Peschanaya-221 46.53865 150.89644 TL 1 5.6 - -0.2 5.5 - no 43 4219/08/2008 BTM Chirpoi Peschanaya-217 46.54120 150.90598 TL 3 5.8 5.5 0.1 5.9 5.6 no 31 3019/08/2008 BTM Chirpoi Peschanaya-219 46.54148 150.90152 TL 4 7.6 8.6 0.0 7.5 8.5 no 40 4313/07/2007 NGR Simushir Spaseniya Bay-37 46.83173 151.87659 HL 1 4.3 - -0.4 3.9 - 4.4 180 14113/07/2007 NGR Simushir Spaseniya Bay-39 46.83411 151.87962 HL 1 2.7 - -0.4 2.3 - 3.9 146 12712/07/2007 VMK Simushir Spaseniya Bay-82 46.83668 151.88249 HL 1 7.2 - - - - - 75 5112/07/2007 VMK Simushir Spaseniya Bay-77b 46.84178 151.89000 HL 1 5.7 - - - - - 109 5409/08/2008 JB Simushir Spaseniya Bay-2 46.84244 151.89121 HLT 4 7.1 7.2 0.3 7.5 7.5 no 127 11813/07/2007 NGR Simushir Spaseniya Bay-36 46.84520 151.89542 HL 1 2.2 - -0.9 1.3 - 3.9 212 17209/08/2008 JB Simushir Spaseniya Bay-1 46.84772 151.89931 HLT 5 6.7 6.8 0.2 7.0 7.0 7.1 111 11619/07/2007 NGR Simushir Spaseniya Bay-79 46.85087 151.90409 HL 1 6.5 - -0.3 6.2 - no 80 5919/07/2007 NGR Simushir Spaseniya Bay-78 46.85281 151.90750 HL 1 4.6 - -0.2 4.4 - no 140 11518/08/2008 BTM Simushir Opasnaya Bay-215 46.94008 152.05510 TL 2 7.2 7.0 -0.3 6.9 6.7 no 79 7918/08/2008 BTM Simushir Opasnaya Bay-213 46.94306 152.05847 TL 3 8.6 8.7 -0.2 8.5 8.5 no 98 9918/08/2008 BTM Simushir Opasnaya Bay-212 46.94655 152.06214 TL 1 6.4 - -0.1 6.3 - 6.7 136 13111/07/2007 TKP Simushir Dushnaya Bay-1 47.04313 152.15841 TL 1 19.6 - 0.4 20.0 - no 83 7911/07/2007 TKP Simushir Dushnaya Bay-2 47.04530 152.15915 TL 1 12.2 - 0.2 12.4 - 12.7 75 9210/07/2007 VMK Simushir Dushnaya Bay-57 47.04684 152.15963 HL 1 9.3 - - - - - 136 11510/07/2007 VMK Simushir Dushnaya Bay-54 47.04769 152.16070 HL 1 11.7 - - - - - 44 -11/07/2007 TKP Simushir Dushnaya Bay-3 47.04942 152.16235 TL 1 7.9 - 0.0 7.9 - no 123 13512/07/2007 TKP Simushir Dushnaya Bay-5 47.05409 152.16471 TL 1 11.0 - 0.3 11.3 - no 132 12812/07/2007 TKP Simushir Dushnaya Bay-6 47.05628 152.16650 TL 1 4.2 - 0.2 4.4 - 10.1 106 9812/07/2007 TKP Simushir Dushnaya Bay-7 47.05807 152.16878 TL 1 6.3 - 0.0 6.3 - 7.1 139 13913/07/2007 TKP Simushir Dushnaya Bay-8 47.05979 152.17162 TL 1 7.9 - 0.7 8.6 - 11.4 118 12013/07/2007 TKP Simushir Dushnaya Bay-9 47.06094 152.17313 TL 1 6.7 - 0.6 7.3 - 12.0 151 15410/07/2007 JB Simushir Dushnaya Bay-2-2006
(Dushnaya central)47.06201 152.17549 TL 1 6.7 - 0.0 6.7 - 7.7 122 125
14/07/2007 TKP Simushir Dushnaya Bay-12 47.06393 152.17726 TL 1 6.6 - 0.3 6.9 - no 120 11514/07/2007 TKP Simushir Dushnaya Bay-11 47.06582 152.17981 TL 1 7.7 - 0.5 8.2 - 8.4 115 10914/07/2007 TKP Simushir Dushnaya Bay-10 47.06772 152.18230 TL 1 9.3 - 0.6 9.9 - no 133 12113/07/2007 JB Simushir Dushnaya Bay-110 47.06960 152.18429 TL 11 10.0 8.8 0.0 10.0 8.8 no 114 10714/07/2007 JB Simushir Dushnaya Bay-1-2006 47.06971 152.18614 TL 8 9.8 10.0 0.6 10.4 10.6 no 100 10213/07/2007 JB Simushir Dushnaya Bay-109 47.07039 152.18792 TL 10 8.8 9.0 0.1 8.9 9.1 no 59 5609/07/2007 VMK Simushir Dushnaya Bay-24 47.07085 152.18777 HL 1 8.7 - - - - - 77 -13/07/2007 JB Simushir Dushnaya Bay-108 47.07124 152.19088 TL 9 11.7 11.6 0.3 12.0 11.9 no 61 5713/07/2007 JB Simushir Dushnaya Bay-107 47.07312 152.19315 TL 12 17.9 14.8 0.5 18.4 15.3 no 85 74
Location InundationRunup (preferred in bold)
TABLE DR1: SUMMARY OF CENTRAL KURIL ISLANDS POST-TSUNAMI SURVEY OF RUNUP AND INUNDATION ORDERED BY LATITUDE
Date Team* Methodᅠ Higher elevation seaward of inun- dation
(m)
115

Island Locality name Latitude of
profileᅠ
Longitude of
profileᅠ
Number of runup readings
2006 runup on
profile (m)
2006 runup
avg. near profile
(m)
Tide correc-
tion (m)
Runup with tide correc-
tion (m)
Runup avg. with tide cor- rection
(m)
Measured inundation
(m)
GPS calculated inundation
(m)
12/07/2007 JB Simushir Dushnaya Bay-106 47.07537 152.19476 TL 10 11.5 13.1 -0.1 11.4 13.0 no 70 6612/07/2007 JB Simushir Dushnaya Bay-105 47.07754 152.19528 TL 10 14.9 15.1 0.4 15.3 15.5 no 93 10211/07/2007 JB Simushir Dushnaya Bay-104 47.07809 152.19888 TL 7 13.3 13.2 -0.2 13.1 13.0 no 52 5211/07/2007 JB Simushir Dushnaya Bay-103 47.07818 152.20214 TL 10 10.4 10.9 -0.1 10.3 10.8 no 49 4611/07/2007 JB Simushir Dushnaya Bay-102 47.07835 152.20566 TL 8 7.5 7.7 0.0 7.5 7.7 no 51 5011/07/2007 JB Simushir Dushnaya Bay-101 47.07880 152.20884 TL 5 8.5 8.5 0.3 8.8 8.8 no 44 3911/07/2007 JB Simushir Dushnaya Bay-100 47.07971 152.21016 TL,HLT 1 12.9 - 0.4 13.3 - no 68 -08/07/2007 JB Ketoi Yuzhni Bay-3 47.29640 152.49141 HLT 9 6.8 6.5 0.0 6.8 6.5 no 44 2708/07/2007 VMK Ketoi Yuzhni Bay-10c 47.29659 152.49009 HL 1 6.7 - 0.0 6.7 - no 79 3808/07/2007 VMK Ketoi Yuzhni Bay-13 47.29774 152.48760 HL 1 9.2 - 0.0 9.2 - no 67 4310/08/2008 JB Ketoi SE coast-V111 47.29801 152.50985 HL 1 10.8 - 0.4 11.2 - no 44 4608/07/2007 JB Ketoi Yuzhni Bay-2 47.29807 152.48616 HLT 9 7.3 7.4 0.0 7.3 7.4 no 58 5410/08/2008 JB Ketoi SE coast-V109 47.29816 152.50784 HL 1 10.1 - 0.1 10.2 - no 80 4908/07/2007 JB Ketoi Yuzhni Bay-1c 47.29834 152.48416 HLT 16 7.5 6.7 0.0 7.5 6.7 no 55 5110/08/2008 JB Ketoi SE coast-V114 47.29867 152.51329 HL 1 9.6 - 0.5 10.1 - no 47 4208/07/2007 JB Ketoi Yuzhni Bay-1b 47.29868 152.48257 HL 9 7.1 6.9 0.0 7.1 6.9 no - 7510/08/2008 JB Ketoi SE coast-V116 47.29893 152.51373 HL 1 10.0 - 0.5 10.5 - no 30 2808/07/2007 JB Ketoi Yuzhni Bay-1a 47.29924 152.48283 HLT 7 6.6 6.5 0.0 6.6 6.5 no 52 3911/07/2007 VMK Ketoi Yuzhni Bay-73 47.29960 152.47238 HL 1 6.8 - 0.0 6.8 - - 37 2311/07/2007 VMK Ketoi Yuzhni Bay-10b 47.29966 152.47368 HL 1 6.2 - 0.0 6.2 - - 37 -11/07/2007 VMK Ketoi Yuzhni Bay-71 47.29966 152.47368 HL 1 6.2 - 0.0 6.2 - - 37 -11/07/2007 VMK Ketoi Yuzhni Bay-69 47.29968 152.47460 HL 1 7.9 - 0.0 7.9 - - 54 3511/08/2008 JB Ketoi SE coast-V121 47.29972 152.51536 HL 1 8.6 - 0.0 8.6 - no 26 2708/07/2007 VMK Ketoi Yuzhni Bay-3b 47.29979 152.48218 HL 1 10.6 - 0.0 10.6 - no 63 4711/07/2007 VMK Ketoi Yuzhni Bay-62 47.30022 152.47934 HL 1 6.0 - 0.0 6.0 - - 37 1811/07/2007 VMK Ketoi Yuzhni Bay-67 47.30025 152.47754 HL 1 9.7 - 0.0 9.7 - - 34 -11/07/2007 VMK Ketoi Yuzhni Bay-64 47.30033 152.47762 HL 1 10.4 - 0.0 10.4 - - 42 2211/07/2007 VMK Ketoi Yuzhni Bay-61 47.30043 152.48006 HL 1 6.3 - 0.0 6.3 - - 52 -11/07/2007 VMK Ketoi Yuzhni Bay-59 47.30047 152.48114 HL 1 6.8 - 0.0 6.8 - - 67 3711/08/2008 JB Ketoi SE coast-V122 47.30130 152.51790 HL 1 11.8 - 0.1 11.9 - no 41 4511/08/2008 JB Ketoi SE coast-V124 47.30271 152.52079 HL 1 11.0 - 0.1 11.1 - no 55 6311/08/2008 JB Ketoi SE coast-V126 47.30438 152.52267 HL 1 11.2 - 0.3 11.5 - no 72 6011/08/2008 JB Ketoi SE coast-V128 47.30534 152.52402 HLT 1 10.1 - 0.4 10.6 - no 80 7210/08/2007 TKP Ushishir Yankicha-257 47.52596 152.82620 TL 2 12.8 12.7 0.8 13.6 13.5 no 57 7009/08/2007 TKP Ushishir Ryponkicha-238 47.53181 152.82719 TL 4 9.4 11.0 0.7 10.1 11.7 no 52 5012/08/2008 JB Ushishir Ryponkicha-V135 47.53207 152.82801 HLT 1 9.0 - 0.2 9.2 - no 47 -09/08/2007 TKP Ushishir Ryponkicha-245 47.53244 152.82906 TL 5 10.8 10.6 0.6 11.4 11.2 no 56 5509/08/2007 NGR Ushishir Ryponkicha-285 47.53287 152.82868 HL 1 9.9 - 0.2 10.1 - no 60 4809/08/2007 TKP Ushishir Ryponkicha-249 47.53324 152.83098 TL 3 11.2 10.8 0.4 11.6 11.2 no 46 4209/08/2007 TKP Ushishir Ryponkicha-251 47.53508 152.83231 TL 1 11.8 - 0.2 12.0 - no 45 5509/08/2007 TKP Ushishir Ryponkicha-253 47.53632 152.83617 TL 5 12.2 11.1 -0.1 12.1 11.0 no 50 4709/08/2007 TKP Ushishir Ryponkicha-255 47.53742 152.84057 TL 3 7.4 7.7 -0.3 7.1 7.4 no 25 3009/08/2007 NGR Ushishir Ryponkicha-180 47.54934 152.85081 HL 1 6.5 - -0.8 5.7 - no 54 4709/08/2008 BTM Rasshua SE coast-187 47.68511 152.97311 TL 3 10.2 10.5 0.0 10.3 10.5 no 46 48
Methodᅠ Runup (preferred in bold) Higher elevation seaward of inun- dation
(m)
InundationDate Team* Location
116
Island Locality name Latitude of
profileᅠ
Longitude of
profileᅠ
Number of runup readings
2006 runup on
profile (m)
2006 runup
avg. near profile
(m)
Tide correc-
tion (m)
Runup with tide correc-
tion (m)
Runup avg. with tide cor- rection
(m)
Measured inundation
(m)
GPS calculated inundation
(m)
08/08/2008 BTM Rasshua SW coast-177 47.68617 152.96642 TL 1 7.1 - -0.2 6.9 - no 38 5708/08/2008 BTM Rasshua SW coast-179 47.69037 152.96786 TL 1 7.5 - 0.1 7.6 - no 42 4109/08/2008 BTM Rasshua SE coast-189 47.69040 152.97519 TL 3 9.4 9.8 0.2 9.6 10.0 no 99 9309/08/2008 BTM Rasshua SE coast-191 47.69449 152.97826 TL 5 10.8 10.8 0.4 11.2 11.2 no 84 7508/08/2008 BTM Rasshua SW coast-181 47.69501 152.96827 TL 4 6.8 7.1 0.3 7.1 7.4 no 50 5209/08/2008 BTM Rasshua SE coast-193 47.69648 152.98709 TL 1 10.5 - 0.4 10.9 - no 57 5311/08/2007 NGR Rasshua SW coast-198 47.69893 152.96575 HL 1 4.7 - 0.3 5.0 - no 66 -11/08/2007 NGR Rasshua SW coast-196 47.69963 152.96543 HL 1 3.9 - 0.3 4.2 - no 64 -08/08/2008 BTM Rasshua SW coast-183 47.70066 152.96200 TL 1 4.7 - 0.3 5.0 - no 73 7411/08/2007 JB Rasshua Landing cove-507 47.70630 152.96405 HL 1 9.7 - -0.3 9.4 - no 56 5310/08/2008 BTM Rasshua Nepristupnaya Bay-195 47.70983 153.02418 TL 3 10.9 11.8 -0.3 10.7 11.5 no 43 3610/08/2008 BTM Rasshua Nepristupnaya Bay-central 47.71077 153.02597 A 1 22 - 0.1 22 - no - -10/08/2008 BTM Rasshua Nepristupnaya Bay-north 47.71166 153.02907 A 3 - 11 0.1 - 11 no - 5015/08/2008 ACR Rasshua IMGG cove-V144 47.71964 152.97135 HLT 1 8.7 - -0.5 8.2 - no 63 6415/08/2008 ACR Rasshua IMGG cove-V142 47.72330 152.97303 HLT 1 9.0 - -0.5 8.5 - no 33 4014/08/2008 BTM Rasshua Severniy Cape-205 47.79095 153.04941 TL 4 10.9 11.0 -0.4 10.5 10.6 no 51 3411/08/2008 BTM Rasshua Severniy Cape-201 47.79513 153.05030 TL 2 11.2 11.3 0.1 11.3 11.4 no 111 10714/08/2008 BTM Rasshua Severniy Cape-209 47.80009 153.04924 TL 3 12.3 12.5 -0.1 12.2 12.4 no 75 7811/08/2008 BTM Rasshua Severniy Cape-203 47.80408 153.04496 TL 3 19.7 19.8 0.4 20.1 20.2 no 71 5706/08/2007 NGR Matua South Bay-153 48.03749 153.27090 HL 1 7.8 - 0.1 7.8 - no 254 12907/08/2007 TKP Matua South Bay-222 48.03976 153.23971 TL 2 6.9 7.4 -0.1 6.8 7.3 7.0 174 17004/08/2007 NGR Matua Ainu Bay-142 48.03980 153.22876 HL 1 13.0 - -0.1 12.9 - no 164 12807/08/2007 TKP Matua South Bay-224 48.04023 153.24302 TL 1 5.8 - -0.1 5.7 - 5.9 215 21906/08/2007 NGR Matua South Bay-152 48.04034 153.26773 HL 1 7.8 - 0.1 7.8 - no 147 12607/08/2007 NGR Matua Sarychevo-160 48.04124 153.27865 HL 1 7.3 - 0.0 7.3 - no 56 5507/08/2007 TKP Matua South Bay-228 48.04127 153.24595 TL 1 7.3 - -0.2 7.1 - no 233 20502/08/2007 NGR Matua Ainu Bay-126 48.04154 153.22731 HL 1 21.2 - -0.5 20.8 - no 436 31507/08/2007 NGR Matua Sarychevo-161 48.04193 153.27764 HL 1 6.1 - 0.0 6.1 - no 108 9206/08/2007 TKP Matua South Bay-216 (central) 48.04199 153.24922 TL 1 5.8 - -0.1 5.7 - 7.6 223 22106/08/2007 NGR Matua South Bay-151 48.04202 153.26372 HL 1 7.9 - 0.0 7.9 - 8.1 95 6006/08/2007 NGR Matua South Bay-148 48.04234 153.25296 HL 1 4.9 - 0.1 4.9 - 9.9 174 13906/08/2007 NGR Matua South Bay-149 48.04244 153.25585 HL 1 6.4 - 0.1 6.4 - 8.2 134 10103/08/2007 NGR Matua Ainu Bay-133 48.04266 153.22644 HL 1 20.4 - -0.2 20.2 - no 503 41706/08/2007 NGR Matua South Bay-150 48.04267 153.25930 HL 1 5.6 - 0.0 5.7 - 6.4 176 14606/08/2007 BTM Matua Ainu Bay-2-2006 (south) 48.04269 153.22650 TL 6 18.3 18.2 -0.1 18.2 18.1 no 432 41103/08/2007 NGR Matua Ainu Bay-132 48.04284 153.22588 HL 1 18.5 - -0.3 18.3 - no 398 37607/08/2007 NGR Matua Sarychevo-162 48.04349 153.27506 HL 1 8.0 - 0.0 8.1 - no 109 11604/08/2007 BTM Matua Ainu Bay-1-2006 (north) 48.04412 153.22497 TL 1 17.3 - -0.2 17.1 - no 327 31303/08/2007 NGR Matua Ainu Bay-130 48.04444 153.22463 HL 1 17.3 - -0.1 17.1 - no 356 31507/08/2007 NGR Matua Sarychevo-164 48.04504 153.27429 HL 1 8.5 - 0.0 8.6 - no 124 11004/08/2007 NGR Matua Ainu Bay-139 48.04537 153.22430 HL 1 18.4 - -0.2 18.1 - no 315 28805/08/2007 NGR Matua Ainu Bay-143 48.04599 153.22315 HL 1 17.2 - -0.1 17.1 - no 244 20007/08/2007 NGR Matua Sarychevo-165 48.04660 153.27397 HL 1 8.5 - 0.1 8.6 - no 122 10104/08/2007 NGR Matua Ainu Bay-144 48.04707 153.22058 HL 1 14.2 - -0.1 14.0 - no 120 119
Methodᅠ Runup (preferred in bold) Higher elevation seaward of inun- dation
(m)
InundationDate Team* Location
117
Island Locality name Latitude of
profileᅠ
Longitude of
profileᅠ
Number of runup readings
2006 runup on
profile (m)
2006 runup
avg. near profile
(m)
Tide correc-
tion (m)
Runup with tide correc-
tion (m)
Runup avg. with tide cor- rection
(m)
Measured inundation
(m)
GPS calculated inundation
(m)
07/08/2007 NGR Matua Sarychevo-166 48.04751 153.27489 HL 1 9.5 - 0.1 9.6 - no 56 5604/08/2007 NGR Matua Ainu Bay-145 48.04786 153.21894 HL 1 13.6 - 0.0 13.6 - no 121 6807/08/2007 NGR Matua Sarychevo-167 48.04854 153.27534 HL 1 10.3 - 0.1 10.4 - no 71 6707/08/2007 NGR Matua Sarychevo-170 48.04985 153.27407 HL 1 9.8 - 0.1 9.9 - no 55 4803/08/2007 TKP Matua Sarychevo-142 48.05172 153.27181 TL 3 13.8 14.0 0.3 14.1 14.3 no 51 5403/08/2007 TKP Matua Sarychevo-145 48.05310 153.26861 TL 3 11.2 11.8 0.4 11.6 12.2 no 62 5503/08/2007 TKP Matua Sarychevo-147 48.05498 153.26675 TL 1 16.8 - 0.2 17.0 - no 49 4803/08/2007 TKP Matua Sarychevo-149 48.05728 153.26618 TL 1 15.4 - -0.1 15.3 - no 60 5604/08/2007 TKP Matua Sarychevo-152 48.05941 153.26706 TL 1 21.7 - 0.2 21.9 - no 48 4104/08/2007 TKP Matua Sarychevo-154 48.06177 153.26918 TL 1 16.7 - 0.0 16.7 - no 46 2604/08/2007 TKP Matua Sarychevo-157 48.06401 153.26918 TL 3 12.0 12.3 -0.2 11.8 12.1 no 69 7903/08/2007 BTM Matua Sarychevo-86 48.06642 153.26921 TL,HLT 3 - 15.5 0.2 15.7 15.7 no 56 5203/08/2007 BTM Matua Sarychevo-83 48.06911 153.26872 TL 4 16.9 16.7 0.1 17.0 16.8 no 38 3503/08/2007 BTM Matua Sarychevo-79 48.07098 153.26668 TL 4 19.6 18.8 0.2 19.8 19.0 no 50 4508/08/2007 JB Matua Toporkov-231 48.07213 153.28239 HLT 2 9.4 9.4 -0.1 9.3 9.3 no 40 4008/08/2007 JB Matua Toporkov-234 48.07238 153.28224 HLT 1 >8.1 - -0.1 >8.0 - no 37 4203/08/2007 BTM Matua Sarychevo-73 48.07340 153.26681 TL 1 17.7 - 0.4 18.1 - no 93 10608/08/2007 JB Matua Toporkov-230 48.07375 153.28205 HLT 2 10.0 9.8 0.1 10.1 9.9 no 42 2703/08/2007 BTM Matua Sarychevo-69 48.07510 153.26518 TL 1 12.4 - 0.2 12.6 - no 59 9408/08/2007 JB Matua Toporkov-235 48.07510 153.28164 HLT 1 11.4 - -0.1 11.3 - no 28 26
08/08/2007 JB Matua Toporkov-237 48.07637 153.28168 HLT 4 10.5 10.2 -0.2 10.3 10.0 no 41 -02/08/2007 BTM Matua Sarychevo-136 48.07707 153.26329 TL 4 10.6 10.7 0.0 10.6 10.7 no 36 3402/08/2007 BTM Matua Sarychevo-133 48.07906 153.26357 TL 1 12.3 - 0.2 12.5 - no 38 4402/08/2007 BTM Matua Sarychevo-129 48.08123 153.26444 TL 3 10.2 10.3 0.3 10.5 10.6 no 54 4202/08/2007 BTM Matua Sarychevo-125 48.08323 153.26612 TL 4 11.3 11.3 0.5 11.8 11.8 no 118 10302/08/2007 BTM Matua Sarychevo-120 48.08416 153.26740 TL 6 12.6 11.5 0.5 13.1 12.0 no 70 6805/08/2008 BTM Matua NE Bay-5 48.09483 153.24565 A 1 18.5 - -0.1 18 - no - 5605/08/2008 BTM Matua NE Bay-4 48.09620 153.24276 A 2 - 16 -0.1 - 16 no - 4305/08/2008 BTM Matua NE Bay-3 48.09751 153.24232 HL 3 - 14 -0.1 - 14 no - 3605/08/2008 BTM Matua NE Bay-2 48.09776 153.24250 A 3 - 13 -0.1 - 13 no - 4705/08/2008 BTM Matua NE Bay-1 48.09836 153.24240 A 1 10 - -0.1 10 - no - 4322/07/2008 BTM Shiashkotan Voskhodnaya Bay 48.78556 154.08406 A 20 - 6 -0.3 - 5.5 no - 6022/07/2008 JB Shiashkotan Voskhodnaya Bay-1 48.78817 154.08586 TL 1 7.4 - -0.3 7.1 - no 56 -23/07/2008 BTM Kharimkotan 1933 Landslide 49.12374 154.60002 A 7 - 4 -0.2 - 3 7.3 - 40031/07/2008 BTM Kharimkotan Severgina Bay-south 49.16001 154.49450 A 3 - 5 -0.1 - 5 no - 55631/07/2008 BTM Kharimkotan Severgina Bay-north 49.16329 154.48074 A 2 - 7 -0.5 - 6 no - 6627/07/2008 BTM Onekotan Mussel Bay-south 49.38688 154.82825 A 4 - 5 0.0 - 5 no - 3627/07/2008 BTM Onekotan Mussel Bay-central-A 49.38814 154.82450 A 3 - 5 -0.4 - 4 no - 12727/07/2008 BTM Onekotan Mussel Bay-central-B 49.38814 154.82450 A 1 8.5 - -0.4 8 - no - 4127/07/2008 BTM Onekotan Mussel Bay-north-A 49.38891 154.82392 A 1 4 - -0.2 4 - no - 18027/07/2008 BTM Onekotan Mussel Bay-north-B 49.38891 154.82392 A 3 - 7 -0.2 - 6 no - 12326/07/2008 BTM Onekotan Cape Lissii Bay-south 49.39499 154.82517 A 2 - 7 0.1 - 7 no - 3826/07/2008 BTM Onekotan Cape Lissii Bay-central-A 49.39749 154.82366 A 1 4.5 - 0.1 5 - no - 12526/07/2008 BTM Onekotan Cape Lissii Bay-central-B 49.39749 154.82366 A 3 6 - 0.1 6 - no - 63
InundationLocation Methodᅠ Runup (preferred in bold) Higher elevation seaward of inun- dation
(m)
Date Team*
118
Island Locality name Latitude of
profile†
Longitude of
profile†
Number of runup readings
2006 runup on
profile (m)
2006 runup
avg. near profile
(m)
Tide correc-
tion (m)
Runup with tide correc-
tion (m)
Runup avg. with tide cor- rection
(m)
Measured inundation
(m)
GPS calculated inundation
(m)
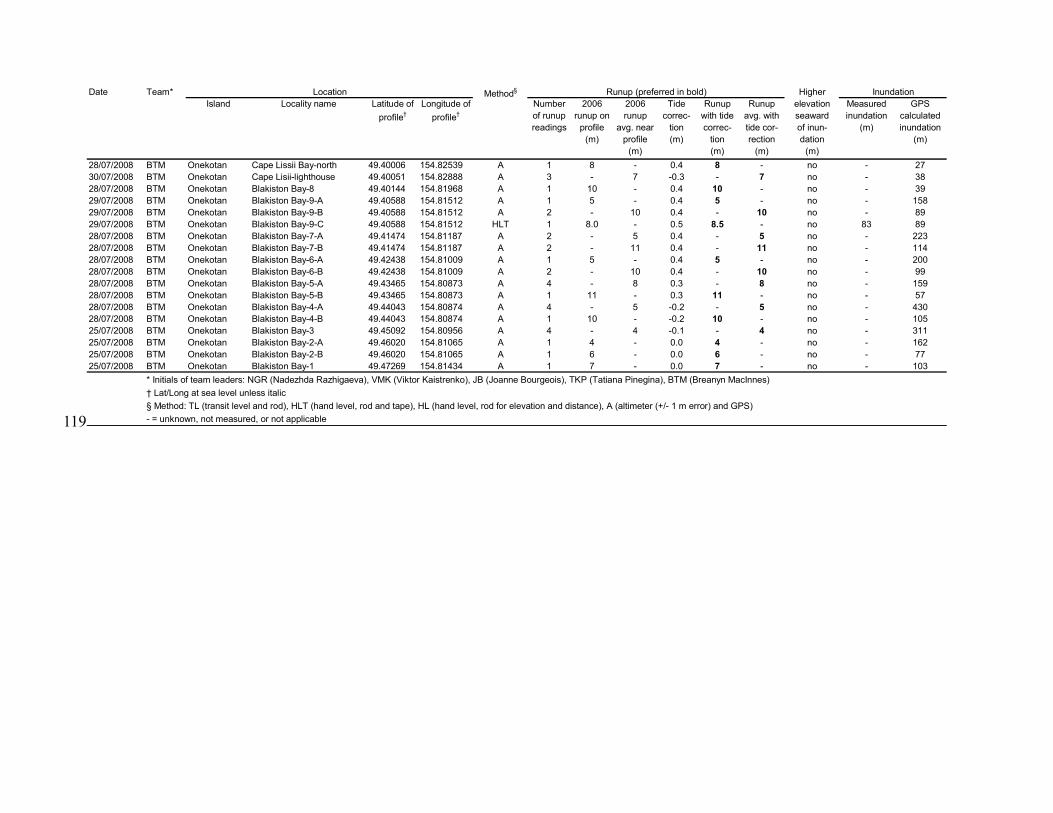
28/07/2008 BTM Onekotan Cape Lissii Bay-north 49.40006 154.82539 A 1 8 - 0.4 8 - no - 2730/07/2008 BTM Onekotan Cape Lisii-lighthouse 49.40051 154.82888 A 3 - 7 -0.3 - 7 no - 3828/07/2008 BTM Onekotan Blakiston Bay-8 49.40144 154.81968 A 1 10 - 0.4 10 - no - 3929/07/2008 BTM Onekotan Blakiston Bay-9-A 49.40588 154.81512 A 1 5 - 0.4 5 - no - 15829/07/2008 BTM Onekotan Blakiston Bay-9-B 49.40588 154.81512 A 2 - 10 0.4 - 10 no - 8929/07/2008 BTM Onekotan Blakiston Bay-9-C 49.40588 154.81512 HLT 1 8.0 - 0.5 8.5 - no 83 8928/07/2008 BTM Onekotan Blakiston Bay-7-A 49.41474 154.81187 A 2 - 5 0.4 - 5 no - 22328/07/2008 BTM Onekotan Blakiston Bay-7-B 49.41474 154.81187 A 2 - 11 0.4 - 11 no - 11428/07/2008 BTM Onekotan Blakiston Bay-6-A 49.42438 154.81009 A 1 5 - 0.4 5 - no - 20028/07/2008 BTM Onekotan Blakiston Bay-6-B 49.42438 154.81009 A 2 - 10 0.4 - 10 no - 9928/07/2008 BTM Onekotan Blakiston Bay-5-A 49.43465 154.80873 A 4 - 8 0.3 - 8 no - 15928/07/2008 BTM Onekotan Blakiston Bay-5-B 49.43465 154.80873 A 1 11 - 0.3 11 - no - 5728/07/2008 BTM Onekotan Blakiston Bay-4-A 49.44043 154.80874 A 4 - 5 -0.2 - 5 no - 43028/07/2008 BTM Onekotan Blakiston Bay-4-B 49.44043 154.80874 A 1 10 - -0.2 10 - no - 10525/07/2008 BTM Onekotan Blakiston Bay-3 49.45092 154.80956 A 4 - 4 -0.1 - 4 no - 31125/07/2008 BTM Onekotan Blakiston Bay-2-A 49.46020 154.81065 A 1 4 - 0.0 4 - no - 16225/07/2008 BTM Onekotan Blakiston Bay-2-B 49.46020 154.81065 A 1 6 - 0.0 6 - no - 7725/07/2008 BTM Onekotan Blakiston Bay-1 49.47269 154.81434 A 1 7 - 0.0 7 - no - 103
* Initials of team leaders: NGR (Nadezhda Razhigaeva), VMK (Viktor Kaistrenko), JB (Joanne Bourgeois), TKP (Tatiana Pinegina), BTM (Breanyn MacInnes)
§ Method: TL (transit level and rod), HLT (hand level, rod and tape), HL (hand level, rod for elevation and distance), A (altimeter (+/- 1 m error) and GPS)
Date Team* Location Method§ Runup (preferred in bold) Higher elevation seaward of inun- dation
(m)
Inundation
- = unknown, not measured, or not applicable
† Lat/Long at sea level unless italic
119

Ref Tsunami Name of profile or transect
Water inundation
(m)
Water runup (m)
Sediment inundation
(m)
Sediment runup (m)
% Sed inundation
% Sed runup*
Total relief ᅠ (m/m)
Max relief (m/m)
Max elevation
(m)
1 1998 PNG Waipo 320 1.25 280 1.5 88 120 0.004 0.150 3.2
1 1998 PNG Arop 720 1.5 680 2 94 133 0.002 0.010 2.5
1 1998 PNG Otto 160 -0.2 130 0.25 81 125 -0.001 0.150 0.75
1 1998 PNG Sissano 575 1 575 1 100 100 0.002 0.027 3.1
2 2004 Indian Oc. Jantang 3 665 19.7 628 4 94 20 0.030 0.432 19.7
3 1993 Hokkaido Miyano, Taisei A 445 4.75 370 4 83 84 0.011 0.050 4.75
3 1993 Hokkaido Miyano, Taisei B 460 5 420 4.5 91 90 0.011 0.050 5
5 1992 Nicaragua Salina 425 2.2 425 2.2 100 100 0.005 0.110 2.75
5 1992 Nicaragua Yellow house 380 2.5 320 2.4 84 96 0.007 0.067 3
5 1992 Nicaragua Mangrove 300 1.8 230 1.75 77 97 0.006 0.081 3.25
5 1992 Nicaragua Beach rock 362 2.2 300 2.15 83 98 0.006 0.107 3.5
4 2004 Indian Oc. Thiruvidandai 330 6 300 4 91 67 0.0182 0.0917 6
4 2004 Indian Oc. Vadanemmeli 220 3.75 220 3.75 100 100 0.0170 0.0170 3.75
4 2004 Indian Oc. Kalpakkam 445 4 445 4 100 100 0.0090 0.0250 4
4 2004 Indian Oc. Mamallapuramᅠ 650 4.3 620 5 95 116 0.0066 0.0800 5
4 2004 Indian Oc. Kadalore 70 4.2 70 4.2 100 100 0.0600 0.1500 4.2
6 1992 Flores Is. Lato# 140 3.5 75 1.75 54 50 0.0250 0.1000 3.5
7 2006 Kuril Is. Dushnaya 2006-2 122 6.7 120 6.6 98 99 0.0549 1.50 6.7
7 2006 Kuril Is. Dushnaya Bay 2 75 12.4 72 12.1 96 98 0.1653 4.84 12.4
7 2006 Kuril Is. South Bay-211 223 5.7 217 5 97 88 0.0256 1.29 7.6
7 2006 Kuril Is. Ainu Bay 2006-1 327 17.1 305 14.8 93 87 0.0523 1.04 17.1
7 2006 Kuril Is. Ainu Bay 2006-2 432 18.1 422 17.3 98 96 0.0419 0.81 18.1
7 2006 Kuril Is. Dushnaya Bay-102 51 7.7 46 6.7 90 87 0.1510 5.49 7.7
TABLE DR2. DATA FROM SURVEYS RELATING TSUNAMI SEDIMENT DISTRIBUTION TO TSUNAMI RUNUP AND ELEVATION
Table DR2 Page 1
120121122
Ref Tsunami Name of profile or transect
Water inundation
(m)
Water runup (m)
Sediment inundation
(m)
Sediment runup (m)
% Sed inundation
% Sed runup*
Total relief ᅠ (m/m)
Max relief (m/m)
Max elevation
(m)
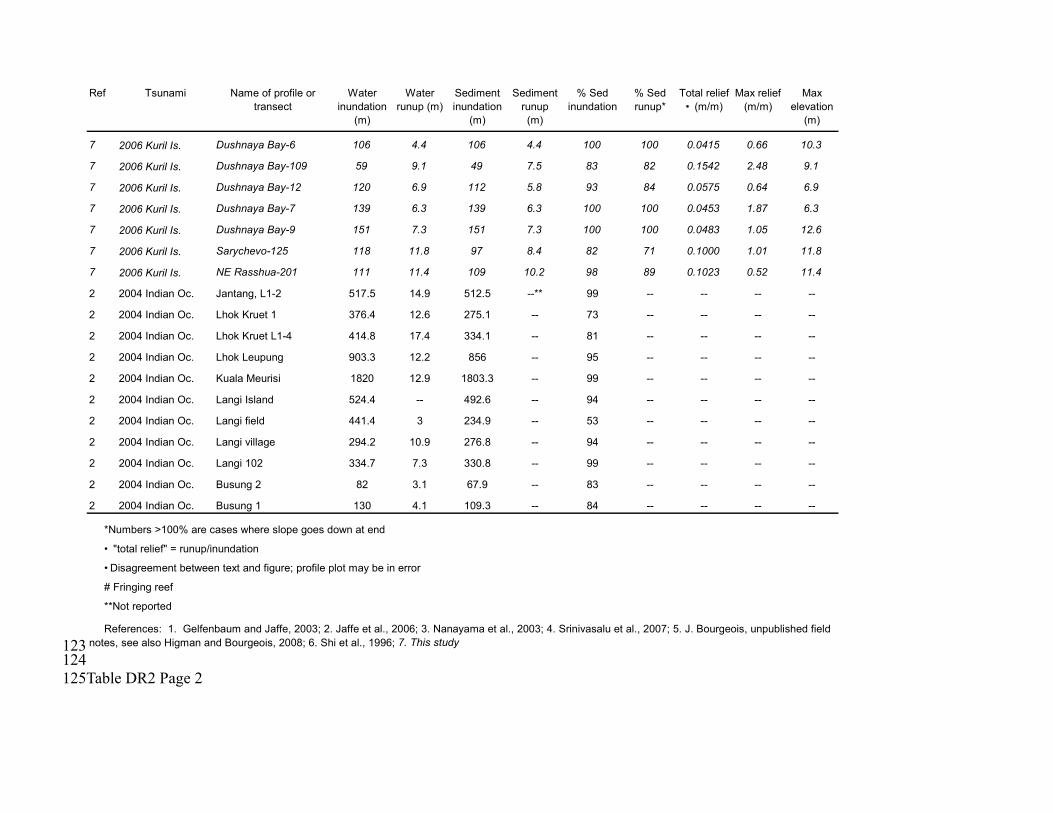
7 2006 Kuril Is. Dushnaya Bay-6 106 4.4 106 4.4 100 100 0.0415 0.66 10.3
7 2006 Kuril Is. Dushnaya Bay-109 59 9.1 49 7.5 83 82 0.1542 2.48 9.1
7 2006 Kuril Is. Dushnaya Bay-12 120 6.9 112 5.8 93 84 0.0575 0.64 6.9
7 2006 Kuril Is. Dushnaya Bay-7 139 6.3 139 6.3 100 100 0.0453 1.87 6.3
7 2006 Kuril Is. Dushnaya Bay-9 151 7.3 151 7.3 100 100 0.0483 1.05 12.6
7 2006 Kuril Is. Sarychevo-125 118 11.8 97 8.4 82 71 0.1000 1.01 11.8
7 2006 Kuril Is. NE Rasshua-201 111 11.4 109 10.2 98 89 0.1023 0.52 11.4
2 2004 Indian Oc. Jantang, L1-2 517.5 14.9 512.5 --** 99 -- -- -- --
2 2004 Indian Oc. Lhok Kruet 1 376.4 12.6 275.1 -- 73 -- -- -- --
2 2004 Indian Oc. Lhok Kruet L1-4 414.8 17.4 334.1 -- 81 -- -- -- --
2 2004 Indian Oc. Lhok Leupung 903.3 12.2 856 -- 95 -- -- -- --
2 2004 Indian Oc. Kuala Meurisi 1820 12.9 1803.3 -- 99 -- -- -- --
2 2004 Indian Oc. Langi Island 524.4 -- 492.6 -- 94 -- -- -- --
2 2004 Indian Oc. Langi field 441.4 3 234.9 -- 53 -- -- -- --
2 2004 Indian Oc. Langi village 294.2 10.9 276.8 -- 94 -- -- -- --
2 2004 Indian Oc. Langi 102 334.7 7.3 330.8 -- 99 -- -- -- --
2 2004 Indian Oc. Busung 2 82 3.1 67.9 -- 83 -- -- -- --
2 2004 Indian Oc. Busung 1 130 4.1 109.3 -- 84 -- -- -- --
*Numbers >100% are cases where slope goes down at end
ᅠ "total relief" = runup/inundation
ᅠ Disagreement between text and figure; profile plot may be in error
# Fringing reef
**Not reported
References: 1. Gelfenbaum and Jaffe, 2003; 2. Jaffe et al., 2006; 3. Nanayama et al., 2003; 4. Srinivasalu et al., 2007; 5. J. Bourgeois, unpublished field notes, see also Higman and Bourgeois, 2008; 6. Shi et al., 1996; 7. This study
Table DR2 Page 2
123124125
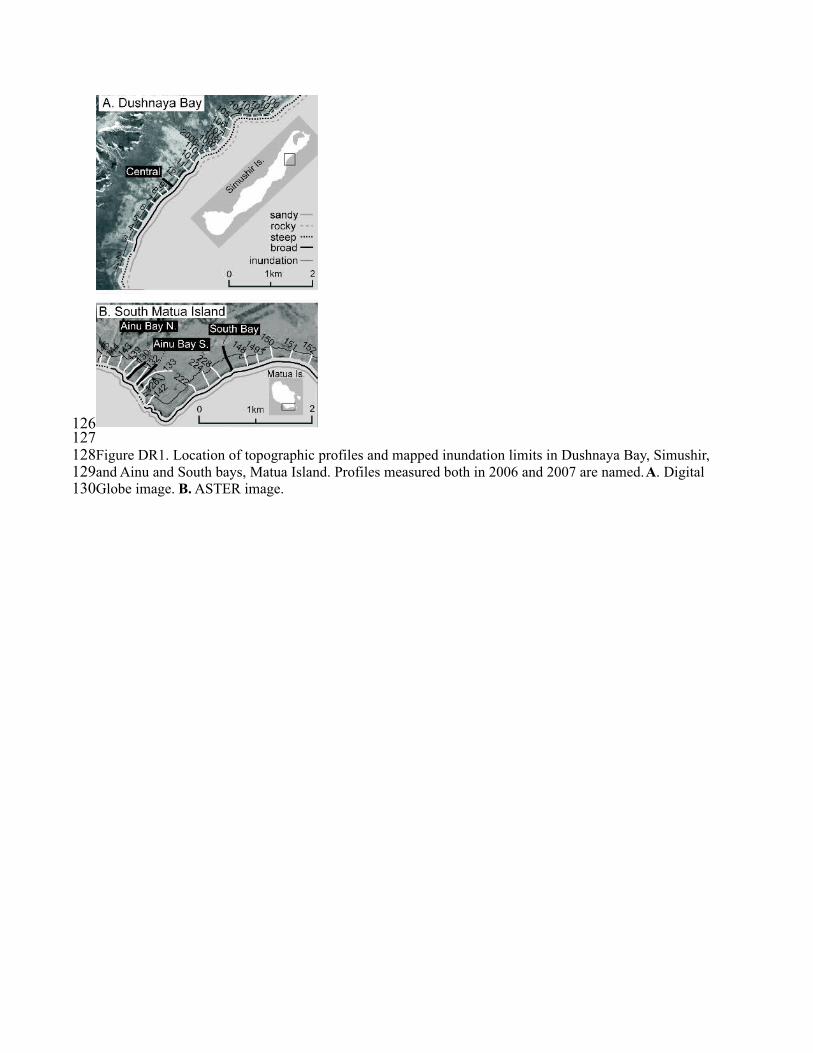
Figure DR1. Location of topographic profiles and mapped inundation limits in Dushnaya Bay, Simushir, and Ainu and South bays, Matua Island. Profiles measured both in 2006 and 2007 are named. A. Digital Globe image. B. ASTER image.
126127128129130
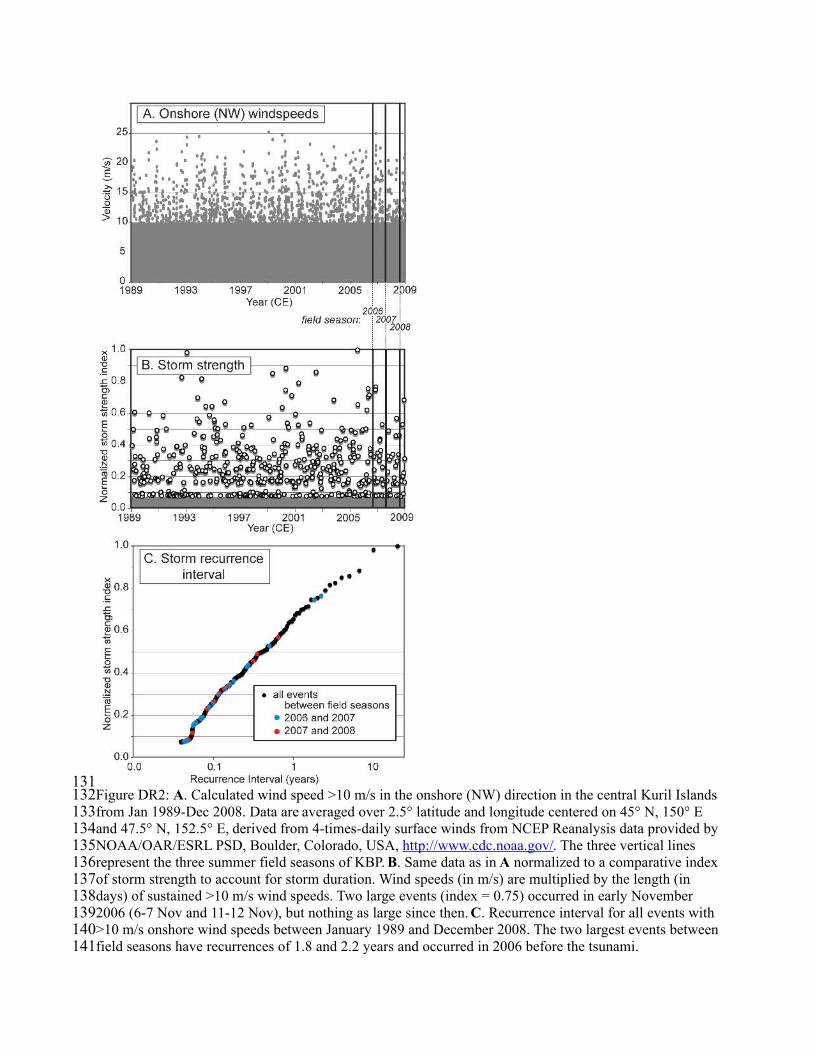
Figure DR2: A. Calculated wind speed >10 m/s in the onshore (NW) direction in the central Kuril Islands from Jan 1989-Dec 2008. Data are averaged over 2.5° latitude and longitude centered on 45° N, 150° E and 47.5° N, 152.5° E, derived from 4-times-daily surface winds from NCEP Reanalysis data provided by NOAA/OAR/ESRL PSD, Boulder, Colorado, USA, http://www.cdc.noaa.gov/. The three vertical lines represent the three summer field seasons of KBP. B. Same data as in A normalized to a comparative index of storm strength to account for storm duration. Wind speeds (in m/s) are multiplied by the length (in days) of sustained >10 m/s wind speeds. Two large events (index = 0.75) occurred in early November 2006 (6-7 Nov and 11-12 Nov), but nothing as large since then. C. Recurrence interval for all events with >10 m/s onshore wind speeds between January 1989 and December 2008. The two largest events between field seasons have recurrences of 1.8 and 2.2 years and occurred in 2006 before the tsunami.
131132133134135136137138139140141

Figure DR3: Topography of the beach on the Ainu Bay south profile from surveys in 2006, 2007, and 2008. That the 2007 and 2008 profiles remain nearly identical (within measurement error) suggests that the large difference from 2006 to 2007/8 is due to tsunami erosion removing sediment entirely from the littoral zone.
142143144145146147
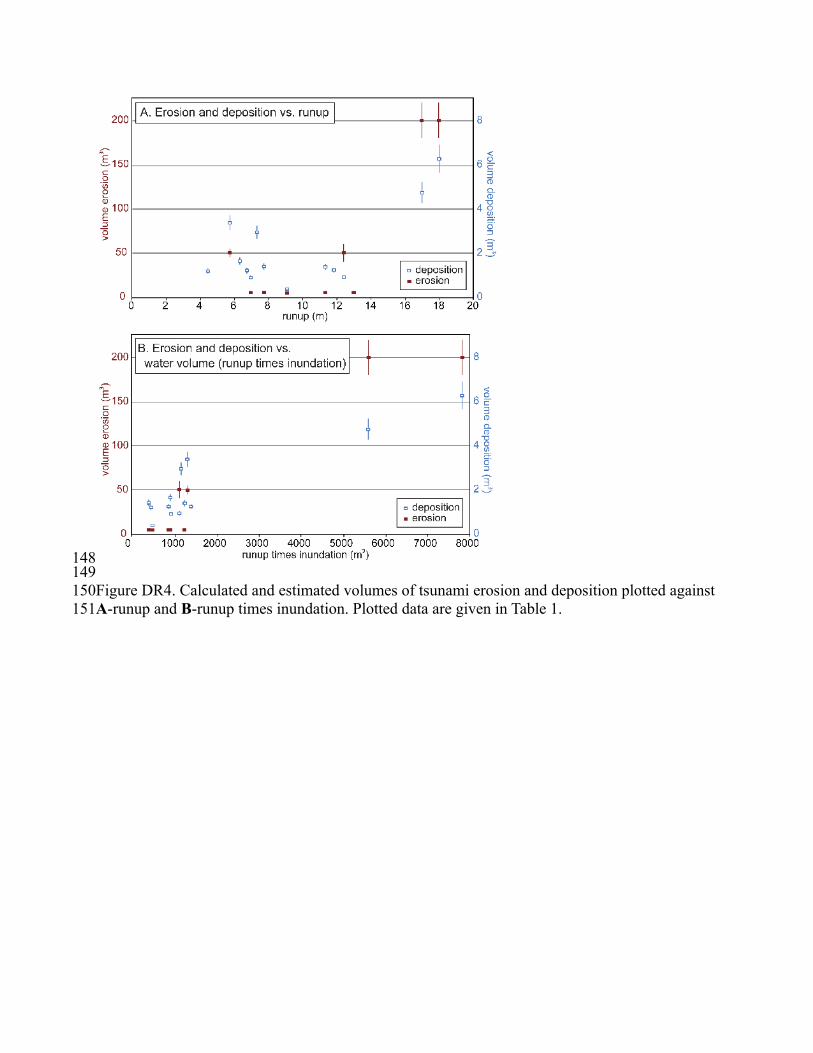
Figure DR4. Calculated and estimated volumes of tsunami erosion and deposition plotted against A-runup and B-runup times inundation. Plotted data are given in Table 1.
148149150151
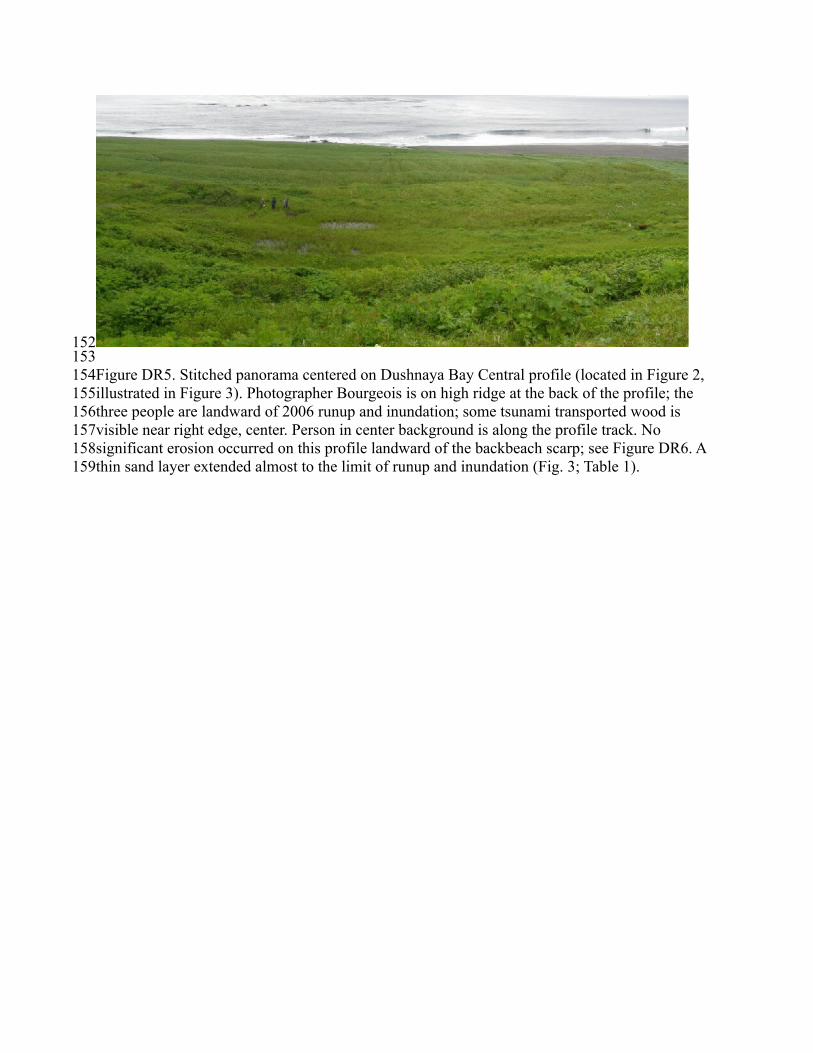
Figure DR5. Stitched panorama centered on Dushnaya Bay Central profile (located in Figure 2, illustrated in Figure 3). Photographer Bourgeois is on high ridge at the back of the profile; the three people are landward of 2006 runup and inundation; some tsunami transported wood is visible near right edge, center. Person in center background is along the profile track. No significant erosion occurred on this profile landward of the backbeach scarp; see Figure DR6. A thin sand layer extended almost to the limit of runup and inundation (Fig. 3; Table 1).
152153154155156157158159
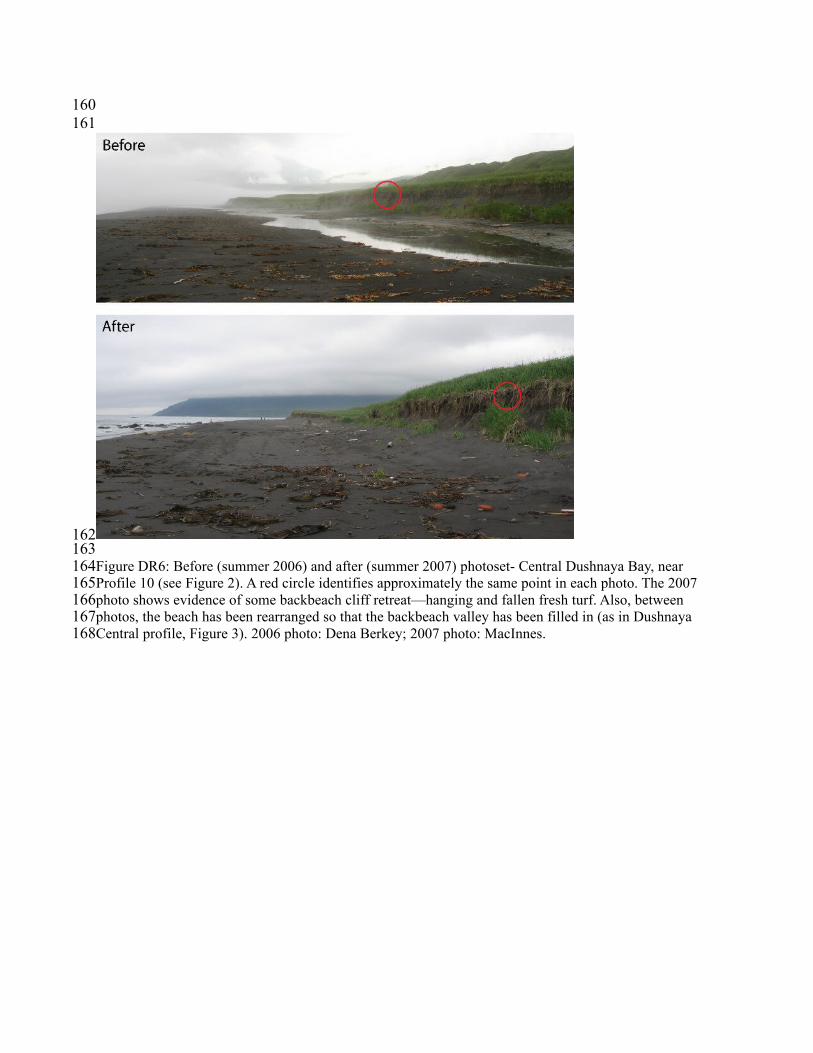
Figure DR6: Before (summer 2006) and after (summer 2007) photoset- Central Dushnaya Bay, near Profile 10 (see Figure 2). A red circle identifies approximately the same point in each photo. The 2007 photo shows evidence of some backbeach cliff retreat—hanging and fallen fresh turf. Also, between photos, the beach has been rearranged so that the backbeach valley has been filled in (as in Dushnaya Central profile, Figure 3). 2006 photo: Dena Berkey; 2007 photo: MacInnes.
160161
162163164165166167168

Figure DR7. A steep, well-vegetated profile measured in 2007 from northern Dushnaya Bay, Simushir (2:1 vertical exaggeration). The former surface was inferred from the current surface and the location of soil stripping; also, in erosion zones, remaining root rhizomes often indicated original soil elevation. The soil was cohesive and eroded mainly through block removal, preferentially along certain tephra layers – cinders in particular (see inset). Tephra correlations also show that the surface is progressively younger toward the sea, indicating net progradation since about 2000 – 3000 years ago (from preliminary radiocarbon dates in peat). Photos in Figure DR8 were taken near this profile.
169170171172173174175176177

Figure DR8. Before (summer 2006) and after (summer 2007) photoset from northern Dushnaya Bay near profile 106 (between 105 and 106; see Figure 2 for location; see Figure DR6 for a profile near this spot). Our team in 2006 chose a convenient but foolish spot for one overnight. 2006 photo: Beth Martin; 2007 photo: MacInnes.
178
179180181182183184185186
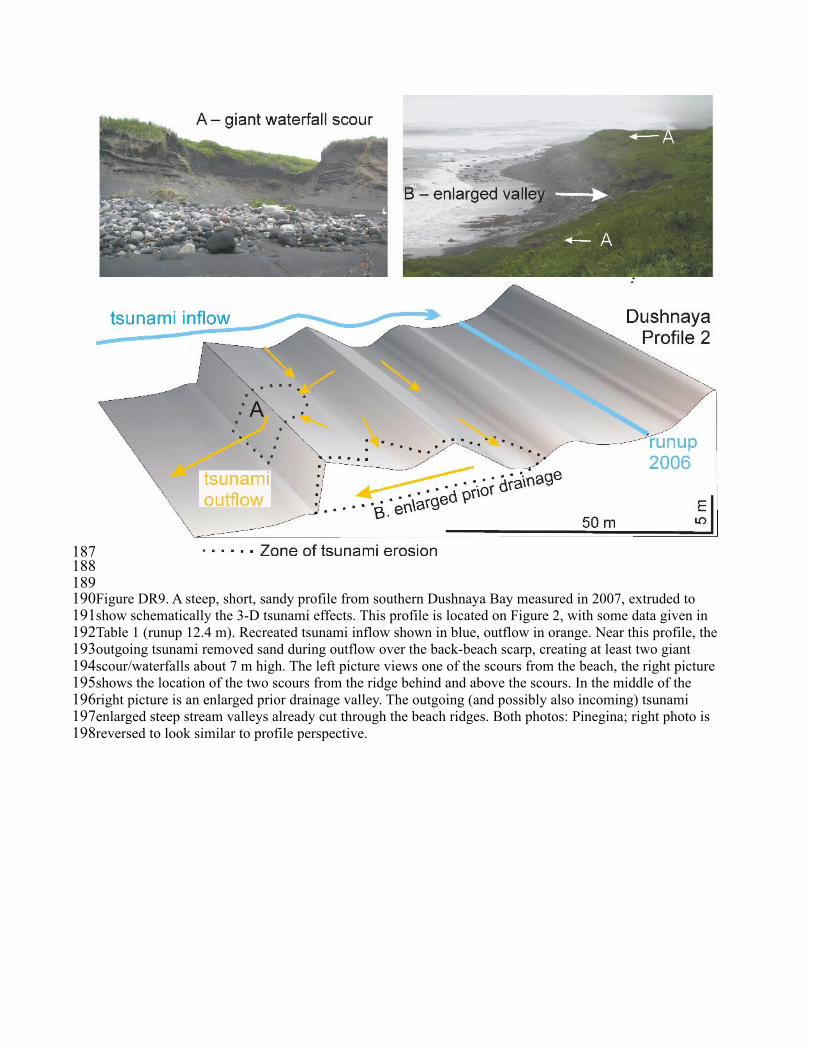
Figure DR9. A steep, short, sandy profile from southern Dushnaya Bay measured in 2007, extruded to show schematically the 3-D tsunami effects. This profile is located on Figure 2, with some data given in Table 1 (runup 12.4 m). Recreated tsunami inflow shown in blue, outflow in orange. Near this profile, the outgoing tsunami removed sand during outflow over the back-beach scarp, creating at least two giant scour/waterfalls about 7 m high. The left picture views one of the scours from the beach, the right picture shows the location of the two scours from the ridge behind and above the scours. In the middle of the right picture is an enlarged prior drainage valley. The outgoing (and possibly also incoming) tsunami enlarged steep stream valleys already cut through the beach ridges. Both photos: Pinegina; right photo is reversed to look similar to profile perspective.
187188189190191192193194195196197198
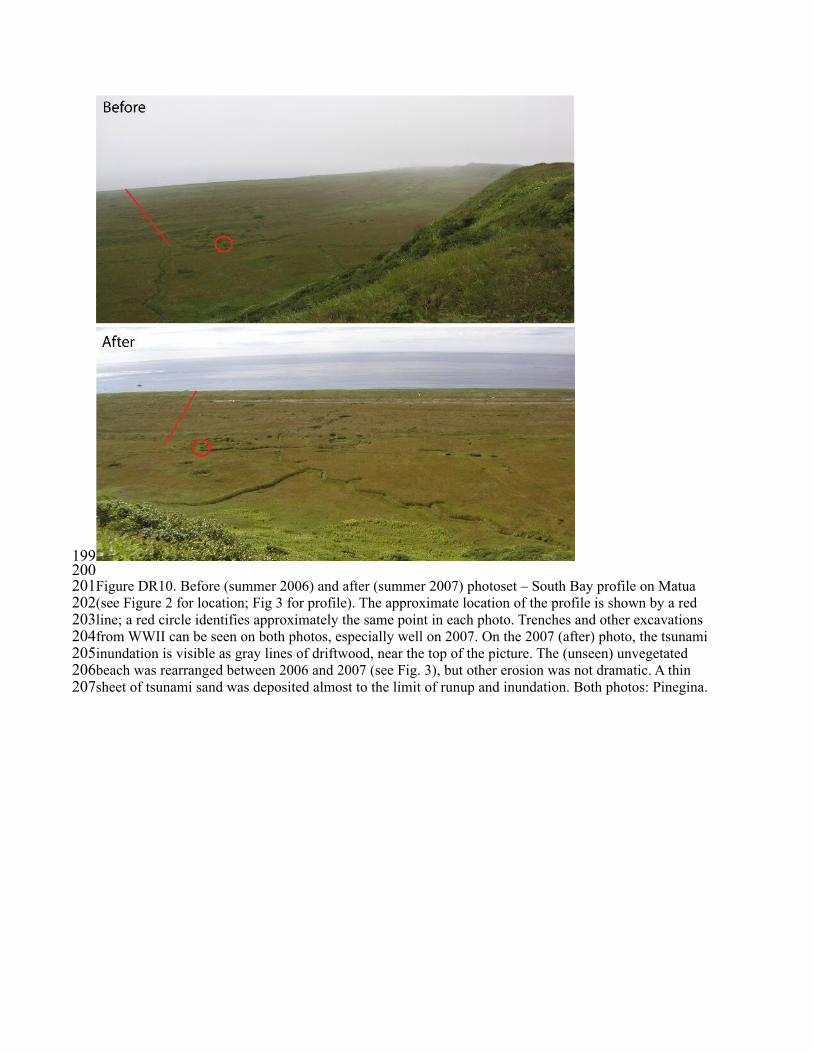
Figure DR10. Before (summer 2006) and after (summer 2007) photoset – South Bay profile on Matua (see Figure 2 for location; Fig 3 for profile). The approximate location of the profile is shown by a red line; a red circle identifies approximately the same point in each photo. Trenches and other excavations from WWII can be seen on both photos, especially well on 2007. On the 2007 (after) photo, the tsunami inundation is visible as gray lines of driftwood, near the top of the picture. The (unseen) unvegetated beach was rearranged between 2006 and 2007 (see Fig. 3), but other erosion was not dramatic. A thin sheet of tsunami sand was deposited almost to the limit of runup and inundation. Both photos: Pinegina.
199200201202203204205206207
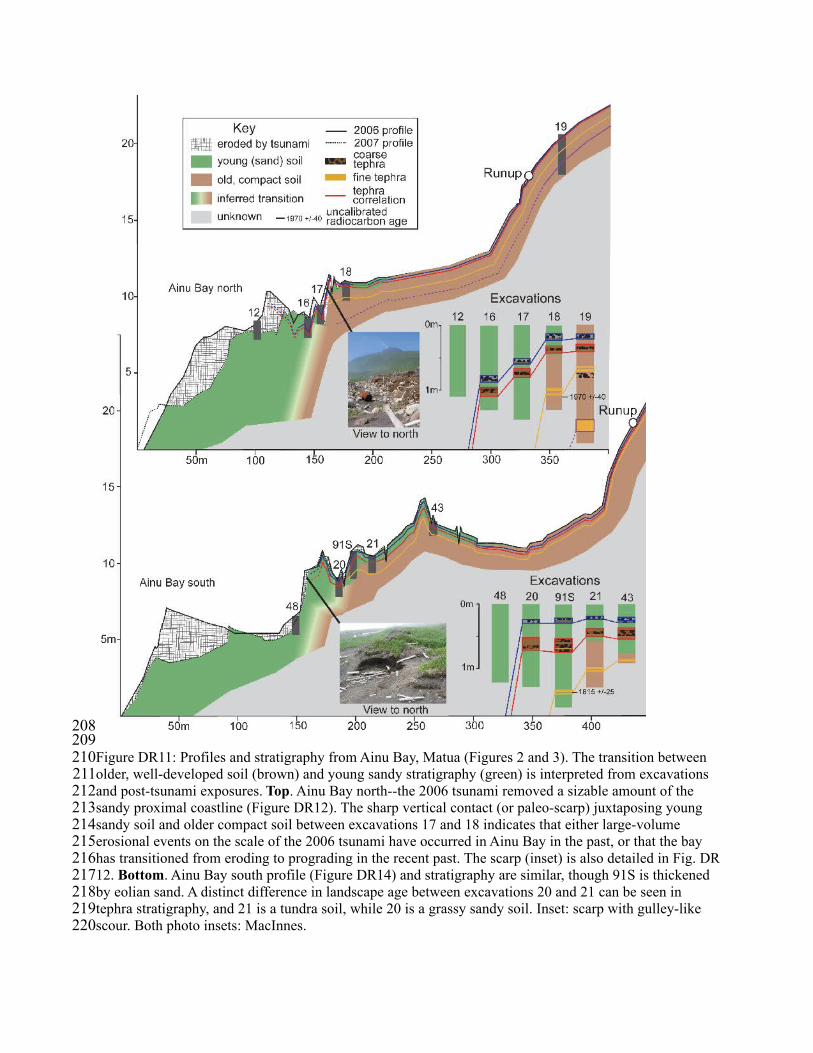
Figure DR11: Profiles and stratigraphy from Ainu Bay, Matua (Figures 2 and 3). The transition between older, well-developed soil (brown) and young sandy stratigraphy (green) is interpreted from excavations and post-tsunami exposures. Top. Ainu Bay north--the 2006 tsunami removed a sizable amount of the sandy proximal coastline (Figure DR12). The sharp vertical contact (or paleo-scarp) juxtaposing young sandy soil and older compact soil between excavations 17 and 18 indicates that either large-volume erosional events on the scale of the 2006 tsunami have occurred in Ainu Bay in the past, or that the bay has transitioned from eroding to prograding in the recent past. The scarp (inset) is also detailed in Fig. DR 12. Bottom. Ainu Bay south profile (Figure DR14) and stratigraphy are similar, though 91S is thickened by eolian sand. A distinct difference in landscape age between excavations 20 and 21 can be seen in tephra stratigraphy, and 21 is a tundra soil, while 20 is a grassy sandy soil. Inset: scarp with gulley-like scour. Both photo insets: MacInnes.
208209210211212213214215216217218219220

Figure DR12. Before (summer 2006) and after (summer 2007) photoset – Ainu Bay North profile on Matua (see Figure 2 for location; Fig 3 for profile; also see Figure DR11, DR13). The approximate location of the profile is shown by a red line, and a red circle identifies approximately the same point in each photo. The after perspective is hard to match because of the severe erosion, lowering the surface on which the group camped for two nights in 2006. Both photos: Misty Nikula.
221
222223224225226227228229

Figure DR13. Top: View in 2007 of 100-m-long, tsunami-generated scarp crossed by Ainu Bay North profile (Figs. 3, DR11). Line of bouldery sand in the foreground is another surface stripped of turf by the tsunami. Bottom: Close-up of the eroded scarp, with exposed soils and tephra. Tape on outcrop is extended to 100 cm. A light-colored tan tephra in the middle of the scarp (marked at either end by yellow flagging tape) is about 2000 years old.
230
231232233234235236237
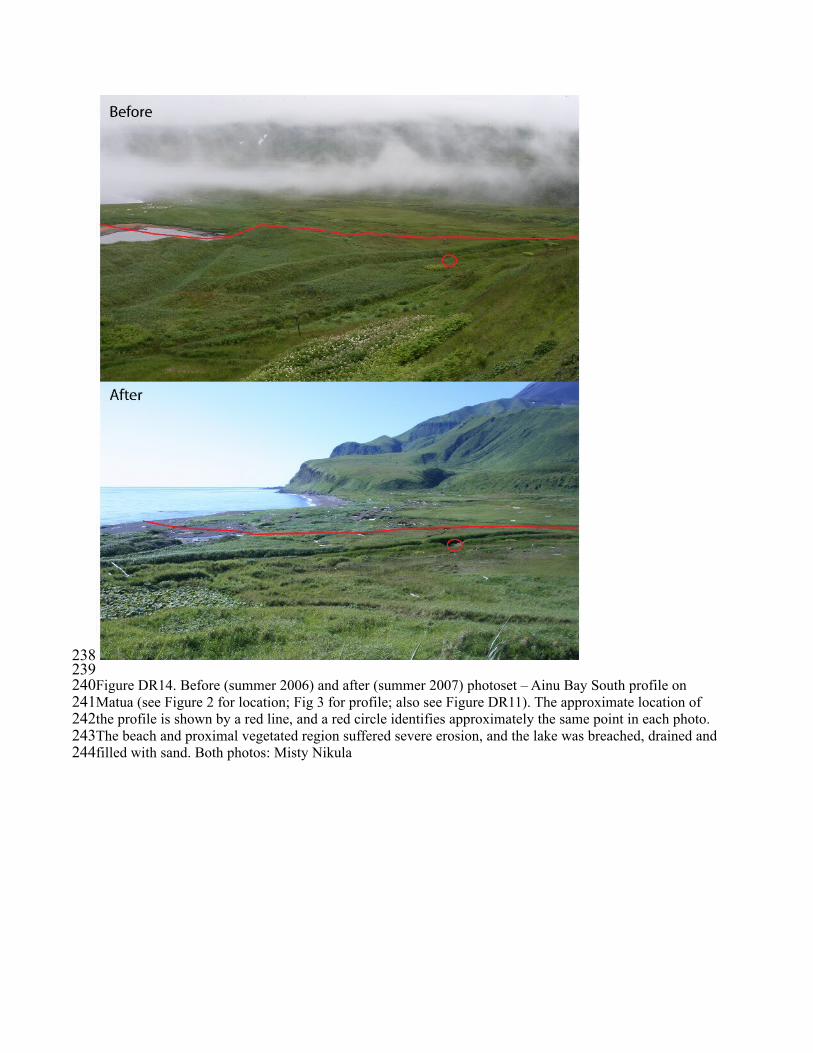
Figure DR14. Before (summer 2006) and after (summer 2007) photoset – Ainu Bay South profile on Matua (see Figure 2 for location; Fig 3 for profile; also see Figure DR11). The approximate location of the profile is shown by a red line, and a red circle identifies approximately the same point in each photo. The beach and proximal vegetated region suffered severe erosion, and the lake was breached, drained and filled with sand. Both photos: Misty Nikula
238239240241242243244