Embed Size (px)
Citation preview

1
Version 10-Dec-08
Published in somewhat shortened version in Population and Development Review, 34 (4): 663–697, Dec. 2008 (http://www3.interscience.wiley.com/journal/117976239/home)
Food Price Surges: Possible Causes, Past Experiences and
Relevance for Exploring Long-Term Prospects
Nikos Alexandratos1
Abstract
The food price surges of recent years have created much misery and raised once again the Malthusian spectre. Frequent, and often uncritical, reference was made to the increases in the demand for food in the emerging countries, particularly China and India, as the dominant factor behind what was perceived to be a shock on the demand side. Use of crops for biofuels was listed as an additional, though not as important, factor. Yet global cereals utilization without biofuels has been growing at slowly decelerating rates, as in the past. However, the addition of biofuels resulted in its growing faster than in the past. In parallel, global production had been falling behind utilization for several years leading to declining stocks. Weather shocks, depreciation of the dollar and turbulence in the financial markets were added to these fundamentals of the demand-supply balance to generate the price surges. If energy prices continued to be high and/or rising and pro-biofuel policies remained in place, the diversion of crops to biofuels could continue. This could prevent the current commodity cycle from unfolding in the “normal” way over the short- to medium-term and prices trending back towards their pre-surge levels. We draw some conclusions about how these developments should influence the way we assess long-term food and agriculture prospects. Prologue
Work on this paper commenced in early 2008. At that time, there seemed to be a fair degree of consensus for the view that one of the major causes for the food scarcities and rising prices of recent years was the rapid growth in food and feed consumption, particularly in the emerging countries like China and India. It was becoming kind of conventional wisdom. We had been doing long-term projections for several years2. We had not anticipated such developments. On the contrary, we had concluded that the growth of global demand would be slowing down. Ergo, or we were dead wrong in our projections or the quasi consensus view was way off the mark.
1 The author is former Chief of the Global Perspective Studies Unit of the Food and Agriculture Organization of the United Nations (FAO). He produced this paper as consultant to FAO. The views expressed are his and do not represent those of FAO. Comments welcome. Useful comments from P. Westhoff, W. Myers and Seth Meyer, University of Missouri-Columbia, are gratefully acknowledged as are those of two anonymous referees. 2 Alexandratos (2005), Bruinsma (2003), FAO (2006)

2
It was at least curious that these explanations were offered when comprehensive food/feed consumption data were very scarce or outright not available for the years of price surges. FAO had temporarily suspended the publication of supply-utilization (SUA) data: the latest estimates on its Faostat Web site did not go beyond 2003, i.e. before the years of the sharp price rises. A cursory look at the other publicly available data source of country and global SUA data, the U.S. Dept. of Agriculture (USDA) PSD3 which covers most, but not all, commodities, suggested that demand for cereals4 was indeed accelerating, a rather unsettling finding going, as it were, against the grain of our long-standing positions. However, when the global demand or utilization data were read side by side with those on the cereals use for biofuels, a different view emerged. Cereals demand for food, feed and other non-biofuel uses was not accelerating but rather gradually slowing down as predicted. All the acceleration evident in the global utilization data appeared to have originated in the use for biofuels (this is not equivalent to saying that all price rises have been due to this factor). A further cursory look at the global utilization data along with those of supply (production and stock movements), reveals that forces leading to enhanced vulnerability to an eventual shock were building up for some time. Things came to a head when the demand shock from biofuels intruded into the system and coincided with weather-induced production declines in a number of major producing countries, in some of them in two years in row. In short, it was a surge waiting to happen.
Gradually, a new consensus has been building around the position that, on the demand side, biofuels have been a dominant factor in the emergence of scarcities and price surges. More important is the risk that they could continue playing such role in the future, effectively preventing the present food commodity cycle from unfolding in the “normal” pattern well established in the past: short periods of high prices followed by longer periods of prices not very different from, or even lower than, those of the pre-surge period.
3 U.S. Dept of Agriculture (Production, Supply and Distribution) http://www.fas.usda.gov/psdonline/psdQuery.aspx 4 Cereals comprise wheat, rice in milled form and coarse grains (maize, barley, sorghum, millet, rye, other). The term
cereals is often used interchangeably with the term grains in the literature. The latter is retained here when it appears in the quotations or in the data sources, e.g. the World Bank Commodity Price Data.

3
1. Introduction
1) Once more the world is going through a phase of anxiety concerning the Malthusian predicament: that world agriculture may not be able in the end to cope with the growing demands placed upon it by the need to produce food for a growing population, including the satisfaction of food demand of that part of the population of the emerging countries (e.g. China, India) which experiences high income growth. All this while respecting constraints related to sustainability and the environment, and keeping in mind the possible effects on agriculture of climate change. What triggered current concerns are the sharp rises in the prices of basic food commodities in international markets, signaling growing shortfalls of global supply in relation to demand
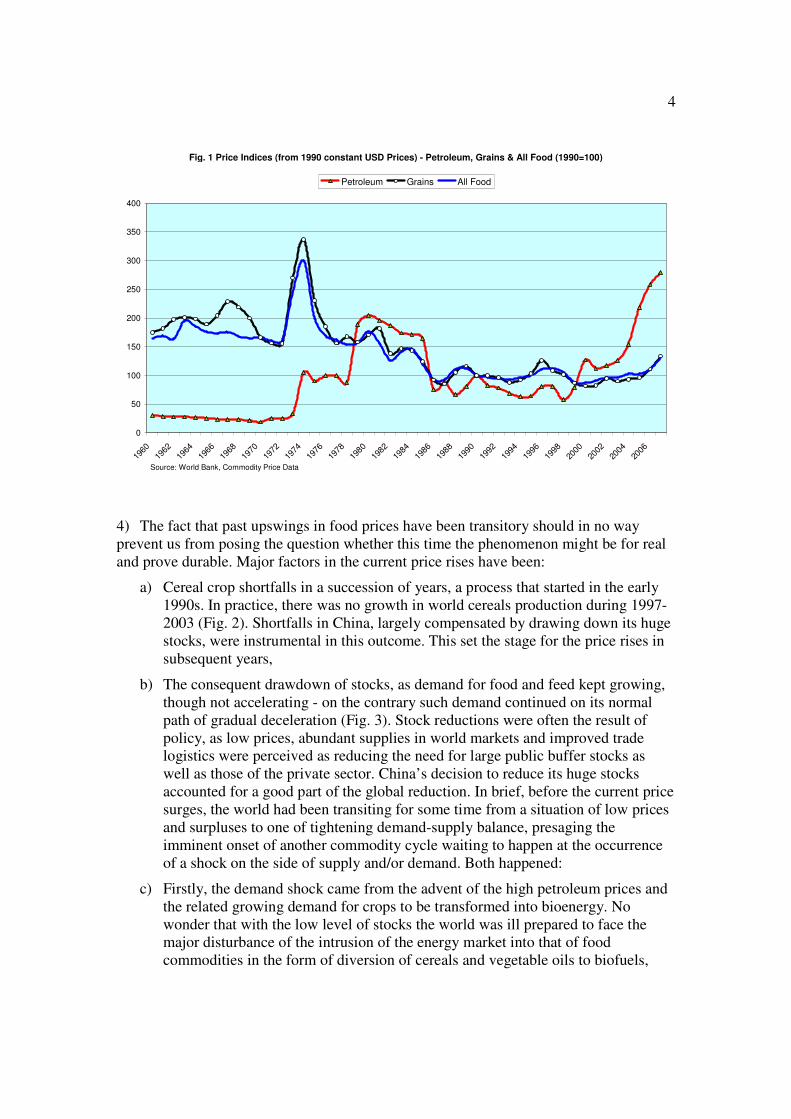
2) The growing concern about the Malthusian predicament is nothing new. It has been a recurrent phenomenon every time rising prices signaled the emergence of significant imbalances. It happened in the mid-seventies (first petroleum shock – though the food price surges of that period were only weakly linked to the rise in petroleum prices, see below) and again in the mid-90s. Every time concerns were followed by complacency (about production potentials and the balance of supply and effective demand, not about food insecurity and hunger) as the causes of rising prices (temporary shortages from crop failures, demand shocks) run their course and were followed by years of falling prices. Overall, the longer term trend has been one of declining real agricultural prices (Fig.1), indicating that supply tended to grow faster than effective demand. However, the declining price trends should not be exaggerated, as is often the case in the literature. A glance at Fig.1 shows that the trend has been largely halted from about the mid-80s5.
3) The term “effective” is crucial for appreciating the meaning of these trends in the context of food security and nutrition. Excess supply of food at the global level (this is what falling real prices imply) has co-existed with inadequate food consumption and undernutrition for significant parts of the world population, with an estimated 848 million persons undernourished in 2003–05 and 967 million in 2007 (FAO 2008a). Weak effective demand reflects the poverty and lack of purchasing power on the part of these population groups. In practice, food insecurity has been so far more a question of poverty rather than of global potential to produce sufficient food. However, at the local level the two aspects are intimately linked: inadequate food production potential, or more general failures in agricultural development, can be themselves prime causes of the persistence of poverty in the many poor countries in which significant parts of the population depend on agriculture for a living. The Malthusian predicament is very much present in such local situations. This applies a fortiori to countries with high demographic growth, poor agricultural resources and limited access to the actual or potential global plenty (Alexandratos, 2005).
5 Fig. 1 does not capture the sharp price surge of 2008, for which only monthly indices at current prices (re-based to year 2000) up to October 2008 are available in the World Bank data (http://econ.worldbank.org/WBSITE/EXTERNAL/EXTDEC/EXTDECPROSPECTS/0,,contentMDK:21148472~menuPK:556802~pagePK:64165401~piPK:64165026~theSitePK:476883,00.html). The latter indicate that the average indices of Jan.-Oct. 2008 were above the annual averages of 2007 by 57% for cereals, 41% for all food and 50% for petroleum. Fig. 13 plots the nominal grains price index up to November 2008.
4
Fig. 1 Price Indices (from 1990 constant USD Prices) - Petroleum, Grains & All Food (1990=100)
0
50
100
150
200
250
300
350
400
1960
1962
1964
1966
1968
1970
1972
1974
1976
1978
1980
1982
1984
1986
1988
1990
1992
1994
1996
1998
2000
2002
2004
2006
Petroleum Grains All Food
Source: World Bank, Commodity Price Data
4) The fact that past upswings in food prices have been transitory should in no way prevent us from posing the question whether this time the phenomenon might be for real and prove durable. Major factors in the current price rises have been:
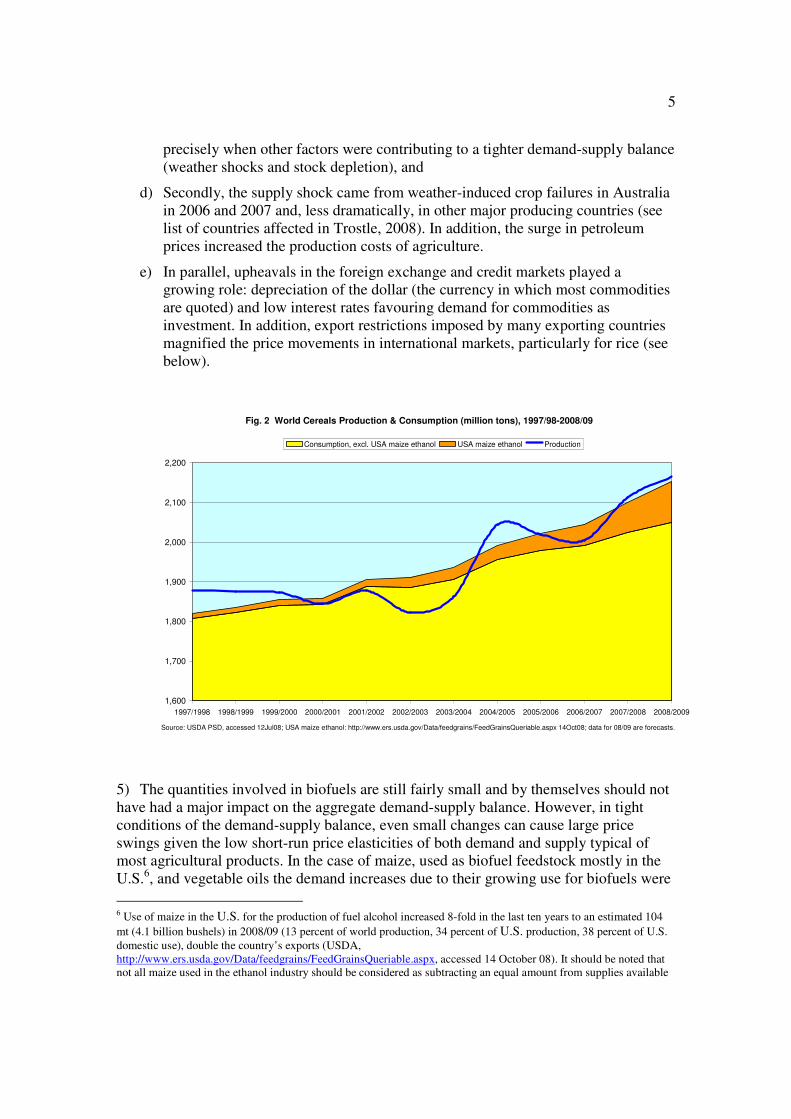
a) Cereal crop shortfalls in a succession of years, a process that started in the early 1990s. In practice, there was no growth in world cereals production during 1997-2003 (Fig. 2). Shortfalls in China, largely compensated by drawing down its huge stocks, were instrumental in this outcome. This set the stage for the price rises in subsequent years,
b) The consequent drawdown of stocks, as demand for food and feed kept growing, though not accelerating - on the contrary such demand continued on its normal path of gradual deceleration (Fig. 3). Stock reductions were often the result of policy, as low prices, abundant supplies in world markets and improved trade logistics were perceived as reducing the need for large public buffer stocks as well as those of the private sector. China’s decision to reduce its huge stocks accounted for a good part of the global reduction. In brief, before the current price surges, the world had been transiting for some time from a situation of low prices and surpluses to one of tightening demand-supply balance, presaging the imminent onset of another commodity cycle waiting to happen at the occurrence of a shock on the side of supply and/or demand. Both happened:
c) Firstly, the demand shock came from the advent of the high petroleum prices and the related growing demand for crops to be transformed into bioenergy. No wonder that with the low level of stocks the world was ill prepared to face the major disturbance of the intrusion of the energy market into that of food commodities in the form of diversion of cereals and vegetable oils to biofuels,
5
precisely when other factors were contributing to a tighter demand-supply balance (weather shocks and stock depletion), and
d) Secondly, the supply shock came from weather-induced crop failures in Australia in 2006 and 2007 and, less dramatically, in other major producing countries (see list of countries affected in Trostle, 2008). In addition, the surge in petroleum prices increased the production costs of agriculture.
e) In parallel, upheavals in the foreign exchange and credit markets played a growing role: depreciation of the dollar (the currency in which most commodities are quoted) and low interest rates favouring demand for commodities as investment. In addition, export restrictions imposed by many exporting countries magnified the price movements in international markets, particularly for rice (see below).
Fig. 2 World Cereals Production & Consumption (million tons), 1997/98-2008/09
1,600
1,700
1,800
1,900
2,000
2,100
2,200
1997/1998 1998/1999 1999/2000 2000/2001 2001/2002 2002/2003 2003/2004 2004/2005 2005/2006 2006/2007 2007/2008 2008/2009
Consumption, excl. USA maize ethanol USA maize ethanol Production
Source: USDA PSD, accessed 12Jul08; USA maize ethanol: http://www.ers.usda.gov/Data/feedgrains/FeedGrainsQueriable.aspx 14Oct08; data for 08/09 are forecasts.
5) The quantities involved in biofuels are still fairly small and by themselves should not have had a major impact on the aggregate demand-supply balance. However, in tight conditions of the demand-supply balance, even small changes can cause large price swings given the low short-run price elasticities of both demand and supply typical of most agricultural products. In the case of maize, used as biofuel feedstock mostly in the U.S.6, and vegetable oils the demand increases due to their growing use for biofuels were
6 Use of maize in the U.S. for the production of fuel alcohol increased 8-fold in the last ten years to an estimated 104
mt (4.1 billion bushels) in 2008/09 (13 percent of world production, 34 percent of U.S. production, 38 percent of U.S.
domestic use), double the country’s exports (USDA, http://www.ers.usda.gov/Data/feedgrains/FeedGrainsQueriable.aspx, accessed 14 October 08). It should be noted that not all maize used in the ethanol industry should be considered as subtracting an equal amount from supplies available

6
not that small. In both cases, expansion of these products for biofuels had knock-on effects on the prices of other crops, mainly via the acreage substitution mechanism. However, the targets of the different countries to increase the share of biofuels in the transport sector are indeed significant. This presages continued growth of demand from this sector and contributes to the formation of expectations about the course of prices. The European Union (E.U.) aims at a target of 5.75 percent biofuel share in transportation fuel by 2010 and 10 percent by 2020 (from some 2 percent at present). Under these targets, the E.U. may be using for ethanol some 19 million tons (mt, the term ton refers to metric tonne) of cereals by 2014 and some 59 mt (19 percent of total domestic cereals use) by 2020 (European Commission, 2007a, 2007b). The U.S. has a 2008 biofuels target of 9.0 billion gallons (FAO, 2008b, Table 4; one U.S. gallon=3.785 liters). A target of 36 billion gallons has been set for 2022 (of which 15 billion from maize and 1 from biodiesel). Current ethanol production runs at 8.7 billion gallons (data for Jan.-July 2008, at annual rate), up from 6.5 billion gallons in 2007, while maize utilization in alcohol for fuel was 4.1 billion bushels in 2008, up from 3 billion bushels in 2007 (marketing years, September-August, there are 39.368 bushels of maize in one ton)7. All these mandates and explicit or implicit commitments to continue government support to biofuels (tax credits and tariff protection) have underpinned decisions to invest rather heavily in biofuel facilities. This will tend to make reversal of trends to use crops for biofuels difficult, more so given the experience that subsidies, once instituted, are difficult to abolish.
6) Besides cereals, other major crops are also used for biofuels, foremost among them sugar cane for ethanol (predominantly in the world’s largest sugar producer and exporter - Brazil, where some 50 percent of the national production is so used) and vegetable oils (rapeseed oil, soybean oil, palm oil) for biodiesel, predominantly in the E.U. from both locally produced and imported oils. Given the fungibility of land and water resources (the possibility, within certain agroecological limits, to change their use from one crop to another), any additional demand on biofuel feedstock crops can affect the resources allocated to the production of other crops unrelated to biofuels. Consumption substitution effects (when demand shifts from a commodity with rising price to a substitute less affected by such rises) can also contribute to spreading price rises to crops unrelated to biofuels. This was probably among the causes that sent the price of rice (a commodity not used in biofuels) sky high in early 2008 (see below). Ditto for the price rise of soybeans through substitution of soybean meal for high-priced maize in animal feed.
7) We may draw a provisional conclusion: so long as energy prices remain high and concerns about climate change persist, the search for alternative energy sources will continue. Energy from biomass will likely continue to be an important component of such search. If so, it will compete for land and water resources which have alternative uses,
for feed, given that the industry produces and returns to the feed sector byproducts (distillers’ dry grains with solubles in the dry milling process and corn gluten feed and corn gluten meal – plus maize oil – in the wet milling process)
equal to about one third of the maize processed into ethanol. The E.U.-27 uses for biofuels some 5 mt of cereals – 2
percent of production (http://ec.europa.eu/agriculture/markets/crops/index_en.htm), China some 11 mt and Canada some 2 mt (estimates for latter two countries from von Braun, 2008). China is now shifting ethanol production from cereals to cassava and sweet potatoes. 7 Ethanol production data and target for 2022 from http://www.ethanolrfa.org/resource/standard/; maize use data from www.ers.usda.gov/data/feedgrains/FeedGrainsQueriable.aspx (accessed 14Oct08); see also FAO (2008b) and Coyle (2007).
7
including for food production and for environmental conservation. It is therefore reasonable to assume that the tighter global food demand-supply balance and accompanying high prices of recent years may prove more durable and less transitory than in the past. The worst case scenario would be if energy prices rose to levels such that biofuels from cereals and oils become economically viable without subsidies and mandates and no action is taken to prevent the siphoning off of food to energy (see below).
8) How durable and how intense the price rises may prove to be in the long term is impossible to tell without further work. Attempts at medium term projections have been made and suggest that high prices are here to stay, though at levels not as high as the peaks reached in the current run-up, e.g. OECD-FAO (2008), Rabobank (2008). The World Bank’s latest (mid-May 2008) projections indicate that the real grains price index may be in 2020 only 10% below that of 20078. When considering longer term futures, much depends on the evolution of energy prices, trade policies and technology development in the biomass conversion processes themselves (e.g. to produce fuel from cellulose biomass - wood, grasses, etc) as well as in other sectors (wind, hydrogen, photovoltaic, nuclear, etc).
9) The supply elasticity of agriculture will also be a crucial factor: if production potential (more land and irrigation, higher yields), fails to develop pari passu with the growing needs, biofuel feedstock prices (in relation to the price of petroleum) may rise to levels that their use in energy production becomes uneconomic, government support notwithstanding (Schmidhuber, 2006; Tyner and Taheripour, 2007; FAO, 2008b). However, when blending mandates apply, the mandated quantities of biofuels will be supplied from production and/or imports. In such cases, the demand for, and the price boost to, feedstock crops will be forthcoming even if the petroleum prices fell to levels that would make biofuel production uneconomic (see below). The extent to which supply side constraints become binding has much to do with policies which can have widely differing impacts on the demand of the different feedstock crops. For instance, policies favouring the sourcing of biofuels from countries with ample production expansion potential of crops with high rates of conversion efficiency to biofuels (e.g. sugar cane in Brazil, eventually in African countries with significant potential for feedstock crops) will have a less severe impact on prices. The opposite is true of policies favouring local sourcing from crops like cereals.
10) The evolution of knowledge and perceptions about the comparative environmental credentials of biofuels will also play a role. Enthusiasm with the latter has been waning: expansion of cultivation into virgin and forested areas, pressure on water resources as well as the use of conventional energy inputs in their production (fuel, fertilizer and other chemicals) can greatly reduce, even turn negative, the environmental gains from reduced CO2 emissions associated with the substitution of biofuels for fossil fuels. A good discussion of this issue is in FAO (2008b, Chapter 5). The growing awareness of the environmental limitations and food security implications of biofuels is moving the issue up the political agenda, e.g. in the European Parliament where the 10 percent E.U. target for biofuels in transport by 2020 has come under scrutiny.
8http://web.worldbank.org/WBSITE/EXTERNAL/EXTDEC/EXTDECPROSPECTS/EXTGBLPROSPECTSAPRIL/0,,contentMDK:20891436~isCURL:Y~menuPK:902607~pagePK:2470434~piPK:4977459~theSitePK:659149,00.html

8
11) This notwithstanding, we must prepare for the eventuality that the risk of fuel-food competition intensifying materialized, with adverse effects on the food security of some countries and population segments: if it happened, the purchasing power of those demanding more energy could easily overwhelm that of the poor demanding food. Food demand on the part of the non-poor will also be affected but this population group can stand up (with an “acceptable” loss of welfare) to the pressures emanating from the energy sector– they also gain from whatever advantages the biofuels bring to the energy market9. In parallel, the potential for increased production and incomes in agriculture from higher prices must also be factored in, although food security benefits from this source will depend on the extent to which low income farmers participate as net sellers in the bonanza of higher producer prices. Such eventual benefits must be set against the potential losses of those who are net buyers – both rural and urban.
2. Growth of World Food and Feed Cereals Consumption Continues to Slowdown
12) A first step in any attempt to address these issues is to estimate the magnitude of food demand in the long term in the different countries, together with an evaluation of their resource and economic potentials to increase production, and unfold the implications for food imports and exports. FAO’s latest attempt in this area dates from work done in 2003-05 (FAO, 2006). The projections were based on historical data up to 2001. The broad message of the projections to 2030/2050 was that the slowdown in aggregate demand for the major food commodities, already evident in the recent past, would continue as population growth decelerated and per caput consumption of ever growing parts of world population attained higher levels. The projections endeavoured to depict the future food situation as it is likely to be, not as it should be from some normative standpoint, e.g. one with all countries and population groups attaining some “acceptable” level of food security and nutrition. This reflects the prospect that low incomes and poverty, hence inadequate food consumption and undernutrition, will persist in several countries, though at lower levels than at present. The study concludes: “The slowdown in the growth of world consumption is a very mixed blessing. On the positive side we must count the influence of the lower population growth and the gradual approaching of saturation levels in per caput food consumption in a growing number of countries. On the negative side is the prospect that there will still be countries with persistent low overall food consumption levels whose population would consume more if they had access to more food” (FAO, 2006:37)
13) The slowdown would be most pronounced for rice, less so for wheat and virtually absent for coarse grains, at least in the medium term, as growing quantities of the latter would be used as animal feed in, mainly, the developing countries. The growth of meat consumption would also slowdown over the medium term as the main driver of the recent past (China) was bound to provide less of a stimulus, given that it had already attained per caput consumption approaching 50 kg (see below for uncertainties surrounding this
9 The growing supply of biofuels has a significant impact, according to some, on both crude petroleum prices (lowering them 15%, see “As Biofuels Catch On, Next Task Is to Deal With Environmental, Economic Impact”, Wall
Street Journal, 24 March 2008) and on retail gasoline prices in the U.S. (Du and Hayes, 2008).

9
figure). In contrast, the consumption of milk and dairy products would continue on a path of rising growth rates. The growth rates of food consumption of vegetable oils would also continue to be high as in the past (for details on these issues, including the extent to which the growth of the demand for meat may be a key driver of future developments, see FAO, 2006).
14) These findings were on the assumption that no major structural factors would intervene to alter this pattern of gradual slowdown in aggregate consumption. There was no allowance for biofuel use of cereals in the projections, except to the (unknown) extent that the coefficients used for projecting non-food industrial uses (derived from the historical data in the SUAs) implicitly reflected such use. Given recent developments, we must pose the question whether the rise in the petroleum price and the boost it gave to production costs and the diversion of maize and other crops to biofuels is such a factor that can prove to be disruptive of the normal evolution towards a slowdown in aggregate demand.
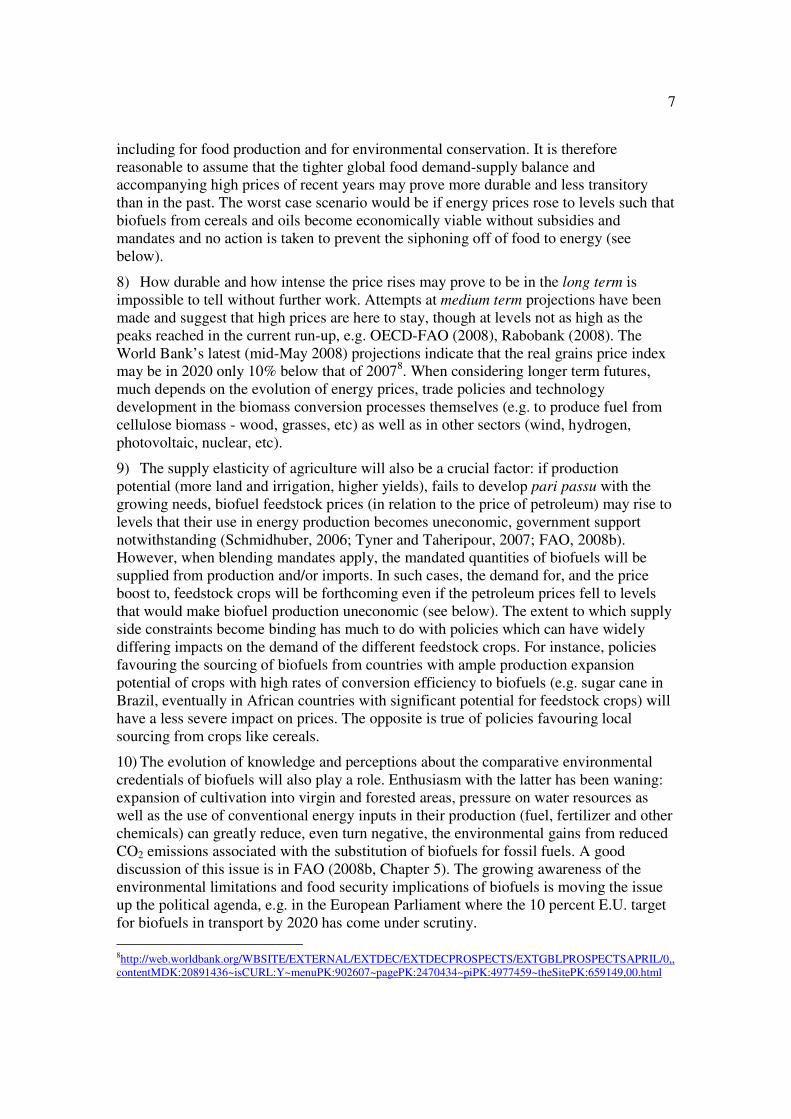
15) We do this by comparing the growth rates of world consumption10 of cereals (with and without the maize use for ethanol in the U.S.) in the seven-year period 2002-08 (year 2008 data are USDA forecasts as of October 14, 2008), i.e. the years after the onset of the current price rises, with those of the preceding 7 and 10 years, separately for wheat, rice and coarse grains. The growth rates refer to world totals excluding data for the former Soviet Union (F.S.U.). This is in order to avoid distortions in the historical growth rates, given that apparent consumption in the F.S.U. collapsed 50% in the 1990s following the shock of systemic change in the economy11. It can be seen (Fig. 3) that world consumption of both wheat and rice has grown at lower rates than in the past. The opposite is true for coarse grains, whose growth rate doubled in 2002-08 from that of the preceding seven years, but rose by much less if the maize use for ethanol in the U.S. is excluded. As regards total cereals, the same pattern emerges: faster growth in 2002-08 than in the past because of the U.S. maize use for ethanol, but slower without such use12. This conclusion would probably be reinforced if we had time series historical data on biofuel use of cereals in other countries.
10As noted, FAO has no published consumption data derived from full Supply-Utilization Accounts (SUAs) and Food Balance Sheets (FBS) for after 2003. The USDA – PSD has data for cereals as well as for several other food commodities. Aggregate consumption (or domestic disappearance) is derived as: Production + Opening stocks + Imports – Exports – Closing stocks=Total domestic use, including food, feed and non-food uses. We use here these latter data in the public domain to track the evolution of consumption. 11 The collapse of consumption in the F.S.U. meant that the growth of world consumption fell in the 1990s to 1% p.a., down from 1.7% in the preceding decade. Excluding the F.S.U., world consumption had followed the “normal” path of gradual deceleration: 1.8% p.a. in the 80s and 1.6% p.a. in the 90s. 12 This finding applies even if we compare average annual increments rather than growth rates, e.g. the average in 2002-08 is 34.1 mt with biofuels (up from 24.8 mt in 1995-01) and 22.2 mt without biofuels (down from 24.2 mt).
10
Fig. 3 Growth rates of World (excl. F.S.U.) Cereals Consumption, with and without USA maize for fuel ethanol
0
0.5
1
1.5
2
2.5
3
3.5
Rice Wheat CGRN CGRN excl. Etha All CERE All CERE excl. Etha
% p
.a.
1992-2001 1995-2001 2002-08
Source: USDA PSD 13Jul08 ; Maize ethanol data from www.ers.usda.gov/data/feedgrains/FeedGrainsQueriable.aspx,14Oct08 (data for 2008 are
forecasts)
The growth rates are Logest; CGRN=coarse grains
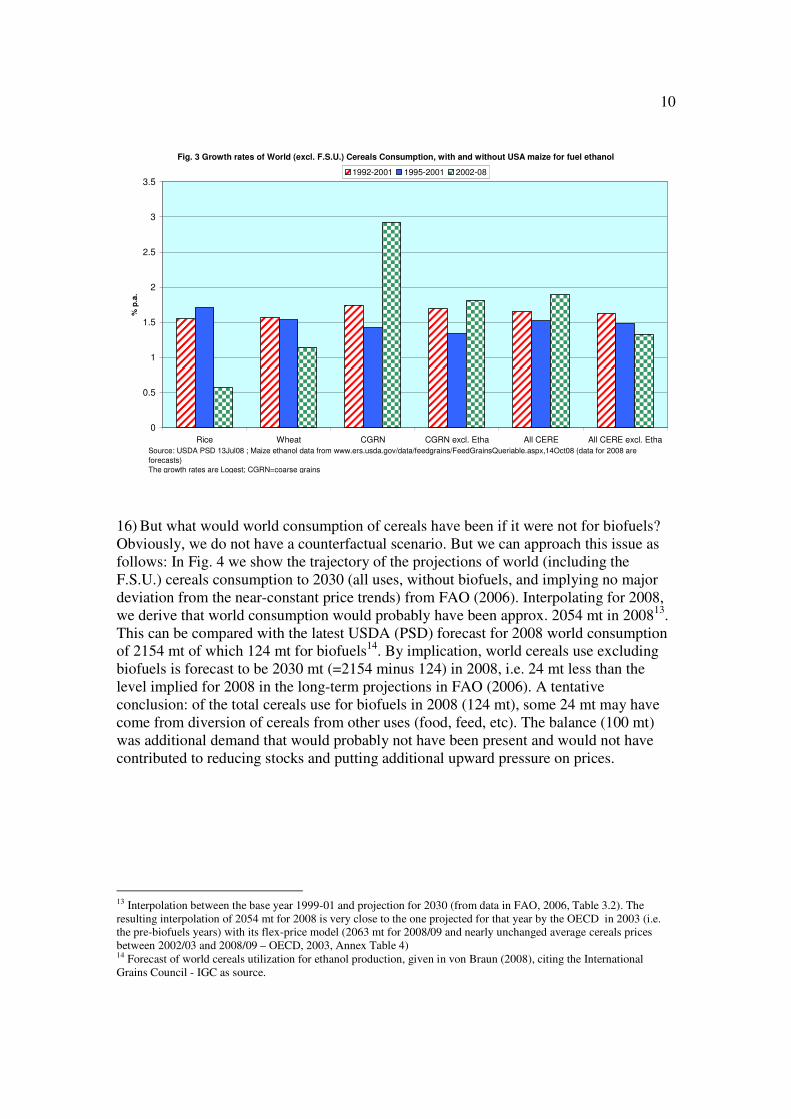
16) But what would world consumption of cereals have been if it were not for biofuels? Obviously, we do not have a counterfactual scenario. But we can approach this issue as follows: In Fig. 4 we show the trajectory of the projections of world (including the F.S.U.) cereals consumption to 2030 (all uses, without biofuels, and implying no major deviation from the near-constant price trends) from FAO (2006). Interpolating for 2008, we derive that world consumption would probably have been approx. 2054 mt in 200813. This can be compared with the latest USDA (PSD) forecast for 2008 world consumption of 2154 mt of which 124 mt for biofuels14. By implication, world cereals use excluding biofuels is forecast to be 2030 mt (=2154 minus 124) in 2008, i.e. 24 mt less than the level implied for 2008 in the long-term projections in FAO (2006). A tentative conclusion: of the total cereals use for biofuels in 2008 (124 mt), some 24 mt may have come from diversion of cereals from other uses (food, feed, etc). The balance (100 mt) was additional demand that would probably not have been present and would not have contributed to reducing stocks and putting additional upward pressure on prices.
13 Interpolation between the base year 1999-01 and projection for 2030 (from data in FAO, 2006, Table 3.2). The resulting interpolation of 2054 mt for 2008 is very close to the one projected for that year by the OECD in 2003 (i.e. the pre-biofuels years) with its flex-price model (2063 mt for 2008/09 and nearly unchanged average cereals prices between 2002/03 and 2008/09 – OECD, 2003, Annex Table 4) 14 Forecast of world cereals utilization for ethanol production, given in von Braun (2008), citing the International Grains Council - IGC as source.

11
Fig. 4 World Cereals Consumption (All Uses), Actual (with & without biofuels) and Projections (without biofuels)
1000
1500
2000
2500
3000
1980
1982
1984
1986
1988
1990
1992
1994
1996
1998
2000
2002
2004
2006
2008
2010
2012
2014
2016
2018
2020
2022
2024
2026
2028
2030
Milli
on
to
ns
FAO, 2006 (Fstat data to 01 & proj. 99/01-2030, proj. excl. biofuels) Actual USDA-PSD, Incl. biofuels Actual USDA-PSD, excl Biofuels for 2004-08.
Projections: FAO (2006), Table 3.2; Actual USDA PSD13Jul08; Biofuels 2004-08 from von Braun (2008).
17) Recapitulating: the preceding calculations attempt to put some flesh on the trivial statement that if cereals use for biofuels had not occurred, prices would have been lower and as a result the demand for food, feed etc would have been higher than the actual 2030 mt forecast for 2008. Naturally, this does not tell us anything about by how much prices would have been lower. Not much can be said about price effects without running counterfactual scenarios on full-fledged multi-commodity models that would help us ascribe part of the price increases to the demand for biofuels. On this issue, opinions differ widely and give rise to fierce debates. At one extreme, press reports have it that the U.S. Secretary of Agriculture considers that biofuels were responsible for only 2-3 percent of the global food price increase15. At the other end, Nobel laureate Gary Becker holds that the high petroleum prices and biofuels are the most important forces behind the recent food price surges16.
18) The International Food Policy Research Institute - IFPRI (Rosegrant, 2008) attempted to quantify what part of the cereals price rise over the period 2000-0717 was caused by biofuels demand. They conclude that the increased biofuels demand accounted for 30% of the average price rise of cereals and for 39% of that of maize. Here the term “increased biofuels demand” means the difference between actual demand in 2007 and the one that would have prevailed in that year if such demand had not accelerated after 2000 but had followed the trend of 1990-2000; I interpret this to mean that they estimate not the price impact of all biofuels demand but only of that part caused by the acceleration in such demand after 2000. We have no time series data of world cereals use
15 “U.S. rejects criticism over policy on biofuels”, International Herald Tribune, May 31, 2008 16
“Rising Food Prices and Public Policy”, http://www.becker-posner-
blog.com/archives/2008/04/rising_food_pri_1.html 17 By 87% in current dollars, by 64% in constant 1990 dollars, according to the World Bank cereals price index.

12
for biofuels over the period 1990-2007, so we cannot gauge what are the actual tonnages involved in the IFPRI estimation. We can use the U.S. time series data for maize use for fuel ethanol to approximate the magnitudes involved: if trends in 1990-2000 had continued, 2007 use would have been 23 mt18. The actual was 76 mt, a difference of 53 mt. This latter figure is 6.8% of world maize consumption of 777 mt in 2007, or somewhat higher if maize use for ethanol in other countries were taken into account, and, according to IFPRI, was associated with 24% rise in the real price of maize (39% of the 61% rise in maize price in constant 1990 dollars - price data from the World Bank – Commodity Price Data).
19) In early July 2008 a press story had it that there was a “secret” World Bank report placing major responsibility for the food price surge on biofuels: the latter apparently accounted for 75% of the 140% increase in food prices from 2002-February 200819. The report is no more “secret” after it was released in late July 2008 (Mitchell, 2008). The conclusions, somewhat re-phrased, and referring to the 130% rise in IMF’s price index of internationally traded food commodities from January 2002-June 2008, confirm the above press item. In like manner, Keith Collins (2008), former chief economist in USDA, referring to the price of maize in the U.S. (but only in last two years), considers that its use for ethanol has likely been the main cause of the rise in its price.
20) Do these findings provide a prima facie case for thinking that the diversion of cereal supplies to bioenergy is the major determinant of the recent surges in their prices? An article in the Economist is emphatic20. Naturally, not the entire price hike can be considered to be due to the demand for biofuels: as noted, other factors played a role, e.g. weather-induced crop failures in several major producing countries, particularly in 2007, stock depletion in earlier years, the depreciation of the dollar (see below), etc. However, not all people think that biofuels use of cereals has been the dominant factor and emphasize the surge in food and feed consumption, as mentioned in the Prologue. It is therefore worth examining critically these alternative perceptions currently in circulation.
3. Blaming China (and India)
21) Strong economic growth in the emerging economies, particularly China and India, is commonly cited as a major cause for the food prices surge, e.g. IMF (2008a: 60). An article in The Guardian
21 has the head of the International Food Policy Research Institute stating that one half of the price increases was due to strong income growth while biofuels accounted for another 30%. A recent briefing paper from Chatham House (Evans, 2008) offers a similar interpretation. Amartya Sen22 recently added his voice to those that emphasize spurts in the demand for food on the part of the newly rich in emerging countries as a factor affecting adversely access to food by the poor. No doubt,
18 Best fit polynomial 2nd degree trend on data 1990-2000 from www.ers.usda.gov/data/feedgrains/FeedGrainsQueriable.aspx 19 “Secret report: biofuel caused food crisis”, The Guardian, July 4, 2008. 20 “Grain prices go the way of the oil price”, Economist, June 21, 2007 21 “Feed the world? We are fighting a losing battle, UN admits”, the Guardian, 26-02-2008 22 “The Rich Get Hungrier”, New York Times, 28 May 2008

13
this is frequently true, and can raise food prices, in specific local situations (the rich always get served first, nothing new here), but here we are talking about whether such behaviour of the newly rich has accelerated global demand for food and feed in recent years: it has not.
22) That the great bulk (almost the totality in the pre-biofuels era) of the annual increment in demand for most crops comes from food and feed is by itself a trivial statement. This has always been the case. The key issue is why it is now considered to be causing price surges, while it did not cause them in the past. Is it because now the increments are larger? We have seen that this is not the case for cereals at the world level, whether we consider growth rates or absolute increments. As we shall see, the same applies for China and India: their combined average annual increment in consumption (both growth rates and absolute increments) was lower in the years of the price surges 2002-08 than in the preceding similar period 1995-2001.
23) There are notable exceptions to this seeming consensus, e.g. Becker (op. cit.) and Bill Emmott, former editor of the Economist23. Exceptions have tended to proliferate as time passed: they include the World Bank (2008a) in its paper for the July 2008 G-8 meeting as well as in its Global Development Finance 2008 (World Bank, 2008c) and, of course, (Mitchell, 2008, who had taken this position early in 2008), and, most recently (September, 2008), Naylor and Falcon (2008).
24) Naturally, if the behaviour of the new middle classes and the newly rich in the emerging countries is causing the present havoc and bids food away from the poor there is reason to worry about the Malthusian prospect, though not in its original formulation but rather a version emphasizing constraints to securing western-type or similar diets for every person in the world within some not-too-distant time horizon24. If so, we may need to revise the position that world demand growth is, and would continue to be, on a course of gradual deceleration if demand for biofuels is not accounted for. Before rushing into revisions, let us pose the question again: is demand for food and feed really accelerating and/or not following the predicted path of gradual deceleration? What is the evidence?
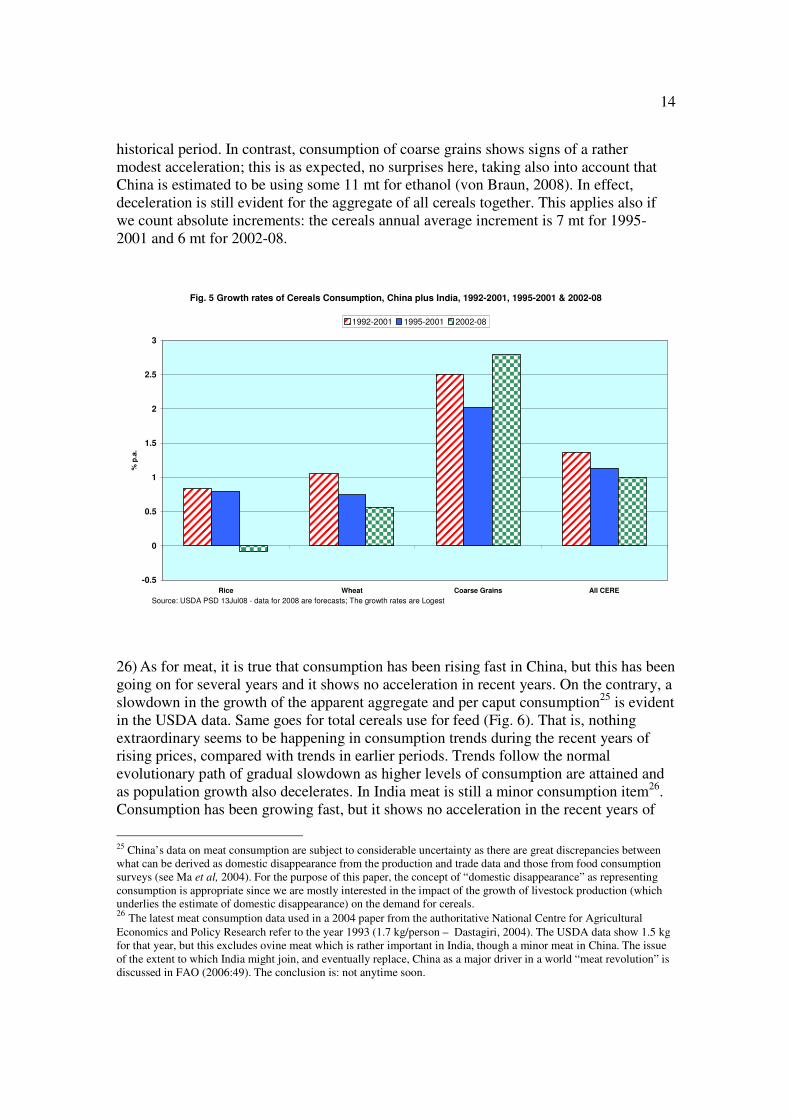
25) We showed earlier (Fig. 3) that global cereals use is slowing down, not accelerating, if biofuels are excluded. It seems to follow the path of the long term projections in FAO (2006). What do country level data show, particularly for the two alleged culprits, China and India? The USDA data permit us to track developments in their apparent aggregate consumption or domestic disappearance. We can then ask the question: are trends in consumption exhibiting significant breaks in recent years of rising prices compared with earlier years when prices were not rising? In other words, has the process of gradual deceleration been halted or reversed and is demand growing faster than in the past? Fig. 5 shows that this is not the case: the combined (India plus China) domestic consumption (or domestic disappearance for all uses) of both wheat and rice has continued to decelerate during the recent years of price rises, just as it had been doing for some time in the
23 “GM Crops can save us from food shortages”, Daily Telegraph, 17 April 2008. 24 That the global food production potential may potentially evolve to provide for satisfactory diets to a peak world population of about 9 billion by 2050 is not equivalent to saying that Malthusian fears are unfounded. It is possible that other resource constraints may stand on the way to achieving that goal, e.g. energy and the capacity of the ecosystem to absorb the waste generated by its increased use. See Alexandratos (1995: 32-34), also Ferguson, Niall. "Don't Count Out Malthus", Los Angeles Times, 30 July, 2007.
14
historical period. In contrast, consumption of coarse grains shows signs of a rather modest acceleration; this is as expected, no surprises here, taking also into account that China is estimated to be using some 11 mt for ethanol (von Braun, 2008). In effect, deceleration is still evident for the aggregate of all cereals together. This applies also if we count absolute increments: the cereals annual average increment is 7 mt for 1995-2001 and 6 mt for 2002-08.
Fig. 5 Growth rates of Cereals Consumption, China plus India, 1992-2001, 1995-2001 & 2002-08
-0.5
0
0.5
1
1.5
2
2.5
3
Rice Wheat Coarse Grains All CERE
% p
.a.
1992-2001 1995-2001 2002-08
Source: USDA PSD 13Jul08 - data for 2008 are forecasts; The growth rates are Logest
26) As for meat, it is true that consumption has been rising fast in China, but this has been going on for several years and it shows no acceleration in recent years. On the contrary, a slowdown in the growth of the apparent aggregate and per caput consumption25 is evident in the USDA data. Same goes for total cereals use for feed (Fig. 6). That is, nothing extraordinary seems to be happening in consumption trends during the recent years of rising prices, compared with trends in earlier periods. Trends follow the normal evolutionary path of gradual slowdown as higher levels of consumption are attained and as population growth also decelerates. In India meat is still a minor consumption item26. Consumption has been growing fast, but it shows no acceleration in the recent years of
25 China’s data on meat consumption are subject to considerable uncertainty as there are great discrepancies between what can be derived as domestic disappearance from the production and trade data and those from food consumption surveys (see Ma et al, 2004). For the purpose of this paper, the concept of “domestic disappearance” as representing consumption is appropriate since we are mostly interested in the impact of the growth of livestock production (which underlies the estimate of domestic disappearance) on the demand for cereals. 26 The latest meat consumption data used in a 2004 paper from the authoritative National Centre for Agricultural
Economics and Policy Research refer to the year 1993 (1.7 kg/person – Dastagiri, 2004). The USDA data show 1.5 kg for that year, but this excludes ovine meat which is rather important in India, though a minor meat in China. The issue of the extent to which India might join, and eventually replace, China as a major driver in a world “meat revolution” is discussed in FAO (2006:49). The conclusion is: not anytime soon.

15
rising prices; and feed use of cereals seems to have flattened out at about 9 mt (Fig. 7). At this level, feed use of cereals does not seem to be a swing factor in India’s total demand for cereals of some 200 million tons.
Fig. 6 China Meat Consumption (excl. ovine meat) & Cereals Feed Use
-20
0
20
40
60
80
100
120
1980
1981
1982
1983
1984
1985
1986
1987
1988
1989
1990
1991
1992
1993
1994
1995
1996
1997
1998
1999
2000
2001
2002
2003
2004
2005
2006
2007
Mill. t
., K
g/C
ap
ut,
% p
.a.
MeatCons. (mill.t.) MeatCons.Annual % MeatCons.Kg/Caput CerealsFeed (mill.t)
Probable revision/break in meat data series in
1996, following the 1997 agr. census
Pig Disease
Outbreak
Source: USDA PsD, 13Jul08
Fig. 7 India Meat Consumption (excl. ovine meat) & Cereals Feed
0
1
2
3
4
5
6
7
8
9
10
1986 1987 1988 1989 1990 1991 1992 1993 1994 1995 1996 1997 1998 1999 2000 2001 2002 2003 2004 2005 2006 2007
Mil
l. t
. &
Kg
/Cap
ut
-30
-20
-10
0
10
20
30
40
50
60
70
% p
.a.
MeatCons. (mill.t.) MeatCons.Kg/Caput CerealsFeed (mill.t) MeatCons.Annual % (right scale)
Source: USDA PsD, 13Jul08. (Data start from 1986 because there is an apparent break in the series (beef doubling from 1985 to 1986)

16
27) It would appear that the much touted “income effect” has had at best a limited role as an explanatory factor of the price surges. In particular, it is difficult to think how the recent (from late 2007) sharp rises in the price of rice in the face of record world production in 2007 can be ascribed to sudden increases in demand due to the income effect: rice consumption per caput tends to stabilize or even decline rather than increase with rising incomes and urbanization in the major rice-consuming countries. It is, of course, possible that demand for rice was stimulated if consumers substituted rice for other foods in consumption following the sharp rises in the prices of wheat and maize which had started earlier (World Bank, 2008c:23). However, in the last three years (2005-07) the annual growth rate of world rice consumption remained in the range 1.2%-1.4%. One is tempted to relate price rises to the decline in world rice stocks, which indeed fell by almost one half from 2000-2007. However, the fall had bottomed out by 2004 while rice prices really shot up only in spring 2008. Moreover, the fall in global stocks cannot have been a major factor, seeing that 80% of such decline was due to drawdown of stocks in China, apparently a deliberate policy implemented by means of reduced production incentives. China’s rice production declined in 6 years in succession from a peak 140 mt in 1997 to 112 mt in 2003. It has not fully recovered yet (130 mt forecast for 2008/09). As noted, export bans (themselves a form of hoarding) in the face of rising wheat and coarse grain prices, panic buying (including on the part of highly import-dependent countries) and hoarding – including by consumers (a veritable “run on rice”, according to some27) seem to have been key factors in the surge of rice prices.
28) The deceleration of world consumption growth reflects, of course, also the rising prices of recent years, i.e. in addition to the standard forces that make for such deceleration (declining population growth and gradual attainment of higher consumption per caput). However, the conclusion that the income effect had at best a modest role in the price surges still stands. Had it played a larger role, this would have shown up as acceleration in demand in the recent years even after accounting for the depressing effect of rising prices, a point made by Becker (op. cit.). We provided above (Fig. 4) a rough-and-ready estimate from the projections in FAO (2006) indicating that world consumption of cereals in 2008 would have been 2054 mt (or 2063 mt according to OECD, 2003 under near-constant prices), i.e. about 1.2% above the actual level used for food, feed, and other non-biofuel uses.
29) A tentative conclusion may be drawn: if acceleration in the demand for cereals has been one of the underlying causes of the price surges, it did not come from the combined demand of the two Asian giants. The latest World Bank paper for the G-8 underlines the little growth that has characterized consumption of cereals in East Asia, by implication “absolving”, as it were, the region from “responsibility” in the price surges of cereals (World Bank, 2008a; also, World Bank 2008c:25).
30) But were these countries implicated in the world price surge of cereals in ways other than by accelerating their consumption growth? Changes in their foreign trade balances suggest such a role, albeit a minor one. For the last ten years they have been net exporters
27 “What spurred the run on rice; High food prices prompted producers to hoard, limiting supply. The rush to stockpile
followed”, Business Week, 12 May 2008

17
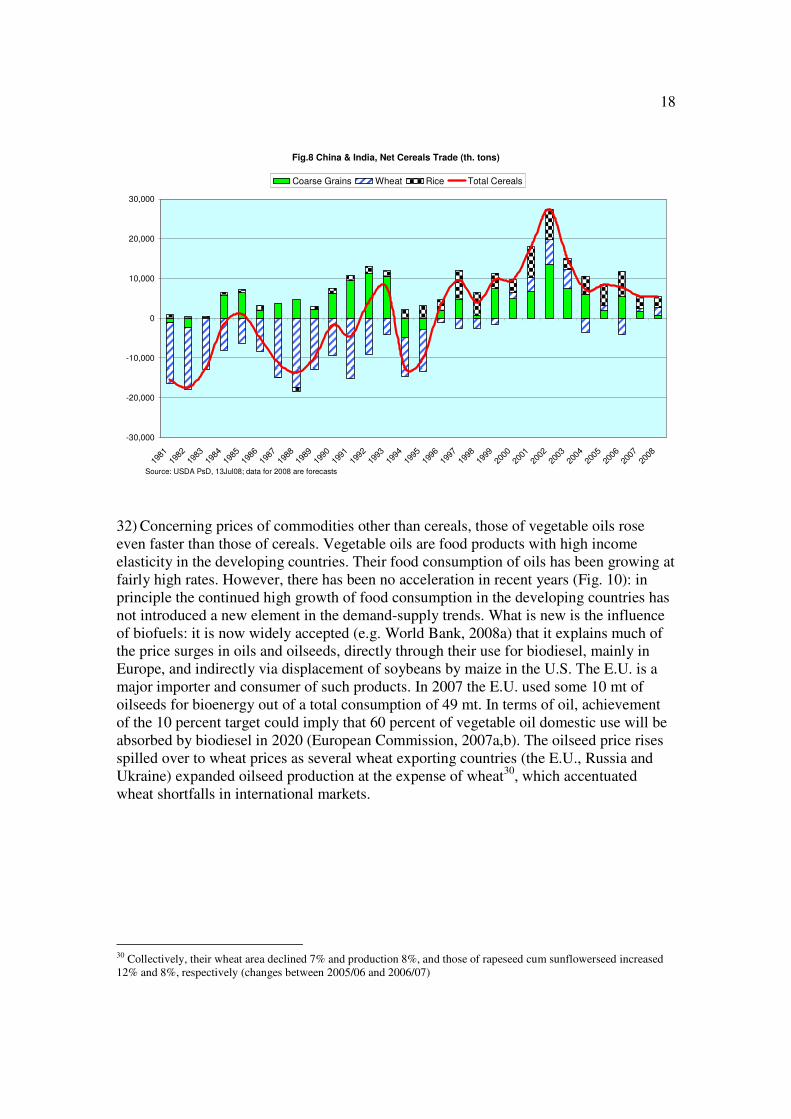
of cereals reaching peak net exports of 27 mt in 2002. Thereafter the net export balance kept falling – to some 5 mt by 2007 (Fig. 8). Coming at a time when world trade in cereals had to absorb upheavals in the main exporting countries (crop failures in Australia and elsewhere, the E.U. turning from a significant net exporter to net importer in 2007, maize diversion to biofuels in the U.S.), there is a prima facie case that the fall in the net exports of China and India has played a role in the price rises.
31) But why did their net exports fall? We saw that consumption growth did not accelerate. One plausible explanation seems to be that the process of stock depletion that has been going for some time and supported the increases in exports came to an end. Although both India and China contributed to the fall in their combined net exports, the dominant role of China in these developments must be underlined. The country is reported as having had accumulated huge cereals stocks: to believe the data28, its end-season stocks during the period 1990-2007 reached a peak of 324 mt in 1999, 87% of its annual consumption29. In contrast, the corresponding numbers for the rest of the world were 260 mt and 17.5%. There followed a series of years of falling production in China (to 322 mt by 2003) and some recovery thereafter, but production in 2007 at 398 mt was only just above the 392 mt of 1998. Stocks were drawn down and fell to 119 mt by end 2007, 30% of consumption. These changes are clearly seen in Fig. 9 indicating the sharp decline in total domestic supply (production plus beginning stocks) after 1999. One is tempted to say that these developments in China after 2000 were a presage of things to come: the country accounted for 55-60% of world cereals stocks in 1996-2000, still accounts for 35% currently, while 80% of the fall in world stocks from 2000-07 was due to the decline in China’s stocks. However, caution is required. China has a small weight in world cereals trade. Therefore, changes in world stocks due predominantly to changes in China’s stocks (the case in the years after 2000) should reduce significantly the value of movements in world stocks as a correlate of movements in world prices. More important are changes in the stocks of the major trading countries (Abbott, Hurt and Tyner, 2008).
28 There are great uncertainties concerning the quality of stocks data of China (see FAO, 2006, Box 3.2, and FAO, 2004). 29 Problems associated with the huge stocks accumulated by the late 1990s included overflowing granaries and losses due to quality deterioration as well as large financial losses from sales (domestic and export) at below-cost prices. These problems prompted policy reforms to reduce stocks. They included some relaxation of policies that obliged farmers to produce cereals (OECD, 2005:37; see also USDA, 2001).
18
Fig.8 China & India, Net Cereals Trade (th. tons)
-30,000
-20,000
-10,000
0
10,000
20,000
30,000
1981
1982
1983
1984
1985
1986
1987
1988
1989
1990
1991
1992
1993
1994
1995
1996
1997
1998
1999
2000
2001
2002
2003
2004
2005
2006
2007
2008
Coarse Grains Wheat Rice Total Cereals
Source: USDA PsD, 13Jul08; data for 2008 are forecasts
32) Concerning prices of commodities other than cereals, those of vegetable oils rose even faster than those of cereals. Vegetable oils are food products with high income elasticity in the developing countries. Their food consumption of oils has been growing at fairly high rates. However, there has been no acceleration in recent years (Fig. 10): in principle the continued high growth of food consumption in the developing countries has not introduced a new element in the demand-supply trends. What is new is the influence of biofuels: it is now widely accepted (e.g. World Bank, 2008a) that it explains much of the price surges in oils and oilseeds, directly through their use for biodiesel, mainly in Europe, and indirectly via displacement of soybeans by maize in the U.S. The E.U. is a major importer and consumer of such products. In 2007 the E.U. used some 10 mt of oilseeds for bioenergy out of a total consumption of 49 mt. In terms of oil, achievement of the 10 percent target could imply that 60 percent of vegetable oil domestic use will be absorbed by biodiesel in 2020 (European Commission, 2007a,b). The oilseed price rises spilled over to wheat prices as several wheat exporting countries (the E.U., Russia and Ukraine) expanded oilseed production at the expense of wheat30, which accentuated wheat shortfalls in international markets.
30 Collectively, their wheat area declined 7% and production 8%, and those of rapeseed cum sunflowerseed increased 12% and 8%, respectively (changes between 2005/06 and 2006/07)

19
Fig. 9 Cereals Total Supply (=Production+Beginning Stocks) & Net Trade, China, India
0
100
200
300
400
500
600
700
800
19
90
19
91
19
92
19
93
19
94
19
95
19
96
19
97
19
98
19
99
20
00
20
01
20
02
20
03
20
04
20
05
20
06
20
07
19
90
19
91
19
92
19
93
19
94
19
95
19
96
19
97
19
98
19
99
20
00
20
01
20
02
20
03
20
04
20
05
20
06
20
07
China India
mill.
to
ns
-20
-15
-10
-5
0
5
10
15
20
mill.
to
ns
Production Beg.Stocks Net Trade (right scale)
Source: USDA PsD 13Jul08
Fig.10 Developing Countries, Vegetable Oils, Food Consumption per Caput
-5
0
5
10
15
20
25
1982 1983 1984 1985 1986 1987 1988 1989 1990 1991 1992 1993 1994 1995 1996 1997 1998 1999 2000 2001 2002 2003 2004 2005 2006 2007
% p
.a.
& k
g/c
ap
ut
Annual % Kg
Source: USDA, PSD, May08
33) There is also a discernible role for China in the price surges of oilseeds. The country’s imports of soybeans literally skyrocketed in recent years. China now accounts for 45 percent of world imports, up from less than 10 percent ten years earlier. The USDA data
20
show that some 17 percent of total supplies go into direct food consumption. Some would be used for seed and there will be losses through waste. The rest is crushed into oil (for the fast growing food use but also for non-food industrial uses) and oilmeal for animal feed. The latter grew three-fold in the last ten years. Yet there has been no acceleration in meat production to justify this surge in soybean imports and oilmeal supplies and use. If anything, pigmeat production (which accounts for some three quarters of all meat) declined sharply in 2007 due to disease (see Fig. 6)31. Even the fast growing milk production seems to have slowed down to an annual increase of 9% in 2007, compared with annual increases of 15-32 percent in the preceding 4 years. One possible explanation is that the implied rapid growth of apparent consumption of soybean meal is increasingly substituting for cereals in livestock feeding and in fish farming – something which perhaps explains the slow growth in China’s cereals feed use in recent years (Fig. 6).
34) In conclusion, the much touted acceleration of the demand for food in China and other emerging countries does not seem to have been a major novel element in the present upheavals. This is not to deny that in the countries with middle-low food consumption levels the growth of food demand tends to accelerate when incomes rise at high rates. However, this is a gradual process and normally does not go on for very long. In particular, the fast growth of meat consumption has been going on for some time and much of it occurred before the current price surge: per caput apparent consumption of meat in China grew from 36 kg in 1996 to 51 kg in 2005 and then fell in the two subsequent years to 47.5 kg in 2007 (Fig. 6). It is not the first time that China’s alleged huge appetite, particularly for meat, is seen as a threat to world food security. Back in 1995 Lester Brown’s celebrated book Who Will Feed China? provoked a stir (Brown, 1995; for critique see Alexandratos, 1996). As we saw, China went on to become a net exporter of cereals while also raising its meat consumption. The OECD-FAO (2008), projections estimate zero cereals net trade for 2017 (and small net exports for India). China could become a modest, for its size, net importer in the future. I will venture a guess: the conventional wisdom may have been prompted by the role of the emerging countries, in particular China, in creating a significant demand shock, and consequent rising prices, in other commodity sectors, e.g. energy and metals. This requires that we address the issue of the role of the more general commodity boom in the food prices run-up.
4. Is the Petroleum Price Surge the Culprit?
35) The preceding discussion indicates that if a demand shock is an argument in the cereal price rises, it more likely originated in the emergence of the biofuels sector as a novel user of cereals rather than in spurts in the demand for food and feed. The path of cereals consumption we showed earlier (Fig. 4) suggests that the only demand shock discernible in the data is that of biofuels that contributed to raise the growth rate of global consumption of coarse grains and led to world consumption of cereals to be higher than it would have been otherwise. The rise in the price of petroleum, together with the
31 USDA (2007). As noted, China’s livestock production data (and by implication those of apparent consumption) present a number of problems (see FAO, 2006, Box 3.2).
21
accompanying policy responses in support of biofuels, has been instrumental in these developments because they made profitable such use of agricultural commodities.
36) That the price of petroleum affects the prices of agricultural products is, of course, nothing new. However, the traditional view has been that the link worked via (a) the effects on production costs given agriculture’s heavy use of energy intensive inputs – fertilizer, fuel and, in irrigated agriculture, also electricity32, and (b) the macroeconomic effects, e.g. influence of the petroleum price on inflation, incomes, interest rates, exchange rates and foreign trade. Both effects suggest a negative impact on the growth of the demand for agricultural products.
37) Yet we have had a positive impact on demand in parallel with the rise in petroleum prices. Positive impacts could result for some agricultural products (e.g. cotton, rubber) because petroleum price rises would raise the prices of petroleum -based synthetic substitutes and would shift demand to the natural products. Additional positive impacts occur when the increased earnings of the petroleum exporters translate into increased demand for food imports, as it happened in the mid-70s. This concerns mostly the countries with low food consumption levels to start with. It was the case of the Middle East/North Africa countries during the first and second petroleum shocks in the mid-seventies and early eighties: their cereal net imports increased 6-fold between 1972 and 1984, those of meat 15-fold33. Similar changes occurred also in the former Soviet Union, which also benefited from the petroleum boom (Fig. 11). Apparently it is also happening currently (World Bank, 2008b: 39), though we do not have sufficient data yet to validate such statement. Impacts are likely to be less spectacular this time because, unlike the earlier petroleum shock periods, a good part of the gains from the increased petroleum prices accrue now to countries with much less scope for increasing food consumption because consumption levels are already fairly high.
32 Mitchell (2008) estimates that the higher energy prices (fertilizer, etc) plus the dollar depreciation increased food prices 35-40% and the balance of the 130% increase in the IMF index of food prices from January 2002-June 2008 was due to biofuels. He further estimates that the dollar depreciation over the same period (by 26%, a trade-weighted real exchange rate for U.S. bulk agricultural exports) increased food prices by about 20%. By implication, according to this estimate, the increased energy costs caused food prices to increase 15-20% (35-40% minus 20%). 33 The growth of meat imports would have been even sharper if we had import data for ovine meat (a major consumption item in the region), including in the form of live animals, which the USDA data set does not cover.

22
Fig. 11 MiddleEast-North Africa & Former Soviet Union, Net Imports: Cereals and Meat
Periods of First and Second Oil Booms (th. tons)
-10000
0
10000
20000
30000
40000
50000
60000
197
0
197
1
197
2
197
3
197
4
197
5
197
6
197
7
197
8
197
9
198
0
198
1
198
2
198
3
198
4
198
5
198
6
198
7
198
8
198
9
199
0
197
0
197
1
197
2
197
3
197
4
197
5
197
6
197
7
197
8
197
9
198
0
198
1
198
2
198
3
198
4
198
5
198
6
198
7
198
8
198
9
199
0
Cereals - left scale Meat (excl. ovine) - right scale
Cere
als
-200
0
200
400
600
800
1000
1200
Mea
t
F.S.U.-CER M. East+N.Afr-CER F.S.U.-Meat M East+N.Afr-Meat
Source: USDA PsD, 22June08
38) Such positive impacts are now greatly reinforced by the stimulation of the biofuels sector. This is the novel element with which the world is now confronted. If the link between rising petroleum prices and increased demand for, and the prices of, biofuel feedstock crops (in the end the prices of most crops) proves robust, views about future petroleum prices could give us a glimpse about future agricultural prices. The above mentioned article of the Economist with the suggestive title “Grain prices go the way of the oil price” expresses such views. Several researchers conclude that we have entered an era when agricultural prices have become a function of those of petroleum, e.g. Good and Irwin (2008:3). A study by Baffes (2007) finds that the pass-through of petroleum prices to those of non-energy internationally traded primary commodities is significant, with the highest impact exerted on fertilizer prices and those of food commodities. The high prices of the latter would persist (though not necessarily at the high levels reached in early 2008) if petroleum prices remained high.
5. China again: the Link via Energy- and Resource-Intensive Growth
39) These links can also help us gain a better understanding of the role of particular countries in explaining the present price surges in agriculture. For instance, if China has been a major factor in the surge of petroleum prices, then it can be deduced that it also contributed to the increases in agricultural prices, though not because it experienced a spurt in its food demand, as we have seen in the preceding discussion. What do we know

23
about China’s role in triggering off the current commodities boom? Some take it for granted that China has been a prime mover34.
40) There is another interesting dimension to this issue. This has to do with the growing share of the emerging countries in aggregate world output. On the margin, this means that a growing part of additions to world GDP comes from these countries, particularly if measured using Purchasing Power Parity (PPP) exchange rates. The Low and Middle Income countries35 now account for 41 percent of world GDP – measured in PPP International Dollars36 – up from 34 percent in 1992 – see Fig. 12. In the past we used to put the blame for the declines in the prices of primary commodities to, inter alia, the growing “dematerialization” of world GDP growth, i.e. an additional unit of world GDP was obtained with lower than average input of material goods, including energy, as the services sector grew, industry became a more efficient user of raw materials and energy and its share in the economy shrank.
Fig. 12 Percent of World GDP of Low/Middle Income Countries (in PPP$) & Energy Use kgoe/PPP$ (right scale)
30
32
34
36
38
40
42
1992 1993 1994 1995 1996 1997 1998 1999 2000 2001 2002 2003 2004 2005 2006
% o
f W
orl
d G
DP
0.00
0.10
0.20
0.30
0.40
0.50
0.60
Kg
oe/$
World kgoe/PPP$ China kgoe/PPP$ LMY-kgoe/$PPP HIC-Kgoe/$PPP LMY % WorldGDP PPP$ - left scale
Source: World Bank, World Development Indicators 15Aug08, kgoe/PPP$=kg oil equivalent per constant 2005PPP$
LMY=Low&MiddleIncomeCountries; HIC=HighIncomeCountries
41) The growing weight of the emerging countries, which use more material inputs per unit of GDP (here represented by total energy use in petroleum equivalent per PPP$ of GDP– Fig. 12, showing separately China), implies that this process has now slowed down. Apparently, in China the process has gone into reverse as the industrial structure
34See, for example, “China's Quest for Resources: A Ravenous Dragon”, The Economist, 13 March 2008; also World Bank (2007:6; 2008b:32, 38), IMF (2008a:197). 35 World Bank definition; country list in http://siteresources.worldbank.org/DATASTATISTICS/Resources/Class.xls 36 An international dollar would buy in the country a comparable amount of goods and services a US dollar would buy in the United States
24
has been shifting from light manufacturing to heavy industry37. Some observers emphasize the shift from a "commodity-lite" to a "commodity-intensive" period of economic growth 38 as a major factor in the surge in commodity demand and prices. A provisional conclusion: if the emerging economies continued on their high-growth path, we can expect that the slowdown in the “dematerialization” process, and hence vibrant commodity demand, will be with us for some time, though these countries will be gradually shifting towards the "commodity-lite" pattern of development in the longer term (see below).
6. Are Food Commodity Prices Trailing those of Energy and Metals?
42) All this is well and credible enough, but it leaves unanswered the question why food prices would soar along with those of energy and metals. After all, the main determinants of the demand for food are not pointing in the direction of significant changes in the “traditional” fundamentals. As noted, these fundamentals point to a slowdown rather than acceleration in food demand, occasional spurts notwithstanding (e.g. following windfalls accruing to countries with low food consumption levels). We referred earlier to some factors that may explain in part why food prices followed the rising path of non-food commodities. To recapitulate:
a) Biofuels demand triggered by the high petroleum price and policies, the dominant factor according to many (see above);
b) The increased production costs of crops because of the rise in the price of energy-related inputs (fertilizer, fuel, electricity) and the knock-on effects on the prices of livestock products because of the growing cost of feed. In addition, CIF prices rose even more because of the rise in transport costs, again an effect of rising petroleum prices and the more general commodity boom (see below). Some commentators assign primary importance to the petroleum price factor, e.g. Bill Emmott (op. cit.);
c) The eventual surge in food demand and imports on the part of the countries exporting energy and metals, following their increased incomes and export earnings. We noted earlier the experience of the Near East/North Africa countries and of the former Soviet Union during the first and second petroleum shocks in the mid-seventies and early eighties (Fig. 11). Data available at the moment are not sufficient to establish whether this has been an important factor in the current food price surges. As noted, it is likely to be less important than in the past. In addition, an eventual boost to food demand and imports from this source may be counterbalanced by declines in the incomes, hence of food demand and imports, in countries not benefiting but rather being harmed by the commodity booms;
d) The coincidence with the period of high prices of the non-food commodities of cereal crop shortfalls in a succession of years, and the consequent drawdown of
37 See “China must learn to do more with less”, the Economist, 13 March 2008 38 Stephen King (managing director of economics at HSBC), “Commodity-intensive growth requires institutional reform”, the Independent, 16/04/08
25
stocks, a process that started in the early 1990s (Fig. 2, see earlier discussion). No wonder the world was ill prepared to face the major disturbance represented by the advent of the high petroleum prices and related stimulus to biofuels. It is possible to think that if it were not for the petroleum price surge and its effect on biofuels, the impact of the production shortfalls would have been much less severe, price rises would have been contained and the situation would tend to revert to normality over the short-to-medium term, just as it happened in the past;
43) To these factors we need to add the effects of policy responses to the rising food prices on the part of several countries in their endeavour to contain the impact on domestic consumption: export restraints, lowering import barriers and outright food subsidies. By shielding domestic economies from the effects of price movements in world markets, such policies contribute to magnify price swings and subdue the response of production to the higher prices.
44) Points (a) and (b) represent straightforward links between the price of petroleum and those of agriculture. Point (d) has become of prime importance in the current crisis because it coincided with the other factors. Are there any other factors that may have contributed to the food price surges? Addressing this question requires a closer look at the fact that in the current experience the prices of nearly all commodities, not just food, rose more or less in unison. In terms of annual averages, grain prices started creeping up from their trough in 2001 (from early 2002 in terms of monthly prices). Petroleum prices had started their rise two years earlier and metals/minerals followed in 2002. If the pattern of commodity prices moving more or less in unison proves to be durable and robust, one could look for answers to why food prices have risen (and about future prospects) to, inter alia, the causes that prompted the price surges of petroleum and metals. As noted, a major factor has been the spectacular economic growth in China. The literature on commodity price movements often emphasizes the role of exchange rates and monetary policy or interest rates. The former has to do with the fact that the prices are quoted in dollars and the latter that the cost of money is normally inversely related to the prices of real assets, including commodities.
7. A Role for Exchange Rates and Monetary Policy in the Price Surges
45) The recent commodity price surges occurred at a time when also the dollar exchange rate was under severe pressure. The dollar depreciated in varying degrees against most other currencies, e.g. by 30% in Brazil, 25% in the Philippines, 20% in the Eurozone and 18% in the CFA African countries, though by less than 5% in Indonesia and Mexico (nominal exchange rate changes between the annual average of 2005 and March 2008). Over the same period the dollar prices rose 189% for wheat, 107% for rice and 138% for maize39. Therefore, the revaluations sterilized only a small part of the price rises for these countries. Moreover, for importing countries the increases in prices were further magnified by the rise in transport costs. For example, the wheat price (US Gulf) was in
39 Prices from World Bank, Commodity Price Data; Exchange Rates from www.ers.usda.gov/Data/ExchangeRates/
26
mid-June 2008 $369/ton, up $134 or 57% on year-ago, but with freight (to Europe) added it came to $451, up $179 or 66%, given that freight had also risen from $37 to $82/ton40.
46) The more interesting question is, of course, whether the slide of the dollar is itself a factor in the surge of the dollar denominated commodity prices. Some people think so41. The World Bank (2008a) in its paper for the G-8 lists dollar depreciation among the “underlying structural factors contributing to rising food grain prices”. As noted, Mitchell (2008) estimated that dollar devaluation increased the food price index 20% from January 2002-June 2008. It is doubtful if any one seller acting alone could raise prices to compensate for the dollar fall, though dominant suppliers in an industry could, e.g. Saudi Arabia in the case of petroleum. But several sellers acting together or otherwise in a position to control supplies could. This could well be the case of commodities like petroleum where major sellers are organized in the OPEC cartel. It could also be relevant for the cereals sector: after all, there are few major net exporters and many importers. Several countries (see list in World Bank, 2008a, Annex 6) have imposed restrictions or outright bans on exports while at the same time some they are striking, often undisclosed, government-to-government deals with importing countries42. It is difficult to imagine that the dollar exchange rate would not be a major argument in the determination of prices in these deals.
47) The other channel through which the dollar depreciation may affect prices upwards is that it reduces prices of dollar denominated commodities in terms of other currencies. This will tend to stimulate demand and raise dollar prices. It also enhances the competitiveness of U.S. exportables, including of maize, wheat and soybeans – commodities in which the U.S. is the major, or a major, supplier to world markets. Given the “price-setter” role of the US markets and commodity exchanges in these commodities, it is reasonable to expect that the depreciation of the US currency can have this additional effect on world prices.
48) What is the empirical evidence? Fig. 13 plots the movements of the price indices of cereals (current $) and the nominal $/Euro exchange rate as well as the cereals stocks situation (as % of world consumption) for the period 1980-2007 (including for the grains index the April 2008 monthly peak and the most recent data of November 2008 and corresponding exchange rates). It is seen that an inverse relationship (dollar rising – grain prices falling and vice versa) has been present throughout the period, with the exception the years 1985-1990 when grain prices and the dollar exchange rate moved in unison rather than in opposite directions. These were years of drastic changes in the cereals demand-supply balance as measured by changes in stocks (% of consumption) and even more drastic changes in the dollar exchange rate. 1984-86 were years of high cereals production (+ 10.9% in 1984) and stock accumulation, to an unprecedented 36% of world consumption by 1986. There followed two years of production shortfalls (1987-88) and falling stocks. In parallel, abrupt policy changes (the September 1985 Plaza Accord43) led to a precipitous depreciation of the dollar which fell by 50 percent against both the yen
40 Data from International Grains Council http://www.igc.org.uk/en/grainsupdate/igcfreight.aspx (accessed 23 June 2008) 41 See, for example, “Commodities, a bit tarnished”, Economist 19 March 2008; also Becker (op.cit.) 42 “Nations enter secretive deals on grain supply”, Financial Times, 11-04-08 43 When the U.S.A, Japan, Germany, France and the U.K. agreed to cooperate more closely to encourage further orderly appreciation of the main non-dollar currencies against the dollar.

27
and the D-mark from March 1985 to December 1987. It appears that these “anomalous” developments dominated the “normal” pattern of the inverse relationship between the dollar rate and grain prices.
49) Is there any formal empirical analysis supporting, or otherwise, the above discussed relationship between the dollar rate and grain prices? The IMF (2008a, Box 1.4), has examined how movements in commodity prices may be related to those of the dollar exchange rate as well as to other variables (world industrial production, the Federal funds [dollar interest] rate, and the market balance of the commodity – I presume some notion of stocks). They conclude that the dollar exchange rate movements have a significant impact on the prices of most commodities, particularly those of petroleum and metals, but are not an important determinant of the price of cereals. They suggest that this latter finding reflects the nature of cereals (perishable to some extent, renewable) which, in contrast to commodities like petroleum, gold and metals, are less suitable for use as “store of value”, an important consideration in times of exchange rate fluctuations and lax monetary policies. Note, however, the contrast with the World Bank report for the G-8 meeting which highlights the role of dollar depreciation in the food price surges (see above).
Fig. 13 Indices of Grain Prices and the $/Euro Xrate (1990=100) and World Cereal Stocks % of Consumption
50
75
100
125
150
175
200
225
250
275
300
1980
1981
1982
1983
1984
1985
1986
1987
1988
1989
1990
1991
1992
1993
1994
1995
1996
1997
1998
1999
2000
2001
2002
2003
2004
2005
2006
2007
Apr-0
8
Nov
-08
199
0=
100
0
5
10
15
20
25
30
35
40
45
50
Sto
ck
s%
Co
ns
um
pti
on
Grains Nominal Price Index $/Euro Exch.Rate Index-Nominal Stocks% of Cons. -right scale
Sources: Grain Price Index (nominal), World Bank, Commodity Price Data ; Exch.rates USDA(http://www.ers.usda.gov/Data/ExchangeRates/) 6Dec08;
Stocks/Consumption: USDA PSD 150708
50) The IMF explanation seems less than satisfactory: the exchange rate impacts the price of petroleum, which in turn affects the price of cereals by raising production costs and, in the current round of events, by stimulating demand for biofuels. Is it, therefore, reasonable to say that the exchange rate is not an important determinant of the price of cereals? I think not. Having said that, however, we must also note that the order of causation is not always univocal from dollar rate to commodity prices, but it can also be the other way round in a kind of vicious cycle.
28
51) Resort to commodities as “store of value” and investment portfolio diversification in times of low interest rates and financial turbulence like the one the world is going through currently, is a common theme in the literature on commodity prices, e.g. Frankel (2006, 2008). The IMF (2008a: 47) also emphasizes this issue. This issue is becoming increasingly contentious as politicians look for culprits to blame for the rising prices, precisely the speculators. Economists are not so certain. As the neo-Nobel laureate Paul Krugman points out, speculation can raise the futures prices but it will raise the spot prices only if it leads to hoarding and rising stocks44. However, cereals stocks have been falling, not rising. He concludes: “I just don’t see how a low-interest-rate or bubble story works here”. He argues along similar lines concerning the influence of speculators on the formation of the petroleum price45. Other influential commentators offer similar positions46.
52) Is this a sufficient conclusion absolving, as it were, lax monetary policy in the U.S. and investor operations from responsibility for the current price surges? There are two aspects to this issue:
a) This first is whether the interest rate affects spot prices by means other than via futures prices. Interest rate differentials among currencies affect the exchange rate. The tumble of the dollar in spring 2008 followed the significant reduction of the nominal U.S. interest rates which widened such differentials. Ergo, if the interest rates affect the exchange rate and the latter in turn affects commodity prices, we have a mechanism linking interest rates and spot commodity prices.
b) The second is that futures prices can affect the propensity to hoard, hence also spot prices, even though such hoarding may not appear as increase in stocks. For example, if future prices are higher than spot ones by a margin exceeding the interest rate cum storage/insurance costs (the cost of carry, in jargon), holders of stocks could sell for future delivery and hold on to them in the meantime. That such hoarding may not appear as increase in stocks is secondary. The key variable is really not whether stocks are rising or falling but whether they are higher or lower than what they would be in the absence of spot-future price differentials. In the same vein, futures can affect spot prices via the opportunity they offer farmers to sell forward next season’s crop and therefore influence the decision how much to plant now for delivery next season. In turn, enhanced knowledge about expected future production can influence the propensity to hoard and hence today’s spot prices. We had an example in the June 2008 rise in the price of maize following this summer’s floods in the U.S. Midwest. The knowledge that next year’s crop might be lower than previously anticipated sent spot prices higher right away. In the case of petroleum, speculative hoarding need not manifest itself
44 “Commodities and speculation: metallic (and other) evidence”, http://krugman.blogs.nytimes.com/ 20-04-08. See also his “Running out of Planet to Exploit”, New York Times, 21-04-08. 45 Krugman, Paul, “the Oil Non-bubble”, New York Times, 12 May 2008. He develops the argument in short theoretical paper “Speculation and Signatures” (http://www.princeton.edu/~pkrugman/Speculation%20and%20Signatures.pdf ) 46 “The oil price, Recoil”, Economist, May 29th 2008; see also “Written Testimony of Jeffrey Harris, Chief Economist, before the Committee on Energy and Natural Resources, United States Senate, April 3, 2008, http://www.cftc.gov/ (the
CFTC has the mandate to regulate commodity futures and option markets in the United States); and Neal Wolkoff, “Do not blame oil speculators”, http://www.ft.com/cms/s/0/e3a56ecc-5340-11dd-8dd2-000077b07658.html July 16 2008
29
in the form of stock increases: producers can very well leave it underground if price expectations (formed, inter alia, in the futures markets) indicate that they will gain by extracting it later rather than now. After all, with their foreign exchange reserves at all time highs and dollar interest rates so low (negative in real terms), it would make economic sense for them to do so, particularly if they thought that petroleum prices have yet to peak.
53) In conclusion, one must recognize a role for speculative activity in the formation of spot prices, even though concrete quantification proves elusive. In any case such a role would not be on a par with that of the fundamentals affecting demand and supply and certainly a far cry from the alarming positions often propounded in the press. The World Bank’s (2008a) position on this matter in the G-8 paper is a balanced one: it emphasizes the importance of the fundamentals and policies in the food price rises, while recognizing also a role, albeit a minor one, to speculative activity.
8. Petroleum and Food Prices: Is the Experience of the 1970s Relevant?
54) Will food prices return to more “normal” levels? Most probably in the short term as the impact of weather-induced supply shocks looses steam and other aggravating factors are relaxed, e.g. the export bans. However, for the longer term we must look for changes in the fundamentals that drive the demand-supply balance. We have identified above several factors whose confluence contributed to generate the recent price surges. These include, in the first place, “traditional” disturbances (in the sense that we have seen them before): production shortfalls (and not only those related to weather shocks) in relation to demand leading to reduction of stocks, the price of energy and associated rise in production costs, the dollar exchange rate, and the monetary policy.
55) These are in addition to the standard factors that make for ever rising demand for food, though at declining pace: the growth of population and incomes. The former has been and will continue to be the main driver47. It is for this reason that deceleration in population growth will slow down the growth of food demand, although the absolute quantities involved will continue to be considerable (Fig. 4 – see FAO, 2006 for projected increases of the different commodities). Income growth, accompanied by urbanization, in the countries with still low and undiversified food consumption levels, will continue to play a role, but this is a gradual process and may not really generate sudden spurts in global food demand. Except, of course, if many populous countries with such type of food consumption levels and patterns were to experience China-like economic growth rates all at the same time, in which case the resulting spurts in global food demand could conceivably be classified as a “disturbance”, an unlikely event. Were this to happen, however, spurts would be short-lived as per caput consumption grows to levels beyond which the stimulus for further increases looses steam.
56) Some or several of these factors have been present in past experiences with agricultural price surges. Such surges were resolved through a combination of policy responses and spontaneous market adjustments. If these were the only factors at play
47
On the significance of population growth as a driver of food demand, see Alexandratos (1997)
30
currently, we could look forward with some confidence to the prospect that the present price surges would subside over the short to medium term. A combination of immediate food security relief measures and actions to boost production in the immediate short term, as well as provisions to replenish stocks and for investments to raise longer term production potential are called for. These and related responses are well reflected in the declaration of the June 2008 High-Level Conference on World Food Security (FAO, 2008c) and in the Comprehensive Framework for Action produced by the U.N. High-Level Task Force on the Global Food Crisis (United Nations, 2008).
57) We cannot have such confidence this time round: food prices are affected in more drastic and long-lived fashion by novel “nontraditional” factors that may prove to be more than mere disturbances on the path of world agriculture, otherwise destined to expand at ever decelerating rates, short term deviations notwithstanding. These novel factors have to do with the price of energy. Should it keep rising, biofuels may in the end become profitable even without policy support, with a real risk that growing shares of agricultural resources will be diverted to supplying the energy market rather that food. This is the novel dimension of the overall problematique. But why should energy prices not halt their rising trend and indeed reverse it? After all, this has happened before.
58) To see what might be different this time, it is worth comparing the present run-up of prices with that of the seventies. Some elements of the two situations are deceptively similar. Then as now, prices of both food and petroleum rose sharply, while the dollar depreciated 23% from 1970-73 (nominal rate against the Euro – this was the time of the collapse of the Bretton Woods system, ushering in the era of floating exchange rates). Were these happenings organically linked to one another or was their synchronous occurrence a mere coincidence?
59) As concerns cereal prices, the stage for their rise had been set in the preceding years when world stocks had fallen for four years in row, from 24% of consumption in 1968 to 15% in 1972. Then in the 1972/73 crop year there were widespread crop failures in major producers48. The collapse of Peru’s anchoveta fisheries (supplying fishmeal for the livestock sector) at the same time added to the problem. The rise in food prices would have occurred even without any help from the petroleum shock. Grain prices skyrocketed from 1972-74 (see Fig. 1). These were precisely the years of the first petroleum shock followed shortly by the second one in 1979. Robust global economic growth was then, as has been in the current run-up, a key factor behind the petroleum price rises. In the 1970s, the conflict in the Middle East and the OPEC actions reinforced the effects (Radetzki, 2006). Petroleum prices rose twenty-fold in nominal terms from 1972-1980, eight-fold in real terms. Real petroleum prices peaked in 1980, declined slowly up to 1985 and then precipitated and remained low up to the end of the 1990s (Fig. 1). In contrast, real cereal prices had returned to their 1972 level by 1977. There followed a decade of falling real prices and then near constancy up to the beginning of the current run-up, apart from short lived spikes in 1988 and 1996, both related to production shortfalls in the years preceding.
48 Former Soviet Union, India, Turkey, Philippines (all two years in row), Nigeria (three years), Australia, China, North America, Thailand, Ethiopia, Mexico, Brazil, South Africa, Indonesia and Egypt.
31
60) For the issue at hand, i.e. what is the relevance of the experience of the seventies for the current situation, there are two questions we must pose and try to answer:
a) Will food prices revert to their earlier level and perhaps resume their declining trend, as it happened then? The answer is that at that time the link to the petroleum price was not as strong as at present. It was mostly via the effects on production costs, the more general macroeconomic effects and to some extent the boost it gave to food imports of the petroleum exporters (Fig.11). As noted, cereal prices had reverted to their low 1972 level by 1977. They had fallen further by 1985 to 80% of their 1972 level. At that time (1985) real petroleum prices were nearly seven-fold those of 1972. In conclusion, cereal prices followed a “normal” commodity cycle pattern. But petroleum prices did not (OPEC helping), for more than a decade. This is what I call a weak link. In the current situation, the link of cereal prices to those of petroleum can prove to be much stronger, the main reason being biofuels. There is a real prospect that high cereal prices will not dissipate according to the “normal” pattern so long as the price of petroleum remains high and incentives for biofuels remain in place.
b) Which brings us to the second question: what are the prospects that petroleum prices will replicate the experience that followed the petroleum shocks of the seventies? As noted, real petroleum prices collapsed after the mid-eighties and did not recover until the late nineties. There are some significant differences from the situation in the seventies that suggest that this time things may play out differently. In the first place, the scope for the petroleum industry to respond to high prices by increasing supplies was much greater then than at present (the long period of low prices that followed the petroleum shocks reflected, inter alia, the existence of plentiful spare capacity in the petroleum industry which had been exhausted by the late nineties); and, secondly, there was significant slowdown in the growth of demand, the result of both recession and energy efficiency gains in the main consuming areas, the High-Income countries. In the period of high petroleum prices (1975-85) their GDP growth rate was nearly halved (from that of the preceding 10 years), the growth rate of total energy consumption fell drastically and that of petroleum consumption turned negative (Fig. 14). These developments were a key factor in bringing about the long period of easier conditions in petroleum markets in the following decade and a half. In the process, and in tandem with the rise in prominence of several emerging economies, the dominant position of the high income countries in world energy and petroleum consumption was eroded. They now account for much smaller shares in world totals of all three variables: GDP (Fig. 12), total energy and petroleum consumption (Fig. 14). The Low and Middle Income countries now account for much larger shares than in the seventies and exert a growing influence on world economic growth and the demand for energy. Therefore, the course of petroleum prices now depends less than in the previous cycle on the response of the High-Income countries and more on that of the Low and Middle Income ones.
61) What has been the response of the Low and Middle Income countries to the current run-up of petroleum prices? Far from slowing down, their growth rates of all three variables (GDP, energy, petroleum) were higher in 1999-2006 than in the period of low
32
petroleum prices 1986-98. In the end, the pattern of changes in world petroleum consumption in the wake of the price rises of the 1970s (when it declined 0.25% p.a. during 1975-85) is not being repeated in the current run-up, at least not over the period to 2007: it grew 1.6% p.a. from 1999-2007. In conclusion, the emergence of several Low and Middle Income countries as major players in the world economic and energy scenes seems to have imparted a degree of resilience to the world economy vis-à-vis rising petroleum prices. The current economic slowdown in the High-Income countries exerts now a smaller depressing effect than in the past on that of the global economy and energy markets. The October 2008 IMF World Economic Outlook projects significant slowdown of GDP growth of the advanced economies from 2.6% in 2007 to 1.5% in 2008 and 0.5% in 2009. Slowdown is also projected for the emerging and developing economies, but their growth rates are still fairly high: from 8.0% in 2007 to 6.9% in 2008 and 6.1% in 2009 (IMF, 2008b, Table 1.1). This sounds counterintuitive in an era of advancing globalization and economic integration between different regions of the world. It is perhaps too early to tell if the apparent signs of “decoupling” presage the advent of a durable change in world economic architecture (see discussion in Kohn, 2008). Some think that decoupling is a wish-dream49. This notwithstanding, the issue what happens to the petroleum price if relatively high economic growth of the emerging economies were to continue, although at rates somewhat below those of the recent past, must be addressed if we are to explore in a meaningful way the future of food prices and food security via the biofuels link.
62) As noted, at this stage of development of the emerging countries, high economic growth means industrialization, heavy industry, infrastructure construction, spread of motorization – all energy-intensive sectors contributing to maintaining robust petroleum demand growth in the face of rising international prices. Such growth has also reflected policies of not passing on to the consumers the full extent of energy price rises. The high petroleum prices reached by mid-2008 have the potential of moderating demand growth via the usual channels – economic growth slowdown and consumer response to the rising prices. So far, this seems to be happening only in the OECD area where petroleum demand has started falling and so have petroleum prices. The International Energy Agency, in its latest (December 2008) Oil Market Report, has lowered the forecast of world petroleum demand for 2008 to 85.8 million barrels/day (mbd), a decline of 0.3 mdb from 2007. This compares with an increase of 1.0 mbd in 2007 over 2006. This is the first time world oil consumption is expected to contract in 25 years and the first time the Agency forecasts a decline during the current phase of rising prices. It has been progressively reducing its forecasts for 2008 from 86.9 mbd in July - the time of peak prices – to the 85.8 mbd in December. According to the November 2008 Oil Market
Report all the reduction in 2008 comes from declining demand in the OECD countries (falling 1.35 mbd) while that of the rest of the world would continue growing at a rate that is actually higher than that of 2007 (1.47 mbd in 2008 vs. 1.37 mbd in 2007). This pattern is repeated in the Agency’s forecasts for 2009: OECD -0.8 mbd, non-OECD +1.1 mbd. The Agency’s Medium Term Oil Market Report was forecasting in July demand
49
Wolf, M. “The world wakes from the wish-dream of decoupling”, Financial Times, 22 October 2008.

33
increases of 1.5 mbd each year for 2008-13. In the latest issue the forecast had been reduced to 1 mbd50.
63) The petroleum demand declines in the OECD notwithstanding, the prospect of a repeat of the experience of petroleum price developments in the period after the petroleum shocks of the 70s appears less probable now51. The latest (September 2008) update of the Asian Development Outlook 2008 suggests that the key structural factor driving petroleum prices, sustained demand on the part of developing Asia, will continue to play this role for years to come (Asian Development Bank, 2008: 32-72). It concludes: “the biggest message is that high oil prices are here to stay”.
64) As noted, an additional important factor is that achieving production increases in the petroleum sector is now so much more difficult that it was then, because of smaller exploitable reserves (at any given price), the huge investments needed just to compensate for the steep declines in existing oilfields52 and the growing costs of the investment goods and services used by the exploration and extraction sector. A supply crunch looms in the not-too-distant horizon, according to some (Stevens, 2008; IEA, 2008). The drying up of credit channels and the fall in petroleum prices during the current financial crisis are not making things any easier53.
50 “Oil consumption forecasts slashed”, Financial Times, 6 December 2008 51 On the issue “current vs. seventies” see Paul Krugman “Running Out of Planet to Exploit”, New York Times, 21 April 2008 52 “World will struggle to meet oil demand”, Financial Times, 29 October 2008 53 Petroleum prices fell to about USD 50/barrel (bbl) in November, from a peak of USD 147/bbl in late July. See: “Falling oil poses threat to supplies”, Financial Times, 22 October 2008. This article contains an interesting graph showing what petroleum prices are necessary to support investment that would produce given quantities of petroleum. Thus, a price of about $80/bbl is necessary to have global production of 90 mbd, which is not much above the 2008 global demand of 86.5 mbd.
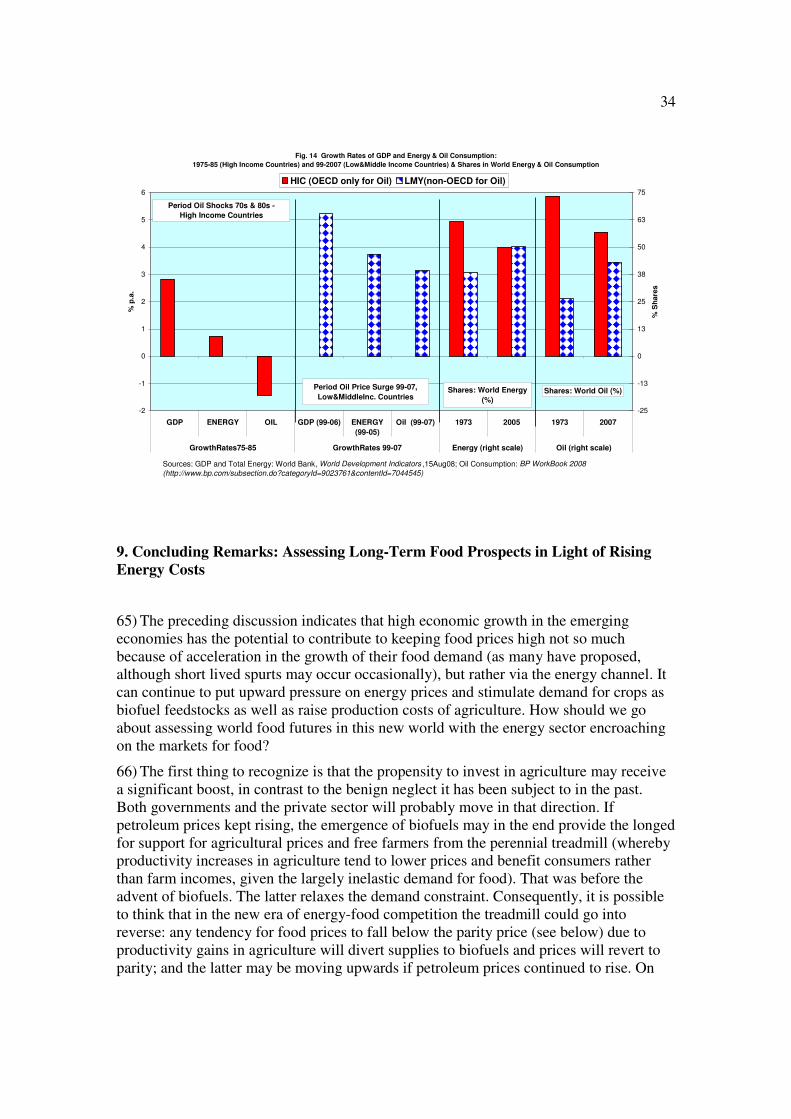
34
Fig. 14 Growth Rates of GDP and Energy & Oil Consumption:
1975-85 (High Income Countries) and 99-2007 (Low&Middle Income Countries) & Shares in World Energy & Oil Consumption
-2
-1
0
1
2
3
4
5
6
GDP ENERGY OIL GDP (99-06) ENERGY
(99-05)
OiI (99-07) 1973 2005 1973 2007
GrowthRates75-85 GrowthRates 99-07 Energy (right scale) Oil (right scale)
% p
.a.
-25
-13
0
13
25
38
50
63
75
% S
hare
s
HIC (OECD only for Oil) LMY(non-OECD for Oil)
Sources: GDP and Total Energy: World Bank, World Development Indicators ,15Aug08; Oil Consumption: BP WorkBook 2008
(http://www.bp.com/subsection.do?categoryId=9023761&contentId=7044545)
Period Oil Shocks 70s & 80s -
High Income Countries
Period Oil Price Surge 99-07,
Low&MiddleInc. CountriesShares: World Energy
(%)Shares: World Oil (%)
9. Concluding Remarks: Assessing Long-Term Food Prospects in Light of Rising
Energy Costs
65) The preceding discussion indicates that high economic growth in the emerging economies has the potential to contribute to keeping food prices high not so much because of acceleration in the growth of their food demand (as many have proposed, although short lived spurts may occur occasionally), but rather via the energy channel. It can continue to put upward pressure on energy prices and stimulate demand for crops as biofuel feedstocks as well as raise production costs of agriculture. How should we go about assessing world food futures in this new world with the energy sector encroaching on the markets for food?
66) The first thing to recognize is that the propensity to invest in agriculture may receive a significant boost, in contrast to the benign neglect it has been subject to in the past. Both governments and the private sector will probably move in that direction. If petroleum prices kept rising, the emergence of biofuels may in the end provide the longed for support for agricultural prices and free farmers from the perennial treadmill (whereby productivity increases in agriculture tend to lower prices and benefit consumers rather than farm incomes, given the largely inelastic demand for food). That was before the advent of biofuels. The latter relaxes the demand constraint. Consequently, it is possible to think that in the new era of energy-food competition the treadmill could go into reverse: any tendency for food prices to fall below the parity price (see below) due to productivity gains in agriculture will divert supplies to biofuels and prices will revert to parity; and the latter may be moving upwards if petroleum prices continued to rise. On

35
the positive side, this can potentially open new horizons of opportunity for countries with ample agricultural resources to achieve improved living standards. We could, therefore, be more sanguine than in the past assessments that the required investments to agriculture will be forthcoming.
67) Which brings us to pose the question if and to what extent efforts and policies to increase production would lead to lower food prices. In principle the answer is yes, almost certainly so if we focus on the short term. However, if the preceding discussion is even approximately correct, the answer concerning the longer-term must be a conditional: “it depends on what happens to the price of energy and to policies for biofuels” and, of course, on the agroecological and technology potential. Naturally the real world situation is more complex: promoting production of which commodities, in which countries, socio-economic contexts and farming systems, and with due account to time lags involved in putting in place the required investments in infrastructures, research, institution building, etc, as well as for agricultural production to respond. All this while the prospect of climate change impacts on agriculture and the wider economy loom large.
68) As often, no firm answers can be provided without undertaking some detailed analysis. But the general principle stands: if energy prices continue to be high and rising and biofuels policies remained as at present and as targeted for the future it is difficult to see how the biofuels industry can be prevented from snapping up supplies if it is profitable for it to do so. If low income food consumers have to compete with those demanding more energy, it is not too difficult to imagine who will lose out. Therefore options must be examined how to minimize such effects. One avenue to explore is the potential for policies that would channel demand for biofuel feedstocks towards types of crops, countries and agroecological environments where they compete the least with food. A straightforward simple case are trade policies that would channel biofuel-generated pressure on land resources to Brazilian sugar cane fields rather than to American maize land or to European cereals/oilseeds land, etc. There is a rich field to explore in any assessment, extending the analysis to other crops, countries and agroecological environments.
69) What do we know about the potential to increase production of individual crops (both traditional food crops as well as novel ones, e.g. jatropha, and eventually plants suitable for second generation biofuels, with particular emphasis on those that minimize competition for land with food crop production potential – Babcock, 2008a) in the different countries and agroecological zones? In the FAO long-term projections (in Alexandratos, 1995, Bruinsma, 2003 and, to a smaller extent in FAO, 2006) we concluded that if demand were to grow as foreseen in the projections (Fig. 4), it would be possible for production to grow pari passu provided supporting policies for investment, agricultural research and technology development were implemented. These were provisional estimates based on land suitability data for the different crops and countries in the FAO/IIASA Global Agroecological Zones (GAEZ) study (Fischer et al, 2001). The estimates are in need of updating and re-evaluation (for problems, see ADAS, 2008), an operation currently under way using a new global soil database and other updated information (e.g. climate, yield potentials of the different crops and varieties, etc) as well as revised procedures for land suitability assessment. On this occasion it should be the objective of any further work to evaluate potentials for increasing production by amounts
36
significantly higher than those required to meet the “normal” demand growth, i.e. that coming from population, income, urbanization and associated changes in diet patterns.
70) The above discussion focused on the importance of energy prices for the future of food prices and food security. We saw that exchange rates and monetary policies also play a role. Does that mean that before we can say anything about the longer-term world food outlook we have to know a lot more about economic growth prospects, particularly of the energy-hungry emerging economies, and about the petroleum sector, things like the “peak oil” debate, OPEC behaviour and related geopolitics and also about future prospects in the financial markets? We cannot really aspire to become experts in these things, but we should endeavour to keep ourselves informed so as to be able to choose judiciously sets of values for these variables that will help us define alternative futures for food and agriculture. The fusion of the energy and food markets dictates that any analysis of food and agriculture futures cannot be concerned any more only with the standard variables affecting the demand-supply fundamentals: population, incomes, urbanization, and agroecological and technology potentials for increasing production. The price of energy must enter the analysis as a trigger in the demand for agricultural products and not merely, as has been the traditional approach, as a factor affecting production costs.
71) If the prospect that energy prices will put a floor to food prices came true, we may come to see the day when biofuels have to be taxed rather than subsidized to protect food security; we may also see multinationals prospecting for land to grow feedstock crops rather than for petroleum; ditto for the prospect that some countries with poor agricultural resources (e.g. many petroleum exporters) may opt for investing in agriculture in better agriculturally endowed countries to secure food supplies. Apparently, this is already happening54. In addition, public resistance to genetically modified crops may weaken as food prices kept being high (Collier, 2008).
72) I conclude by drawing attention to an important caveat in this argumentation. It concerns the proposition that as energy prices remain high and tend to rise further so will those of food because the former stimulate demand for biofuel feedstocks and also because high energy prices raise the agricultural costs: as noted earlier, as food prices rise, so does the cost of producing biofuels (the cost of feedstock crops account for a very high proportion of total production costs). This introduces a degree of uncertainly as to the future role of biofuels in propping up demand for crops. There are already signs that high crop prices squeeze profit margins and create overcapacity in the biodiesel industry in Europe. Naturally, it all depends on future prices of energy. For any given petroleum price, biofuel production ceases to be profitable if prices of feedstock crops exceed certain levels. There is a useful notion of a breakeven relationship between the price of petroleum and that of the biofuel feedstock crops, or “parity price”, for biofuels to be profitable (Schmidhuber, 2006). The problem is, of course, that the parity price rises along with the price of petroleum. Quantifying the relationship would help us have clearer ideas about how food prices may change when the petroleum price rises or falls.
54 “UN warns of food ‘neo-colonialism’ ”, Financial Times, 19 August 2008; “S Koreans to lease farmland in
Madagascar”, Financial Times, 19 November 2008.

37
73) There have been some attempts at quantification for the U.S. ethanol and maize markets (Tyner and Taheripour, 2008; FAPRI–MU, 2008; Babcock, 2008b). As expected, the findings show that (a) maize prices are positively correlated with the petroleum price (via the ethanol link), though the estimated numerical relationships between the two prices vary among the three studies due to scope, data used, assumptions and methods, and (b) maize prices are higher with than without support policies. Two important dimensions of this issue must be noted: Firstly, when blending mandates are in place, the mandated quantity (10.5 billion gallons of ethanol in 2009 in the U.S., rising to 12 billion gallons in 2010) will have to be available to the blenders from domestic production and/or imports. According to Babcock (2008b) most of it will be produced in the U.S. and this will put a floor under the price of maize (and of that of other crops). Thus, in the presence of mandates, biofuels will continue to prop-up agricultural prices even when petroleum prices are so low that would not justify their production on purely economic considerations. Secondly, the short-run response of ethanol production to increased petroleum prices (hence its influence on the demand for crops and their prices) is limited by several constraints, e.g. capacity of the ethanol industry and distribution network as well as the size of the market for ethanol-gasoline blends – in turn depending on, inter alia, the rate of expansion of vehicle fleet of the flex-fuel type and/or eventually raising the 10% limit for ethanol content in the blends. The notion of very elastic demand for maize at the breakeven price applies only in the long-run. In the short-run the elasticity could very well be close to zero.
74) So far, attempts to estimate possible impacts of alternative petroleum prices on those of food over the medium term in the context of multi-commodity, multi-country agricultural analyses have been rather timid and focus on exploring impacts of lower rather than higher petroleum prices. For example, a very recent OECD study presents estimates of impacts on food prices in 2013-17 of a return of petroleum prices to the $72/bbl average of 2007. This is some 28% lower than the price assumed for the baseline projection. They estimate that the impact on the prices of the different crops would be to lower them by 6%-12% compared with those of the baseline projection (OECD, 2008:73; all figures refer to the 5-year average 2013-17). The authors say they also estimated (but do not present) the impacts of a $130 oil price.
75) Exploring futures with high energy prices is necessary in any future assessment of long-term food prospects. This is an area in urgent need of fresh research. It is more so if the prospect of a coming petroleum supply crunch in the medium term (see earlier discussion) were to ring truer as global economic growth resumes after the downswing currently under way.
Epilogue
76) As noted, work on this paper commenced in early 2008 when prices of both cereals and petroleum were rising fast. By the time this paper was ready for the press the commodity boom had turned into a bust. Petroleum prices peaked in July 2008 at $133/bbl (monthly average, daily peak was $145 in early July). There followed a period of continuous declines: the monthly average of November had fallen back to the annual average of 2005 ($ 54/bbl). Further falls pushed the price closer to a range $40-$50/bbl by early December.

38
77) Cereals prices also declined from their peaks in spring 2008. However falls were nowhere near those of petroleum: November 2008 prices were still well above those of 2006 for all three main cereals. The causes of price declines are different: for petroleum the dominant driver has been the drastic slowdown in world economic growth and accompanying drop in global demand growth (from 1.3% in 2006 and 1.1% in 2007 to a forecast -0.3% in 2008). A recovery of the dollar exchange rate (+20% against the Euro from late July to late November) also helped. For cereals, the current recession is unlikely to have had a significant impact on prices by reducing global demand, no matter that a number of countries are said to have suffered declines in per capita consumption. On the contrary, the USDA data show demand increases of 1.3% in 2006/07, 2.7% in 2007/08 and (forecast) 3.3% in 2008/09. Rather, the main causes of the cereals price falls have been the good world crop in the 2008/09 year (+5.1% on year ago) and the easing of export bans.
78) Do these developments alter the arguments made in this paper concerning the importance of the energy markets in shaping long-term prospects in food and agriculture? It all depends on how protracted the lull in petroleum prices proves to be. IEA’s most recent analysis has in its reference scenario petroleum prices averaging $100/bbl over the period 2008-15, rising to $120/bbl by 2030. These are real dollars of 2007; in nominal terms 2030 prices may be $200/bbl in 2030 (IEA, 2008:59). These are the prices assumed by the IEA to be needed to encourage sufficient investment in supply to meet projected demand. The latter is projected to resume growing after the termination of the current recession, from the 85.2 mbd in 2007 to 94.4 mbd in 2015 and on to 106.4 mbd in 2030 (IEA, 2008:Table 3.1). Ergo, any assessment of longer-term agricultural prospects cannot ignore the links to the energy sector. In the meantime, and until petroleum prices recover, the biofuels mandates will continue to provide support to agricultural prices, though the impact on prices will be nowhere near that experienced in the past few years.

39
References Abbott, Ph., Hurt, C. and Tyner, W. (2008), What’s Driving Food Prices? Issue Report, Farm Foundation, Oak Brook, IL.
ADAS (2008) Anticipated and Potential Improvements in Land Productivity and
Increased Agricultural Inputs with Intensification, A Study for the Gallagher Biofuels Review, for the Renewable Fuels Agency, Department for Transport, UK (http://www.dft.gov.uk/rfa/reportsandpublications/reviewoftheindirecteffectsofbiofuels/consultancystudies.cfm)
Alexandratos, N., ed. (1995), World Agriculture: Towards 2010, an FAO Study, J. Wiley and Sons, Chichester, UK and FAO, Rome.
Alexandratos, N. (1996), “China's Projected Cereals Deficits in a World Context”, Agricultural Economics, 15:1-16
Alexandratos, N. (1997). “The World Food Outlook: A Review Essay”, Population and
Development Review 23. 4: 877–88
Alexandratos, N. (2005), “Countries with Rapid Population Growth and Resource Constraints: Issues of Food, Agriculture, and Development” Population and
Development Review, June (http://www.fao.org/es/esd/pastgstudies.html)
Asian Development Bank (2008), Asian Development Outlook 2008 Update, Manila
Babcock, B. (2008a), Breaking the Link between Food and Biofuels, Briefing Paper 08-BP 53, Center for Agricultural and Rural Development, Iowa State University
Babcock, B. (2008b), “How Low Will Corn Prices Go?” Iowa Ag. Review, Vol. 14 No. 4
Baffes, J. (2007), Oil Spills on Other Commodities, World Bank, Policy Research Working Paper 4333
Brown, L. (1995), Who Will Feed China? Wake-up Call for a Small Planet, W.W. Norton, New York.
Bruinsma, J., ed. (2003), World Agriculture: Towards 2015/30, an FAO Perspective, London: Earthscan and Rome: FAO (http://www.fao.org/es/esd/gstudies.htm)
Collier, P. (2008) “The Politics of Hunger”, Foreign Affairs, Nov/Dec 2008, Vol. 87, 6
Collins, K. (2008) The Role of Biofuels and Other Factors in Increasing Farm and Food
Prices, A Review of Recent Developments with a Focus on Feed Grain Markets and
Market Prospects, June 19 (http://www.foodbeforefuel.org/files/Role%20of%20Biofuels%206-19-08.pdf)
Coyle, W. (2007) “The Future of Biofuels: A Global Perspective”, USDA, AmberWaves, November
Dastagiri, M. (2004), Demand and Supply Projections for Livestock Products in India, Policy Paper 21, National Centre for Agricultural Economics and Policy Research, New Delhi

40
Du, Xiaodong and D. Hayes (2008), The Impact of Ethanol Production on U.S. and
Regional Gasoline Prices and on the Profitability of the U.S. Oil Refinery Industry, Working Paper 08-WP 467, Center for Agricultural and Rural Development, Iowa State University, Ames, Iowa 50011-1070
European Commission (2007a), The impact of a minimum 10% obligation for biofuel use
in the EU-27 in 2020 on agricultural markets, AGRI G-2/WM D(2007), April 2007).
European Commission (2007b), Prospects for Agricultural Markets and Income in the
European Union, 2007 – 2014, July 2007
Evans, A. (2008), Rising Food Prices, Drivers and Implications for Development, Chatham House Briefing Paper, London, April.
FAO (2004), Critical Review of China’s Cereal Supply and Demand and Implications for
World Markets, Document CCP:GR-RI/04/2, Rome.
FAO (2006), World Agriculture: towards 2030/50 – Interim Report, FAO, Rome (http://www.fao.org/es/esd/gstudies.htm)
FAO (2008a), Assessment of the World Food Security and Nutrition Situation, Document CFS:2008/2, Rome
FAO (2008b), The State of Food and Agriculture 2008, Biofuels: Prospects, Risks and
Opportunities, FAO, Rome
FAO (2008c), Declaration of the High-Level Conference on World Food Security: the
Challenges of Climate Change and Bioenergy (http://www.fao.org/foodclimate/hlc-home/en/ )
FAPRI–MU. (2008), Biofuels Impact of Selected Farm Bill Provisions and Other Biofuel
Policy Options, FAPRI–MU Report #06-08, Food and Agricultural Policy Research Institute (FAPRI) at the University of Missouri–Columbia, Columbia, MO.
Fischer, G., Shah, M., van Velthuizen, H. and F. Nachtergaele (2001), Global
Agroecological Assessment for Agriculture in the 21st Century, IIASA, Laxenburg.
Frankel, J. (2006), The Effect of Monetary Policy on Real Commodity Prices, NBER Working Paper No. 12713, Cambridge, Massachusetts, National Bureau of Economic Research.
Frankel, J. (2008), Monetary Policy and Commodity Prices, http://www.voxeu.org/index.php?q=node/1178
Good, D., and S. Irwin (2008), The New Era of Corn, Soybean, and Wheat Prices, Marketing and Outlook Brief 08-04, Department of Agricultural and Consumer Economics, University of Illinois at Urbana-Champaign, September
IMF (2008a), World Economic Outlook, April 2008
IMF (2008b), World Economic Outlook, October 2008
International Energy Agency – IEA (2008), World Energy Outlook 2008, Paris, OECD/IEA

41
Kohn, D.L. (2008), Global Economic Integration and Decoupling, Speech at the International Research Forum on Monetary Policy, Frankfurt, Germany, June 26, (http://www.federalreserve.gov/newsevents/speech/kohn20080626a.htm)
Ma, Hengyun, Jikun Huang and Scott Rozelle (2004) “Reassessing China's Livestock Statistics: An Analysis of Discrepancies and the Creation of New Data Series”, Economic
Development and Cultural Change, 52, 2: 445-473
Mitchell, D. (2008), A Note on Rising Food Prices, Policy Research Working Paper 4682, World Bank (http://www-
wds.worldbank.org/external/default/WDSContentServer/IW3P/IB/2008/07/28/000020439_200807
28103002/Rendered/PDF/WP4682.pdf)
Naylor, R. and W. Falcon (2008), “Our Daily Bread”, Boston Review, September/October (http://bostonreview.net/BR33.5/naylorfalcon.php)
OECD (2003), Agricultural Outlook, 2003-2008: Highlights, OECD, Paris
OECD (2005), Review of Agricultural Policies in China, Main Report, Document AGR/CA(2005)6, OECD, Paris
OECD (2008), Economic Assessment of Biofuel Support Policies, OECD, Paris
OECD-FAO (2008), Agricultural Outlook, 2008-2017: Highlights, OECD, Paris and FAO, Rome
Rabobank (2008), The Boom Beyond Commodities: A New Era Shaping Food and
Agriculture, 2008 (by B. Sidwell, www.rabobank.com/far )
Radetski, M. (2006), “The Anatomy of Three Commodity Booms” Resources Policy, Vol. 31: 56–64.
Rosegrant, M. (2008), Biofuels and Grain Prices: Impacts and Policy Responses, Testimony for the U.S. Senate Committee on Homeland Security and Governmental Affairs, 7 May 2008, IFPRI, Washington, D.C.
Schmidhuber, J. (2006), Impact of an Increased Biomass Use on Agricultural Markets,
Prices and Food Security: a Longer-Term Perspective, paper for International Symposium of Notre Europe, Paris, 27-29 November, 2006 (http://www.fao.org/es/esd/pastgstudies.html)
Stevens, P. (2008), The Coming Oil Supply Crunch, a Chatham House Report, London.
Trostle, R. (2008), Global Agricultural Supply and Demand: Factors Contributing to the
Recent Increase in Food Commodity Prices, (WRS-0801, May 2008), USDA, Washington, D.C.
Tyner, W. and F. Taheripour (2007), “Renewable Energy Policy Alternatives for the Future”, Amer. J. Agr. Econ., 89 (5).
Tyner, W. and F. Taheripour (2008), Policy Options for Integrated Energy and
Agricultural Markets, Paper Presented at the Transition to a Bio-Economy: Integration of Agricultural and Energy Systems conference on February 12-13, 2008 at the Westin Atlanta Airport planned by the Farm Foundation. http://www.agecon.purdue.edu/papers/
42
United Nations (2008), High-Level Task Force on the Global Food Crisis:
Comprehensive Framework for Action, New York, http://www.un.org/issues/food/taskforce/Documentation/FINAL%20CFA%20July%202008.pdf
USDA (2001), “China’s Grain Policy at a Crossroads”, Agricultural Outlook (September)
USDA (2007), “The Story behind China’s Rising Pork Prices”, Foreign Agriculture Service, August
von Braun, J. (2008), Biofuels, International Food Prices, and the Poor, Testimony to the United States Senate Committee on Energy and Natural Resources, June 12, 2008, IFPRI, Washington, D.C.
World Bank (2007), China Quarterly Update — September 2007
World Bank (2008a), Responding to High Food and Fuel Prices Double Jeopardy, Paper for the G-8 Hokkaido-Toyako Summit, July 2, 2008, Washington, D.C.
World Bank (2008b), Global Economic Prospects 2008, Washington D.C.
World Bank (2008c), Global Development Finance 2008, Washington D.C.