Embed Size (px)
Citation preview

Publication IV
Anssi Smedlund and Emily Choi. 2009. Communication networks in routine andnonroutine tasks. Espoo, Finland: Helsinki University of Technology. 45 pages.Helsinki University of Technology, Laboratory of Work Psychology and Leadership,Working Paper no. 2009/2.
© 2009 by authors
1
COMMUNICATION NETWORKS IN ROUTINE AND NON-ROUTINE
TASKS
ANSSI SMEDLUND1 Helsinki University of Technology
BIT Research Centre P.O. BOX 5500
02015 HUT FINLAND
Tel: +358 40 533 7452 [email protected]
EMILY CHOI UC Berkeley
Haas School of Business 545 Student Services #1900
Berkeley, CA 94704 Tel: (510) 643-1408
Working paper
September 16, 2009
1 Corresponding author
2
Communication Networks in Routine and Non-routine Tasks
ABSTRACT
This paper explores the communication network structures in routine and non-
routine tasks in a professional service firm. It also investigates the relationship
between network centrality and employee performance depending on the degree that
an individual’s formal role is non-routine. The communication structure to
accomplish routine, day-to-day tasks differs significantly from the communication
structure to accomplish non-routine, ambiguous tasks. Employees who are in a non-
routine role benefit from centrality more than employees in a routine role. For
employees in non-routine roles, increased centrality predicts improved measured
performance in innovativeness and productivity, but counter-intuitively decreases
performance measured by demand from clients. The findings suggest that the
central, most productive and innovative employees in a professional service firm do
not necessarily generate the most revenue.
Keywords: networks, work tasks, professional service firm
3
Communication Networks in Routine and Non-routine Tasks
This paper builds on previous social network research that has shown a relationship
between network structure and performance (i.e. Uzzi, 1996; Hansen, 1999;
Sparrowe et al., 2001; Burt, 2004; Cross and Cummings, 2004). By distinguishing
between routine and non-routine tasks of employees, this empirical paper aims to
explore how centrality predicts performance, depending on the employee’s role. We
conducted this research in a professional service firm by using a sociometric survey-
based dataset of task-related communication. We also gathered subjective
performance indicators of the employees of the company.
In a professional service firm, work is highly knowledge intensive, because
knowledge and employee skills are both a resource and an outcome of the work.
This makes day-to-day routine work tasks highly dependent on active
communication among the employees, not to mention work tasks that are aimed to
create totally new ideas. We expect that by exploring the communication network
structure in the professional service firm, and by identifying the best performing
employees embedded in them, it is possible to understand and improve the
management of knowledge-intensive organizations.
The communication network in an organization reveals structures that are
either sparse or dense. Sparse networks are filled with structural holes (Granovetter,
1973), where brokering employees function as gatekeepers of flows of knowledge
(Burt, 1992). Dense networks form closures among the employees (Coleman, 1988),
and every one is embedded in the network with redundant ties (Uzzi, 1996). There
has been a debate about sparse and dense network structures and their effects on
performance (Burt, 1992; Podolny and Baron, 1997; Hansen, 1999; Reagans and
Zuckerman, 2001; Reagans and McEvily, 2003). Densely connected networks limit 3
Communication Networks in Routine and Non-routine Tasks
This paper builds on previous social network research that has shown a relationship
between network structure and performance (i.e. Uzzi, 1996; Hansen, 1999;
Sparrowe et al., 2001; Burt, 2004; Cross and Cummings, 2004). By distinguishing
between routine and non-routine tasks of employees, this empirical paper aims to
explore how centrality predicts performance, depending on the employee’s role. We
conducted this research in a professional service firm by using a sociometric survey-
based dataset of task-related communication. We also gathered subjective
performance indicators of the employees of the company.
In a professional service firm, work is highly knowledge intensive, because
knowledge and employee skills are both a resource and an outcome of the work.
This makes day-to-day routine work tasks highly dependent on active
communication among the employees, not to mention work tasks that are aimed to
create totally new ideas. We expect that by exploring the communication network
structure in the professional service firm, and by identifying the best performing
employees embedded in them, it is possible to understand and improve the
management of knowledge-intensive organizations.
The communication network in an organization reveals structures that are
either sparse or dense. Sparse networks are filled with structural holes (Granovetter,
1973), where brokering employees function as gatekeepers of flows of knowledge
(Burt, 1992). Dense networks form closures among the employees (Coleman, 1988),
and every one is embedded in the network with redundant ties (Uzzi, 1996). There
has been a debate about sparse and dense network structures and their effects on
performance (Burt, 1992; Podolny and Baron, 1997; Hansen, 1999; Reagans and
Zuckerman, 2001; Reagans and McEvily, 2003). Densely connected networks limit
4
the inflow of diverse and fresh insights to the firm (Hansen, 1999; Ahuja, 2000;
Reagans and McEvily, 2003), but make it possible to facilitate the creation of value
with mechanisms of coordination, trust-building, and the production of sanctioning
mechanisms (Coleman, 1988; Coleman, 1990). Sparse structures with a large
number of indirect ties create value for actors by offering control and information
benefits, and allowing the flow of complex and non-redundant information (Burt,
1992; Hansen, 1999; Reagans and Zuckerman, 2001).
Experimental laboratory research conducted in the 1950’s and 1960’s shows
evidence that there is no optimal network structure, but many (Bavelas, 1951; Shaw,
1964). The optimal communication network structure is related to the type of tasks.
For example, sparse and decentralized communication network structures are better
in solving complex tasks, whereas dense and centralized network structures are
suitable for routine-like, simple tasks (ibid.). Centralized networks channel
information to a focal employee. The closer the others are to the focal person, the
faster the problem is solved. When the tasks become more complex, the problems
related to the task become unmanageable for the focal employees and their
immediate contacts to handle. Then the answer to the problem is sought from more
distant sources, which will make the communication network of complex tasks
decentralized.
Although strong evidence has been presented that the relationship between
individual formal role and individual performance is mediated by centrality of the
person in the network (Ahuja, Galletta and Carley, 2003), it seems that previous
social network research has tested the employee’s position in communication
networks without considering that the network structure depends on the type of task.
In this paper, we assume that the nature of the tasks affects the
communication network structure. Routine tasks create a dense and interconnected 4
the inflow of diverse and fresh insights to the firm (Hansen, 1999; Ahuja, 2000;
Reagans and McEvily, 2003), but make it possible to facilitate the creation of value
with mechanisms of coordination, trust-building, and the production of sanctioning
mechanisms (Coleman, 1988; Coleman, 1990). Sparse structures with a large
number of indirect ties create value for actors by offering control and information
benefits, and allowing the flow of complex and non-redundant information (Burt,
1992; Hansen, 1999; Reagans and Zuckerman, 2001).
Experimental laboratory research conducted in the 1950’s and 1960’s shows
evidence that there is no optimal network structure, but many (Bavelas, 1951; Shaw,
1964). The optimal communication network structure is related to the type of tasks.
For example, sparse and decentralized communication network structures are better
in solving complex tasks, whereas dense and centralized network structures are
suitable for routine-like, simple tasks (ibid.). Centralized networks channel
information to a focal employee. The closer the others are to the focal person, the
faster the problem is solved. When the tasks become more complex, the problems
related to the task become unmanageable for the focal employees and their
immediate contacts to handle. Then the answer to the problem is sought from more
distant sources, which will make the communication network of complex tasks
decentralized.
Although strong evidence has been presented that the relationship between
individual formal role and individual performance is mediated by centrality of the
person in the network (Ahuja, Galletta and Carley, 2003), it seems that previous
social network research has tested the employee’s position in communication
networks without considering that the network structure depends on the type of task.
In this paper, we assume that the nature of the tasks affects the
communication network structure. Routine tasks create a dense and interconnected
5
communication network, whereas non-routine tasks result in a sparse and
decentralized structure. An employee’s position in the network yields different
performance results, depending on the network structure. Centrality in general is
important for performance, but depends on the match between the task and the
employee’s formal role. In the analysis, we interacted roles that require non-routine
work with centrality measures in routine and non-routine communication networks
and found different effects.
Next hypotheses for research are presented based on theory. Then in the
methods part, data collection and the variables for OLS regression are described.
The results parts of the paper include the description of the structural characteristics
of the routine and non-routine networks, and the results of the OLS regression
analysis. Finally discussion of the results and limitations as well as future research
directions is provided.
6
Theory
The flows of knowledge have been a popular topic in social network research (i.e.
Hansen, 1999; Reagans and Zuckerman, 2001; Hansen, 2002; Reagans and
McEvily, 2003). Knowledge-related studies have examined mainly how network
structures transfer different types of knowledge (Hansen, Nohria and Tierney, 1999;
Reagans and Zuckerman, 2001). This paper does not distinguish between different
types of knowledge, such as explicit or tacit, but concentrates on the communication
network structures that are related either to routine or non-routine tasks of
employees. Communication relationships are some of the fundamental relationships
between employees besides such relationships as advice, friendship, support and
influence (Ibarra, 1993).
Routine tasks have behavioral and cognitive definitions (Becker, 2005). The
cognitive view of routines is supported by Simon, March, Nelson and Winter
(March, Simon and Guetzkow, 1958 [1993]; Cyert and March, 1963 [1992]; Nelson
and Winter, 1982). In the cognitive view, routines are defined as knowledge that is
embedded in standardized procedures or rules (Nelson and Winter, 1982),
organizational memory, truce in controlling intra-organizational conflicts, or even
normative targets of conduct (Cohendet and Llerena, 2003).
The behavioral approach to routines, considers routines as a behavioral
regularity, a recurrent interaction pattern (Becker, 2005). In this view, routines have
a certain recurring frequency and follow a sequence within a certain amount of time.
Routine work also has a pre-defined outcome. Established routines, in the behavioral
sense, enable better coordination in a company, provide stability to behavior, are
sub-conscious and require limited cognitive resources from the employee (Becker,
2004). Behavioral routines can also be defined as inclinations towards certain type
of behavior, when triggered by an external force (Becker, 2005). 6
Theory
The flows of knowledge have been a popular topic in social network research (i.e.
Hansen, 1999; Reagans and Zuckerman, 2001; Hansen, 2002; Reagans and
McEvily, 2003). Knowledge-related studies have examined mainly how network
structures transfer different types of knowledge (Hansen, Nohria and Tierney, 1999;
Reagans and Zuckerman, 2001). This paper does not distinguish between different
types of knowledge, such as explicit or tacit, but concentrates on the communication
network structures that are related either to routine or non-routine tasks of
employees. Communication relationships are some of the fundamental relationships
between employees besides such relationships as advice, friendship, support and
influence (Ibarra, 1993).
Routine tasks have behavioral and cognitive definitions (Becker, 2005). The
cognitive view of routines is supported by Simon, March, Nelson and Winter
(March, Simon and Guetzkow, 1958 [1993]; Cyert and March, 1963 [1992]; Nelson
and Winter, 1982). In the cognitive view, routines are defined as knowledge that is
embedded in standardized procedures or rules (Nelson and Winter, 1982),
organizational memory, truce in controlling intra-organizational conflicts, or even
normative targets of conduct (Cohendet and Llerena, 2003).
The behavioral approach to routines, considers routines as a behavioral
regularity, a recurrent interaction pattern (Becker, 2005). In this view, routines have
a certain recurring frequency and follow a sequence within a certain amount of time.
Routine work also has a pre-defined outcome. Established routines, in the behavioral
sense, enable better coordination in a company, provide stability to behavior, are
sub-conscious and require limited cognitive resources from the employee (Becker,
2004). Behavioral routines can also be defined as inclinations towards certain type
of behavior, when triggered by an external force (Becker, 2005).
7
Most of the empirical research on routines has been done from the behavioral
perspective, because the cognitive dimension of routines is hard to operationalize
and observe (Lillrank, 2003). The definition of routine work differs from company
to company, but it is still rather easy to define them from the behavioral perspective
by distinguishing them from non-routine tasks. Non-routine tasks involve managing
semi-structured or unstructured problems (Pava, 1983), and are directed to
something where the process is complex and the result of the work is uncertain and
unspecified. Salter and Gann (2003) provide a good analogy. In engineering
consultancy, routine work is to build a strip of freeway as non-routine work is to
build the Millennium Bridge in London.
Based on the previous literature, it can be stated that in routine tasks,
employees are more likely to communicate with those close to them who work in the
same project to get the job done as efficiently as possible, which results in a
cohesive and centralized network structure. In non-routine tasks, solutions for
problems are more likely to be sought from more distant colleagues and contacts
accumulated from earlier projects, which results in a sparse and decentralized
network structure.
Centrality is the most commonly used structural measure in social network
analysis, because the central employees are the ones that are the most connected to
others, and they are most likely to possess large amounts of information, and are
able to influence others more effectively. Central employees affect the whole
structure of the network by their communication with a large number of other
employees (Carley, 1991). According to the basic idea of social capital (eg. Nahapiet
and Ghoshal, 1998), more relationships is always better than less, and the central
employees in networks are more likely to perform better.
8
The communication network structures in routine and non-routine tasks are
fundamentally different from each other. Employees embedded in these networks
have different kinds of benefits from centrality, which affects their performance.
Central employees in routine tasks are likely to act as focal individuals in projects
who manage and integrate the work of others, where as central individuals in non-
routine tasks are likely to act as brokers and hubs of new ideas.
H1a: Centrality in the communication network in non-routine tasks positively affects
performance
H1b: Centrality in the communication network in routine tasks positively affects
performance
In a communication network for routine tasks that involves performing pre-
determined, sequential tasks that require precision, stability and reliability, and
contains a low level of uncertainty, central employees are in a better position to
integrate and organize the work. They are in control of the flow of information with
dyadic ties to a large number of other employees, which improves the solving of
well-defined problems, but if the task presents complex or ambiguous problems,
then the centralized structure impedes solving the problem (cf. Bavelas, 1951; Blau
and Scott, 1962; Shaw, 1964; Scott, 2003).
In the communication network for non-routine tasks, central employees are
in an advantageous position compared to their less central colleagues (cf. Burt,
1992). Non-routine tasks involve high uncertainty and are ambiguous and
unspecified by nature. When employees in the organization seek out possible ideas
and clues to solve their non-routine tasks, they reach out to more distant sources of
information, which results in a sparse and decentralized communication network 8
The communication network structures in routine and non-routine tasks are
fundamentally different from each other. Employees embedded in these networks
have different kinds of benefits from centrality, which affects their performance.
Central employees in routine tasks are likely to act as focal individuals in projects
who manage and integrate the work of others, where as central individuals in non-
routine tasks are likely to act as brokers and hubs of new ideas.
H1a: Centrality in the communication network in non-routine tasks positively affects
performance
H1b: Centrality in the communication network in routine tasks positively affects
performance
In a communication network for routine tasks that involves performing pre-
determined, sequential tasks that require precision, stability and reliability, and
contains a low level of uncertainty, central employees are in a better position to
integrate and organize the work. They are in control of the flow of information with
dyadic ties to a large number of other employees, which improves the solving of
well-defined problems, but if the task presents complex or ambiguous problems,
then the centralized structure impedes solving the problem (cf. Bavelas, 1951; Blau
and Scott, 1962; Shaw, 1964; Scott, 2003).
In the communication network for non-routine tasks, central employees are
in an advantageous position compared to their less central colleagues (cf. Burt,
1992). Non-routine tasks involve high uncertainty and are ambiguous and
unspecified by nature. When employees in the organization seek out possible ideas
and clues to solve their non-routine tasks, they reach out to more distant sources of
information, which results in a sparse and decentralized communication network
9
structure. Central employees in this communication network are the ones that have
an abundance of different kinds of information and have better access to new ideas
and new developments compared to their less central colleagues. Therefore, the
central employees in the communication network for non-routine tasks are brokers
and gatekeepers of new ideas, which will result in improved performance in their
work (cf. Hansen, 1999; Burt, 2004).
Individual work roles also explain the employee performance in the
organization (Ahuja, Galletta and Carley, 2003). In this paper, the role
characteristics are divided into routine and non-routine tasks, and the employee roles
in the case company tend to be either routine or non-routine. In an established
professional service firm, employees with routine roles engage mainly in work in
well-specified consulting projects by utilizing their own competence, company
procedures and databanks, and their experiences from earlier similar projects. The
employees in non-routine roles are likely to orchestrate the work of others, manage
many projects simultaneously, sell new consulting projects to clients, and develop
and redefine firm-internal processes and service offerings. Therefore, the employees
in non-routine roles are involved in solving more ambiguous problems compared to
the employees in routine roles. The employees in non-routine roles are more likely
to benefit from a central network position in a non-routine network, but less likely to
benefit from centrality in routine tasks.
H2: Centrality in the non-routine communication network increases the
performance of employees with non-routine roles more than the centrality in the
routine communication network increases the performance of employees with
routine roles.
10
Methods
The research was conducted among the employees of an architects’ office in
Northern Europe. Architecture is highly knowledge-intensive work, but the
competencies and processes in architecture are well established and standardized.
According to the CEO of the company, the basic work of architects in routine roles
in the business has remained quite unchanging for the past 20 years, despite of the
IT process innovations along the way, which have increased the overall productivity
of the design work.
The routine work of an architect in the company concerns drawings of
buildings, parts of buildings or public spaces and constructions for the clients. The
work requires a Master’s degree in architecture and application of certain IT-tools,
processes and conventions in the field. The work is project-based, which means that
the work in the organization is managed in projects, and that the employees keep a
close track of their working hours per project. Billable design projects for the client
are separated from other types of projects. In 2007, the average percentage of
billable client work for the architects was 73%, and around one half of the architects
billed over 80% of their total working hours from the clients. In addition to billable
client work, the employees in the company participate, depending on their formal
role, in internal development projects, marketing projects and more innovative
building development projects, which require sharing and developing new ideas.
The network data was gathered in 2006 and the performance data one year
after that. The purpose of the network questionnaire was to find out the routine and
non-routine communication network structures among the employees. The network
survey questionnaire was detailed in terms of direction and frequency of
communication relationships, and took around 30-45 minutes for the respondents to
answer. A total of 84 out of the 93 employees answered the survey, but 5 of them 10
Methods
The research was conducted among the employees of an architects’ office in
Northern Europe. Architecture is highly knowledge-intensive work, but the
competencies and processes in architecture are well established and standardized.
According to the CEO of the company, the basic work of architects in routine roles
in the business has remained quite unchanging for the past 20 years, despite of the
IT process innovations along the way, which have increased the overall productivity
of the design work.
The routine work of an architect in the company concerns drawings of
buildings, parts of buildings or public spaces and constructions for the clients. The
work requires a Master’s degree in architecture and application of certain IT-tools,
processes and conventions in the field. The work is project-based, which means that
the work in the organization is managed in projects, and that the employees keep a
close track of their working hours per project. Billable design projects for the client
are separated from other types of projects. In 2007, the average percentage of
billable client work for the architects was 73%, and around one half of the architects
billed over 80% of their total working hours from the clients. In addition to billable
client work, the employees in the company participate, depending on their formal
role, in internal development projects, marketing projects and more innovative
building development projects, which require sharing and developing new ideas.
The network data was gathered in 2006 and the performance data one year
after that. The purpose of the network questionnaire was to find out the routine and
non-routine communication network structures among the employees. The network
survey questionnaire was detailed in terms of direction and frequency of
communication relationships, and took around 30-45 minutes for the respondents to
answer. A total of 84 out of the 93 employees answered the survey, but 5 of them
11
left the non-routine question unanswered. Between 2006 and 2007 the company was
growing aggressively because of the construction boom in its market, and 26 new
professional architects were hired during this period. After the survey and before the
end of 2007, 10 architects had left the company.
There were five formal roles of employees in the company. The majority of
the employees held a professional role (N=39), and their tasks were to concentrate
on actual architecture project work, managed by project managers (N=20) and senior
project managers (N=9). The top managers (N=6) were the original founders and
owners of the company, while the middle managers (N=7) were responsible for
managing certain types of design projects (ie. retail, sport arenas, interior etc.). The
middle managers together with the top management formed the management team of
the company, where the strategic focus areas and organizational development issues
were discussed. In addition, there were also employers in administrative roles
(N=11), whose tasks were to provide accounting, payroll, IT support and front desk
services in the company.
In this paper, the employees working in professional roles (N=39) were
considered to perform routine-type work, and the employees in all manager roles
(N=33) to perform non-routine work. In the testing of the hypotheses, we indicate
non-routine roles with a dummy variable, 1 indicating non-routine and 0 otherwise.
Data collection
In the network survey questionnaire, sociocentric and egocentric data gathering
methods were combined. This was done by letting the respondents define their own
networks from a roster of names that included everyone in the organization, before
answering detailed questions about communication in routine and non-routine tasks.
The survey was designed as a free-choice survey with two-way directed questions
(for the methodology, see Wasserman and Faust, 1994). Demographic data, as well 11
left the non-routine question unanswered. Between 2006 and 2007 the company was
growing aggressively because of the construction boom in its market, and 26 new
professional architects were hired during this period. After the survey and before the
end of 2007, 10 architects had left the company.
There were five formal roles of employees in the company. The majority of
the employees held a professional role (N=39), and their tasks were to concentrate
on actual architecture project work, managed by project managers (N=20) and senior
project managers (N=9). The top managers (N=6) were the original founders and
owners of the company, while the middle managers (N=7) were responsible for
managing certain types of design projects (ie. retail, sport arenas, interior etc.). The
middle managers together with the top management formed the management team of
the company, where the strategic focus areas and organizational development issues
were discussed. In addition, there were also employers in administrative roles
(N=11), whose tasks were to provide accounting, payroll, IT support and front desk
services in the company.
In this paper, the employees working in professional roles (N=39) were
considered to perform routine-type work, and the employees in all manager roles
(N=33) to perform non-routine work. In the testing of the hypotheses, we indicate
non-routine roles with a dummy variable, 1 indicating non-routine and 0 otherwise.
Data collection
In the network survey questionnaire, sociocentric and egocentric data gathering
methods were combined. This was done by letting the respondents define their own
networks from a roster of names that included everyone in the organization, before
answering detailed questions about communication in routine and non-routine tasks.
The survey was designed as a free-choice survey with two-way directed questions
(for the methodology, see Wasserman and Faust, 1994). Demographic data, as well
12
as the timesheets of the respondents and non-respondents were acquired from the
personnel records of the company.
Behavioral definitions of routines and non-routines were used, and to
highlight the differences in these tasks, exact wordings of the survey questions were
reviewed and modified several times by the authors and their colleagues before
putting the survey online. Brief phone discussions with a highly tenured professional
made sure that the questions would be understood correctly by the respondents.
According to the open feedback gathered at the end of the questionnaire, the
wordings of the questionnaire were generally well understood among the
respondents.
Examples of routine tasks in the questionnaire included tasks that are
delivered to the client, are well specified in advance, recurring, and belong to the
respondent’s line of expertise. The non-routine tasks were defined through
communication of ideas: the respondents were asked to name those who they go to
and those who come to them in “light bulb moments” at work. In the non-routine
task questions, there were no examples of certain types of non-routine tasks because
of their ambiguous nature.
In the questionnaire it was highlighted that the answers included every means
of communication (face-to-face, phone, email etc.), and that all the answers of the
respondents were subjective estimates of the actual communication. The frequency
scale in communication was set to options of 4) daily, 3) weekly, 2) once per month,
1) less than once per month, or 0=not at all.
One year after the network survey, the same web-based survey instrument
was used to measure the employee status in the organization in innovativeness. In
this fixed-choice one-way questionnaire (Wasserman and Faust, 1994) the
respondent was not given a roster of names of others working in the company, but 12
as the timesheets of the respondents and non-respondents were acquired from the
personnel records of the company.
Behavioral definitions of routines and non-routines were used, and to
highlight the differences in these tasks, exact wordings of the survey questions were
reviewed and modified several times by the authors and their colleagues before
putting the survey online. Brief phone discussions with a highly tenured professional
made sure that the questions would be understood correctly by the respondents.
According to the open feedback gathered at the end of the questionnaire, the
wordings of the questionnaire were generally well understood among the
respondents.
Examples of routine tasks in the questionnaire included tasks that are
delivered to the client, are well specified in advance, recurring, and belong to the
respondent’s line of expertise. The non-routine tasks were defined through
communication of ideas: the respondents were asked to name those who they go to
and those who come to them in “light bulb moments” at work. In the non-routine
task questions, there were no examples of certain types of non-routine tasks because
of their ambiguous nature.
In the questionnaire it was highlighted that the answers included every means
of communication (face-to-face, phone, email etc.), and that all the answers of the
respondents were subjective estimates of the actual communication. The frequency
scale in communication was set to options of 4) daily, 3) weekly, 2) once per month,
1) less than once per month, or 0=not at all.
One year after the network survey, the same web-based survey instrument
was used to measure the employee status in the organization in innovativeness. In
this fixed-choice one-way questionnaire (Wasserman and Faust, 1994) the
respondent was not given a roster of names of others working in the company, but
13
the respondent was asked to name five others in their organization in terms of 1)
promoting new ideas and 2) being as a source of new ideas. Outlines of the network
questionnaire and the innovativeness colleague ratings are presented in the
Appendix.
Dependent variables
We measured three types of performance. The first was the number of billable hours
from the client. These were the working hours that the employees mark down in
their timesheets and that are later billed from the client based on the terms of the
project agreement. The second measure was project productivity, which we
constructed from the timesheets. It was the count of billable client projects divided
by the count of billable hours. These first two measures are considered objective
performance indicators in this paper. The third performance measure was
innovativeness. It is a subjective performance indicator, because it is based on
colleague ratings of promoters and sources of ideas in the organization (Appendix).
We use both objective and subjective performance ratings because they
complement each other, showing two different sides of employee performance in the
organization. Objective performance ratings show the direct and concrete benefits of
networking to the employees’ performance. They are not widely used in network
research, because in companies where the profits flow from the sales of products in
the market, objective performance of the firm cannot be directly drawn from the
performance of the employees. In knowledge-intensive, professional service-type
work, objective performance ratings can be used (cf. Huselid, 1995; Huselid,
Jackson and Schuler, 1997). Huselid et al. (1997) have used net sales per employee
as a measure of productivity in their studies. This indicator applies well in the
situation where the performance of an employee aggregates directly to the
14
performance of the company as a whole, due to the low physical capital
intensiveness of the business.
The dependent variable of employee count of billable hours used in this
study is similar to the indicator of Huselid et al. (1997). According to the interviews
with the company’s top management, billable hours are generally considered as a
good indicator of performance in the company’s market, since the profit of the firms
in the business depend on the ratio of billable hours to overall hours, and the
companies in the field grow by hiring new employees. Also, different companies in
the market are compared to each other according to their gross profit margins.
During the data gathering the architects’ office was overbooked with projects
and every professional in the company had as much project work in their hands as
they could or wanted to work on. This is shown in the timesheets by the number of
overall hours worked during 2007 – out of the 83 employees who had worked in
every month of the year, 66 had a number of total working hours greater than the
national average. The hourly billing rate was regulated by the labor unions, and
sometimes the best performing, high prestige, tenured designers marked down more
billable hours than they actually spent working in the client project.
The subjective performance ratings capture the instrumental and social
benefits of networking, and are most often used in network research. The subjective
performance ratings are usually based on superior ratings and opinions of colleagues
(eg. Sparrowe, Liden, Wayne and Kraimer, 2001; Cross and Cummings, 2004).
The architects’ office does not have any formal subjective performance
measurement practices, such as 360 degree evaluations. This is because the market
environment where the company functions is not highly competitive, there is a good
supply of highly educated architects available in the job market, and the architectural
design work is regulated by labor unions and employee unions who negotiate the 14
performance of the company as a whole, due to the low physical capital
intensiveness of the business.
The dependent variable of employee count of billable hours used in this
study is similar to the indicator of Huselid et al. (1997). According to the interviews
with the company’s top management, billable hours are generally considered as a
good indicator of performance in the company’s market, since the profit of the firms
in the business depend on the ratio of billable hours to overall hours, and the
companies in the field grow by hiring new employees. Also, different companies in
the market are compared to each other according to their gross profit margins.
During the data gathering the architects’ office was overbooked with projects
and every professional in the company had as much project work in their hands as
they could or wanted to work on. This is shown in the timesheets by the number of
overall hours worked during 2007 – out of the 83 employees who had worked in
every month of the year, 66 had a number of total working hours greater than the
national average. The hourly billing rate was regulated by the labor unions, and
sometimes the best performing, high prestige, tenured designers marked down more
billable hours than they actually spent working in the client project.
The subjective performance ratings capture the instrumental and social
benefits of networking, and are most often used in network research. The subjective
performance ratings are usually based on superior ratings and opinions of colleagues
(eg. Sparrowe, Liden, Wayne and Kraimer, 2001; Cross and Cummings, 2004).
The architects’ office does not have any formal subjective performance
measurement practices, such as 360 degree evaluations. This is because the market
environment where the company functions is not highly competitive, there is a good
supply of highly educated architects available in the job market, and the architectural
design work is regulated by labor unions and employee unions who negotiate the
15
salaries in the field. Also the turnover of employees is generally low, the average
tenure in the company in 2006 being 6.5 years. 17 employees had worked in the
company for more than 10 years.
The questionnaire used as the basis of a subjective innovativeness
performance measure in this paper mapped the most influential employees who were
both sources and promoters of ideas. According to theory, one definition of
creativity is the production of ideas, solutions, or products that are both novel and
useful (Feist, 1998). The innovativeness questionnaire was designed to find
employees who are both capable of producing ideas and promoting them in the
organization according to colleagues working in the same office. There were no
significant differences between the scores of idea source and idea promoting in the
organization, and if a person was considered as a source of ideas, he/she was also
considered as a promoter of ideas.
The performance indicators were all constructed from the timesheet and
innovativeness questionnaire data one year after the network survey. From the
timesheets and from the innovativeness questionnaire, complete performance data
was constructed for 49 employees, out of which 20 were working in routine tasks
and 29 were working in non-routine tasks. Performance measures were not
constructed for the employees who had not worked every month during 2007,
employees with an administrative role, and employees with a tenure less than one
year at the time of the survey.
Billable hours and productivity
We constructed the dependent variable of billable hours from the 2007 timesheets by
counting and standardizing everyone’s hours billed from the client.
16
We constructed the dependent variable of productivity by dividing the count
of billable projects with billable hours during 2007. Productivity is the ratio of client
projects to the total billable hours in the year. We took the natural logarithm of
productivity values to adjust for its skew.
Innovativeness
We constructed the innovativeness measure in the innovativeness questionnaire by
adding the scores of how many times an employee was named as a promoter of ideas
and as a source of ideas. We also standardized this value.
Independent variables
Our explanatory variables of interest were two centrality measures; centrality in a
routine and non-routing communication network. Centrality measures the degree to
which an employee was connected to many other employees in the networks. We
calculated Freeman’s closeness centrality measure for this variable (ie. Wasserman
and Faust, 1994). The variable was constructed for each employee in both routine
and non-routine communication networks.
Closeness centrality describes how close an employee is to others in the network (for
formula, see Wasserman and Faust, 1994). A higher value of closeness centrality
means that the employee is in a closure position in a tightly knit communication
network.
We constructed centrality measures from the communication network data
that included all the 93 employees in the office during the 2006 survey. The survey-
based network data forms a directed and valued graph of communication
relationships in routine and non-routine tasks. The Freeman closeness centrality 16
We constructed the dependent variable of productivity by dividing the count
of billable projects with billable hours during 2007. Productivity is the ratio of client
projects to the total billable hours in the year. We took the natural logarithm of
productivity values to adjust for its skew.
Innovativeness
We constructed the innovativeness measure in the innovativeness questionnaire by
adding the scores of how many times an employee was named as a promoter of ideas
and as a source of ideas. We also standardized this value.
Independent variables
Our explanatory variables of interest were two centrality measures; centrality in a
routine and non-routing communication network. Centrality measures the degree to
which an employee was connected to many other employees in the networks. We
calculated Freeman’s closeness centrality measure for this variable (ie. Wasserman
and Faust, 1994). The variable was constructed for each employee in both routine
and non-routine communication networks.
Closeness centrality describes how close an employee is to others in the network (for
formula, see Wasserman and Faust, 1994). A higher value of closeness centrality
means that the employee is in a closure position in a tightly knit communication
network.
We constructed centrality measures from the communication network data
that included all the 93 employees in the office during the 2006 survey. The survey-
based network data forms a directed and valued graph of communication
relationships in routine and non-routine tasks. The Freeman closeness centrality
17
measure can only be constructed from binary network data. Therefore, the network
data was dichotomized to describe the overall communication activity of both
routine and non-routine tasks, to include all means of communication, in every
indicated communication frequency of the questionnaire.
In order to increase the validity of the Freeman closeness centrality measure,
the two-way giving and getting knowledge-responses were combined from the
surveys. The “getting” responses were used to ensure the existence of the
relationship, where as the “giving” responses were used to determine the frequency
of the relationship. This means that the relationship was dropped if the employee
had indicated giving knowledge to somebody but the other person had not indicated
getting knowledge from this employee. Also, if an employee had indicated getting
knowledge from someone, but that someone had not indicated giving knowledge to
this employee, the relationship was dropped. In the case of non-respondents, the
relationship was considered as existing if others indicated giving knowledge to the
non-respondent.
Measure to indicate employee closure positions
Freeman closeness centrality measures for each employee in both networks were
constructed with UCINET VI (Borgatti, Everett and Freeman, 2002). Freeman
closeness centrality emphasizes the distance of an employee to all others in the
network by focusing on the distance from each employee to all others (Hannemann
and Riddle, 2005). The farness of an employee is the sum of all lengths of the
geodesics to every other employee, and the reciprocal farness is the closeness
centrality measure (Borgatti, Everett and Freeman, 2002). All possible frequencies
of communication were included in the network to construct the closeness centrality
18
measure. The closeness centrality was constructed from dichotomized data and
normalized by default.
Control variables
We controlled other variables that may affect employee performance. The control
variables used are tenure, gender, education level, language skills and formal role.
Demographic factors of the employees have been found to influence the
network relationships and performance of the employees in organization. Ahuja et
al. (2003) highlight the effect of the formal role as a mediator between the network
relationships and performance, Reagans and McEvily (2003) show the importance of
education, and Reagans and Zuckerman (2001) argue that organizational tenure is an
important variable. The control variables were obtained from the personnel records
of the company at the end of 2007.
In this study, the formal role of the employees has been identified as the most
important variable affecting how network positions will predict the performance of
employees. The formal role has been controlled in the research setting and in testing
the hypotheses by separating the employees in routine roles (professionals in the
company) from the employees in non-routine roles (managers in the company).
In terms of education level the company was quite homogeneus – most of the
employees held a Master’s degree in architecture. There were, however, a group of
employees with Bachelor level degrees among the professionals, which was taken
into account in the analysis. The education level was controlled by dividing the
employees in four classes based on their degree (1= vocational school, 2) Bachelor
degree, 3) Master’s degree, and 4) PhD).
Language skills may also have an effect on performance, since the company
works in design projects in a market environment where multiple languages are 18
measure. The closeness centrality was constructed from dichotomized data and
normalized by default.
Control variables
We controlled other variables that may affect employee performance. The control
variables used are tenure, gender, education level, language skills and formal role.
Demographic factors of the employees have been found to influence the
network relationships and performance of the employees in organization. Ahuja et
al. (2003) highlight the effect of the formal role as a mediator between the network
relationships and performance, Reagans and McEvily (2003) show the importance of
education, and Reagans and Zuckerman (2001) argue that organizational tenure is an
important variable. The control variables were obtained from the personnel records
of the company at the end of 2007.
In this study, the formal role of the employees has been identified as the most
important variable affecting how network positions will predict the performance of
employees. The formal role has been controlled in the research setting and in testing
the hypotheses by separating the employees in routine roles (professionals in the
company) from the employees in non-routine roles (managers in the company).
In terms of education level the company was quite homogeneus – most of the
employees held a Master’s degree in architecture. There were, however, a group of
employees with Bachelor level degrees among the professionals, which was taken
into account in the analysis. The education level was controlled by dividing the
employees in four classes based on their degree (1= vocational school, 2) Bachelor
degree, 3) Master’s degree, and 4) PhD).
Language skills may also have an effect on performance, since the company
works in design projects in a market environment where multiple languages are

19
spoken. Usually, according to the personnel records, the employees can work in two
languages, but there were a few employees who could work in up to six different
languages. The company executives valued highly the language skills of their
professionals and kept record of the languages available in the company.
20
Network description
Before discussing the results of our analysis, we present descriptions of the network
to support our assumption that the position in a network depends on the network
type. This paper aims to show that the centrality measures are inherently different in
routine and non-routine networks. The networks were compared at various levels of
communication frequency. The counts of relationships, densities, weighted overall
clustering coefficients, and Freeman degree centralization measures were
constructed for each communication frequency separately in routines and non-
routines. The densities were constructed by dividing the number of relations in each
category of communication frequency with the total number of possible
relationships. The Freeman degree centralization as well as the weighted overall
clustering coefficient measures were constructed with UCINET VI (Borgatti, Everett
and Freeman, 2002).
The density, centralization and clustering coefficients show the
connectedness of the communication networks as a whole. Density is the mean
number of ties per actor in the network, and thus it describes the overall level of
interaction among the employees. Centralization shows whether communication is
concentrated in a small number of employees rather than distributed equally, by
showing the variance in the number of network ties. The clustering coefficient
shows the aggregate measure of how well the actor’s connections are connected
back to the actor, thus indicating the overall level of clustering in the network. The
weighted overall graph clustering coefficient was used, because it is the average of
the densities of the neighborhoods of all of the actors weighted with the
neighborhood size, and is thus suitable for comparing networks with different
densities (see Cross and Cummings, 2004; Hannemann and Riddle, 2005).
21
Descriptive statistics of the two networks reveal that the inherent differences
between routine and non-routine networks are relevant. As suggested, the network of
routine tasks shows features of high density and high centralization, whereas the
non-routine network is low in density and low in centralization. Centralization
shows the variance in network ties per actor, and when the variance is low, an actor
does not enjoy substantially more ties than any other actors. The routine network is
dense and highly cohesive, and the cohesion is organized around particular focal
points, whereas the non-routine network is sparse, un-cohesive and decentralized.
Also the weighted overall graph clustering coefficient measures of the networks
show that the routine network has more clustering compared to the non-routine
network.
Generally, communication between employees in non-routine tasks happens
less often than in routine task communication. Metric multidimensional scaling
(MDS) of the routine and non-routine networks show and confirm the observation
made of the clustering coefficients that the non-routine communication is generally
more spread across the organization. In routines, there are more clusters in the
organization compared to non-routines, which means that the employees
communicate in their non-routine tasks with more distant others compared to routine
tasks.
According to the data, not everyone in the organization indicated
communication with everyone else within the last one year prior to the survey. In the
first question of the survey, the respondents were asked to indicate who they had
been communicating with during the past year. There were 5549 links of 8556
possible links (density of 0.648), and the respondents named on average 65 others.
When examining how many times the person was recalled to be communicated with
22
by others (in-degree of the first question), it was noted that the employees with a
shorter than a two-year tenure had an average in-degree of 48.
The average in-degree of the employees tenured between two and ten years,
and also employees with over ten years of tenure were exactly the same, 66 others
indicated communication with them during the past year. This tells roughly that it
takes about two years to work in the company to reach some kind of average,
established level of communication with others in the same office, but after reaching
the certain normal level, the number of others communicated with does not increase
along with time.
Table 1 shows the number of ties in the routine and non-routine networks in
different frequencies of communication. The number of links and the density of the
routine and non-routine networks decrease when the frequency of communication
increases. The non-routine network is substantially less dense compared to the
routine network – there are only 72 daily relations in communication related to non-
routine tasks in the company. Besides the notable difference in density, the
communication network in non-routine tasks is also less centralized and less
clustered compared to the routine tasks, measured with Freeman degree
centralization and weighted overall clustering coefficient (Table 1).
------------------------------------------
Insert Table 1 about here
-------------------------------------------
Figure 1 presents a two-dimensional metric multidimensional (MDS) scaling of the
routine and non-routine networks in the communication frequency of weekly or
more often. MDS presents the similarities and dissimilarities of the relationships of 22
by others (in-degree of the first question), it was noted that the employees with a
shorter than a two-year tenure had an average in-degree of 48.
The average in-degree of the employees tenured between two and ten years,
and also employees with over ten years of tenure were exactly the same, 66 others
indicated communication with them during the past year. This tells roughly that it
takes about two years to work in the company to reach some kind of average,
established level of communication with others in the same office, but after reaching
the certain normal level, the number of others communicated with does not increase
along with time.
Table 1 shows the number of ties in the routine and non-routine networks in
different frequencies of communication. The number of links and the density of the
routine and non-routine networks decrease when the frequency of communication
increases. The non-routine network is substantially less dense compared to the
routine network – there are only 72 daily relations in communication related to non-
routine tasks in the company. Besides the notable difference in density, the
communication network in non-routine tasks is also less centralized and less
clustered compared to the routine tasks, measured with Freeman degree
centralization and weighted overall clustering coefficient (Table 1).
------------------------------------------
Insert Table 1 about here
-------------------------------------------
Figure 1 presents a two-dimensional metric multidimensional (MDS) scaling of the
routine and non-routine networks in the communication frequency of weekly or
more often. MDS presents the similarities and dissimilarities of the relationships of
23
the actors compared to each other. The closer the actors are in the MDS scale, the
more similar structure of ties they have (Scott, 2000). It can be seen in the figure that
the routine network is more equally distributed, which suggests that there is more
closure among the actors. In the non-routine network there are more dissimilarities
on the network ties among the employees, which illustrates that some individuals are
more connected than others.
------------------------------------------
Insert Figure 1 about here
-------------------------------------------
24
Results
We used an ordinary least squares (OLS) regression model to test our hypotheses.
Table 2 presents descriptive statistics and correlations of the variables. Correlations
between dependent and independent variables that are significant are indicated.
Regression results are shown in Table 3. We present three sets of models for the
three performance outcomes. The first model of each of the three sets shows the
effect with the control variables. Models 2 and 3 of each set show the main effects of
centrality in routine and non-routine network types. Finally, Models 4 and 5 show
the interactions with the routine and non-routine roles.
------------------------------------------
Insert Table 2 about here
-------------------------------------------
The models explain notable degrees of variance in the dependent variables (Table 3).
The results indicate that the effect of centrality on performance increases for an
individual in a non-routine role greater than in a routine role.
------------------------------------------
Insert Table 3 about here
-------------------------------------------
Our analysis shows mixed results (Table 3). We found support for Hypotheses 1a
and 1b only for two of the three performance measures. An increase in central
position in non-routine and routine communication networks increases performance
in productivity and innovativeness (p<0.1 in productivity and billable hours and 24
Results
We used an ordinary least squares (OLS) regression model to test our hypotheses.
Table 2 presents descriptive statistics and correlations of the variables. Correlations
between dependent and independent variables that are significant are indicated.
Regression results are shown in Table 3. We present three sets of models for the
three performance outcomes. The first model of each of the three sets shows the
effect with the control variables. Models 2 and 3 of each set show the main effects of
centrality in routine and non-routine network types. Finally, Models 4 and 5 show
the interactions with the routine and non-routine roles.
------------------------------------------
Insert Table 2 about here
-------------------------------------------
The models explain notable degrees of variance in the dependent variables (Table 3).
The results indicate that the effect of centrality on performance increases for an
individual in a non-routine role greater than in a routine role.
------------------------------------------
Insert Table 3 about here
-------------------------------------------
Our analysis shows mixed results (Table 3). We found support for Hypotheses 1a
and 1b only for two of the three performance measures. An increase in central
position in non-routine and routine communication networks increases performance
in productivity and innovativeness (p<0.1 in productivity and billable hours and
25
p<0.05 in innovativeness). There is a non-significant negative effect on the billable
hours performance. We found support for Hypothesis 2 only for productivity and
innovative performance measures. Increased centrality in non-routine tasks increases
the performance of employees in non-routine roles more than centrality in a routine
network. For productivity, the coefficient for non-routine*non-routine role is 0.0641
(p<0.05) and the coefficient for routine*non-routine is 0.0441 and non-significant.
For innovativeness, the coefficient for non-routine*non-routine role is 0.105
(p<0.01), and the coefficient for routine*non-routine is 0.0565, with marginal
significance. We were surprised to find that the interaction of the centrality measures
with the roles was negative. This indicates that centrality in both non-routine and
routine networks and having a non-routine role reduces performance when measured
by billable hours. The results do not support Hypothesis 2. The match between non-
routine centrality and non-routine role decreases performance more than the
mismatch between routine centrality and the non-routine role.
26
Discussion
According to the results of this paper, the routine or non-routine nature of the task
affects the network structure. Furthermore, centrality affects employee performance,
depending on the network context, as well as the employee’s role. The finding is in
line with the existing theory on external contingencies, such as market uncertainties,
authority power, cultural traditions or institutions having an effect on the network
structures (Lincoln, Hanada and McBride, 1986; Podolny, 1994; Podolny and Baron,
1997). Ahuja (2000) concludes that the structural characteristics of networks depend
on the objectives of the network members. The contingency presented in this paper
is in line with previous network research at the employee and organizational level.
The results bring new light to the debate between dense (Coleman, 1988) and
sparse (Burt, 1992) network structures. The debate has been exaggerated in the
network theory, and the task-contingent view shows that they are both right in their
own respect. Burt has repeatedly stated that the employees occupying structural
holes in a highly sparse network perform better in innovative tasks (Burt, 1992;
Burt, 2004). This is contrary to Coleman’s (1988) arguments where reciprocity and
trust are created in dense, centralized networks that are good for solving
unambiguous problems quickly.
It is logical that the employees whose formal role deals with non-routine
tasks, benefit from a central position in a sparse and decentralized non-routine
communication network as an increase in their performance. Furthermore, following
this logic, employees with a routine role should benefit from a central position in
routine tasks networks. In this study, we found support to the first argument –
employees in non-routine role benefit more from centrality in a non-routine network
compared to a routine network. However, we found only partial support to the latter
27
contingency argument. The congruence can be explained as in the following two-by-
two table where “ns” stands for non-significant effect:
------------------------------------------
Insert Table 4 about here
-------------------------------------------
The research result also strengthens the traditional assumptions about the strata of
professional service firms: the manager and professional roles are separated. Those
employees whose role is to perform routine type, billable work to clients under the
leadership of managers, communicate more in routine tasks and less in non-routine
tasks, and do not seem to benefit from the central position in the communication
network. Those employees whose tasks are related to non-routine work
communicate more about non-routine work, and also benefit from the central
position in that network in the form of increased productivity and increased status in
the organization.
Increased centrality in non-routine tasks seems to lower the performance of
those in non-routine roles when measured with billable hours. The increase in
centrality leading towards decline in performance is supported by Krackhadt’s
(1994) research, in which the density of communication relationships was negatively
related to performance after a certain threshold, which suggests that there is a
curvilinear relation between the degree of interaction and performance. In
Krackhardt’s studies excess communication was a result of increased demands of
coordination of work due to problems in the workplace that prevented the actors
from performing their actual tasks.
28
Limitations
The research has some limitations related to the subjectivity of network analysis
research, the problem of endogeneity in the research design and low number of
observations in the OLS regression analysis. Furthermore, the operationalization of
the constructs of routine and non-routine poses a challenge. Despite that
theoretically the difference between the two seem clear, their meaning differs from
company to another. Intuitively, the definition of a routine task means factory work
in the 1920’s, but according to the Nelson and Winter’s (1982) definition, routines
are simply standardized procedures and rules, no matter the industry. Therefore, it
can be argued that even in a highly creative type of work such as architecture, there
are certain routines in the firm that are performed by employees in routine role. In
this study, professionals were defined as performing routine work of the company
because they produced the drawings, the output that the company sold in the market.
The managers were defined as performing non-routine work, since their work
involved managing the projects and the professionals, sales and marketing and
business development.
When relationships are studied on the basis of subjective evaluations of
employees, the structure of the network is likely to vary according to the type of
relationships. It can be presumed that if the network questionnaire were designed to
measure such relationships as advice, friendship or trust, the resulting Freeman
closeness centrality measures used as the independent variable could have been
different.
It can be argued, however, that communication relationships are the most
useful when investigating task-related network structures in an organization. Such
relationships as friendship or advice, important as such, are more related to social,
not task-related ties between employees. It can be expected that task-related 28
Limitations
The research has some limitations related to the subjectivity of network analysis
research, the problem of endogeneity in the research design and low number of
observations in the OLS regression analysis. Furthermore, the operationalization of
the constructs of routine and non-routine poses a challenge. Despite that
theoretically the difference between the two seem clear, their meaning differs from
company to another. Intuitively, the definition of a routine task means factory work
in the 1920’s, but according to the Nelson and Winter’s (1982) definition, routines
are simply standardized procedures and rules, no matter the industry. Therefore, it
can be argued that even in a highly creative type of work such as architecture, there
are certain routines in the firm that are performed by employees in routine role. In
this study, professionals were defined as performing routine work of the company
because they produced the drawings, the output that the company sold in the market.
The managers were defined as performing non-routine work, since their work
involved managing the projects and the professionals, sales and marketing and
business development.
When relationships are studied on the basis of subjective evaluations of
employees, the structure of the network is likely to vary according to the type of
relationships. It can be presumed that if the network questionnaire were designed to
measure such relationships as advice, friendship or trust, the resulting Freeman
closeness centrality measures used as the independent variable could have been
different.
It can be argued, however, that communication relationships are the most
useful when investigating task-related network structures in an organization. Such
relationships as friendship or advice, important as such, are more related to social,
not task-related ties between employees. It can be expected that task-related
29
communication ties reveal underlying social relationships – in expert work,
employees communicate with those they like the most, and choose not to
communicate with some others. Measuring task-related communication is, however,
easier than measuring social relationships, because employees answer a task-related
questionnaire more willingly than questions about their friendship ties. It can be
presumed that especially non-routine task-related communication is more likely to
happen among people who already know each other at a personal level. This would
mean that other types of relationships create possibilities for work-related
communication in the organization - personal relationships create opportunities for
cooperation (cf. Ouchi, 1980; Larson, 1992; Eisenhardt and Schoonhoven, 1996).
The structure of communication relationships reveals the flow of knowledge
in the organization, because communication can be thought to be an opportunity to
share knowledge with other employees. Transfer of knowledge is discretionary, and
it follows the path of least resistance, therefore the more communication ties there
are, the more likely the employees are to share their knowledge (Reagans and
McEvily, 2003).
In the network survey, the respondents were given two months to answer the
network questionnaire. This was considered suitable because the frequency scales in
the survey were designed to map perceived, well established communication
relationships between the employees. The long response time made possible a high
response rate, but due to the broad frequency scale, employees with a low tenure
were not able to provide adequate answers to the survey. The two-way, directed
questionnaire design improved the validity of the survey results (Cross and
Cummings, 2004), because the relationships were counted as relationships only if
both parties indicated the existence of the tie.
30
The testing of the hypotheses included both objective and subjective
performance measures. The subjective performance measures, such as the perceived
innovativeness used in this study, cause a problem of endogeneity in network
research. This is because the employees who are in a network position to control the
flow of information to and from other employees (employees with high centrality)
may be able to use their position to influence the performance evaluations (Brass,
1995). Central employees will also be more visible for others in the organization,
and they will naturally be perceived to have a higher status than less visible
employees. However, communication networks are a social phenomenon, and as the
survey-based network presents subjective evaluations of the frequencies of
communication among employees, also the performance variable can be constructed
similarly. Then, the subjective performance indicator will actually reveal how well
an employee is able to utilize his/her network position to gain a social status in the
organization.
The problem of endogeneity was controlled in this study by constructing the
dependent variables on the basis of data gathered one year after the network survey.
However, as several professionals had left the company between the network survey
and constructing the performance measures, the number of observations remained
fairly low in the testing of the hypotheses (routine role = 20, non-routine role = 29).
In the analysis, the effect of centrality on performance in different roles was tested
with interaction term that allowed the inclusion of full sample of N=49 in the
models.
Implications for practice and future research
Despite of the limitations, this paper advances the network theory and management
of professional service firms. First, this study shows links between the 30
The testing of the hypotheses included both objective and subjective
performance measures. The subjective performance measures, such as the perceived
innovativeness used in this study, cause a problem of endogeneity in network
research. This is because the employees who are in a network position to control the
flow of information to and from other employees (employees with high centrality)
may be able to use their position to influence the performance evaluations (Brass,
1995). Central employees will also be more visible for others in the organization,
and they will naturally be perceived to have a higher status than less visible
employees. However, communication networks are a social phenomenon, and as the
survey-based network presents subjective evaluations of the frequencies of
communication among employees, also the performance variable can be constructed
similarly. Then, the subjective performance indicator will actually reveal how well
an employee is able to utilize his/her network position to gain a social status in the
organization.
The problem of endogeneity was controlled in this study by constructing the
dependent variables on the basis of data gathered one year after the network survey.
However, as several professionals had left the company between the network survey
and constructing the performance measures, the number of observations remained
fairly low in the testing of the hypotheses (routine role = 20, non-routine role = 29).
In the analysis, the effect of centrality on performance in different roles was tested
with interaction term that allowed the inclusion of full sample of N=49 in the
models.
Implications for practice and future research
Despite of the limitations, this paper advances the network theory and management
of professional service firms. First, this study shows links between the
31
characteristics of task-related communication networks and employees’
performance. Communication in non-routine tasks is highly important in the
contemporary knowledge economy, which puts increasing weight on intangible
assets and innovation. Future applications of the research approach introduced in
this paper could include the structures of R&D teams in the early phases of the
innovation processes. According to the network theory, the communication structure
among employees makes a difference, and by influencing the structure with right
leadership, the time to market of new innovations could be improved. It can be
proposed that in different phases of the innovation process, some phases benefit
from dense, interlocked communication networks, while others benefit from sparse
and decentralized network structures. Future research could include longitudinal
observation-based research on teams performing inherently routine or non-routine
types of projects and comparisons of them. This way, it would be possible to
determine the structural characteristics of communication networks that influence
team performance.
Secondly, besides structural characteristics, future research should include
network studies on employee relationships in knowledge intensive organizations. As
stated in this paper based on existing theory, but left unclear in terms of the research
results, highly performing employees are embedded in the network positions of high
clustering and reach. The future research could concentrate on the demographics of
those employees who are both in favorable network positions and also perform well.
What are their personalities and demographics like? How do they perform their
routine and non-routine tasks? This would have an impact on the management of
professional service firms, since the success of those firms relies heavily on
employee competence, expertise and virtuoso talent. A successful professional
32
service firm should aim to identify, encourage and retain highly performing
employees in favorable network positions.
Finally, this research is important for managers in professional service firms
in terms of performance measurement. As shown in the results of the research, the
objective performance measures do not always indicate the managerial performance
in the organization. Excess embeddedness in the communication network may
decrease performance in the billable client work, even if the employees’ productivity
is high and is considered as important in innovativeness. Highly central employees
in the communication network are likely to be the ones who coordinate others’ work
in multiple projects, disseminate knowledge and solve conflicts, which results in
lower client performance. This means that those professional service firms that use
only billable client work as a measure of managerial performance, should be aware
that it may not tell the whole truth about the manager, and consider also other types
of performance measures.
33
References:
Ahuja, G., 2000. Collaboration Networks, Structural Holes, and Innovation: A Longitudinal Study. Administrative Science Quarterly, 45, 425-455.
Ahuja, M., Galletta, D., Carley, K. M., 2003. Individual Centrality and Performance in Virtual R&D Groups: An Empirical Study. Management Science, 49, 1 21-38.
Bavelas, A., 1951. Communication patterns in task-oriented groups. In: D. Lerner and H. D. Lasswell (Eds.), The Policy Sciences. Stanford University Press, Stanford, CA.
Becker, M., 2004. Organizational routines: a review of the literature. Industrial & Corporate Change, 13, 4 643-677.
Becker, M., 2005. A framework for applying organizational routines in empirical research: linking antecedents, characteristics and performance outcomes of recurrent interaction patterns. Industrial & Corporate Change, 14, 5 817-846.
Blau, P. M., Scott, W. R., 1962. Formal Organizations: The Concept. In: J. M. Shafritz and J. S. Ott (Eds.), Classics of Organization Theory. Wadsworth Pub. Co., Belmont, 19: 214.
Borgatti, S. P., Everett, M. G., Freeman, L. C. (2002), Ucinet 6 for Windows: Software for Social Network Analysis, Analytic Technologies, Harvard.
Brass, D. J., 1995. A Social Network Perspective on Human Resources Management. Research in Personnel and Human Resources Management, 13, 1 39-79.
Burt, R. (1992), Structural holes: The social structure of competition., Harvard University Press, Cambridge.
Burt, R., 2004. Structural Holes and Good Ideas. American Journal of Sociology, 110, 2 349-399.
Carley, K. M., 1991. A theory of group stability. American Sociological Review, 56, 331-354.
Cohendet, P., Llerena, P., 2003. Routines and incentives: the role of communities in the firm. Industrial & Corporate Change, 12, 2 271-297.
Coleman, J., 1988. Social Capital in the Creation of Human Capital. The American Journal of Sociology, 94, 1 95-120.
Coleman, J. S. (1990), Foundations of Social Theory, Harvard University Press, Cambridge, MA.

34
Cross, R., Cummings, J. N., 2004. Tie and Network Correlates of Individual Performance in Knowledge-Intensive Work. Academy of Management Journal, 47, 6 928-937.
Cyert, R. M., March, J. G. (1963 [1992]), A Behavioral Theory of the Firm, Blackwell, Malden, MA.
Eisenhardt, K. M., Schoonhoven, C. B., 1996. Resource-Based View of Strategic Alliance Formation: Strategic and Social Effects in Entrepreneurial Firms. Organization Science, 7, 2 136-150.
Feist, G., 1998. A Meta-Analysis of Personality in Scientific and Artistic Creativity. Personality and Social Psychology Review, 2, 4 290-309.
Granovetter, M., 1973. The Strength of Weak Ties. American Journal of Sociology, 78, 6 1360-1380.
Hannemann, R. A., Riddle, M. (2005), Introduction to Social Network Methods, University of California, Riverside, Riverside, CA.
Hansen, M., Nohria, N., Tierney, T., 1999. What's Your Strategy for Managing Knowledge. Harvard Business Review, 77, 2 106-117.
Hansen, M. T., 1999. The Search-Transfer Problem: The Role of Weak Ties in Sharing Knowledge Across Organization Subunits. Administrative Science Quarterly, 44, 1 82-111.
Hansen, M. T., 2002. Knowledge Networks: Explaining Effective Knowledge Sharing in Multiunit Companies. Organization Science, 13, 3 232.
Huselid, M., 1995. The Impact of Human Resource Management Practices on Turnover, Productivity, and Corporate Financial Performance. The Academy of Management Journal, 38, 3 635-672.
Huselid, M., Jackson, S. E., Schuler, R. S., 1997. Technical and Strategic Human Resource Management Effectiveness as Determinants of Firm Performance. The Academy of Management Journal, 40, 1 171-188.
Ibarra, H., 1993. Personal Networks of Women and Minorities in Management: A Conceptual Framework. Academy of Management Review, 18, 1 56-87.
Krackhardt, D., 1994. Constraints on the Interactive Organization as an Ideal Type. In: C. Heckscher and A. Donnellon (Eds.), The Post-Bureaucratic Organization: New Perspectives on Organizational Change. Sage Publications, Thousand Oaks, CA: 211-222.
Larson, A., 1992. Network Dyads in Entrepreneurial Settings: A Study of the Governance of Exchange Relationships. Administrative Science Quarterley, 37, 1 76-104.
Lillrank, P., 2003. The Quality of Standard, Routine and Nonroutine Processes. Organization Studies, 24, 215
35
Lincoln, J. R., Hanada, M., McBride, K., 1986. Organizational Structures in Japanese and U.S. Manufacturing. Administrative Science Quarterly, 31, 3 338-364.
March, J. G., Simon, H. A., Guetzkow, H. S. (1958 [1993]), Organizations, Blackwell, Cambridge, Mass., USA.
Nahapiet, J., Ghoshal, S., 1998. Social Capital, Intellectual Capital, and the Organizational Advantage. Academy of Management Review, 23, 2 242-266.
Nelson, R. R., Winter, S. G. (1982), An Evolutionary Theory of Economic Change, Belknap, Cambridge, MA.
Ouchi, W. G., 1980. Markets, bureaucracies and clans. Administrative Science Quarterly, 23, 293-317.
Pava, C., 1983. Designing managerial and professional work for high performance: A sociotechnical approach. National Productivity Review, 126-135.
Podolny, J. M., 1994. Market uncertainty and the social character of economic exchange. Administrative Science Quarterly, 39, 3 458.
Podolny, J. M., Baron, J. N., 1997. Resources and Relationships: Social Networks and Mobility in the Workplace. American Sociological Review, 62, 5 673-693.
Reagans, R., McEvily, B., 2003. Network Structure and Knowledge Transfer: The Effects of Cohesion and Range. Administrative Science Quarterly, 48, 2 240-267.
Reagans, R., Zuckerman, E. W., 2001. Networks, Diversity, and Productivity: The Social Capital of Corporate R&D Teams. Organization Science, 12, 4 502.
Salter, A., Gann, D., 2003. Sources of Ideas in engineering design. Research Policy, 32, 8 1309-1324.
Scott, J. (2000), Social Network Analysis. A Handbook, Second Edition, SAGE Publications, London.
Scott, W. R. (2003), Organizations: Rational, Natural and Open Systems, Prentice Hall, Upper Saddle River, NJ.
Shaw, M., 1964. Communication networks. In: L. Berkowitz (Eds.), Advances in Experimental Social Psychology. Academic Press, New York: 111-147.
Sparrowe, R. T., Liden, R. C., Wayne, S. J., Kraimer, M. L., 2001. SOCIAL NETWORKS AND THE PERFORMANCE OF INDIVIDUALS AND GROUPS. Academy of Management Journal, 44, 2 316.
Uzzi, B., 1996. The Sources and Consequences of Embeddedness for the Economic Performance of Organizations: The Network Effect. American Sociological Review, 61, 4 674-698.

36
Wasserman, S., Faust, K. (1994), Social Network Analysis: Methods and Applications, Cambridge University Press.
36
Wasserman, S., Faust, K. (1994), Social Network Analysis: Methods and Applications, Cambridge University Press.
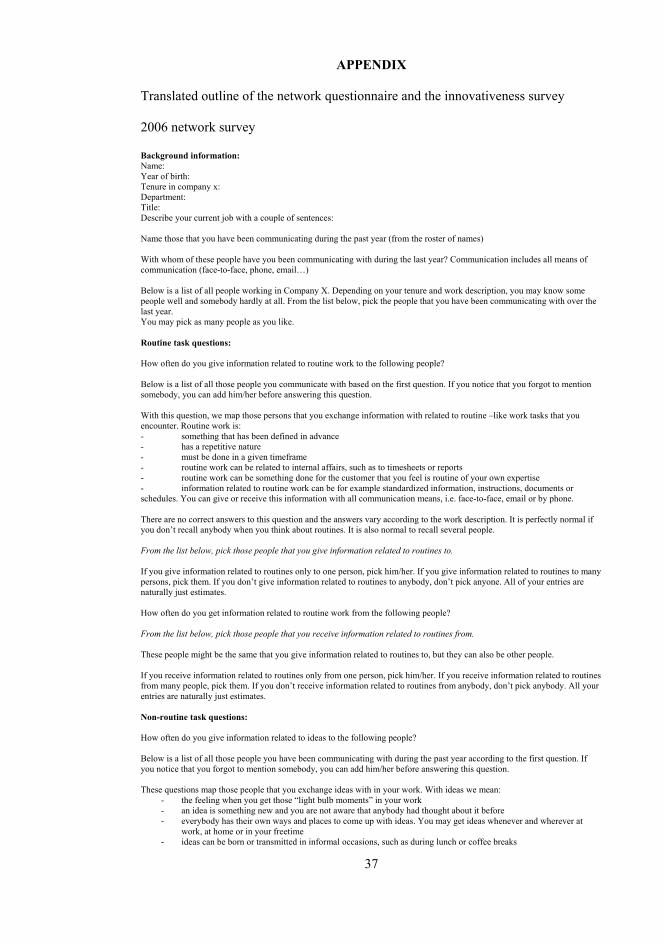
37
APPENDIX
Translated outline of the network questionnaire and the innovativeness survey 2006 network survey Background information: Name: Year of birth: Tenure in company x: Department: Title: Describe your current job with a couple of sentences: Name those that you have been communicating during the past year (from the roster of names) With whom of these people have you been communicating with during the last year? Communication includes all means of communication (face-to-face, phone, email…) Below is a list of all people working in Company X. Depending on your tenure and work description, you may know some people well and somebody hardly at all. From the list below, pick the people that you have been communicating with over the last year. You may pick as many people as you like. Routine task questions: How often do you give information related to routine work to the following people? Below is a list of all those people you communicate with based on the first question. If you notice that you forgot to mention somebody, you can add him/her before answering this question. With this question, we map those persons that you exchange information with related to routine –like work tasks that you encounter. Routine work is: - something that has been defined in advance - has a repetitive nature - must be done in a given timeframe - routine work can be related to internal affairs, such as to timesheets or reports - routine work can be something done for the customer that you feel is routine of your own expertise - information related to routine work can be for example standardized information, instructions, documents or schedules. You can give or receive this information with all communication means, i.e. face-to-face, email or by phone. There are no correct answers to this question and the answers vary according to the work description. It is perfectly normal if you don’t recall anybody when you think about routines. It is also normal to recall several people. From the list below, pick those people that you give information related to routines to. If you give information related to routines only to one person, pick him/her. If you give information related to routines to many persons, pick them. If you don’t give information related to routines to anybody, don’t pick anyone. All of your entries are naturally just estimates. How often do you get information related to routine work from the following people? From the list below, pick those people that you receive information related to routines from. These people might be the same that you give information related to routines to, but they can also be other people. If you receive information related to routines only from one person, pick him/her. If you receive information related to routines from many people, pick them. If you don’t receive information related to routines from anybody, don’t pick anybody. All your entries are naturally just estimates. Non-routine task questions: How often do you give information related to ideas to the following people? Below is a list of all those people you have been communicating with during the past year according to the first question. If you notice that you forgot to mention somebody, you can add him/her before answering this question. These questions map those people that you exchange ideas with in your work. With ideas we mean:
- the feeling when you get those “light bulb moments” in your work - an idea is something new and you are not aware that anybody had thought about it before - everybody has their own ways and places to come up with ideas. You may get ideas whenever and wherever at
work, at home or in your freetime - ideas can be born or transmitted in informal occasions, such as during lunch or coffee breaks
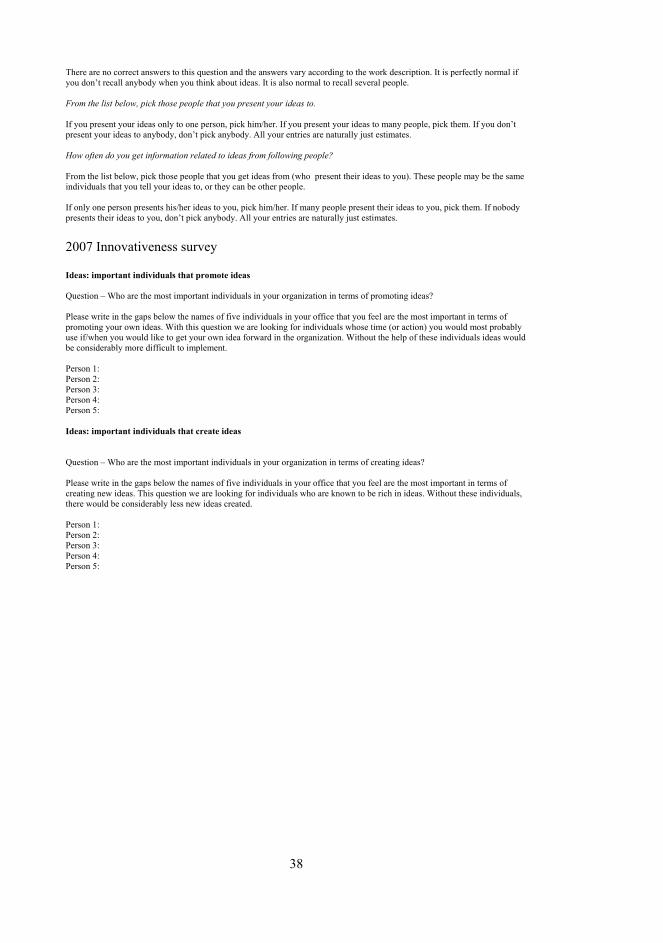
38
There are no correct answers to this question and the answers vary according to the work description. It is perfectly normal if you don’t recall anybody when you think about ideas. It is also normal to recall several people. From the list below, pick those people that you present your ideas to. If you present your ideas only to one person, pick him/her. If you present your ideas to many people, pick them. If you don’t present your ideas to anybody, don’t pick anybody. All your entries are naturally just estimates. How often do you get information related to ideas from following people? From the list below, pick those people that you get ideas from (who present their ideas to you). These people may be the same individuals that you tell your ideas to, or they can be other people. If only one person presents his/her ideas to you, pick him/her. If many people present their ideas to you, pick them. If nobody presents their ideas to you, don’t pick anybody. All your entries are naturally just estimates. 2007 Innovativeness survey Ideas: important individuals that promote ideas Question – Who are the most important individuals in your organization in terms of promoting ideas? Please write in the gaps below the names of five individuals in your office that you feel are the most important in terms of promoting your own ideas. With this question we are looking for individuals whose time (or action) you would most probably use if/when you would like to get your own idea forward in the organization. Without the help of these individuals ideas would be considerably more difficult to implement. Person 1: Person 2: Person 3: Person 4: Person 5: Ideas: important individuals that create ideas Question – Who are the most important individuals in your organization in terms of creating ideas? Please write in the gaps below the names of five individuals in your office that you feel are the most important in terms of creating new ideas. This question we are looking for individuals who are known to be rich in ideas. Without these individuals, there would be considerably less new ideas created. Person 1: Person 2: Person 3: Person 4: Person 5:
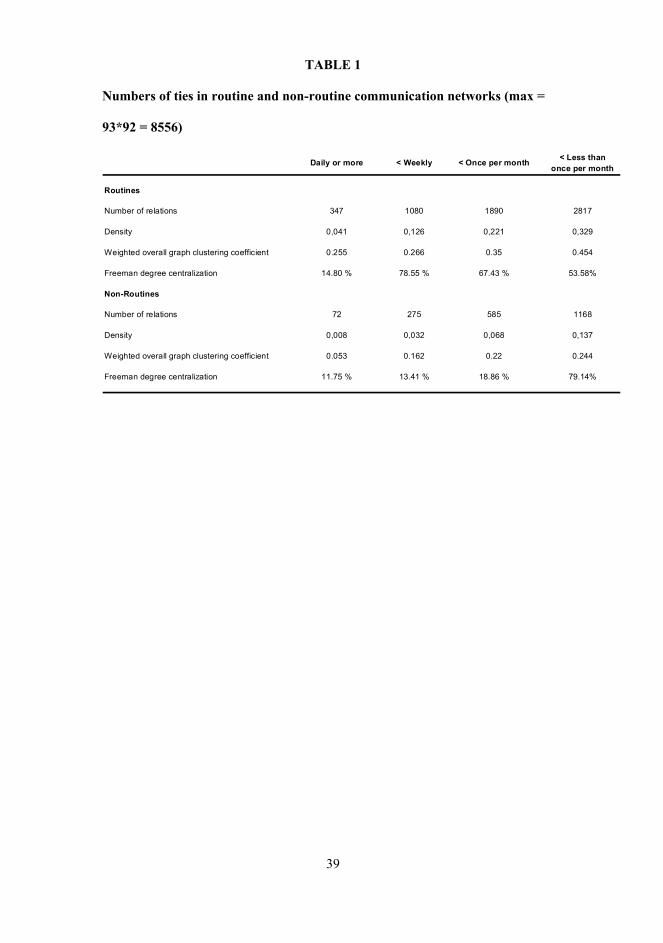
39
TABLE 1
Numbers of ties in routine and non-routine communication networks (max =
93*92 = 8556)
Daily or more < Weekly < Once per month < Less than once per month
Routines
Number of relations 347 1080 1890 2817
Density 0,041 0,126 0,221 0,329
Weighted overall graph clustering coefficient 0.255 0.266 0.35 0.454
Freeman degree centralization 14.80 % 78.55 % 67.43 % 53.58%
Non-Routines
Number of relations 72 275 585 1168
Density 0,008 0,032 0,068 0,137
Weighted overall graph clustering coefficient 0.053 0.162 0.22 0.244
Freeman degree centralization 11.75 % 13.41 % 18.86 % 79.14%
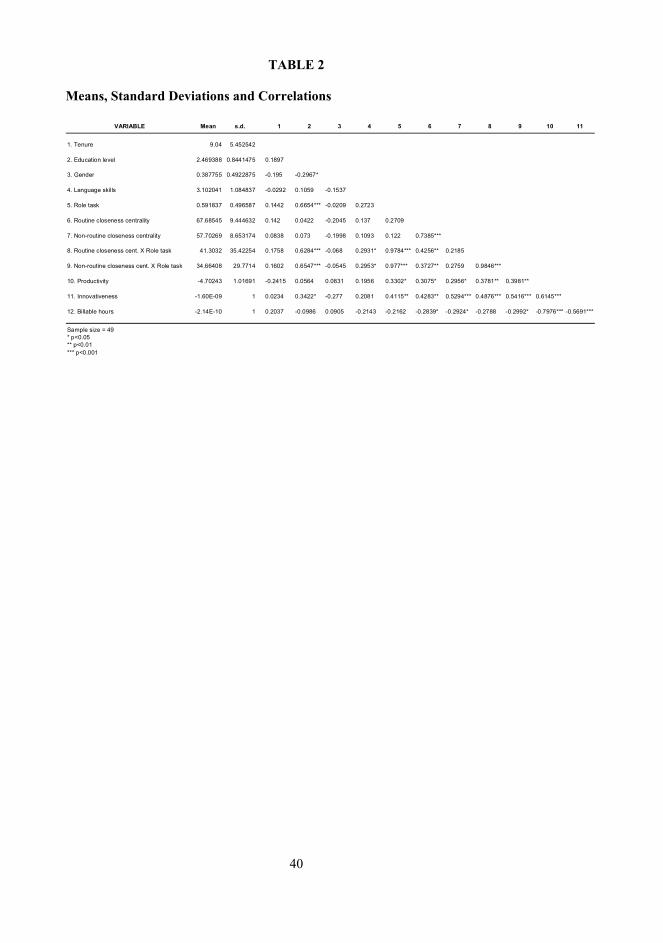
40
TABLE 2
Means, Standard Deviations and Correlations
VARIABLE Mean s.d. 1 2 3 4 5 6 7 8 9 10 11
1. Tenure 9.04 5.452542
2. Education level 2.469388 0.8441475 0.1897
3. Gender 0.387755 0.4922875 -0.195 -0.2967*
4. Language skills 3.102041 1.084837 -0.0292 0.1059 -0.1537
5. Role task 0.591837 0.496587 0.1442 0.6654*** -0.0209 0.2723
6. Routine closeness centrality 67.68545 9.444632 0.142 0.0422 -0.2045 0.137 0.2709
7. Non-routine closeness centrality 57.70269 8.653174 0.0838 0.073 -0.1998 0.1093 0.122 0.7385***
8. Routine closeness cent. X Role task 41.3032 35.42254 0.1758 0.6284*** -0.068 0.2931* 0.9784*** 0.4256** 0.2185
9. Non-routine closeness cent. X Role task 34.66408 29.7714 0.1602 0.6547*** -0.0545 0.2953* 0.977*** 0.3727** 0.2759 0.9846***
10. Productivity -4.70243 1.01691 -0.2415 0.0564 0.0831 0.1956 0.3302* 0.3075* 0.2956* 0.3781** 0.3981**
11. Innovativeness -1.60E-09 1 0.0234 0.3422* -0.277 0.2081 0.4115** 0.4283** 0.5294*** 0.4876*** 0.5416*** 0.6145***
12. Billable hours -2.14E-10 1 0.2037 -0.0986 0.0905 -0.2143 -0.2162 -0.2839* -0.2924* -0.2788 -0.2992* -0.7976*** -0.5691***
Sample size = 49* p<0.05** p<0.01*** p<0.001
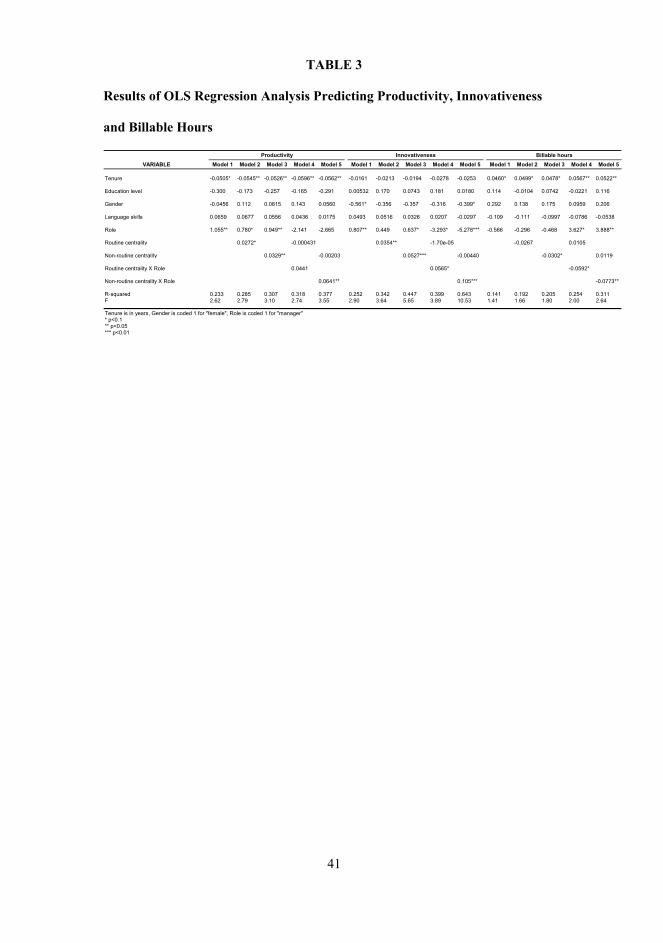
41
TABLE 3
Results of OLS Regression Analysis Predicting Productivity, Innovativeness
and Billable Hours
Productivity Innovativeness Billable hoursVARIABLE Model 1 Model 2 Model 3 Model 4 Model 5 Model 1 Model 2 Model 3 Model 4 Model 5 Model 1 Model 2 Model 3 Model 4 Model 5
Tenure -0.0505* -0.0545** -0.0526** -0.0596** -0.0562** -0.0161 -0.0213 -0.0194 -0.0278 -0.0253 0.0460* 0.0499* 0.0478* 0.0567** 0.0522**
Education level -0.300 -0.173 -0.257 -0.165 -0.291 0.00532 0.170 0.0743 0.181 0.0180 0.114 -0.0104 0.0742 -0.0221 0.116
Gender -0.0456 0.112 0.0815 0.143 0.0560 -0.561* -0.356 -0.357 -0.316 -0.399* 0.292 0.138 0.175 0.0959 0.206
Language skills 0.0659 0.0677 0.0556 0.0436 0.0175 0.0493 0.0516 0.0326 0.0207 -0.0297 -0.109 -0.111 -0.0997 -0.0786 -0.0538
Role 1.055** 0.780* 0.949** -2.141 -2.665 0.807** 0.449 0.637* -3.293* -5.278*** -0.566 -0.296 -0.468 3.627* 3.888**
Routine centrality 0.0272* -0.000431 0.0354** -1.70e-05 -0.0267 0.0105
Non-routine centrality 0.0329** -0.00203 0.0527*** -0.00440 -0.0302* 0.0119
Routine centrality X Role 0.0441 0.0565* -0.0592*
Non-routine centrality X Role 0.0641** 0.105*** -0.0773**
R-squared 0.233 0.285 0.307 0.318 0.377 0.252 0.342 0.447 0.399 0.643 0.141 0.192 0.205 0.254 0.311F 2.62 2.79 3.10 2.74 3.55 2.90 3.64 5.65 3.89 10.53 1.41 1.66 1.80 2.00 2.64
Tenure is in years, Gender is coded 1 for "female", Role is coded 1 for "manager"* p<0.1** p<0.05*** p<0.01

42
TABLE 4 Impact of high centrality on employee performance
Non-routine role Routine role
Centrality in non-routine network
+ ns
Centrality in routine network
ns ns +
42
TABLE 4 Impact of high centrality on employee performance
Non-routine role Routine role
Centrality in non-routine network
+ ns
Centrality in routine network
ns ns +
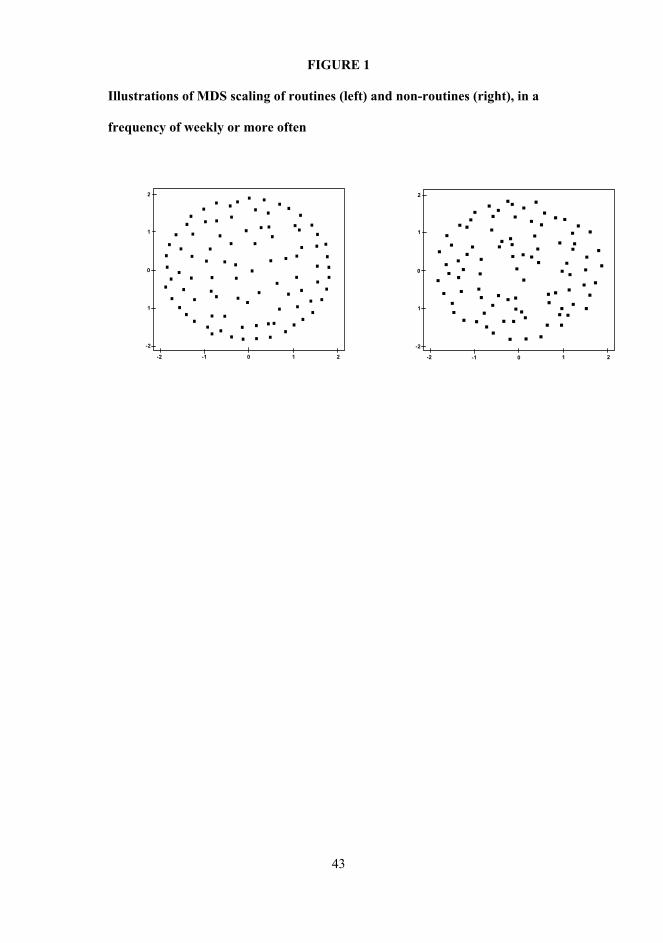
43
FIGURE 1
Illustrations of MDS scaling of routines (left) and non-routines (right), in a
frequency of weekly or more often
1
0
1
-2
-1-2 0 1 2
2
1
0
1
-2
-1-2 0 1 2
2
43
FIGURE 1
Illustrations of MDS scaling of routines (left) and non-routines (right), in a
frequency of weekly or more often
1
0
1
-2
-1-2 0 1 2
2
1
0
1
-2
-1-2 0 1 2
2


![N.€I.€Elkalashy,€M.€Lehtonen,€H.€A.€Darwish,€A.M.€I ...lib.tkk.fi/Diss/2007/isbn9789512290154/article4.pdfdetection and location, etc. [12–15]. In this paper, the](https://img.pdfslide.us/doc/110x75/5e7ccaebd1fe7c052d7c28c0/naiaelkalashyamalehtonenahaaadarwishaamai-libtkkfidiss2007isbn9789512290154.jpg)