Embed Size (px)
Citation preview
Boydstun, Bohm, and Chi, PAA 2014
Public Transportation and Destination Preferences of Hispanic Immigrants
Abstract
Prior studies have described the association between immigrants and transportation.
However, the potential role of commuting modes in destination selection of Hispanic immigrants
has not been examined. The objective of this study is to examine the effect of commuting modes
on shaping spatial distribution of the Hispanic immigrants in the contiguous United States. We
used 2000–2010 county-level data from the U.S. Census Bureau to examine the effects of
commuting modes (driving alone, carpooling, public transit, and walking/biking) on distributions
of the total Hispanic population, the foreign-born Hispanic population, the naturalized foreign-
born population, and the non-naturalized foreign-born Hispanic population. We first examined
the presence of spatial autocorrelation to identify spatial clusters of the Hispanic population
groups. We then used standard regression and spatial regression models to investigate the effects
of commuting to work on Hispanic population distribution in the U.S. Our results suggest that
Hispanics are clustered in California, southwest U.S., and south Florida, but are sparse in the
northern Great Plains and Appalachia. Carpooling and public transit function as pull factors to a
place for Hispanics overall, including Hispanic immigrants. Driving alone and walking/biking
function as deterrents to a place for foreign-born Hispanics, but the effect disappears when this
subgroup is stratified based on citizenship status. Our findings indicate that Hispanic immigrants
prefer locations with public transit and/or carpooling for commuting to work. This has important
implications to transportation planning and policies for addressing the demand of Hispanic
immigrants.
Key Words: Hispanics, Immigration, Transportation, Public transit
Boydstun, Bohm, and Chi, PAA 2014
1. Introduction
The Hispanic population has grown faster than any other racial or ethnic minority group
in the United States over the past 40 years, largely due to immigration. Between 1990 and 2000,
the Hispanic population in the U.S. increased by more than 60 percent (Ramirez 2004), and it
increased by more than 40 percent between 2000 and 2010 (Ennis, Rios-Vargas, & Albert 2011).
This rapid growth in the Hispanic population is expected to continue for the next several decades
(U.S. Census Bureau 2012). Hispanics have largely been spatially concentrated in the immigrant
gateway areas of the southwestern U.S. and large metropolitan areas, but in recent years the
Hispanic population has been growing in newer destinations such as non-metropolitan counties
in the southeastern U.S. or Midwest (Kandel & Cromartie 2004; Lichter & Johnson 2009).
There is a large body of literature examining the driving factors of Hispanic population
distribution and immigration patterns, including the presence of an established Hispanic
population (Kandel & Cromartie 2004; Lichter & Johnson 2009) and employment opportunities
(Hernandez-Leon & Zuniga 2000). However, the possible role that transportation plays in
affecting Hispanic population distribution and Hispanic immigration has rarely been studied. It
is important to study this because transportation has played an important function in
transforming human society and population redistribution. Access to various commuting modes
likely also affects Hispanic population distribution and redistribution.
The objective of this research is to examine the possible impact of transportation—
commuting modes in particular—on spatial distribution of the Hispanic population in the U.S.,
particularly Hispanic immigrants. Previous research on Hispanics and transportation has been
focused on two areas. First, a larger body of literature has focused on describing transportation
differences between racial and ethnic groups (Blumenberg & Skiki 2007; Blumenberg & Smart

Boydstun, Bohm, and Chi, PAA 2014
2010; Bohon, Stamps, & Atiles 2008; Casas, Arce, & Frye 2004; Cline, Sparks, & Eschbach
2009; Contrino & McGuckin 2009; Pucher & Renne 2003). A second smaller body of literature
has emphasized the effects of Hispanic population growth or Hispanic immigration on the
transportation infrastructure (Blumenberg 2009; Garrett & Taylor 1999; Myers 2001). However,
little is known about the effects of commuting modes on settlement patterns of Hispanic
immigrants.
This research advances the existing literature in three important ways. First, to our
knowledge, this research is the first to argue that commuting modes, such as public transit and
carpooling, shape distribution patterns of Hispanic immigrants and function as a pull factor to a
place by Hispanic immigrants. Second, we investigate and compare the effects of four different
commuting modes—driving alone, carpooling, public transit, and walking/biking—on Hispanic
population distribution in the continental U.S. Third, we analyze the effect of commuting modes
on distribution patterns of four Hispanic populations—total Hispanics, foreign-born Hispanics,
naturalized foreign-born Hispanics, and non-naturalized foreign-born Hispanics—as well as
distribution patterns of non-Hispanic whites and non-Hispanic blacks. Distinguishing the four
Hispanic groups as well as comparing them to whites and blacks could provide further
information on the heterogeneity of the effects across different racial/ethnic groups.
For brevity, we use the term Hispanic in this study. However, we rely on the definition
used by the U.S. Census Bureau in which people of Hispanic or Latino origin self-identify as
“Cuban, Mexican, Puerto Rican, South or Central American, or other Spanish culture or origin
regardless of race” (Ennis et al. 2011).
In the subsequent sections, we present a review of the existing literature regarding
Hispanics and transportation modes. Next, we detail the data and methods used for this study,
Boydstun, Bohm, and Chi, PAA 2014
followed by the results of our analysis. We conclude with a summary of our findings and their
implications.
2. Literature Review
Previous research on Hispanics and transportation has been focused on two areas. First, a
larger body of literature has focused on describing transportation differences between racial and
ethnic groups. These descriptive studies of transportation use have found that Hispanics are less
likely than non-Hispanic whites to rely on private vehicles as their primary transportation mode
(Pucher & Renne 2003). Hispanic immigrants are also less likely than native-born Hispanics to
own a private vehicle (Casas et al. 2004). Explanations for these findings range from lower
incomes of immigrants and the inability to afford reliable transportation to barriers obtaining a
driver’s license (Bohon et al. 2008). As a result, new immigrants are forced to seek alternative
transportation modes, such as carpools, public transit, or walking/biking.
Hispanics are more likely to carpool relative to other racial and ethnic groups (Pucher &
Renne 2003), while immigrants are also more likely to carpool compared to the native born
(Blumenberg & Smart 2010; Cline et al. 2009). Hispanics, regardless of nativity, are more likely
to carpool relative to non-Hispanic whites (Blumenberg & Smart 2010; Cline et al. 2009).
Numerous explanations for immigrants’ use of carpooling have emerged in the literature.
Blumenberg and Smart (2010) identified several determinants of carpooling that may explain its
use among immigrants. Determinants with a negative association with carpooling include
household income, educational attainment, and the number of household vehicles relative to the
number of adults in the household. Conversely, household size and household structure are
positively associated with carpooling. Because immigrant households may consist of extended
Boydstun, Bohm, and Chi, PAA 2014
family members or non-family members, they are larger than or have more adults than native-
born households (Casas et al. 2004).
Immigrants, relative to the native-born, are more likely to use public transit (Blumenberg
& Skiki 2007; Blumenberg & Smart 2010); foreign-born Hispanics are more likely to depend on
public transit, walking, or biking for commuting compared to native-born Hispanics (Casas et al.
2004; Myers 2001). Yet literature on the use of public transit by racial or ethnic groups is less
consistent. Some studies have found that Hispanics are more likely to use public transit
compared to non-Hispanic whites (Blumenberg & Smart 2010; Pucher & Renne 2003), but less
likely compared to Asians or non-Hispanic blacks (Pucher & Renne 2003). However, when
compared to other commuters, Hispanic immigrants are more likely to use public transit
(Blumenberg & Skiki 2007).
Hispanics are more likely than other ethnic groups to walk (Contrino and McGuckin
2009), while immigrants are more likely to walk or bike relative to the native born (Blumenberg
& Smart 2010). Hispanic immigrants are more likely to depend on walking or biking for
commuting compared to native-born Hispanics (Myers 2001). One explanation for this finding
is that immigrants are more spatially concentrated than native born persons of the same age and
ethnicity (Bartel 1989; Casas et al. 2004). Some Hispanic immigrants may settle and work in
“ethnic enclaves” or neighborhoods that have a high concentration of persons with a similar
ethnic background. As a result, Hispanic immigrants may have shorter travel distances to work,
thus walking or biking to work is more economically feasible.
A number of scholars have used spatial mismatch theory to explain why racial and ethnic
minorities or immigrants rely on public transit (Ong & Miller 2005; Painter, Liu, & Zhuang
2007; Taylor & Ong 1995). Spatial mismatch theory essentially argues that racial and ethnic

Boydstun, Bohm, and Chi, PAA 2014
minorities residing in central cities encounter fewer employment opportunities (Wilson 2012).
As a result, they must seek employment outside of the central city. Because these groups also
experience lower incomes, they are less likely to have access to a reliable private vehicle. The
greater distance to work due to commuting out of the central city also impedes their ability to
walk or bike to work. Consequently, these central city residents depend on public transit to reach
their workplaces.
Some scholars have found that, over time, immigrants tend to assimilate to travel patterns
of the native born, particularly in the use of private vehicles to drive alone to work (Beckman &
Goulias 2008; Blumenberg & Smart 2010; Clark 1998; Ma & Srinivasan 2010). However, even
though the rates of immigrants relying on alternative transportation modes decline over time,
immigrants are still more likely to use carpools, public transit, or walk/bike to work relative to
the native born (Blumenberg & Smart 2010).
Because places with high ethnic concentrations tend to have more users of carpooling and
public transit (Liu & Painter 2012), this study argues that transportation functions as a pull factor
for Hispanic immigrants to settle in a particular area. We hypothesize that carpooling and public
transit each have a positive effect on the Hispanic immigrant population. Alternatively, we
hypothesize that driving alone and walking/biking each have a negative effect on the Hispanic
immigrant population. Thus places are less likely to attract Hispanic immigrants if driving alone
in a personal vehicle functions are a key commuting mode. Likewise, places are also less likely
to attract Hispanic immigrants if walking or biking operates as a principal commuting mode. We
control for ethnic and employment factors that tend to function as pull factors to a place. We
also analyze four Hispanic groups—total Hispanics, foreign-born Hispanics, naturalized foreign-
born Hispanics, and non-naturalized foreign-born Hispanics—as well as non-Hispanic whites

Boydstun, Bohm, and Chi, PAA 2014
and non-Hispanic blacks. We hypothesize that commuting modes do not function as pull factors
for non-Hispanic whites or non-Hispanic blacks. Finally, because we are interested in how
transportation affects spatial clustering of the Hispanic population, we use spatial regression to
address our research questions.
3. Data and Methods
To understand if commuting modes shape the settlement patterns of Hispanic immigrants,
we selected county as our unit of analysis. All counties and county equivalents in the contiguous
U.S. are included, except Broomfield County, CO, because it was created in 2001 from parts of
four other counties, and merging it with its former space does not provide data. Many
independent cities (e.g., Virginia independent cities; Carson City, NV; St. Louis, MO) were
merged with their corresponding counties.
There are four dependent variables of Hispanic populations included in the analysis: the
percentage of the population that is Hispanic (total Hispanics); the percentage of the population
that is foreign-born Hispanic (foreign born Hispanics); the percentage of the population that is
naturalized U.S. citizens among foreign-born Hispanics (naturalized Hispanics); and the
percentage of the population that is not naturalized U.S. citizens among foreign-born Hispanics
(not naturalized Hispanics). We selected these four variables to explore spatial differences
between the Hispanic immigrants relative to all Hispanics residing in the U.S. Naturalized
citizenship potentially functions as a proxy for length of residency since obtaining U.S.
citizenship is a lengthy process. However, many non-naturalized Hispanic immigrants may have
resided in the U.S. long enough to have obtained citizenship, but other factors may have deterred
their application for citizenship. There are two additional dependent variables included in the

Boydstun, Bohm, and Chi, PAA 2014
analyses: the percentage of the population that is non-Hispanic white and the percentage of the
population that is non-Hispanic black. We included these two groups as a means to support our
hypotheses regarding Hispanics, but also because we hypothesize that commuting modes do not
function as pull factors to a place for non-Hispanic whites and non-Hispanic blacks. These data
were obtained from the 2006-2010 American Community Survey (ACS) five-year estimates
(U.S. Census Bureau 2011).
Four explanatory variables are used in the analysis. These are the percentage of the
population workforce age 16+ that drives a privately-owned vehicle to work; the percentage of
the population workforce age 16+ that carpools in a privately-owned vehicle to work; the
percentage of the population workforce age 16+ that uses public transportation to get to work;
and the percentage of the population workforce age 16+ that either walks or rides a bicycle to
work. These data were obtained from the 2000 decennial Census (U.S. Census Bureau 2000a),
adding a time-ordered element to our analysis to aid our assumption that commuting modes
shape locational choices of Hispanic immigrants. One limitation of the transportation data is that
it measures the primary transportation mode used to get to work for the population age 16 or
older, where the primary mode is based on the mode used to travel the longest distance (Peters
and MacDonald 2004). However, since most immigrants tend to be young adults of working
age, and thus likely to be seeking employment, our measures of transportation are likely
sufficient.
Several control variables are used in the analysis. We control for the percentage of the
county population that travels fewer than 30 minutes to work because, contrary to the spatial
mismatch hypothesis, Hispanic workers tend to have shorter commutes than non-Hispanic whites
Boydstun, Bohm, and Chi, PAA 2014
(Taylor & Ong 1995). We also control for median household income, the unemployment rate,
and the percentage of the county population that obtained at least a high school degree.
These socioeconomic indicators not only shape migration destination choices (Lee 1966),
particularly for persons seeking employment opportunities, but education and income are also
determinants of commuting modes (Blumenberg & Smart 2010). We control for the percentage
of the population that was employed in the agriculture/forestry/fishing/hunting/mining industry
because this occupational category tends to draw Hispanic immigrants (Chatman & Klein 2009).
It also functions as a proxy for a county’s rural status. These data were obtained from the 2000
decennial Census (U.S. Census Bureau 2000a).
We also included a measure of Hispanic presence as an additional control variable
because previous research has shown that Hispanic immigrants tend to locate in places were
earlier Hispanic immigrants had settled. Using a variable identifying the percentage of the
Hispanic population created severe multicollinearity issues. In order to combat this issue, we
constructed a dummy variable for Hispanic destination. We followed the method of Kandel and
Cromartie (2004), using Hispanic population data from the 1990 and 2000 decennial Censuses.
Counties where at least 10 percent of the population was Hispanic in 1990 and in 2000, as well
as counties that experienced more than a 150 percent increase in Hispanic population between
1990 and 2000 and a Hispanic population gain of at least 1000 persons, were defined as Hispanic
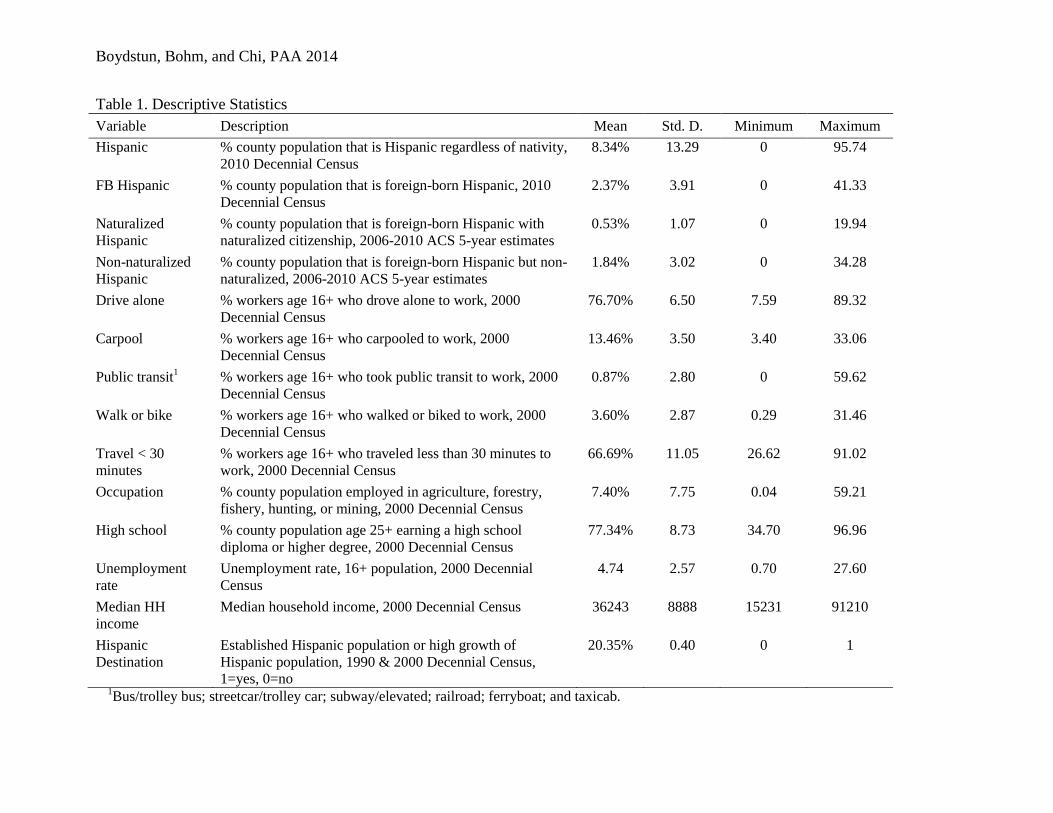
destination counties (U.S. Census Bureau 1990, 2000b). Descriptive statistics for all variables
are shown in Table 1.
[Table 1 about here]
Our analytical strategy is a two-step process. First, we examined several spatial weight
matrices and the corresponding Moran’s I statistic to determine the weight that best met the need

Boydstun, Bohm, and Chi, PAA 2014
of our project. The Moran’s I statistic measures the presence of spatial autocorrelation, and
values range from 1 (indicating positive spatial autocorrelation) to -1 (indicating negative spatial
autocorrelation). Positive spatial autocorrelation suggests that a county is similar to its neighbors
for the observed variable, while negative spatial autocorrelation suggests that a county is unlike
its neighbors for the observed value. The strength of the spatial autocorrelation is based on the
value’s proximity to 1 (or -1).
In the second step of our analytical strategy, we estimated the effect of commuting modes
on each of the four Hispanic groups using several regression methods. First, we estimated
Ordinary Least Squares (OLS) regression models. Next, we examined the diagnostic tests for
spatial dependence. The Moran’s I for residuals, if significant, indicates that spatial
autocorrelation is present. We then examined the significance of five tests for spatial
dependence: the Lagrange Multiplier (lag), the Lagrange Multiplier (error), the Robust LM
(lag), the Robust LM (error), and the Lagrange Multiplier (SARMA). Significant values indicate
the presence of spatial dependence and allow us to understand the type of spatial dependence
affecting the OLS results. Once the type of spatial dependence was determined, we ran the
corresponding spatial regression model—spatial lag, spatial error, or SARMA—for each
dependent variable. The spatial lag model adds a spatially lagged variable (ρ) to the model,
where a positive and significant value may indicate that a county is expected to have a high value
for the corresponding response variable if its neighbors also have high values for the same
variable on average. The spatial error model includes a spatially lagged error term (λ), where a
significant coefficient potentially indicates spatial autocorrelation in the errors. The spatial error
with lag dependence model is a spatial error model that includes the spatial lag term as a
covariate, and it suggests that a county’s Hispanic population is directly influenced by the
Boydstun, Bohm, and Chi, PAA 2014
Hispanic population of its neighbors, above and beyond the expectations of the other covariates
in the model. Three measures of fit—the log-likelihood, the Akaike information criterion (AIC),
and the Bayesian information criterion (BIC)—are included with each model to determine the
best model fit. To determine model fit, higher values for the log-likelihood statistic indicate a
better model fit, while lower values of the AIC and BIC statistics indicate a better model fit.
4. Spatial Distribution of Hispanics
For the purposes of this research, we used the queen weight matrix, a contiguity weight
matrix that considers neighboring counties with shared borders for individual counties. We then
generated local indicators of spatial association (LISA) in order to create maps illustrating the
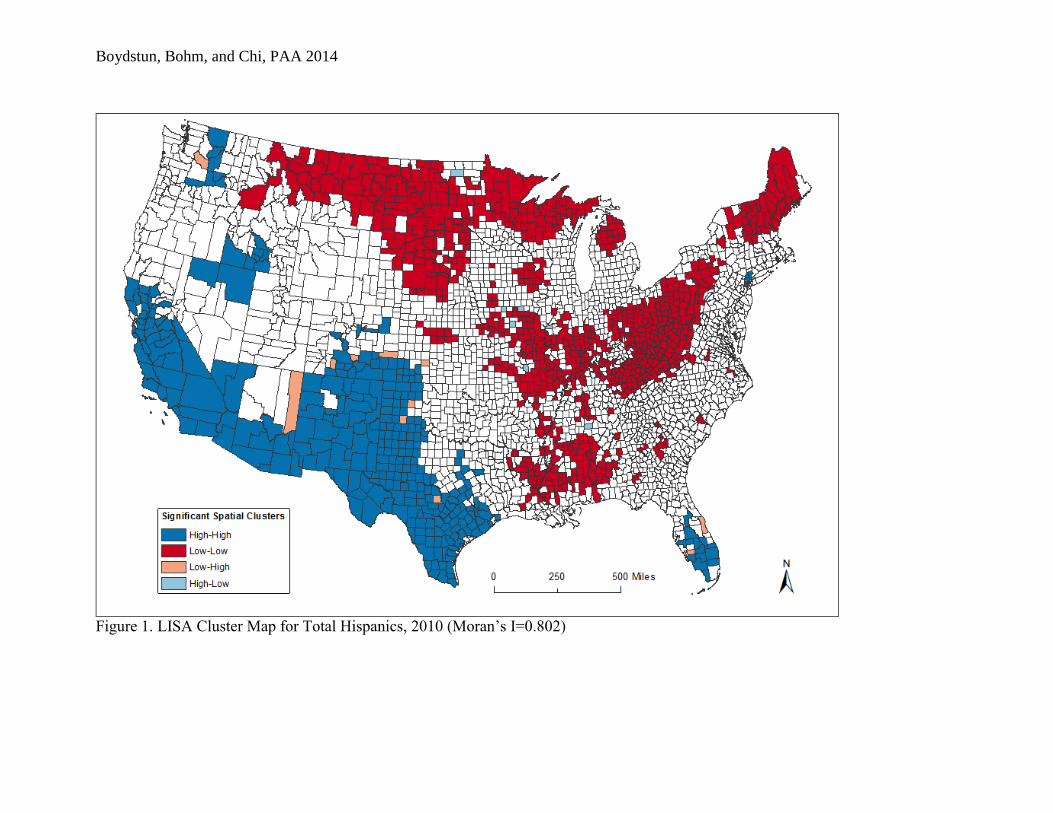
type of spatial autocorrelation or clustering (Figures 1–4). Five types of clustering are shown in
each map: 1) high-high (shown in darker blue) indicates high values for an individual county as
well as its neighbors for the observed variable; 2) low-low (shown in red) indicates low values
for an individual county and its neighbors for the observed variable; 3) low-high (shown in
orange) indicates a low value for an individual county and high values among its neighbors for
the observed variable; 4) high-low (shown in light blue) indicates a high value for an individual
county but low values among its neighbors for the observed variable; and 5) not significant
(shown in white) counties indicate that an individual county is not statistically different from its
neighbors (at the p < .05 level).
Figure 1 shows the spatial clustering of Hispanics (both native and foreign-born). High-
high counties are mainly concentrated in the southwestern U.S., California, and Florida.
Conversely, the low-low counties are primarily concentrated in the northern Great Plains and
Appalachia, with smaller clusters in upper New England, the Mid-West, and across Alabama,

Boydstun, Bohm, and Chi, PAA 2014
Mississippi, and Louisiana. Very few counties, either high-low or low-high, are identified as
being statistically different from their neighbors.
[Figure 1 about here]
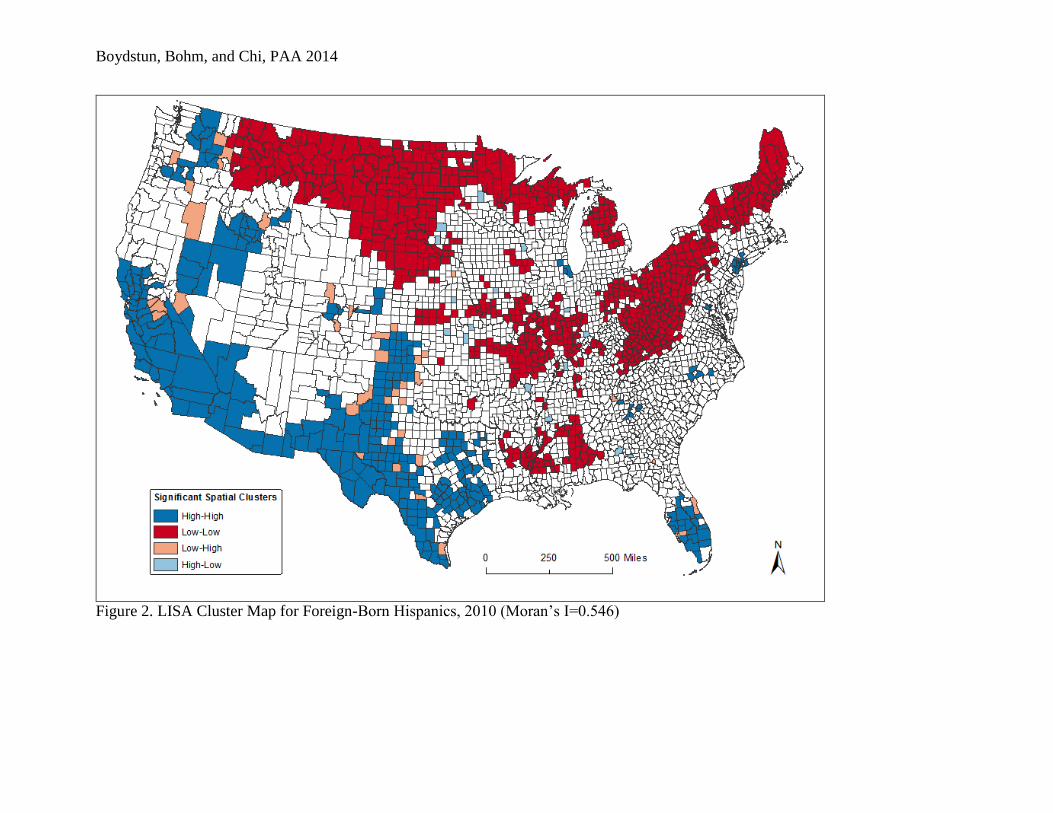
Figure 2 shows the spatial clustering of foreign-born Hispanics. High-high spatial
clusters are still largely located in the southwestern U.S., California, and Florida. Low-low
spatial clusters are found largely along the Canadian border and in Appalachia, with smaller
clusters in the Mid-West and the Deep South. Counties that are statistically different from their
neighbors—high-low or low-high counties—are dispersed throughout the U.S.
[Figure 2 about here]
Figure 3 shows the spatial autocorrelation of foreign-born Hispanics who are naturalized
U.S. citizens. High-high counties are clustered along the U.S.-Mexico border, as well as in
California and Florida. Low-low counties are clustered in Appalachia and the northern Great
Plains states, with smaller clusters located in the Mid-West, upper New England, and the Deep
South. Again, few counties are statistically different from their neighbors.
[Figure 3 about here]
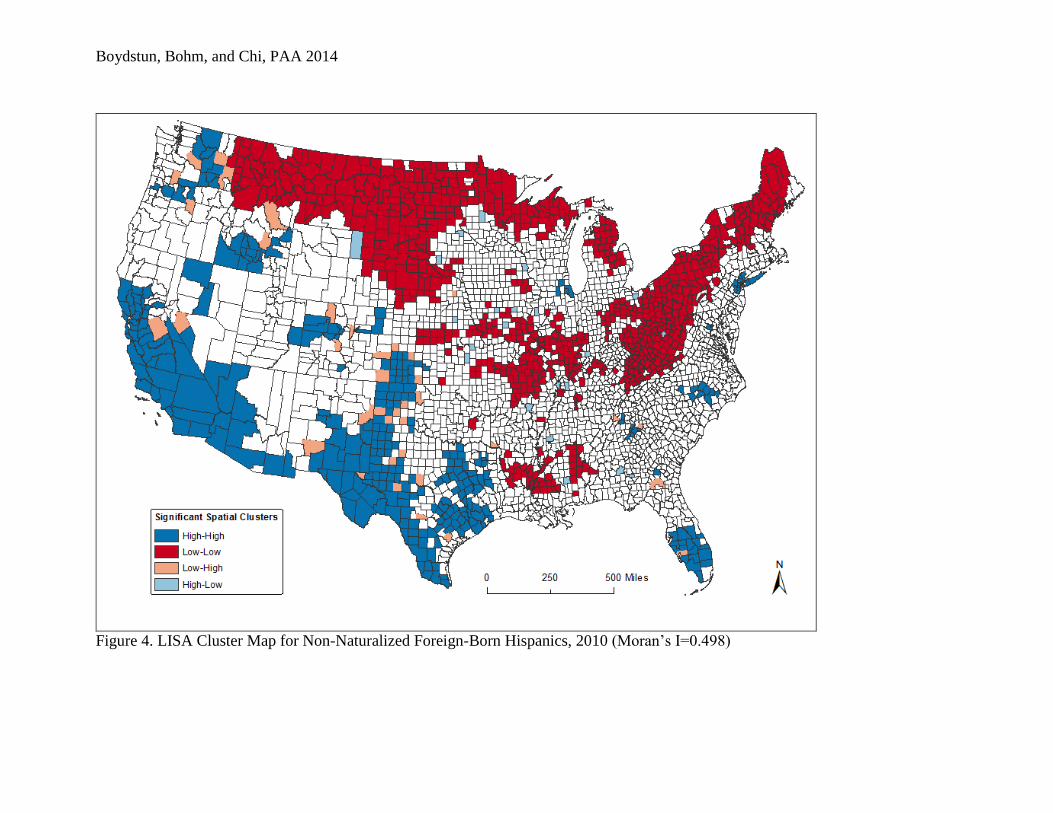
Figure 4 shows the spatial clustering of foreign-born Hispanics who are not naturalized
U.S. citizens. High-high clusters are located in the western and southwestern U.S. and Florida.
Low-low clusters are located primarily along the Canadian border, as well as in parts of the Mid-
West and Appalachia. Counties that are statistically different from their neighbors are dispersed
throughout the U.S.
[Figure 4 about here]
Boydstun, Bohm, and Chi, PAA 2014
5. Transportation Impacts on Hispanics
5.1 OLS Regression
Table 2 presents the OLS regression results for each of the dependent variables. For all
Hispanics (Model 1), carpooling has a positive effect on the total Hispanic population, net of
other variables in the model. Likewise, public transit has a positive effect on the total Hispanic
population, net of other variables in the model. However, the statistically significant Moran’s I
for residuals value suggests that the spatial clustering of the variables in the model has influence
on the output. Therefore, we turn to the other metrics of spatial dependence. Since each of the
remaining metrics is statistically significant (p≤.001), we select the robust score with the highest
value to determine the appropriate spatial regression for all Hispanics, regardless of nativity. For
all Hispanics, spatial lag regression is the appropriate spatial regression estimation method.
[Table 2 about here]
There are similar findings for the Hispanic immigrant subgroups (Models 2-4). Both
carpooling and public transit have significant and positive effects on Hispanic immigrants,
regardless of citizenship status (although carpooling is only mildly significant for naturalized
Hispanic immigrants). The Moran’s I for residuals value is also statistically significant for each
of the Hispanic immigrant subgroups, so we examine the other spatial dependence metrics. And
because each of the remaining metrics is statistically significant (p≤.001), we select the robust
score with the highest value to determine the appropriate spatial regression for each of the
Hispanic immigrant subgroups. For foreign-born Hispanics and naturalized Hispanics, spatial
lag regression is the appropriate spatial regression estimation method. However, spatial error
regression is the appropriate estimation method for not naturalized Hispanics.

Boydstun, Bohm, and Chi, PAA 2014
Conversely, for the non-Hispanic white population (Model 5), driving alone, carpooling,
and public transit have significant and negative effects. However, the Moran’s I for residuals
value is statistically significant, indicating spatial dependence. Because all other dependence
metrics are statistically significant (p≤.001), we select the robust score with the highest value to
determine the spatial regression method. The results indicate that, for non-Hispanic whites,
spatial error regression is the appropriate estimation method.
The findings for non-Hispanic blacks are unexpected. To some extent, the findings are
similar to that of Hispanics as both carpooling and public transit have significant and positive
effects on the non-Hispanic black population. Additionally, driving alone has a significant and
positive effect on the non-Hispanic black population. However, as with the other population
groups included in the analyses, the Moran’s I for residuals value is statistically significant,
indicating the influence of spatial clustering. Because the remaining spatial dependence metrics
are all statistically significant (p≤.001), it is the robust scores that determine the appropriate
spatial regression estimation method. The results indicate that spatial error regression is the
appropriate estimation method for non-Hispanic blacks.
5.2 Spatial Regression
Spatial regression results for each dependent variable are presented in Table 3. Model 7
shows the spatial lag results for all Hispanics. Carpooling and public transit each have a positive
effect on the Hispanic population, suggesting that Hispanics are pulled to counties with access to
carpooling and public transit. The spatial lag term is also positive and statistically significant,
indicating that an individual county is expected to have a high value for the Hispanic population
Boydstun, Bohm, and Chi, PAA 2014
if, on average, its neighbors also have high values for the Hispanic population. Additionally, the
measures of fit statistics indicate that Model 7 is a better fit than Model 1.
[Table 3 about here]
Model 8 shows the spatial lag results for foreign-born Hispanics, and all four explanatory
variables are statistically significant. Driving alone, as does walking/biking, has a negative
effect on the Hispanic immigrant population. These findings suggest that counties with high
values of driving alone to work in a privately-owned vehicle or walking/biking to work deter
Hispanic immigrants. Conversely, carpooling and public transit are positive predictors of the
Hispanic immigrant population. These findings suggest that access to carpools and public transit
each operate as pull factors to a place, net of the other variables in the model. However, the
spatial lag term also has a positive and significant effect on the Hispanic immigrant population,
suggesting that that an individual county is expected to have a high value for the Hispanic
immigrant population if, on average, its neighbors also have high values for the Hispanic
immigrant population. The measures of fit statistics indicate that Model 8 is a better fit than
Model 2.
For naturalized Hispanic immigrants (Model 9), the results of the spatial lag regression
are somewhat different. Driving alone is a significant and negative predictor of the naturalized
Hispanic immigrant population. This finding potentially suggests that naturalized Hispanic
immigrants tend not to locate in areas where driving alone to work in a privately-owned vehicle
is the primary commuting mode. Conversely, public transit has a positive effect on the
naturalized Hispanic immigrant population, suggesting that access to and use of public transit
tends to operate as a pull factor to a county. The spatial lag term is also positive and significant,
suggesting that an individual county is expected to have a high value for naturalized Hispanic

Boydstun, Bohm, and Chi, PAA 2014
immigrants if, on average, its neighbors also have high values for naturalized Hispanic
immigrants. The measures of fit statistics indicate that Model 9 is a better fit than Model 3.
Model 10 is a spatial error model for non-naturalized Hispanic immigrants. Carpooling,
as well as public transit, has a significant and positive effect on Hispanic immigrants who are not
naturalized U.S. citizens, suggesting that each of these commuting modes operates as a pull
factor for non-naturalized Hispanic immigrants. The spatial error term is also significant and
positive, indicating the presence of spatial autocorrelation in the errors. This finding also
indicates that an unmeasured factor influences non-naturalized Hispanic immigrants. The
measures of fit statistics indicate that Model 10 is a better fit than Model 4.
For non-Hispanic whites (Model 11), carpooling has a significant and negative,
suggesting that carpooling deters non-Hispanic whites from locating in an area. Similarly, public
transit has a significant and negative effect on non-Hispanic whites and also suggests that public
transit deters non-Hispanic whites from settling in a place. The spatial error term is also
significant and positive, indicating the presence of spatial autocorrelation in the errors. This
finding also indicates that an unmeasured factor influences non-Hispanic whites. The measures
of fit statistics indicate that Model 11 is a better fit than Model 5.
Finally, Model 12 indicates that carpooling has a significant and positive effect on non-
Hispanic blacks. Public transit also has a significant and positive effect on non-Hispanic blacks.
However, walking/biking has a significant and negative effect on non-Hispanic blacks. These
findings suggest that carpooling and public transit also function as pull factors to a place for non-
Hispanic blacks, but walking/biking deters non-Hispanic blacks from a place. However, the
spatial error term is also significant and positive, indicating that an unmeasured factor influences
Boydstun, Bohm, and Chi, PAA 2014
non-Hispanic blacks locational choices. The measures of fit statistics indicate that Model 12 is a
better fit than Model 6.
6. Conclusions
This study examined the role that commuting modes play in affecting the distribution of
Hispanic immigrant population, naturalized or not. We hypothesize that access to carpools and
to public transit operate as pull factors that shape spatial distribution of Hispanic immigrants.
Our results indicate that carpooling to work does positively influence the settlement patterns of
all Hispanics, Hispanic immigrants, and non-naturalized Hispanic immigrants. Our findings also
suggest that public transit positively influences the settlement patterns of Hispanics, immigrants
or not, and naturalized or not. Driving alone and walking/biking function as deterrents to a place
for foreign-born Hispanics, but the effect disappears when this subgroup is stratified based on
citizenship status. Additionally, our findings suggest that carpooling and public transit attract
non-Hispanic blacks, but deter non-Hispanic whites.
To our knowledge, this study is the first to argue that commuting modes, such as public
transit and carpooling, shape settlement patterns of Hispanic immigrants. Our results have
theoretical implications, suggesting that carpooling and public transit function as pull factors to a
place, linking to both the economic and social factors that shape location choices. Because
Hispanic immigrants likely do not have the resources to purchase a private vehicle upon arrival
into the U.S., they instead rely on their social networks for transportation to work in the form of
carpooling. This form of social capital also allows them to acquire economic resources in the
form of employment and wages. Alternatively, Hispanic immigrants may also acquire economic
resources by relying on public transit to get to work places.

Boydstun, Bohm, and Chi, PAA 2014
In addition to the theoretical implication that carpooling and public transit function as
pull factors for Hispanic immigrants, our findings have several substantive implications. First,
Hispanic population growth may occur in non-metropolitan areas or in metropolitan areas that
lack a sufficient public transit system if carpooling is available. Previous research has
established that the odds of carpooling were increased for Hispanics residing in non-metro areas
(Cline et al. 2009). Alternatively, Hispanic population growth may occur in metropolitan areas
as public transit tends to be found in metro areas rather than non-metro areas. Second, reliance
upon carpooling may have long-term implications for increased traffic on roadways. Because
immigrants tend to assimilate to travel patterns similar to that of the native born (Blumenberg &
Skiki 2007), it is likely that, over time, foreign-born Hispanics will transition from carpooling to
driving alone, thus increasing the number of vehicles on area roadways. Third, Hispanic
population growth in places with public transit could result in increased ridership. In turn,
transportation planners may seek to improve the quality of service of public transit in areas
where Hispanic immigrants settle, particularly central cities (Garrett & Taylor 1999). In areas
where Hispanic immigrants have access to public transit and carpools, they may be choosing
carpools over public transit due to poor service. Consequently, improving the service in those
areas could potentially increase public transit ridership as public transit may be more
economically feasible than carpooling (Bohon et al. 2008).
References
Bartel, Ann P. (1989). Where do the new U.S. immigrants live? Journal of Labor Economics,
7(4), 371. doi: 10.2307/2535134
Boydstun, Bohm, and Chi, PAA 2014
Beckman, J. D., & Goulias, K. G. (2008). Immigration, residential location, car ownership, and
commuting behavior: a multivariate latent class analysis from California. Transportation,
35(5), 655-671. doi: 10.1007/s11116-008-9172-x
Blumenberg, Evelyn. (2009). Moving in and moving around: immigrants, travel behavior, and
implications for transport policy. Transportation Letters: The International Journal of
Transportation Research, 1(2), 169-180. doi: 10.3328/TL.2009.01.02.169-180
Blumenberg, Evelyn, & Skiki, Kimiko. (2007). Transportation assimilation: immigrants, race
and ethnicity, and mode choice. Paper presented at the Transportation Research Board
86th Annual Meeting, Washington, DC.
Blumenberg, Evelyn, & Smart, Michael. (2010). Getting by with a little help from my
friends…and family: immigrants and carpooling. Transportation, 37(3), 429-446. doi:
10.1007/s11116-010-9262-4
Bohon, Stephanie A., Stamps, Katherine, & Atiles, Jorge H. (2008). Transportation and migrant
adjustment in Georgia. Population Research and Policy Review, 27(3), 273-291. doi:
10.2307/41217950
Casas, Jesse, Arce, Carlos, & Frye, Christopher. (2004). Latino immigration and its impact on
future travel behavior. Paper presented at the National Household Travel Survey
Conference: Understanding Our Nation’s Travel, Washington, DC.
Chatman, Daniel G., & Klein, Nicholas. (2009). Immigrants and travel demand in the United
States: implications for transportation policy and future research. Public Works
Management & Policy, 13(4), 312-327. doi: 10.1177/1087724x09334633
Clark, William AV. (1998). The California Cauldron: Immigration and the Fortunes of Local
Communities: The Guilford Press.

Boydstun, Bohm, and Chi, PAA 2014
Cline, Michael, Sparks, Corey, & Eschbach, Karl. (2009). Understanding carpool use by
Hispanics in Texas. Transportation Research Record: Journal of the Transportation
Research Board, 2118(-1), 39-46. doi: 10.3141/2118-06
Contrino, Heather, & McGuckin, Nancy. (2009). Travel demand in the context of growing
diversity. TR NEWS, 264, 4-8.
Ennis, Sharon R., Merarys Rios-Vargas, and Nora G. Albert. (2011). The Hispanic Population:
2010. Washington, D.C.: U.S. Census Bureau.
Garrett, M., & Taylor, B. (1999). Reconsidering social equity in public transit. Berkeley
Planning Journal, 13, 6-27.
Hernandez-Leon, Ruben, & Victor Zuniga. (2000). Making carpet by the mile: The emergence of
a Mexican immigrant community in an industrial region of the U.S. historic South. Social
Science Quarterly, 8(1), 49-66.
Kandel, William, & Cromartie, John. (2004). New patterns of Hispanic settlement in rural
America. Rural Development Research Report. Washington, DC: US Department
Agriculture, Economic Research Service.
Lee, Everett S. (1966). A theory of migration. Demography, 3(1), 47-57. doi: 10.2307/2060063
Lichter, Daniel T., & Johnson, Kenneth M. (2009). Immigrant gateways and Hispanic migration
to new destinations1. International Migration Review, 43(3), 496-518. doi:
10.1111/j.1747-7379.2009.00775.x
Liu, Cathy Yang, & Painter, Gary. (2012). Travel behavior among Latino immigrants: the role of
ethnic concentration and ethnic employment. Journal of Planning Education and
Research, 32(1), 62-80. doi: 10.1177/0739456x11422070
Boydstun, Bohm, and Chi, PAA 2014
Ma, L., & Srinivasan, S. (2010). Impact of individuals' immigrant status on household auto
ownership. Transportation Research Record, 2156(1), 36-46. doi: 10.3141/2156-05
Myers, Dowell. (2001). Demographic futures as a guide to planning: California's Latinos and the
compact city. Journal of the American Planning Association, 67(4), 383-397. doi:
10.1080/01944360108976247
Ong, Paul M., & Miller, Douglas. (2005). Spatial and transportation mismatch in Los Angeles.
Journal of Planning Education and Research, 25(1), 43-56. doi:
10.1177/0739456x04270244
Painter, Gary, Liu, Cathy Yang, & Zhuang, Duan (2007). Immigrants and the spatial mismatch
hypothesis: employment outcomes among immigrant youth in Los Angeles. Urban
Studies, 44(13), 2627-2649. doi: 10.1080/00420980701558368
Peters, Alan, & Heather MacDonald. (2004). Unlocking the Census with GIS. Redlands, CA:
ESRI.
Pucher, John, & Renne, John L. (2003). Socioeconomics of urban travel: evidence from the 2001
NHTS. Transportation Quarterly, 57(3), 49-77.
Ramirez, Roberto R. (2004). We the People: Hispanics in the United States. Washington, D.C.:
U.S. Census Bureau.
Taylor, Brian D., & Ong, Paul M. (1995). Spatial mismatch or automobile mismatch? An
examination of race, residence and commuting in US. Urban Studies (Routledge), 32(9),
1453.
U.S. Census Bureau. (2011). American Community Survey, 2010 American Community Survey,
5-Year Estimates, Table S0601. Washington, D.C.: U.S. Census Bureau.
http://factfinder2.census.gov. Last accessed February 11, 2013
Boydstun, Bohm, and Chi, PAA 2014
U.S. Census Bureau. (1990). Decennial Census, Census 1990 Summary File 3 (SF 3) – Sample
Data, Table DP-2. Washington, D.C.: U.S. Census Bureau. Last accessed November 19,
2008
U.S. Census Bureau. (2000a). Decennial Census, Census 2000 Summary File 3 (SF 3) – Sample
Data, Table DP-3. Washington, D.C.: U.S. Census Bureau. http://factfinder2.census.gov.
Last accessed July 15, 2013
U.S. Census Bureau. (2000b). Decennial Census, Census 2000 Summary File 3 (SF 3) – Sample
Data, Table DP-2. Washington, D.C.: U.S. Census Bureau. http://factfinder2.census.gov.
Last accessed February 11, 2013
Wilson, William Julius. (2012). The Truly Disadvantaged: The Inner City, the Underclass, and
Public Policy: University of Chicago Press.
Boydstun, Bohm, and Chi, PAA 2014
Table 1. Descriptive Statistics
Variable Description Mean Std. D. Minimum Maximum
Hispanic % county population that is Hispanic regardless of nativity,
2010 Decennial Census
8.34% 13.29 0 95.74
FB Hispanic % county population that is foreign-born Hispanic, 2010
Decennial Census
2.37% 3.91 0 41.33
Naturalized
Hispanic
% county population that is foreign-born Hispanic with
naturalized citizenship, 2006-2010 ACS 5-year estimates
0.53% 1.07 0 19.94
Non-naturalized
Hispanic
% county population that is foreign-born Hispanic but non-
naturalized, 2006-2010 ACS 5-year estimates
1.84% 3.02 0 34.28
Drive alone % workers age 16+ who drove alone to work, 2000
Decennial Census
76.70% 6.50 7.59 89.32
Carpool % workers age 16+ who carpooled to work, 2000
Decennial Census
13.46% 3.50 3.40 33.06
Public transit1 % workers age 16+ who took public transit to work, 2000
Decennial Census
0.87% 2.80 0 59.62
Walk or bike % workers age 16+ who walked or biked to work, 2000
Decennial Census
3.60% 2.87 0.29 31.46
Travel < 30
minutes
% workers age 16+ who traveled less than 30 minutes to
work, 2000 Decennial Census
66.69% 11.05 26.62 91.02
Occupation % county population employed in agriculture, forestry,
fishery, hunting, or mining, 2000 Decennial Census
7.40% 7.75 0.04 59.21
High school % county population age 25+ earning a high school
diploma or higher degree, 2000 Decennial Census
77.34% 8.73 34.70 96.96
Unemployment
rate
Unemployment rate, 16+ population, 2000 Decennial
Census
4.74 2.57 0.70 27.60
Median HH
income
Median household income, 2000 Decennial Census 36243 8888 15231 91210
Hispanic
Destination
Established Hispanic population or high growth of
Hispanic population, 1990 & 2000 Decennial Census,
1=yes, 0=no
20.35% 0.40 0 1
1Bus/trolley bus; streetcar/trolley car; subway/elevated; railroad; ferryboat; and taxicab.

Boydstun, Bohm, and Chi, PAA 2014
Table 2. Coefficients of ordinary least squares regression models
All Hispanics
(Model 1)
Foreign- Born
Hispanics
(Model 2)
Naturalized
FB Hispanics
(Model 3)
Not Naturalized
FB Hispanics
(Model 4)
Non- Hispanic
Whites
(Model 5)
Non- Hispanic
Blacks
(Model 6)
Drive alone 0.143
(0.081)
−0.042
(0.024)
−0.010
(0.007)
−0.031
(0.019)
−0.359**
(0.136)
0.497***
(0.113)
Carpool 0.692***
(0.094)
0.174***
(0.028)
0.018*
(0.009)
0.156***
(0.022)
−2.612***
(0.155)
1.126***
(0.129)
Public transit 0.553***
(0.098)
0.197***
(0.029)
0.076***
(0.009)
0.121***
(0.023)
−2.189***
(0.162)
1.190***
(0.135)
Walk or bike 0.256
(0.134)
−0.057
(0.040)
−0.003
(0.012)
−0.055
(0.031)
−0.390
(0.224)
0.213
(0.186)
Travel < 30 minutes 0.251***
(0.019)
0.886***
(0.006)
0.019***
(0.002)
0.070***
(0.004)
−0.506***
(0.030)
−0.012
(0.025)
Occupation 0.407***
(0.033)
0.099***
(0.010)
0.019***
(0.003)
0.080***
(0.008)
−0.176**
(0.054)
−0.232***
(0.045)
High school −0.364***
(0.033)
−0.144***
(0.010)
−0.035***
(0.003)
−0.109***
(0.008)
0.784***
(0.054)
−0.283***
(0.045)
Unemployment rate 0.629***
(0.076)
0.169***
(0.023)
0.077***
(0.007)
0.093***
(0.018)
−1.132***
(0.127)
0.316**
(0.105)
Median HH income 4.18E−4***
(3.13E−5)
1.95E−4***
(9.41E−6)
4.72E−5***
(2.89E−6)
1.47E−4***
(7.33E−6)
−7.04E−4***
(4.98E−5)
−1.30E−4**
(4.14E−5)
Hispanic Destination 17.845***
(0.451)
4.413***
(0.136)
1.018***
(0.042)
3.395***
(0.106)
− −
Constant −26.654***
(8.277)
−0.993
(2.489)
0.070
(0.764)
−1.061
(1.939)
149.986***
(13.812)
−18.733
(11.479)
Measures of fit
Log likelihood −11110 −7418 −3790 −6651 −12686 −12118
AIC
22242 14858 7602 13324 25392 24255
BIC
22308 14924 7668 13390 25453 24316
Spatial dependence
Moran’s I for residuals 0.571*** 0.313*** 0.352*** 0.265*** 0.648*** 0.719***
Lagrange Multiplier error 2586*** 778*** 987*** 559*** 3036*** 4108***
Robust LM error 303*** 109*** 50*** 83*** 1041*** 288***
Lagrange Multiplier lag 2894*** 793*** 1119*** 554*** 2062*** 3941***
Robust LM lag 611*** 124*** 182*** 78*** 67*** 121***

Boydstun, Bohm, and Chi, PAA 2014
Lagrange Multiplier
(SARMA)
3197*** 902*** 1169*** 637*** 3103*** 4229***
Notes: *p≤.05; **p≤.01; ***p≤.001. Standard errors are in parentheses. AIC = Akaike information criterion; BIC = Bayesian
information criterion.

Boydstun, Bohm, and Chi, PAA 2014
Table 3. Coefficients of spatial regression models
All Hispanics
(Model 7)
Foreign-Born
Hispanics
(Model 8)
Naturalized
FB Hispanics
(Model 9)
Not Naturalized
FB Hispanics
(Model 10)
Non-Hispanic
Whites
(Model 11)
Non-Hispanic
Blacks
(Model 12)
Drive alone −0.078
(0.048)
−0.071***
(0.021)
−0.017**
(0.006)
−0.034
(0.019)
−0.007
(0.094)
−0.113
(0.065)
Carpool 0.171**
(0.056)
0.083***
(0.025)
0.001
(0.007)
0.128***
(0.023)
−1.146***
(0.110)
0.170*
(0.075)
Public transit 0.125*
(0.058)
0.082**
(0.026)
0.027***
(0.007)
0.104***
(0.026)
−1.517***
(0.129)
0.587***
(0.089)
Walk or bike −0.128
(0.079)
−0.095**
(0.035)
−0.018
(0.010)
−0.055
(0.029)
0.063
(0.136)
−0.257**
(0.093)
Travel <30 mins. 0.162***
(0.011)
0.073***
(0.005)
0.015***
(0.001)
0.062***
(0.004)
−0.415***
(0.020)
0.159***
(0.014)
Occupation 0.101***
(0.019)
0.050***
(0.009)
0.005*
(0.002)
0.054***
(0.009)
0.187***
(0.045)
−0.080*
(0.031)
High school −0.231***
(0.020)
−0.118***
(0.009)
−0.025***
(0.003)
−0.149***
(0.009)
0.481***
(0.046)
0.035
(0.032)
Unemployment rate 0.349***
(0.045)
0.129***
(0.020)
0.056***
(0.006)
0.050**
(0.019)
−1.105***
(0.095)
0.333***
(0.065)
Median HH income 1.96E−4***
(1.88E−5)
1.36E−4***
(8.53E−6)
2.88E−5***
(2.45E−6)
1.25E−4***
(8.10E−6)
−5.00E−5
(4.10E−5)
−3.36E−4***
(2.85E−5)
Hispanic destination 7.645***
(0.299)
2.999***
(0.128)
0.571***
(0.359)
2.680***
(0.111)
− −
Constant 2.445
(4.898)
3.593
(2.174)
1.094
(0.628)
4.455*
(1.986)
93.008***
(9.635)
12.588
(6.643)
Spatial lag (ρ) 0.709***
(0.010)
0.461***
(0.017)
0.574***
(0.016)
− − −
Spatial error (λ) − − − 0.567***
(0.020)
0.841***
(0.011)
0.890***
(0.008)
Measures of fit
Log likelihood −9691 −7077 −3306 −6387 −11354 −10269
AIC 19406 14178 6635 12797 22728 20558
BIC 19478 14250 6708 12863 22789 20619
*p≤.05; **p≤.01; ***p≤.001 Standard errors are in parentheses. AIC = Akaike information criterion; BIC = Bayesian information
criterion.
Boydstun, Bohm, and Chi, PAA 2014
Figure 1. LISA Cluster Map for Total Hispanics, 2010 (Moran’s I=0.802)
Boydstun, Bohm, and Chi, PAA 2014
Figure 2. LISA Cluster Map for Foreign-Born Hispanics, 2010 (Moran’s I=0.546)

Boydstun, Bohm, and Chi, PAA 2014
Figure 3. LISA Cluster Map for Naturalized Foreign-Born Hispanics, 2010 (Moran’s I=0.563)
Boydstun, Bohm, and Chi, PAA 2014
Figure 4. LISA Cluster Map for Non-Naturalized Foreign-Born Hispanics, 2010 (Moran’s I=0.498)