Embed Size (px)
Citation preview

Transportation Research Record 854
against which the effect of the bus lane could be judged.
7. Continuing involvement of planning staff. Although the project became routine after the first two weeks, unusual conditions continued to arise, e.g., plates over street openings shifted to create hazards, construction equipment that obstructed a lane was used without authorization, enforcement personnel were shifted to other locations, etc. Continuous monitoring and interest in the project by the planning staff enabled these problems to be addressed before they seriously degraded bus lane operation.
Data-gathering efforts and analysis are continuing. In the coming period, the following topics will receive particular attention:
1. Experimentation strategies, including
with differing enforcement various mixes of signing,
77
personnel, and traffic cone placement, to determine the most cost-effective method of keeping violation rates at an acceptable level;
2. Development of benefit/cost ratios, including the real operating cost savings to the bus companies; and
3. Assessment of impact on access to cross streets where right turns are banned.
ACKNOWLEDGMENT
The project and analysis were funded by a Section 6 demonstration grant under the Urban Mass Transportation Act of 1964, as amended.
Publication of this paper sponsored by Committee on Bus Transit Systems.
Public T'ransit Planning by Using Interactive Computer Graphics in Bellevue, Washington
ROBERT A. WHITE, JAMES W. CLARK, AND TOMOKI NOGUCHI .
The interactive graphic transit design system (IGTDS) demonstration study was conducted in the City of Bellevue, Washington. IGTDS is a set of computer programs that enable the planner to design and evaluate alternative transit systems through the use of computer graphic techniques. The IGTDS model estimates travelers' choices between automobile and transit modes for systems that serve trips from many origins to a single destination. IGTDS is easy to use; it was especially designed for transportation planners who do not have com puter programming backgrounds. Facility requirements are accessed to a timeshared computer system and a computer graphics display terminal. The IGTDS demonstration study successfully accomplished its three primary objectives. IGTDS was used to evaluate different transit service concepts that ranged from the do-nothing alternative (reference case for other alternatives) to the 1990 regional transit plan with park-and-ride service to the Bellevue central business district and transit service to the Crossroads shopping center area. Comparison with the Bellevue manual sketch-planning subarea study revealed that approximately one-half as much effort was required for the IGTDS method as for manual sketch planning. The IGTDS demonstration study evaluated approximately 300 transit service designs, an increase in design productivity over the manu~I method by a factor of 60 to 1. The different transit system design results produced by I GTDS were presented in graphical form at a high level of de· tail. The graphic presentation allowed rapid comprehension of the results, and rapid feedback of information also increased understanding of the sensitivity of transportation performance to policy changes. The demonstration study showed that IGTDS is a very useful transportation sketch-planning tool.
Bellevue, Washington, is one of the principal suburbs of Seattle and has a population of approximately BO 000. Bellevue was selected for the interactive graphic transit design system (IGTDS) demonstration study because IGTDS is well-suited to planning new transportation services for small or medium-sized urban areas. Bellevue has a well-def ined central business district (CBD), and the current public transportation services that serve Bellevue are provided specifically for the Seattle CBD (Figure 1).
The objectives of the IGTDS demonstration study (!) were as follows:
1. Apply IGTDS to the solution of actual transit
Figure 1. Location of Bellevue.
planning problems in a real-world planning effort; 2·. Develop comparisons between IGTDS and more
conventional transit planning techniques in terms of design results, resource requirements, and other factors; and
3. Test the usefulness of this technology as a communication medium for facilitating decisionmaker understanding of transit patronage and cost variables in an actual transit plan development environment.
An important constraint on the first objective was to perform the study without collecting new data. That is, the input data needed for IGTDS were obtained from previous transportation studies and from readily available local sources.
BACKGROUND
Currently, passenger transportation to and within the Bellevue CBD is provided primarily by private automobiles. In 1979 only about 2 perceht of all trips to the CBD were made by public transportation. Island-like building developments surrounded by large parking lots, lack of pedestrian amenities, and wide arterial streets with many curb cuts for

78
driveways cause numerous automobile-pedestrian conflicts. These factors result in an environment with low pedestrian attractiveness that is difficult to serve efficiently by public transportation. As a result of the heavy reliance on personal automobile transportation, the street system is congested throughout the day, and the single freeway interchange that serves the CBD has already reached its capacity during peak demand periods. The anticipated growth of the CBD during the next decade is expected to exacerbate these problems if reliance on personal automobile transportation continues as at present.
In recognition of this situation, city officials, business leaders, and citizens have been searching for ways to increase the use of public transpor t ation in Bellevue. The Mayor's CBD Action Committee has established the objective that, by 1990, 20 percent of all trips to the CBD during peak hours arrive by transit as described in the recent Bellevue CBD Action Plan (1). Transportation planning for the 1980s is being conducted by the regional transit operator, Metro Transit, in a process called Metro TRANSITion Phase IV.
In addition to developing plans for Metro's entire system, this study has produced a Bellevue subarea study that focused on the particular needs of the Bellevue CBD (3). Parallel to Metro's studies, Bellevue applied- to the Urban Mass Transportation Administration (UMTA) for a grant to demonstrate the usefulness and effectiveness of IGTDS in a planning process such as the Metro TRANSITion Phase IV studies. In 1978, UMTA awarded Bellevue technical grant and research and development grant funds to conduct the IGTDS demonstration study under Sections 9 and 6, respectively, of the Urban Mass Transportation Act of 1964, as amended. The General Motors (GM) Transportation Systems Center (TSC) of Warren, Michigan, was selected as the project consultant and began the demonstration study in June 1979.
GRAPHICS LABORATORY
A graphics laboratory was established at the Bellevue City Hall. The laboratory consisted of a work space and the computer graphics terminal equipment needed to operate IGTDS. Three pieces of equipment were obtained: a Tektronix model 4014-1 graphics display terminal, which has a 15-in-wide by 11-inh igh display screen: a Bell Systems Model 212A data communications unit, which supports communications at 120 characters/s; and a Tektronix model 4631 hard copy unit (Figure 2).
The City of Bellevue was provided with access to che 11,;·1·u::; sofcware syscem chat: GM TSC designaces as IGTDS GM TSC Release No. 1 (4). This version of IGTDS was operational on an IBM Model 3033 computer system (IBM's replacement for the System 3 70 series computer) , which uses the time sharing system (TSS) operating system. The computer facilities were located at the GM Technical Center in Warren, Michigan.
LOCAL PLANNING GROUP
A local planning group was formed to demonstrate the capability of IGTDS to local transportation planners. The group consisted of two planners from Bellevue, two from the Puget Sound Council of Governments (PSCOG), two from Metro Transit, and two from local consulting firms. Members were trained to use IGTDS to design fixed-route transit service to an activity center, and they participated in performing sensitivity analyses on the high-performance designs.
Transportation Research Record 854
Figure 2. Computer graphics terminal equipment set.
A questionnaire was distributed to obtain reactions to and assessments of IGTDS. The members of the planning group were unanimous in their ratings of IGTDS as easy to learn, easy to use, and effective in providing easy-to-interpret results. Members were also able to envision the use of IGTDS in situations in which they were involved professionally, including (a) macrolevel sketch planning and (b) microlevel policy analysis, such as parking policies, fare policies, routing options, and route productivity.
However, members also expressed generally a low level of confidence in the IGTDS predictions of ridership and costs, since the modal-choice model had not been calibrated with survey data. Other improvements that they felt would improve the usefulness of IGTDS to. problems they faced were the following:
1. Ability to consider at least two destinations simultaneously:
2. Better modal-choice model: for example, a model that includes income of travelers as a variable;
3. Better cost-estimation models: and 4. Ability to handle a larger problem.
DATA DEVELOPMENT
In order to apply IGTDS, three kinds of data are needed: transportation supply-side data (including transportation network, vehicle characteristics, and cost parameters needed to estimate transit system operating costs), travel-demand data, and travelerbehavior data.
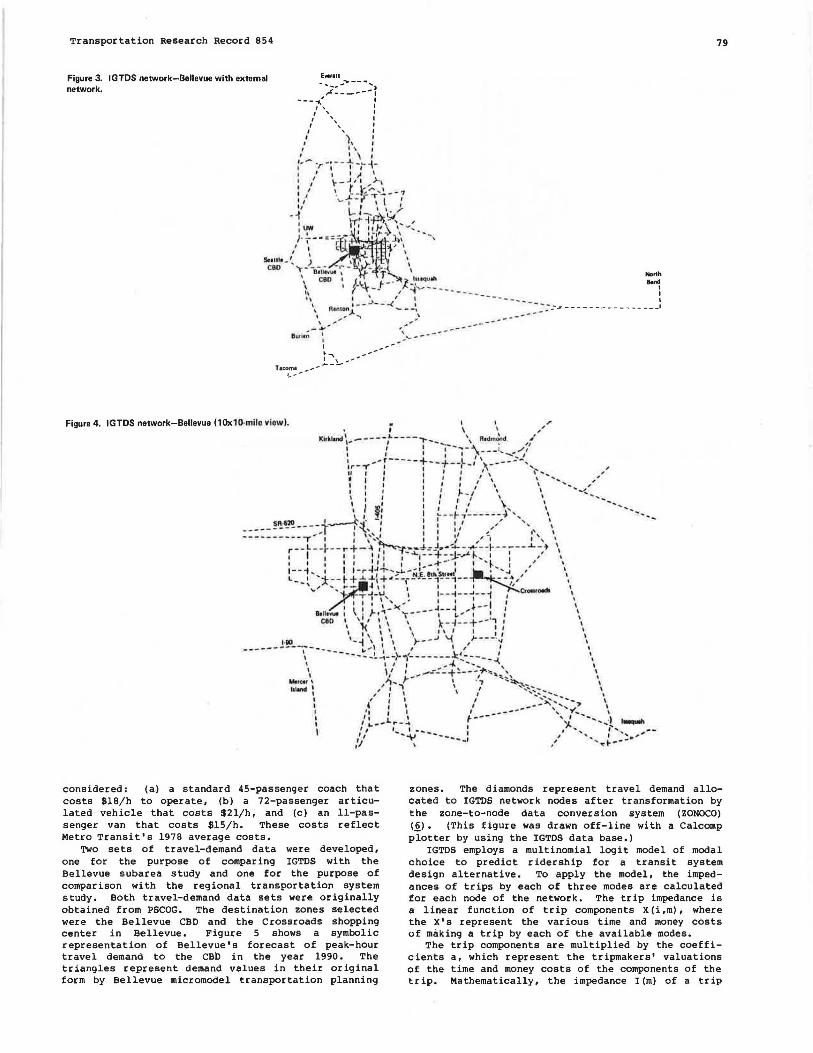
The transportation supply-side data included several elements. A network structure that represents the street system within Bellevue was obtained from the PSCOG network developed for the regional transportation plan update. Link travel times for driving were obtained from this network, and travel times for the transit mode were obtained from PSCOG's transit network. For the portion of the region outside of Bellevue, the network structure of the Bellevue microzone forecasting model was used. The network data base was digitized by using a network editor (5) and digitizing tablet. A plot of the digitized network is shown in Figure 3. A close-up, lOxlO-mile view of Bellevue is shown in Figure 4. (Both figures were produced by IGTDS with annotations added manually.)
Operating cost data were taken from the Bellevue subarea study. Three categories of vehicles were
Transportation Research Record 854
Figure 3. IGTDS network-Bellevue with external network.
Ewr11t
.. :;::~_:-::;: -- -..,._' I
I' I , ' ' ,' '\ :
I ' t
,' ), : t f ' I
I I \ I
:,- ·r -~- - t-;- ,_ J I I I ,i I
: ,' \---''I ,>-t I / '· C~:;.-.!.--7 ' ' '""f- ,. ' I ' l 1 1.-' I I}
-1 J:rA~, _ , :uw t '1 i • f'~' .........
tt···~·ru~"· ·.- .. -1~\ ·-, ' ' I \ SHll11 I I '
CBD • ' "T _) __ • .,. -1 '»"- .-~ \
aa11t1Nt , T ', COD t t • • ;r_!:"'IUllll
\ I ~-'..~ .f 1- ..... .,_,., • • '\ r ! -,- ... - - - -
Nonh -I I '\ : __ :, ___ / ~ "' - -- I
, R1.nton;. - --,
\ ,,.""' ..... .,,.., .. ' -~
8U.1l1~ I I I . "' .,,,,.---
--
:::~------ ··-- -------· --------·· ----- .,. ...
T1<0m1 .!__~ ..
._ ......
Figure 4. IGTDS network-Bellevue (10x10.mile view}. • I , . ' \ ,' Klfla.l1nd\ ... -----j---- -,..- .... __ \ Rtdm~d ,f'
: : : ---;----; .. __,:/ \,-~-- r -----+--+--~-· \------- , u ' • I I I / \ \ ....... , : ~ : : : : / \ \ ............ , ' I I f I I J..-1 \ \ .. ~ \ I I I 1
1 I I \\. \ ........
'- ' tin; I I r ,' ' \ .............. l I !f, I ~--~ .. -------} ' \ --
SR-620 t~~ ' -, I I I ' ' \ -------------, i .::( ... ,I : : !1 , 11' "",, \ --- ... ------,..4' I : '~,,I I I ~I ,-'l I', '
r·-L·+· ·r+- -1 ~;:-,.,i..,.}.•-<>- -..,...-+----- .1.. - ~ \ I I I,,··: ,-..,·-=+- ·.:1--...... ~-·: ,'I I I t I t I It I I _ _,..- I I .,.~ I / \ 1---1 I I f-,-4-1.,.. _ _,__ .. ,. ' I N--.. ' \ l_ ....... ''j: --t- +J...-L.,+1 ::_,~:.f.:. ~'i~'~-- --~ ,' \
'-•' >fr' ~- ~ \ t I t I I I " Cro..oedl ' T-j·U, I f- --1··-'••-j I \
I I : I \:Ji(,~ -~--~ ... ~ -- { : \ .. ~~;;" \ \~,>-;·\ ".--- k--t---+--~, : \
MIO \_~ \ \ \ \ .... J \.{ ,~-- -U \ -·---------~-.......... i,..'' ~ \ I I ' I '
I ··----.• ...... •>- "'{·•····-.Ii:~--- .... I I ~ I I I .. ""' ... ....... ...(.., \
\ \/ ' ....... ..... --:-.+~---,1"~~~~ '\ \ ,.,ot,, ,.. ... r , . ., ... ~ , l11And ~ ,'' : ; \ ,' ~~~:-........ \
~ { : •, ,' ----=~::~ ... > \ I ' 1 I I I .,. ...... - - , Y...... \ t ,'~_ .. .t. ,._! t--- '~ .......... ~:l ........ I ,',' • ...... ~- ... - ................. ; ,' ...... ' : ... ,.,_,, .. --
,'J / ... "' ..... - -
79
considered: (a) a standard 45-passenger coach that costs $18/h to operate, (bl a 72-passenger articulated vehicle that costs $21/h, and (cl an 11-passenger van that costs $15/h. These costs reflect Metro Transit's 1978 average costs.
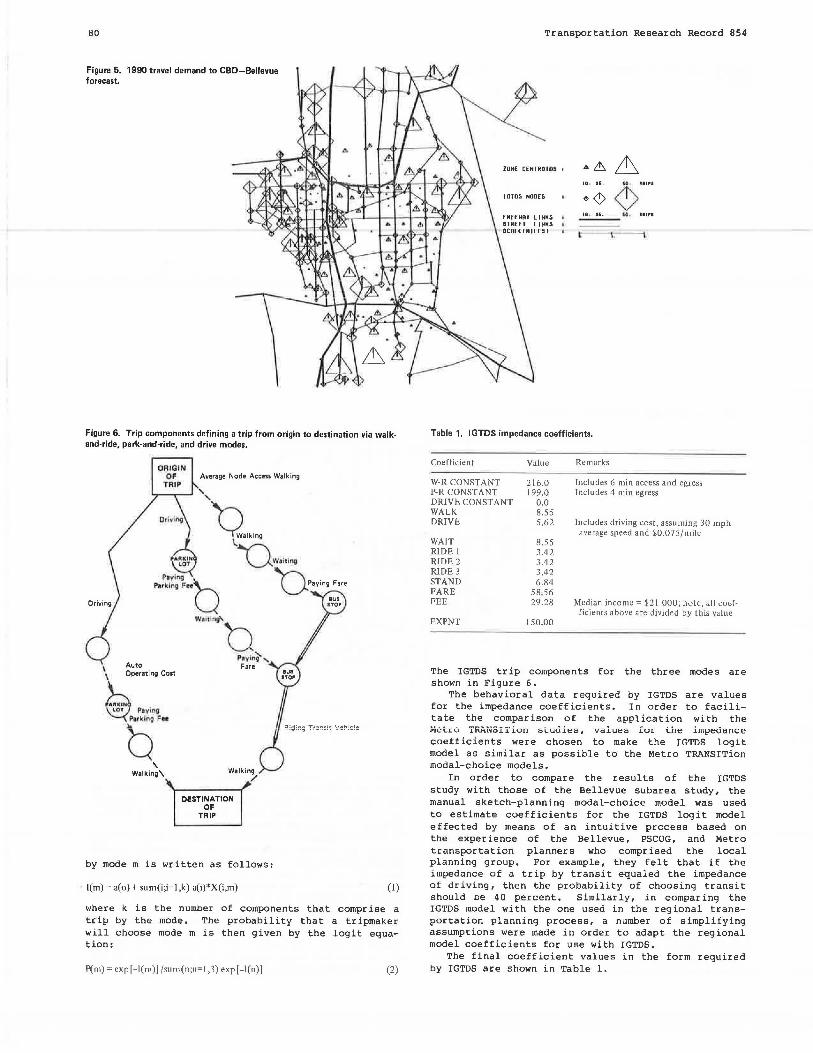
zones. The diamonds represent travel demand allocated to IGTDS network nodes after transformation by the zone-to-node data conversion system (ZONOCO) (§.l • (This figure was drawn off-line with a Calcomp plotter by using the IGTDS data base,)
TWO sets of travel-demand data were developed, one for the purpose of comparing IGTDS with the Bellevue subarea study and one for the purpose of comparison with the regional transportation system study. Both travel-demand data sets were originally obtained from PSCOG. The destination zones selected were the Bellevue CBD and the Crossroads shopping center in Bellevue. Figure 5 shows a symbolic representation of Bellevue' s forecast of peak-hour travel demand to the CBb in the year 1990. The triangles represent demand values in their original form by Bellevue micromodel transportation planning
IGTDS employs a multinomial legit model of modal choice to predict ridership for a transit system design alternative. To apply the model, the impedances of trips by each of three modes are calculated for each node of the network. The trip impedance is a linear function of trip components X (i ,m), where the X's represent the various time and money costs of making a trip by each of the available modes.
The trip components are multiplied by the coeff ic ients a, which represent the tripmakers' valuations of the time and money costs of the components of the trip. Mathematically, the impedance I (m) of a trip
80
Figure 5. 1990 travel demand to CBD-Bellevue forecast.
Figure 6. Trip components defining a trip from origin to destination via walk· and·ride, park-and-ride, and drive modes.
ORIGIN OF Average Node Access Walking
TRIP
' '
~alk1ng l
Dw·••lng b•v1ng Fare
aus STOP
Walking /
DESTINATION OF
TRIP
by mode m is written as follows:
l(m) = a(o) + sum(i;i=l,k) a(i)*X(i,m) (!)
where k is the number of components that comprise a trip by the mode. The probability that a tripmaker will choose mode m is then given by the legit equation:
P(m) = exp[-J(m)] /sum(n;n=l,3) exp[-l(n)] (2)
Transportation Research Record 854
lDHE CENJROIOS I .. L!::, ~ 1a . H. ... lllrl
HHOS HODES "~ ~ 111 . 11. ... llllrl
Table 1. IGTDS impedance coefficients.
Coefficient Value Remarks
W-R CONSTANT 216.0 IncJudes 6 min access and egress P-R CONSTANT 199.0 Includes 4 min eg1 ess DRIVE CONSTANT 0.0 WALK 8.55 DRIVE 5.62 Includes driving cost, assuming 30 mph
avernge speed and $0.075/mile WAIT 8.55 RIDE l 3.42 RIDE 2 3.42 RIDE 3 3.42 STAND 6.84 FARE 58.56 FEE 29.28 Median income= $21 000; note, all coef-
ficients above are divided by this value EXPNT 150.00
The IGTDS trip components for the three modes are shown in Figure 6.
The behavioral data required by IGTDS are values for the impedance coefficients. In order to facilitate the comparison of the application with the Metro TRANSIT ion studies, values for the impedance coefficients were chosen to make the IGTDS logit model as similar as possible to the Metro TRANSITion modal-choice models.
In order to compare the results of the IGTDS study with those of the Bellevue subarea study, the manual sketch-planning modal-choice model was used to estimate coefficients for the IGTDS logit model effected by means of an intuitive process based on the experience of the Bellevue, PSCOG, and Metro transportation planners who comprised the local planning group. For example, they felt that if the impedance of a trip by transit equaled the impedance of driving, then the probability of choosing transit should be 4 0 percent. Similarly, in comparing the IGTDS model with the one used in the regional transportation planning process, a number of simplifying assumptions were made in order to adapt the regional model coefficients for use with IGTDS.
The final coefficient values in the form required by IGTDS are shown in Table 1.

Transportation Research Record 854
Table 2. Comparative performance of alternatives.
Alternative
Do-Nothing with Park-
Objective Goal Do-Nothing and-Ride
Transit riders (morning Maximum 167 490 peak hour)
Revenue/cost (%) > 60.0 22.0 30.5 Within 5-min walk of a > 47 25 35 stop(%)
Within 5-miq drive of a > 52 60 park-and-ride lot(%)
No. of stops less than 15 0 6 min avg access
No. of park-and-ride lots 0 0 0 less than I 0 min avg access
Figure 7. Transit routes serving Bellevue CBD during morning peak hour in 1980.
.. ...
TRANSIT SYSTEM ALTERNATIVES
To compare IGTDS with the manual sketch-planning method of the Bellevue subarea study, a series of case studies was designed to correspond to the five alternatives evaluated by the subarea study. Each case study illustrated the application of IGTDS to a particular service concept. The case studies were as follows:
1. Do-nothing alternative (maintain the existing transit service to the Bellevue CBD),
2. Do-nothing alternative with park-and-ride, J. 1990 regional transit plan (includes high-oc
cupancy-vehicle lanes on the Interstate freeway that serves Bellevue and on certain arterials, and assumes automobile travel times would double in selected arterial corridors, but transit travel times would remain at their 1980 levels),
81
1990 System 1990 System Plan wit;, Park- CBD Transit Plan
290
57 .8 45
0
and-P.i<le Circulator Mall Crossroads
850 783 337 65
45 . I 53 .6 60 .0 15.3 45 49 47 40
40 18
0 0 0
0
4. 1990 regional transit plan with park-and-ride, 5, CBD circulator (the 1990 regional transit plan
with a parking lot on the fringe of the CBD; distribution of travelers from the parking lot to be provided by a CBD circulator service) ,
6. CBD transit mall (a new transit-only access ramp would join the mall and the freeway), and
7. Service to the Crossroads shopping center.
HIGH-PERFORMANCE DESIGN OBJECTIVES
A high-performance transit system was designed for each of the above alternatives (except the do-nothing alternative) by using IGTDS. The following design objectives were established as the criteria for measuring achievement of the high-performance design concept:
1. Maximize transit ridership, 2. Maximize the ratio of transit system revenue
to operating cost (the total revenue should be greater than 60 percent of the total operating cost) ,
3. Maximize accessibility to the transit system (for trips that originate within Bellevue, 90 percent of demand should be within a 5-min walk of a transit stop and 100 percent of demand should be within a 5-min drive of a park-and-ride lot), and
4. Minimize average access time at each stop (for service within Bellevue, average walk access time should be less than 15 min and average drive access time should be less than 10 min).
Table 2 compares the performance of each of the alternatives developed with IGTDS in relation to the performance objectives.
DESCRIPTION OF SELECTED DESIGN ALTERNATIVES
Do-Nothing Al t ernative
The objective for the do-nothing alternative was to replicate as closely as possible with IGTDS the transit system as planned for 1980. Figure 7 is a map of Bellevue that shows transit routes that provide service to the CBD during the morning peak hour.
The transit route network that was designed to model the do-nothing alternative and the performance summary report that IGTDS produced are shown in Figure 8. Parameters that were input to IGTDS were free parking at the destination and a 1-min destination walk time for the drive mode. Fares were set at $0. 30 for all routes except numbers 8 and 9, which had a zone fare of $0.50 for trips from Seattle, which corresponded to Metro Transit's fare

82
Figure 8. Transit route network and IGTDS performance summary--donothing alternative.
I I
1--
I I
I
1/ , , II
--.f I I I I
I
I I
I I
I
I •
' ' ' I \----
r -·..---=-=--• I ,•
I I I . ' I ' )
;
I • I I I • ' 11 \\ II
I I I
' ' I I '
••
\
a•
structure in 1978. Standard 40-ft coaches (vehicle type l) were assigned on all routes. The alternative required a totai of 14 vehicles (to provide 28 peak-period hours of service daily) at a cost of $504. IGTDS predicted a ridership of 167, or 4 percent of the total demand, which yielded revenues of $111/day. (Figures 8 and 9 are graphic output displays produced by IGTDS1 some annotations were added manually.)
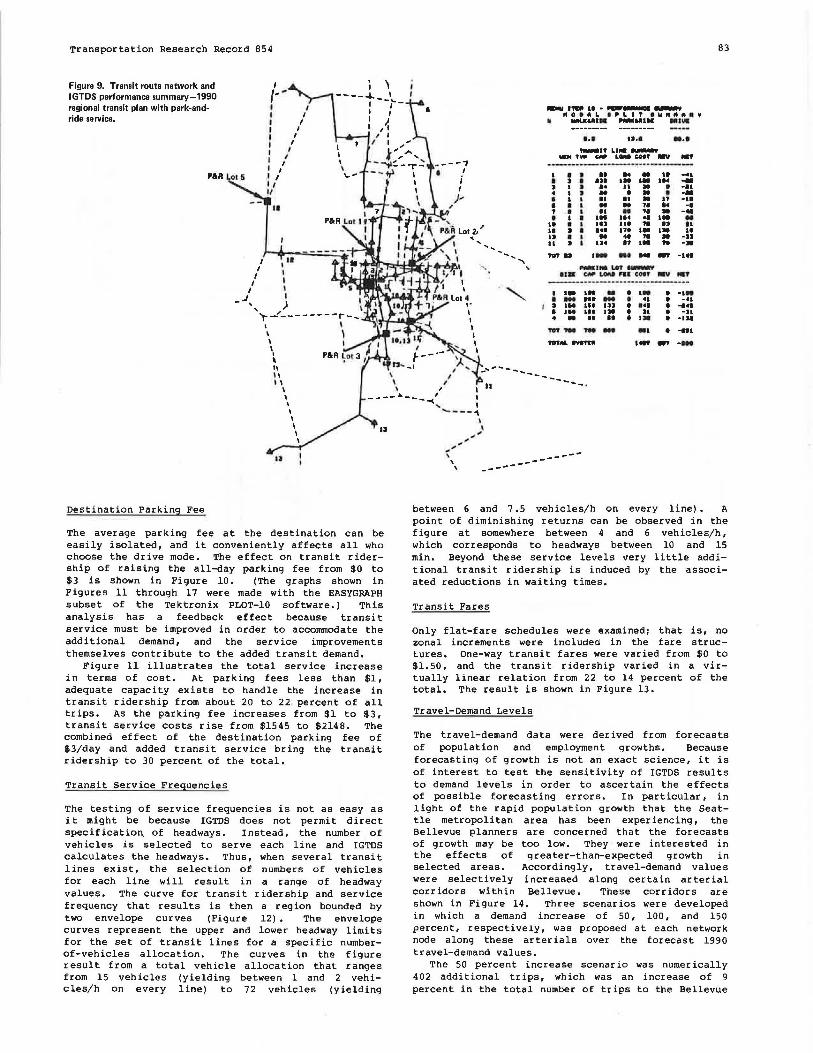
1990 Regional Transit Plan with Park-and-Ride Service
The 1990 regional plan with park-and-ride service used the same transit route network as the 1990 system plan alternative, but it added five parkand-ride lots at the locations shown in Figure 9. Because of the additional vehicles and demand attracted by the park-and-ride service, vehicles with greater capacity were needed on routes that served the park-and-ride lots. The performance summary nisplay for this alternative is also shown in Figure 9. The design required 23 vehicles at a daily cost of $846, plus $700 as the cost of providing 700 parking spaces. The system attracted 850 riders and had a revenue/cost ratio of 45.l percent. This design was selected as the high-performance design because it very nearly achieves the goal of 20 percent transit ridership in 1990 that Bellevue' s CBD Action Committee has established. This goal appears to be achievable, according to this IGTDS result, even if parking remains free in the CBD, provided that convenient park-and-ride service be established and that relatively low fares be charged. A charge for parking in the CBD would result in greater transit ridership as well as allowing for higher transit fares, which would permit a larger fraction of transit operating cost to be recovered.
SENSITIVITY ANALYSIS
Because IGTDS was designed to permit interactive
--"'\
'
-----
Transportation Research Record 854
Line •·• •·• •·•
Number - ~J: L~:.-:;""..., ..., "\--------------
---
' • a ••• •• ,. •• _,, e I I .. I' M le -M 411 .. ,. ·--··· ., ....... _... '? I I ti II fll II -el • l • •• • • •• --•• t ... .,. ·- •• -1e I I 41 81 ,. II -9?
""14 114 111' - Ill --
"" . . . ------
------
• • • - Ill --
input of data and to allow inunediate prediction of the effects of changes in input parameters, it can be applied easily to the task of sensitivity analyses. That is, an analyst can vary a parameter over some range of values and obtain ridership, cost, and revenue results within a span of a few minutes. To illustrate the IGTDS capability for sensitivity testing of variables that have policy implications, the planning group selected six analyses to perform. The city's interest in the particular variables chosen were derived from its need for policy guidance to achieve objectives set forth in the Bellevue CBD Action Plan.
The six variables selected for testing were the following:
l. Destination parking fee, 2. Transit service frequencies, 3. Transit fares, 4. Transit route and stop locations, 5. Travel-demand levels, and 6. Legit model coefficients.
The reference design used in all of these tests was the 1990 system plan alternative with park-andride service. Ideally, one variable would be identified and varied while all other variables were held constant in order to isolate the effects of the selected variable. In practice this is not always possible. For example, a policy that increases transit ridership must very quickly deal with capacity limits in the transit system. If capacity is increased in order to serve the added demand, then service improvements also generate additional ridership, i.e., a multiplier effect; ridership is increased beyond the effects of the original policy variable. Other variables, such as route locations, are not easily isolated as a single variable, which causes the sensitivity analysis to be performed in a more qualitative, descriptive manner than a quantitative, trade-off curve fashion.
Transportation Research Record 854
Figure 9. Transit route network and IGTDS performance summary-1990 regional transit plan with park-andride service.
PloR Lo16
I I
I I
I
I
1--1 I I I I I I I I I I I
I ,' I I I I I I I I ,,
I I I I
II
I
' h II ,,
i \ -----1.. __ ,.._ I I I I
' \ \.-
: /~ I I
I I
I
'). I '
I
' --
' ---
83
-•-&•----"0 I A L I~ L I T t U"" A•¥ • -.. ..... Nm .. IH .. .... ••• 11.1 •••
,_ITLI .. ~ ........ -L- COIT .... ..,. ···-----------·---·---·---
l • • .. .. -•• ... . I I I IH •• ... ... .... J I • •• II - • .... • I I •• • • I .... I I I .. .. • .. -·· I • I .. .. .. .. -· ' . I l .. .. .. • . .. • l I ... ll• •• t• ..
•• • I llJ Ill .. ., .. II J I ••• n• . .. •• .. IJ • I .. •• .. • -n II J I ... 11 ... .. -· TllTU ·- --.. .... -· .. '""'-... ""'~-n• coer .... ... ----·--·-·-········-------
I ... ... -• ... • . ... I - "' -• •• • -·· I J ... ... UJ • ••• • ..... I ... ... •• • JI • -JI • .. .. II • •• • -111 -- ... - ... • ..... __ _,_,, l- .. --
----.... -. I \ \
\ I II ____ ... ___ -<1
' I \ ""----1 I I
I I I
II I
~,""' ,,, II
Destination Parking Fee
The average parking fee at the destination can be easily isolated, and it conveniently affects all who choose the drive mode. The effect on transit ridership of raising the all-day parking fee from $0 to $3 is shown in Figure 10. (The graphs shown in Figures 11 through 17 were made with the EASYGRAPH subset of the Tektronix PLOT-10 software.) This analysis has a feedback effect because transit service must be improved in order to accommodate the additional demand, and the service improvements themselves contribute to the added transit demand.
Figure 11 illustrates the total service increase in terms of cost. At parking fees less than $1, adequate capacity exists to handle the increase in transit ridership from about 20 to 22 percent of all trips. As the parking fee increases from $1 to $3, transit service costs rise from $1545 to $2148. The combined effect of the destination parking fee of $3/day and added transit service bring the transit ridership to 30 percent of the total.
Transit Service Frequencies
The testing of service frequencies is not as easy as it might be because IGTDS does not permit direct specification, of headways. Instead, the number of vehicles is selected to serve each line and IGTDS calculates the headways. Thus, when several transit lines exist, the selection of numbers of vehicles for each line will result in a range of headway values. The curve for transit ridership and service frequency that results is then a region bounded by two envelope curves (Figure 12). The envelope curves represent the upper and lower headway limits for the set of transit lines for a specific numberof-vehicles allocation. The curves in the figure result from a total vehicle allocation that ranges from 15 vehicles (yielding between 1 and 2 vehicles/h on every line) to 72 vehicles (yielding
\ \
\
------------between 6 and 7 .5 vehicles/h on every line). A point of diminishing returns can be observed in the figure at somewhere between 4 and 6 vehicles/h, which corresponds to headways between 10 and 15 min. Beyond these service levels very little additional transit ridership is induced by the associated reductions in waiting times.
Transit Fares
Only flat-fare schedules were examined; that is, no zonal increments were included in the fare structures. One-way transit fares were varied from $0 to $1.50, and the transit ridership varied in a virtually linear relation from 22 to 14 percent of the total. The result is shown in Figure 13.
Travel-Demand Levels
The travel-demand data were derived from forecasts of population and employment growths. Because forecasting of growth is not an exact science, it is of interest to test the sensitivity of IGTDS results to demand levels in order to ascertain the effects of possible forecasting errors. In particular, in light of the rapid population growth that the Seattle metropolitan area has been experiencing, the Bellevue planners are concerned that the forecasts of growth may be too low. They were interested in the effects of greater-than-expected growth in selected areas. Accordingly, travel-demand values were selectively increased along certain arterial corridors within Bellevue. These corridors are shown in Figure 14. Three scenarios were developed in which a demand increase of 50, 100, and 150 percent, respectively, was proposed at each network node along these arterials over the forecast 1990 travel-demand values.
The 50 percent increase scenario was numerically 402 additional trips, which was an increase of 9 percent in the total number of trips to the Bellevue

84
Figure 10. Transit modal split as a function of destination parking fee.
1,JOO
28
1.200
26
1.100
'·""°
o 0.5 1.5 2 2.5 3
DESTINATION PARKING FEE /Dalla,.)
Figure 11. Operating cost and revenue versus destination parking fee.
2.000
1,600
-11-•··Clc .. 1
. ···•· .... ···••··
. ··
• ···············
.. ··· 1,600 . .................... ...... ..
~ ~ 1,fOO
8 1,200
1,000
BOO
o 0.$ 1.5 2 2.5
DESTINATION PARKING FEE (doll•ri)
Figure 12. Transit modal split as function of service frequency .
.... JO -" ~~ .. ,., :!~ ~t ,.
16
" o 2 , 4 6 6
•USES PER HOUR
3
1100
BOO
100
600
8
t! ...... O!;! cto: ...... I~ ~ .. ~
~~ o:it ~!:: ~~ "'~
Transportation Research Record 854
Figure 13. Transit modal split as function of transit fare.
22
1150 21
1" "1Q
..... -" 111 850
800
~;!
"'"' ~~ 18 Oct =-~
11 150
16 100
15 650
o 0.2 0.4 0.6 0.8 1.2 1.4
TR~ltStr f:ARE (tiouanJ
Figure 14. Selected arterial corridors with increased travel demand.
' ' ' ' ' \
, .. ~' ...
........... ..
t! ~~ ~~ .. ... ~~ "'" ~
··-
Figure 15. Increase in transit ridership and cost over 1990 forecast level for selected increases in demand.
i INCREASE DUE TO ADDITIONAL TRANSIT CAPACrr_ RIDERSHIP INCREASE COST INCREASE
50
-
I
100
PERCENT INCREASE IN DEi/AND
T 150

Transportation Research Record 854
Figure 16. Transit modal split as a function of logit·model coefficients.
1•
Ill
10
• II
0
0
• •
-••+l.10.C•O.OIZ• •·O••+I. 10.C-O.IUSI
• • 10
OVT-OF-llEHICLE TllAVEL nME (-
0.11 1.4
TllANSIT FA/IE (-
CBD. The 100 percent increase scenario was 78i actual trips, which was a 17 percent increase in total trips. (The 100 percent increase level is less than twice the 50 percent increase level due to rounding upwards of half trips in order to express all demand values as whole numbers.) The 150 percent increase scenario was 1183 actual trips, which was 26 percent of the forecast number of trips for 1990. The incremental transit ridership and cost results are shown in Figure 15.
In each demand-increase scenario, transit capacity limits were reached. In order to isolate the effects of the demand-increase effects as much as possible from the effects of adding transit capacity, the following procedure was used. After changing the demand, the modal-choice model was exercised to obtain an initial ridership prediction by using the transit service design with no changes from the previous case. The results were then examined to determine where capacity limitations had developed. Park-and-ride lots were increased in size where needed, and larger-capacity vehicles were added to transit lines that had reached capacity. The modalchoice model was then exercised again to determine the new ridership levels. For example, in the 50 percent increase scenario, ridership increased by 52 over the base case with no capacity increase. After increasing the size of one park-and-ride lot and changing from van service to standard coach service on one transit line at an incremental cost of $32, ridership increased by another 4 7. Figure 15 thus shows a total transit increase of 99 riders and a cost increase of $32 for the 50 percent increase scenario.
In all cases, the needed increases in capacity were obtained by changing to higher-capacity vehicles with no increase in service frequency. It is possible that the higher demand levels would support increased frequencies in a cost-effective manner. This latter situation is more complex to analyze, since IGTDS uses the service frequency in its modalchoice calculation. Increasing frequencies decreases waiting times, and IGTDS will predict increased modal splits as a result. Thus, potentially even greater ridership (at greater cost) increases could be obtained than are shown in Figure 15, but
85
the multivariate type of analysis is beyond the scope of the simple sensitivity analysis that this exercise was intended to illustrate.
Legit Model Coefficients
Testing of sensitivity to values of the legit model coefficients was performed in conjunction with the development of their values, as explained in the data development section. Results of the sensitivity tests aided in the decision about values to be used for design development and other sensitivity studies. Illustrated in Figure 16 is the effect on transit modal split (walk-and-ride plus park-andr ide) of increasing transit impedance (equivalent axes are drawn to show how this increase could come from fare, in-vehicle time, or out-of-vehicle time) for two different levels of the impedance conversion coefficient c. The value B = 1.10 in the figure is the modal constant value that yields a modal split of 40 percent when all three modes have equal impedances.
EVALUATION
IGTDS demonstration study successfully achieved its primary objectives. Planners can greatly increase their productivity in designing and evaluating alternative transit systems by using this interactive graphic sketch-planning technique. comparison of the IGTDS demonstration study with the Bellevue manual sketch-planning subarea study revealed that approximately one-half as much effort was required for the IGTDS method as for manual sketch planning.
The IGTDS evaluated approximately 300 transit service designs, each of which cost about $1 of computer expense and required an average of 5-7 min of elapsed time on the computer terminal. Preparing the initial data base (the network and travel demand) required approximately $1000 of computer expense and 8 person-weeks of effort. On the basis of the number of design alternatives considered per unit of design cost, using IGTDS to design transportation services for Bellevue showed an increase in design productivity over the manual method by a factor of 60 to 1.
The transit system designs produced by IGTDS were presented in graphical form at a high level of detail. We believe that the results obtained by using IGTDS were much more easily understood because of both the graphic presentation and rapid feedback of answers through interactive computing.
Predictions of transit ridership and cost by the two studies were comparable. The IGTDS results depended importantly on whether or not park-and-ride service was included. However, we believe that this reflects the design of the modal-choice model rather than the inherent nature of park-and-ride service. The two studies obtained very different vehicle requirement results due to quite different procedures for estimating vehicle requirements.
The comparison of IGTDS with the regional systems planning process was more difficult because of the great difference in the scope of the two projects. In terms of effort and cost involved, the Metro TRANSITion Phase IV planning effort was more than an order of magnitude greater. It was also difficult to compare forecasts of transit ridership because of the significantly different scales of analysis: The regional systems planning study was conducted with large zones and the IGTDS study performed a more detailed evaluation down to the level of individual transit lines and stops. At an aggregate level, however, the two models were found to predict very similar levels of total transit ridership to the Bellevue CBD.

86
The regional macrocomputer model was not designed for use in a small subarea of a metropolitan region nor does PSCOG have any plans to use the model to specifically design transportation services for Bellevue or any other suburban community. A much greater level of data preparation is required for running the macrocomputer model, as computer costs are higher and turnaround time is much greater than for IGTDS. IGTDS, on the other hand, is particularly well-suited to designing specialized transportation services for well-defined CBDs and activity centers in suburban communities like Bellevue.
The GM TSC project team and members of the local plannin'i! 'ijroup fgr the de11Km11tratign 11tYdy rlKlgmmended that UMTA encourage the use of IGTDS as a useful new technique for transportation sketch planning. Recommendations for improvements to IGTDS, which would further enhance its capabilities for transportation sketch planning, are provided in the final report on IGTDS (!Jr which is also available from the Office of Planning Methods and Support, UMTA, U.S. Department of Transportation.
ACKNOWLEDGMENT
We would like to express our appreciation to members of the GM TSC project team who conducted the IGTDS demonstration study and the transportation planners who participated as members of the local planning group in Bellevue.
In addition, several people provided input data for and information related to the study, spec if ically William E. Popp of Wm. E. Popp Associates, Bellevue, Washington, consultant; Robert Berg of Parsons, Brinckerhoff, Quade and Douglas (Seattle office); and Gary Norris, Bellevue Public Works Department. Paul C. Atallah and John R. Augustin, both of GM TSC, prepared input data transformations required for IGTDS and digitized the network data base.
Transportation Research Record 854
Members of Bellevue' s local planning group who learned to use IGTDS and participated in the application and evaluation of the IGTDS system included Martha S. Lester of the TRANSPO Group, Bellevue, Washington, transportation planner; Labh Sachdev and Jack Meijsen of PSCOG; and Bob Simpson and Steve Grissom ot Metro Transit.
REFERENCES
1. Interactive Graphic Transit Design System (IGTDS) Demonstration Study: Bellevue, Washington, Final Report, volumes 1 and 2. GM Transportation Systems Center, General Motors Technical Center, warren, MI, Rept. EP-80023A, June 1980.
2. Bellevue CBD Action Plan. City of Bellevue Planning Department, Bellevue, WA, June 1979.
3. Parsons, Brinckerhoff, Quade and Douglas. Bellevue CBD Transit Alternatives Analysis. Municipality of Metropolitan Seattle (Metro;, Seattle, wA, Dr aft Final Rept. and Technical Appendix, Metro TRANSITion Phase IV Interim Discussion Paper, Oct. 1978.
4. Interactive Graphic Transit Design System ( IGTDS) : User's Manual for GM TSC Release No. 1. GM Transportation Systems Center, General Motors Technical Center, Warren MI, Rept. EP-79133, Dec. 1979.
5. GM TSC Network Editor: user's Guide for Prototype Version. GM Transportation Systems Center, General Motors Technical center, warren, MI, Rept. EP-78144, Aug. 1978.
6. Zone to Node Data conversion System (ZONOCO): User's Manual for the IGTDS Version. GM Transportation Systems Center, General Motors Technical Center, Warren, MI, Rept. EP-80001, Jan. 1980.
Publication of this paper sponsored by Committee on Bus Transit Systems.