Embed Size (px)
Citation preview

1Florida TransiT Handbook 2015
Public TransiTin Florida
This Handbook offers a general overview of public transit in the State of Florida. The information in the following pages provides insight into transit’s contribution to
meeting the statewide transportation objectives and mission of the Florida Department of Transportation (FDOT). Additionally, the information is used in reporting statewide performance measures.
Public transit plays an important role in maintaining the livability of Florida’s growing com-munities. Transit not only helps alleviate traffic congestion and improve air quality, but also provides mobility for many of Florida’s citizens, as well as visitors and tourists to the Sunshine State. Transit also plays a critical role in meeting the mobility and accessibility needs of transit-dependent Floridians and visitors who, due to physical handicap, age, or economic disadvantage, cannot drive or own an automobile. By providing mobility and accessibility to millions of Florida’s residents and visitors, transit helps to improve the overall quality of life in Florida’s communities.
This Handbook provides a synopsis of FDOT’s transit resources, a profile of Florida’s transit systems, and a snapshot of their performance in 2014. Although there are rural and urban transit systems in Florida, the focus of this handbook is on Florida’s urban fixed-route transit systems. Information about Florida’s demand-response transit systems can be obtained from the Annual Operations Report published by Florida’s Commission for the Transportation Disadvantaged. In 2014, 30 of Florida’s 31 fixed-route transit systems (including bus, rail, and vanpool modes) and 2 other separate vanpool services provided transportation for approximately 277 million trips.
FDOT Mission
Supporting and improving public transportation in Florida is an integral part of FDOT’s mission, which is “to provide a safe transportation system that ensures the mobility of people and goods, enhances economic prosperity and preserves the quality of our environment and communities.”
For more information on FDOT and public transit in Florida, please visit the FDOT web-site: www.dot.state.fl.us, or call (850) 414-4500.

3Florida TransiT Handbook 2015
Florida TransiT HandbooK
contents
FDOT Public Transit Office .............................................................................. 4
FDOT Offices of Modal Development (OMD) ............................................ 6
Florida’s Transit Systems ..................................................................................... 8
Transit System Profiles ................................................................................... 9
Transit System Summary ...................................................................................... 41
Transit Fares ..................................................................................................47
Glossary of Terms .............................................................................................48
4 Florida department oF transportation
FDOT Public Transit Central Office n (850) 414-4500 605 Suwannee Street, Mail Station 26, Tallahassee, FL 32399-0450
FdoT Public Transit office
Transit Mission—The mission of the FDOT Transit Office is to “identify, support, advance, and manage cost-effective, efficient, and safe transportation systems and alter-natives to maximize the passenger-carrying capacity of surface transportation facilities.”
The FDOT Transit Office consists of three sections (Transit Planning; Grants Administra-tion; Transit Operations and Safety), each of which has specific areas of responsibility.
Transit PlanningThe Transit Planning unit is responsible for statewide transit planning, legislative, and policy analysis, developing and monitoring the implementation of state transit development plan-ning (TDP) rules and guidelines, performance monitoring, transit information systems, transit facilities planning, transit oriented development, technical assistance, and training. Some of the programs and activities implemented and managed by the Transit Planning unit in fulfillment of these responsibilities are:
Development of Florida’s transit strategic plan; preparation of transportation development plan (TDP) policy guidance and training; development and support of the Florida Transit Information System (FTIS), Transit Boardings Estimation and Simulation Tool (TBEST), Florida Transit Planning Network (FTPN), and FDOT’s transit grant management pro-gram, TransCIP; integration of transit in intelligent transportation systems (ITS) and travel demand modeling; sponsorship of transit planning and operations research; promotion of transit’s role in enhancing the environment and development of transit performance measures and transit capacity and quality of service measures.
Grants Administration and Commuter AssistanceThe Grants Administration and Commuter Assistance unit provides financial and technical assistance to Florida’s transit agencies and commuter assistance services. Staff also coor-dinates with and provides technical assistance to the Commission for the Transportation Disadvantaged. This unit’s responsibilities fall into eight areas: Federal Transit Adminis-tration coordination; grant management; financial management; rural transit technical assistance; urban transit technical assistance; innovative finance; commuter assistance; and legislative analysis.
5Florida TransiT Handbook 2015
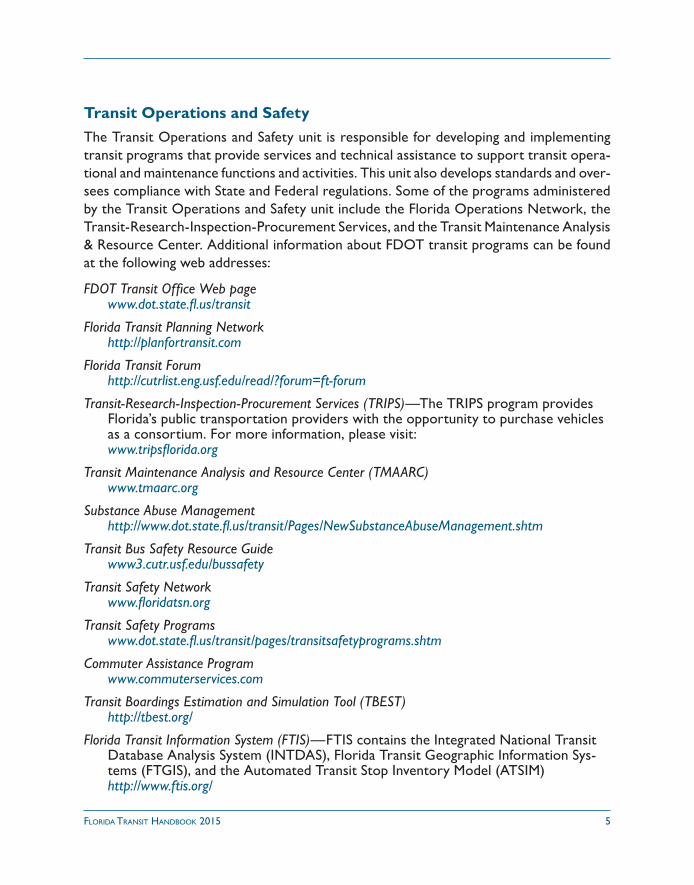
Transit Operations and SafetyThe Transit Operations and Safety unit is responsible for developing and implementing transit programs that provide services and technical assistance to support transit opera-tional and maintenance functions and activities. This unit also develops standards and over-sees compliance with State and Federal regulations. Some of the programs administered by the Transit Operations and Safety unit include the Florida Operations Network, the Transit-Research-Inspection-Procurement Services, and the Transit Maintenance Analysis & Resource Center. Additional information about FDOT transit programs can be found at the following web addresses:
FDOT Transit Office Web page www.dot.state.fl.us/transit
Florida Transit Planning Network http://planfortransit.com
Florida Transit Forum http://cutrlist.eng.usf.edu/read/?forum=ft-forum
Transit-Research-Inspection-Procurement Services (TRIPS)—The TRIPS program provides Florida’s public transportation providers with the opportunity to purchase vehicles as a consortium. For more information, please visit: www.tripsflorida.org
Transit Maintenance Analysis and Resource Center (TMAARC) www.tmaarc.org
Substance Abuse Management http://www.dot.state.fl.us/transit/Pages/NewSubstanceAbuseManagement.shtm
Transit Bus Safety Resource Guide www3.cutr.usf.edu/bussafety
Transit Safety Network www.floridatsn.org
Transit Safety Programs www.dot.state.fl.us/transit/pages/transitsafetyprograms.shtm
Commuter Assistance Program www.commuterservices.com
Transit Boardings Estimation and Simulation Tool (TBEST) http://tbest.org/
Florida Transit Information System (FTIS) —FTIS contains the Integrated National Transit Database Analysis System (INTDAS), Florida Transit Geographic Information Sys-tems (FTGIS), and the Automated Transit Stop Inventory Model (ATSIM) http://www.ftis.org/
6 F
lor
ida d
epart
men
t oF t
ra
nspo
rtatio
n
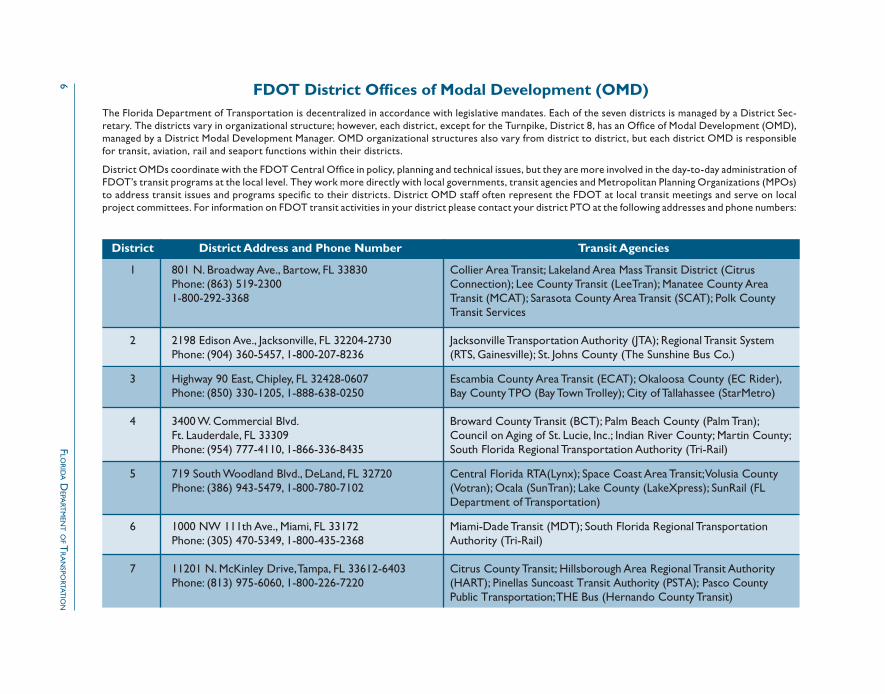
The Florida Department of Transportation is decentralized in accordance with legislative mandates. Each of the seven districts is managed by a District Sec-retary. The districts vary in organizational structure; however, each district, except for the Turnpike, District 8, has an Office of Modal Development (OMD), managed by a District Modal Development Manager. OMD organizational structures also vary from district to district, but each district OMD is responsible for transit, aviation, rail and seaport functions within their districts.
District OMDs coordinate with the FDOT Central Office in policy, planning and technical issues, but they are more involved in the day-to-day administration of FDOT’s transit programs at the local level. They work more directly with local governments, transit agencies and Metropolitan Planning Organizations (MPOs) to address transit issues and programs specific to their districts. District OMD staff often represent the FDOT at local transit meetings and serve on local project committees. For information on FDOT transit activities in your district please contact your district PTO at the following addresses and phone numbers:
District District Address and Phone Number Transit Agencies
1 801 N. Broadway Ave., Bartow, FL 33830 Collier Area Transit; Lakeland Area Mass Transit District (Citrus Phone: (863) 519-2300 Connection); Lee County Transit (LeeTran); Manatee County Area 1-800-292-3368 Transit (MCAT); Sarasota County Area Transit (SCAT); Polk County Transit Services 2 2198 Edison Ave., Jacksonville, FL 32204-2730 Jacksonville Transportation Authority (JTA); Regional Transit System Phone: (904) 360-5457, 1-800-207-8236 (RTS, Gainesville); St. Johns County (The Sunshine Bus Co.)
3 Highway 90 East, Chipley, FL 32428-0607 Escambia County Area Transit (ECAT); Okaloosa County (EC Rider), Phone: (850) 330-1205, 1-888-638-0250 Bay County TPO (Bay Town Trolley); City of Tallahassee (StarMetro) 4 3400 W. Commercial Blvd. Broward County Transit (BCT); Palm Beach County (Palm Tran); Ft. Lauderdale, FL 33309 Council on Aging of St. Lucie, Inc.; Indian River County; Martin County; Phone: (954) 777-4110, 1-866-336-8435 South Florida Regional Transportation Authority (Tri-Rail)
5 719 South Woodland Blvd., DeLand, FL 32720 Central Florida RTA(Lynx); Space Coast Area Transit; Volusia County Phone: (386) 943-5479, 1-800-780-7102 (Votran); Ocala (SunTran); Lake County (LakeXpress); SunRail (FL Department of Transportation)
6 1000 NW 111th Ave., Miami, FL 33172 Miami-Dade Transit (MDT); South Florida Regional Transportation Phone: (305) 470-5349, 1-800-435-2368 Authority (Tri-Rail) 7 11201 N. McKinley Drive, Tampa, FL 33612-6403 Citrus County Transit; Hillsborough Area Regional Transit Authority Phone: (813) 975-6060, 1-800-226-7220 (HART); Pinellas Suncoast Transit Authority (PSTA); Pasco County Public Transportation; THE Bus (Hernando County Transit)
FDOT District Offices of Modal Development (OMD)

7F
lor
ida T
ra
nsiT H
an
dbo
ok 2015
Florida Urban Fixed-Route Systems
Gadsden
SunRail
Citrus
Bay Bay Town TrolleyBrevard Space Coast Area TransitBroward Broward County TransitCitrus Citrus County Transit*Collier Collier Area TransitEscambia Escambia County Area TransitGainesville Gainesville Regional Transit SystemHernando The BusHillsborough Hillsborough Area Regional TransitIndian River GoLine TransitJacksonville Jacksonville Transportation AuthorityLake Lake Cty Public Transportation/Lake XpressLakeland Lakeland Area Mass Transit DistrictLee Lee County TransitManatee Manatee County Area TransitMartin Martin CountyMiami Miami-Dade TransitOcala/Marion SunTranOkaloosa Okaloosa Emerald Coast RiderOrlando LYNX Palm Beach Palm Beach County Transportation AgencyPasco Pasco County Public TransportationPinellas Pinellas Suncoast Transit AuthorityPolk Polk County Transit Services DivisionSarasota Sarasota County Area TransitSt. Johns Sunshine Bus CompanySt. Lucie St. Lucie Council on Aging, Inc.SunRail Florida Department of TransportationTallahassee StarMetroTri-Rail S. FL Regional Transportation AuthorityVolusia Votran
greater than 200 peak vehicles
50-200 peak vehicles
10-49 peak vehicles
1-9 peak vehicles
* Citrus County Transit is an urban fixed-route system that will begin reporting NTD data in 2015/2016.
8 Florida department oF transportation
Florida’s Transit systems
In 2014, there were 30 urban fixed-route systems operating in Florida that reported to the National Transit Database (NTD). Five of these systems operate some form of fixed-guideway mode. SunRail began operating commuter rail service in 2014 and
connects Orange and Volusia Counties through Downtown Orlando. The South Florida Regional Transportation Authority provides regional rail service (Tri-Rail) between Palm Beach, Broward, and Miami-Dade Counties. Miami-Dade Transit operates a heavy rail system (Metrorail) and an automated guideway system (Metromover). Jacksonville Trans-portation Authority operates an automated guideway system (Skyway Express). Hillsbor-ough Area Regional Transit Authority operates a light rail (TECO Line Streetcar) system.
There are two additional fixed-route transit systems in Florida that did not report NTD data in 2014. The first is Key West Transit, which is not classified as an urban system and therefore does not report to NTD. The second is Citrus County Transit, which will begin reporting NTD data in 2015/2016.
During 2014, Florida’s transit agencies ranged in size from the four-vehicle system in Hernando County to the 1,032-vehicle system operating in Miami-Dade County. The systems included in this edition of the Handbook represent only those that reported to the National Transit Database in 2014. The map on the previous page shows the location and size of the transit agencies included in this edition of the Handbook, and the following pages contain brief profiles of each of the agencies. Each profile provides contact information and summarizes NTD information. System total data (for bus, rail, and vanpool modes) are shown except where noted. The first profile represents Florida’s urban fixed-route total information. Fol-lowing the profiles are data summarizing trends from 2013 to 2014 for each system. After the summary tables is a page summarizing all of the system’s fare structures as of August 2015. More information on public transit in Florida can be found at the following website: www.dot.state.fl.us/transit.
Charlotte County Transit Division and the Tampa Bay Area Regional Transportation Au-thority (TBARTA) are required to report vanpool information to NTD; however, neither agency operates a fixed-route system. Please note that Charlotte’s and TBARTA’s vanpool numbers are included in the Florida totals on page 9, where applicable.
9Florida TransiT Handbook 2015
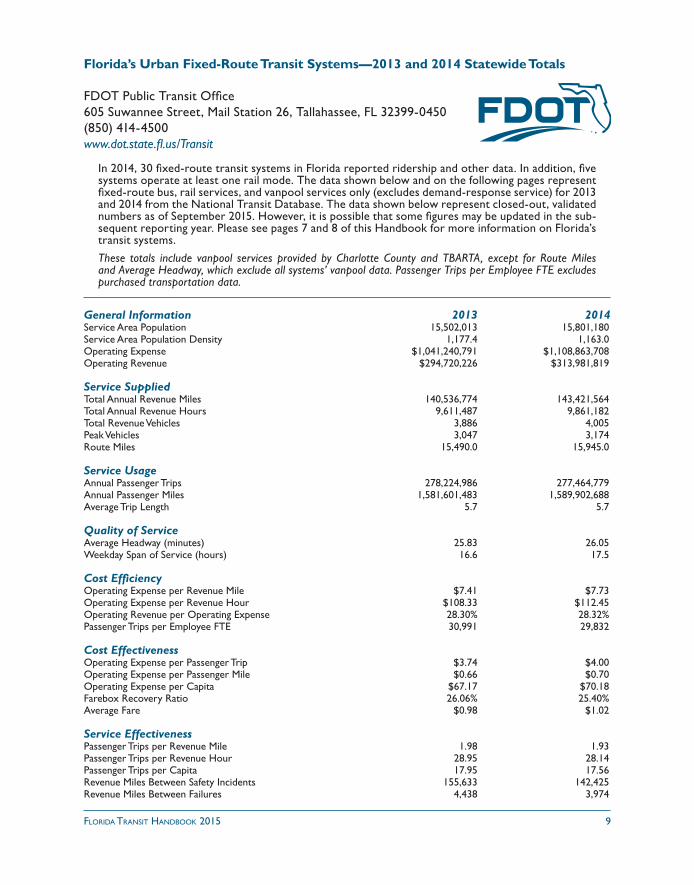
Florida’s Urban Fixed-Route Transit Systems—2013 and 2014 Statewide Totals
FDOT Public Transit Office605 Suwannee Street, Mail Station 26, Tallahassee, FL 32399-0450(850) 414-4500www.dot.state.fl.us/Transit
In 2014, 30 fixed-route transit systems in Florida reported ridership and other data. In addition, five systems operate at least one rail mode. The data shown below and on the following pages represent fixed-route bus, rail services, and vanpool services only (excludes demand-response service) for 2013 and 2014 from the National Transit Database. The data shown below represent closed-out, validated numbers as of September 2015. However, it is possible that some figures may be updated in the sub-sequent reporting year. Please see pages 7 and 8 of this Handbook for more information on Florida’s transit systems. These totals include vanpool services provided by Charlotte County and TBARTA, except for Route Miles and Average Headway, which exclude all systems’ vanpool data. Passenger Trips per Employee FTE excludes purchased transportation data.
General Information 2013 2014Service Area Population 15,502,013 15,801,180Service Area Population Density 1,177.4 1,163.0Operating Expense $1,041,240,791 $1,108,863,708Operating Revenue $294,720,226 $313,981,819 Service Supplied Total Annual Revenue Miles 140,536,774 143,421,564Total Annual Revenue Hours 9,611,487 9,861,182Total Revenue Vehicles 3,886 4,005Peak Vehicles 3,047 3,174Route Miles 15,490.0 15,945.0 Service Usage Annual Passenger Trips 278,224,986 277,464,779Annual Passenger Miles 1,581,601,483 1,589,902,688Average Trip Length 5.7 5.7 Quality of Service Average Headway (minutes) 25.83 26.05Weekday Span of Service (hours) 16.6 17.5 Cost Efficiency Operating Expense per Revenue Mile $7.41 $7.73Operating Expense per Revenue Hour $108.33 $112.45Operating Revenue per Operating Expense 28.30% 28.32%Passenger Trips per Employee FTE 30,991 29,832 Cost Effectiveness Operating Expense per Passenger Trip $3.74 $4.00Operating Expense per Passenger Mile $0.66 $0.70Operating Expense per Capita $67.17 $70.18Farebox Recovery Ratio 26.06% 25.40%Average Fare $0.98 $1.02 Service Effectiveness Passenger Trips per Revenue Mile 1.98 1.93Passenger Trips per Revenue Hour 28.95 28.14Passenger Trips per Capita 17.95 17.56Revenue Miles Between Safety Incidents 155,633 142,425Revenue Miles Between Failures 4,438 3,974
10 Florida department oF transportation
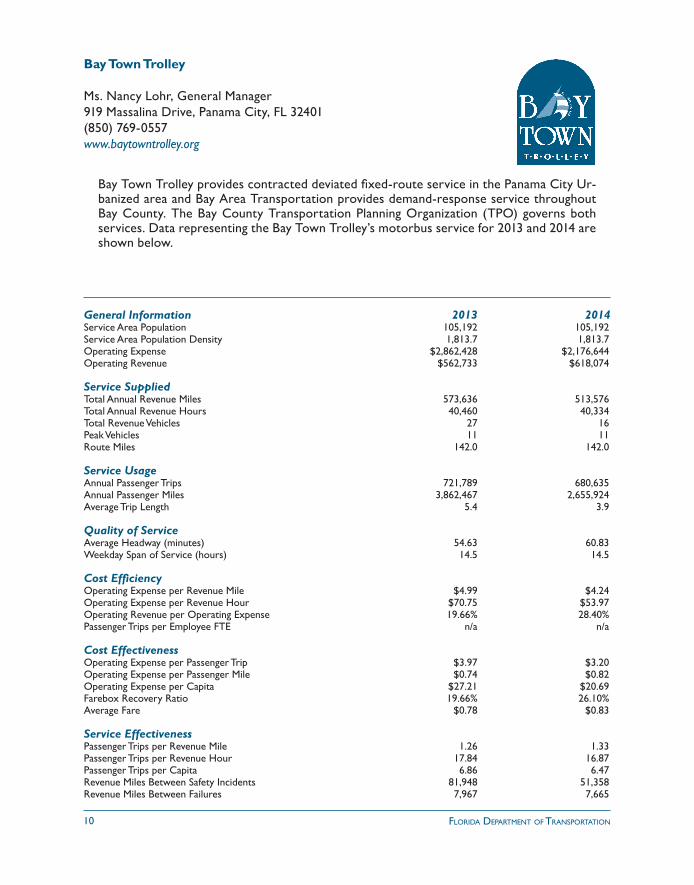
Bay Town Trolley
Ms. Nancy Lohr, General Manager919 Massalina Drive, Panama City, FL 32401(850) 769-0557www.baytowntrolley.org
Bay Town Trolley provides contracted deviated fixed-route service in the Panama City Ur-banized area and Bay Area Transportation provides demand-response service throughout Bay County. The Bay County Transportation Planning Organization (TPO) governs both services. Data representing the Bay Town Trolley’s motorbus service for 2013 and 2014 are shown below.
General Information 2013 2014Service Area Population 105,192 105,192Service Area Population Density 1,813.7 1,813.7Operating Expense $2,862,428 $2,176,644Operating Revenue $562,733 $618,074 Service Supplied Total Annual Revenue Miles 573,636 513,576Total Annual Revenue Hours 40,460 40,334Total Revenue Vehicles 27 16Peak Vehicles 11 11Route Miles 142.0 142.0 Service Usage Annual Passenger Trips 721,789 680,635Annual Passenger Miles 3,862,467 2,655,924Average Trip Length 5.4 3.9 Quality of Service Average Headway (minutes) 54.63 60.83Weekday Span of Service (hours) 14.5 14.5 Cost Efficiency Operating Expense per Revenue Mile $4.99 $4.24Operating Expense per Revenue Hour $70.75 $53.97Operating Revenue per Operating Expense 19.66% 28.40%Passenger Trips per Employee FTE n/a n/a Cost Effectiveness Operating Expense per Passenger Trip $3.97 $3.20Operating Expense per Passenger Mile $0.74 $0.82Operating Expense per Capita $27.21 $20.69Farebox Recovery Ratio 19.66% 26.10%Average Fare $0.78 $0.83 Service Effectiveness Passenger Trips per Revenue Mile 1.26 1.33Passenger Trips per Revenue Hour 17.84 16.87Passenger Trips per Capita 6.86 6.47Revenue Miles Between Safety Incidents 81,948 51,358Revenue Miles Between Failures 7,967 7,665
11Florida TransiT Handbook 2015
Broward County Transit (BCT)
Mr. Timothy Garling, DirectorOne N. University Drive, Suite 3100-A, Plantation, FL 33324(954) 357-8300www.broward.org/BCT
Broward County Transit is an agency of Broward County government responsible for op-erating a fixed-route motorbus service with several routes connecting with Palm Tran (in Palm Beach County), Miami-Dade Transit, and Tri-Rail (commuter rail service). In addition to fixed-route bus service, BCT also partners with many municipalities within the county to provide Community Bus services, including Fort Lauderdale’s Sun Trolley, and offers contracted paratransit service. BCT and Broward Community Bus data for the years 2013 and 2014 are provided below.
General Information 2013 2014Service Area Population 1,815,137 1,838,844Service Area Population Density 4,427.2 4,485.0Operating Expense $110,171,010 $115,898,030Operating Revenue $35,236,699 $38,227,326 Service Supplied Total Annual Revenue Miles 16,570,917 16,882,576Total Annual Revenue Hours 1,189,576 1,246,868Total Revenue Vehicles 398 411Peak Vehicles 328 333Route Miles 1,799.6 1,889.4 Service Usage Annual Passenger Trips 40,850,926 40,825,445Annual Passenger Miles 196,484,727 178,481,601Average Trip Length 4.8 4.4 Quality of Service Average Headway (minutes) 23.63 25.14Weekday Span of Service (hours) 20.0 20.2 Cost Efficiency Operating Expense per Revenue Mile $6.65 $6.86Operating Expense per Revenue Hour $92.61 $92.95Operating Revenue per Operating Expense 31.98% 32.98%Passenger Trips per Employee FTE 38,547 35,881 Cost Effectiveness Operating Expense per Passenger Trip $2.70 $2.84Operating Expense per Passenger Mile $0.56 $0.65Operating Expense per Capita $60.70 $63.03Farebox Recovery Ratio 30.82% 29.90%Average Fare $0.83 $0.85 Service Effectiveness Passenger Trips per Revenue Mile 2.47 2.42Passenger Trips per Revenue Hour 34.34 32.74Passenger Trips per Capita 22.51 22.20Revenue Miles Between Safety Incidents 164,068 106,180Revenue Miles Between Failures 19,657 7,867
12 Florida department oF transportation
Collier Area Transit (CAT)
Ms. Michelle Edwards-Arnold, Director8300 Radio Road, Naples, FL 34104(239) 252-7777www.colliergov.net/CAT
Collier Area Transit is part of the Alternative Transportation Modes Department of Collier County Transportation, which is governed by the Collier County Board of County Com-missioners. CAT provides fixed-route service in Collier County. Demand-response services are provided by Collier Area Paratransit. The data below represent CAT’s 2013 and 2014 fixed-route purchased motorbus services.
General Information 2013 2014Service Area Population 323,785 323,785Service Area Population Density 162.1 159.9Operating Expense $5,670,517 $6,524,735Operating Revenue $1,247,262 $1,215,109 Service Supplied Total Annual Revenue Miles 1,226,155 1,235,516Total Annual Revenue Hours 67,011 66,889Total Revenue Vehicles 23 23Peak Vehicles 16 16Route Miles 378.5 385.7 Service Usage Annual Passenger Trips 1,361,294 1,181,530Annual Passenger Miles 11,434,870 8,743,322Average Trip Length 8.4 7.4 Quality of Service Average Headway (minutes) 77.57 78.30Weekday Span of Service (hours) 16.5 16.7 Cost Efficiency Operating Expense per Revenue Mile $4.62 $5.28Operating Expense per Revenue Hour $84.62 $97.55Operating Revenue per Operating Expense 22.00% 18.62%Passenger Trips per Employee FTE n/a n/a Cost Effectiveness Operating Expense per Passenger Trip $4.17 $5.52Operating Expense per Passenger Mile $0.50 $0.75Operating Expense per Capita $17.51 $20.15Farebox Recovery Ratio 21.04% 18.62%Average Fare $0.88 $1.03 Service Effectiveness Passenger Trips per Revenue Mile 1.11 0.96Passenger Trips per Revenue Hour 20.31 17.66Passenger Trips per Capita 4.20 3.65Revenue Miles Between Safety Incidents 613,078 247,103Revenue Miles Between Failures 22,707 42,604
13Florida TransiT Handbook 2015
Council on Aging of St. Lucie, Inc.
Mr. Darrell J. Drummond, CEOMs. Marianne Arbore, Transit Director1505 Orange Avenue, Fort Pierce, FL 34950 (772) 464-7433www.treasurecoastconnector.com
Council on Aging of St. Lucie, Inc. operates Community Transit, a demand-response system, and the Treasure Coast Connector, a regional fixed-route system connecting St. Lucie and Martin Counties. The data shown below represent the fixed-route services for 2013 and 2014. If an agency has one safety incident, revenue miles between safety incidents is equal to revenue miles.
General Information 2013 2014Service Area Population 283,866 283,866Service Area Population Density 496.3 496.3Operating Expense $1,527,426 $1,544,934Operating Revenue $224,043 $241,271 Service Supplied Total Annual Revenue Miles 313,486 311,977Total Annual Revenue Hours 22,087 22,072Total Revenue Vehicles 12 12Peak Vehicles 8 8Route Miles 83.8 83.8 Service Usage Annual Passenger Trips 170,131 186,093Annual Passenger Miles 2,040,520 2,572,027Average Trip Length 12.0 13.8 Quality of Service Average Headway (minutes) 44.28 44.47Weekday Span of Service (hours) 11.0 11.0 Cost Efficiency Operating Expense per Revenue Mile $4.87 $4.95Operating Expense per Revenue Hour $69.15 $70.00Operating Revenue per Operating Expense 14.67% 15.62%Passenger Trips per Employee FTE 7,341 8,277 Cost Effectiveness Operating Expense per Passenger Trip $8.98 $8.30Operating Expense per Passenger Mile $0.75 $0.60Operating Expense per Capita $5.38 $5.44Farebox Recovery Ratio 13.64% 14.31%Average Fare $1.22 $1.19 Service Effectiveness Passenger Trips per Revenue Mile 0.54 0.60Passenger Trips per Revenue Hour 7.70 8.43Passenger Trips per Capita 0.60 0.66Revenue Miles Between Safety Incidents 313,486 51,996Revenue Miles Between Failures 39,186 44,568
14 Florida department oF transportation
Escambia County Area Transit (ECAT)
Mr. Mike Crittenden, General Manager1515 West Fairfield Drive, Pensacola, FL 32501(850) 595-3228www.goecat.com
Escambia County Area Transit is a department of the county government. A five-member elected Board of County Commissioners governs the department. In addition to providing purchased fixed-route motorbus service, ECAT contracts to provide demand-response transportation services. 2013 and 2014 motorbus data for ECAT are shown below.
General Information 2013 2014Service Area Population 341,765 341,765Service Area Population Density 1,448.2 1,466.8Operating Expense $8,276,841 $8,984,762Operating Revenue $1,875,371 $1,980,889 Service Supplied Total Annual Revenue Miles 1,508,510 1,493,426Total Annual Revenue Hours 109,400 101,304Total Revenue Vehicles 45 47Peak Vehicles 31 31Route Miles 315.0 315.0 Service Usage Annual Passenger Trips 1,558,734 1,516,649Annual Passenger Miles 8,299,619 9,338,387Average Trip Length 5.3 6.2 Quality of Service Average Headway (minutes) 44.21 41.36Weekday Span of Service (hours) 14.2 14.2 Cost Efficiency Operating Expense per Revenue Mile $5.49 $6.02Operating Expense per Revenue Hour $75.66 $88.69Operating Revenue per Operating Expense 22.66% 22.05%Passenger Trips per Employee FTE n/a n/a Cost Effectiveness Operating Expense per Passenger Trip $5.31 $5.92Operating Expense per Passenger Mile $1.00 $0.96Operating Expense per Capita $24.22 $26.29Farebox Recovery Ratio 22.25% 20.40%Average Fare $1.18 $1.21 Service Effectiveness Passenger Trips per Revenue Mile 1.03 1.02Passenger Trips per Revenue Hour 14.25 14.97Passenger Trips per Capita 4.56 4.44Revenue Miles Between Safety Incidents 754,255 186,678Revenue Miles Between Failures 14,789 10,023
15Florida TransiT Handbook 2015
Gainesville Regional Transit System
Mr. Jesus Gomez, Director 34 SE 13 Road, Gainesville, FL 32601(352) 334-2600www.go-rts.com
The Regional Transit System (RTS) is a department of the City of Gainesville. An elected seven-member Commission governs the RTS. The Commission receives input from an advi-sory board comprised of citizens from the community. The RTS serves the City of Gainesville and parts of Alachua County with fixed-route motorbus service and contracts to provide demand-response transportation services throughout the City of Gainesville and up to three-quarters of a mile beyond its fixed-route network. The data shown below represent fixed-route motorbus data for RTS in 2013 and 2014.
General Information 2013 2014Service Area Population 160,000 160,000Service Area Population Density 2,105.3 2,105.3Operating Expense $21,416,671 $22,633,015Operating Revenue $14,181,638 $15,215,898 Service Supplied Total Annual Revenue Miles 3,317,239 3,428,040Total Annual Revenue Hours 290,802 298,200Total Revenue Vehicles 123 123Peak Vehicles 103 104Route Miles 234.3 286.6 Service Usage Annual Passenger Trips 10,832,674 10,814,433Annual Passenger Miles 26,540,051 28,398,701Average Trip Length 2.4 2.6 Quality of Service Average Headway (minutes) 11.96 14.38Weekday Span of Service (hours) 22.5 22.7 Cost Efficiency Operating Expense per Revenue Mile $6.46 $6.60Operating Expense per Revenue Hour $73.65 $75.90Operating Revenue per Operating Expense 66.22% 67.23%Passenger Trips per Employee FTE 41,721 38,608 Cost Effectiveness Operating Expense per Passenger Trip $1.98 $2.09Operating Expense per Passenger Mile $0.81 $0.80Operating Expense per Capita $133.85 $141.46Farebox Recovery Ratio 63.08% 64.43%Average Fare $1.25 $1.35 Service Effectiveness Passenger Trips per Revenue Mile 3.27 3.15Passenger Trips per Revenue Hour 37.25 36.27Passenger Trips per Capita 67.70 67.59Revenue Miles Between Safety Incidents 473,891 685,608Revenue Miles Between Failures 8,484 8,812

16 Florida department oF transportation
Hillsborough Area Regional Transit Authority (HART)
Ms. Katharine Eagan, Chief Executive Officer1201 E. 7th Avenue, Tampa, FL 33605(813) 254-4278www.gohart.org
The Hillsborough Area Regional Transit Authority (HART) operates motorbus service as well as the TECO Line Streetcar connecting downtown with the Ybor City Historic Dis-trict. Paratransit service is provided for the City of Tampa, the City of Temple Terrace, and unincorporated Hillsborough County. The authority is governed by a Board of Directors comprised of twelve representatives appointed by the governing bodies of its members and the Governor of the State of Florida. 2013 and 2014 data for HART’s fixed-route bus and rail services are shown below.
General Information 2013 2014Service Area Population 822,404 875,598Service Area Population Density 3,384.4 3,433.7Operating Expense $60,097,076 $63,270,537Operating Revenue $15,897,203 $17,426,797 Service Supplied Total Annual Revenue Miles 7,665,538 8,027,637Total Annual Revenue Hours 615,280 648,318Total Revenue Vehicles 224 210Peak Vehicles 161 165Route Miles 1,024.3 1,140.2 Service Usage Annual Passenger Trips 15,028,441 15,334,839Annual Passenger Miles 74,236,765 74,527,155Average Trip Length 4.9 4.9 Quality of Service Average Headway (minutes) 30.64 33.33Weekday Span of Service (hours) 21.3 21.3 Cost Efficiency Operating Expense per Revenue Mile $7.84 $7.88Operating Expense per Revenue Hour $97.67 $97.59Operating Revenue per Operating Expense 26.45% 27.54%Passenger Trips per Employee FTE 24,250 23,906 Cost Effectiveness Operating Expense per Passenger Trip $4.00 $4.13Operating Expense per Passenger Mile $0.81 $0.85Operating Expense per Capita $73.07 $72.26Farebox Recovery Ratio 24.97% 25.07%Average Fare $1.00 $1.03 Service Effectiveness Passenger Trips per Revenue Mile 1.96 1.91Passenger Trips per Revenue Hour 24.43 23.65Passenger Trips per Capita 18.27 17.51Revenue Miles Between Safety Incidents 105,007 109,968Revenue Miles Between Failures 3,293 2,753
17Florida TransiT Handbook 2015
Indian River (GoLine)
Ms. Karen Deigl, Chief Executive Officer694 14th Street, Vero Beach, FL 32960(772) 569-0903www.GoLineIRT.com
Senior Resource Association operates as the Transit Element of Indian River County, in a quasi-governmental status under the five-member elected Board of County Commissioners. It is governed by a volunteer Board of Directors. Community Coach serves the rural and urbanized portions of Indian River County. The system provides point deviation motorbus services, and demand-response van, wheelchair, and stretcher services. The data shown below represent 2013 and 2014 motorbus services.
General Information 2013 2014Service Area Population 143,696 143,696Service Area Population Density 665.3 665.3Operating Expense $1,930,451 $2,474,869Operating Revenue $22,356 $11,617 Service Supplied Total Annual Revenue Miles 812,940 919,016Total Annual Revenue Hours 48,232 46,763Total Revenue Vehicles 23 24Peak Vehicles 15 14Route Miles 314.0 314.0 Service Usage Annual Passenger Trips 1,065,108 1,079,838Annual Passenger Miles 5,261,634 5,645,546Average Trip Length 4.9 5.2 Quality of Service Average Headway (minutes) 74.52 68.48Weekday Span of Service (hours) 10.0 13.0 Cost Efficiency Operating Expense per Revenue Mile $2.37 $2.69Operating Expense per Revenue Hour $40.02 $52.92Operating Revenue per Operating Expense 1.16% 0.47%Passenger Trips per Employee FTE 39,261 26,888 Cost Effectiveness Operating Expense per Passenger Trip $1.81 $2.29Operating Expense per Passenger Mile $0.37 $0.44Operating Expense per Capita $13.43 $17.22Farebox Recovery Ratio n/a n/aAverage Fare n/a n/a Service Effectiveness Passenger Trips per Revenue Mile 1.31 1.17Passenger Trips per Revenue Hour 22.08 23.09Passenger Trips per Capita 7.41 7.51Revenue Miles Between Safety Incidents 162,588 459,508Revenue Miles Between Failures 16,936 65,644
18 Florida department oF transportation
Jacksonville Transportation Authority (JTA)
Mr. Nathaniel Ford, Chief Executive Officer121 West Forsyth Street, Suite 200, Jacksonville, FL 32202(904) 630-3181www.jtafla.com
Jacksonville Transportation Authority is an independent authority that is governed by a seven-member, appointed Board of Directors. The Jacksonville system provides its services within Duval County and northern Clay County (Orange Park). JTA transportation services include fixed-route motorbus, automated guideway (Skyway Express), and demand-response. The data below represent JTA’s 2013 and 2014 fixed-route services (motorbus and automated guideway).
General Information 2013 2014Service Area Population 827,481 985,050Service Area Population Density 1,915.5 1,231.3Operating Expense $69,271,094 $72,528,324Operating Revenue $12,725,182 $12,389,863 Service Supplied Total Annual Revenue Miles 8,945,282 8,908,996Total Annual Revenue Hours 612,287 625,343Total Revenue Vehicles 182 181Peak Vehicles 143 163Route Miles 1,110.4 1,107.4 Service Usage Annual Passenger Trips 12,299,409 12,225,824Annual Passenger Miles 74,615,327 75,896,683Average Trip Length 6.1 6.2 Quality of Service Average Headway (minutes) 31.89 28.47Weekday Span of Service (hours) 21.5 22.4 Cost Efficiency Operating Expense per Revenue Mile $7.74 $8.14Operating Expense per Revenue Hour $113.14 $115.98Operating Revenue per Operating Expense 18.37% 17.08%Passenger Trips per Employee FTE 19,736 18,257 Cost Effectiveness Operating Expense per Passenger Trip $5.63 $5.93Operating Expense per Passenger Mile $0.93 $0.96Operating Expense per Capita $83.71 $73.63Farebox Recovery Ratio 16.46% 15.28%Average Fare $0.93 $0.91 Service Effectiveness Passenger Trips per Revenue Mile 1.37 1.37Passenger Trips per Revenue Hour 20.09 19.55Passenger Trips per Capita 14.86 12.41Revenue Miles Between Safety Incidents 104,015 112,772Revenue Miles Between Failures 21,712 14,369
19Florida TransiT Handbook 2015
Lake County Public Transportation (LakeXpress)
Ms. Amye King, Interim Director2440 U.S. Highway 441/27, Fruitland Park, FL 34731(352) 323-5733www.ridelakexpress.com
LakeXpress operates by contract under the Lake County Board of County Commissioners. Services provided include fixed-route LakeXpress and the Lake County Connection for demand-response service. LakeXpress was started in May 2007 and the County has served as the Community Transportation Coordinator since 2001. Data for 2013 and 2014 are shown below. If an agency has only one safety incident, the revenue miles between safety incidents is equal to the number of revenue miles.
General Information 2013 2014Service Area Population 97,497 97,497Service Area Population Density 1,373.2 1,373.2Operating Expense $2,188,413 $2,114,801Operating Revenue $208,414 $223,370 Service Supplied Total Annual Revenue Miles 406,322 408,106Total Annual Revenue Hours 23,210 23,195Total Revenue Vehicles 14 12Peak Vehicles 7 7Route Miles 146.1 146.1 Service Usage Annual Passenger Trips 312,591 318,371Annual Passenger Miles 2,095,697 2,139,453Average Trip Length 6.7 6.7 Quality of Service Average Headway (minutes) 71.53 71.17Weekday Span of Service (hours) 13.8 13.8 Cost Efficiency Operating Expense per Revenue Mile $5.39 $5.18Operating Expense per Revenue Hour $94.29 $91.17Operating Revenue per Operating Expense 9.52% 10.56%Passenger Trips per Employee FTE n/a n/a Cost Effectiveness Operating Expense per Passenger Trip $7.00 $6.64Operating Expense per Passenger Mile $1.04 $0.99Operating Expense per Capita $22.45 $21.69Farebox Recovery Ratio 6.97% 6.75%Average Fare $0.49 $0.45 Service Effectiveness Passenger Trips per Revenue Mile 0.77 0.78Passenger Trips per Revenue Hour 13.47 13.73Passenger Trips per Capita 3.21 3.27Revenue Miles Between Safety Incidents 203,161 408,106Revenue Miles Between Failures 893 1,000
20 Florida department oF transportation
Lakeland Area Mass Transit District (Citrus Connection)
Mr. Tom Phillips, Executive Director1212 George Jenkins Blvd., Lakeland, FL 33815(863) 688-7433www.ridecitrus.com
Lakeland Area Mass Transit District is an independent district governed by a five-member Board of Directors. The District serves the greater Lakeland area via fixed-route motorbus services (Citrus Connection) and demand-response services. The data below represent 2013 and 2014 motorbus data.
General Information 2013 2014Service Area Population 145,000 145,000Service Area Population Density 1,883.1 1,883.1Operating Expense $6,050,994 $7,498,552Operating Revenue $1,882,611 $1,633,457 Service Supplied Total Annual Revenue Miles 968,850 1,306,728Total Annual Revenue Hours 70,946 84,110Total Revenue Vehicles 38 37Peak Vehicles 22 32Route Miles 239.9 373.4 Service Usage Annual Passenger Trips 1,224,636 1,511,349Annual Passenger Miles 6,385,735 8,905,713Average Trip Length 5.2 5.9 Quality of Service Average Headway (minutes) 47.91 45.06Weekday Span of Service (hours) 13.0 21.1 Cost Efficiency Operating Expense per Revenue Mile $6.25 $5.74Operating Expense per Revenue Hour $85.29 $89.15Operating Revenue per Operating Expense 31.11% 21.78%Passenger Trips per Employee FTE 15,954 14,774 Cost Effectiveness Operating Expense per Passenger Trip $4.94 $4.96Operating Expense per Passenger Mile $0.95 $0.84Operating Expense per Capita $41.73 $51.71Farebox Recovery Ratio 28.70% 19.87%Average Fare $1.42 $0.99 Service Effectiveness Passenger Trips per Revenue Mile 1.26 1.16Passenger Trips per Revenue Hour 17.26 17.97Passenger Trips per Capita 8.45 10.42Revenue Miles Between Safety Incidents 322,950 435,576Revenue Miles Between Failures 1,288 2,537
21Florida TransiT Handbook 2015
Lee County Transit (LeeTran)
Mr. Steve Myers, Transit Director 3401 Metro Parkway, Fort Myers, FL 33901(239) 533-8726www.rideleetran.com
Lee County Transit is an independent division of the Lee County Government. The Lee County Board of County Commissioners, a five-member public policy body, governs the division. LeeTran provides public transportation services to Lee County via fixed-route mo-torbus services and contracted demand-response services. In addition, LeeTran contractually provides vanpool service. LeeTran’s fixed-route motorbus and vanpool data for 2013 and 2014 are shown below.
General Information 2013 2014Service Area Population 463,224 470,588Service Area Population Density 3,563.3 3,619.9Operating Expense $15,703,160 $15,764,030Operating Revenue $3,889,080 $4,697,956 Service Supplied Total Annual Revenue Miles 3,269,603 3,065,800Total Annual Revenue Hours 191,437 187,143Total Revenue Vehicles 71 80Peak Vehicles 59 66Route Miles 551.0 551.0 Service Usage Annual Passenger Trips 4,119,891 3,985,691Annual Passenger Miles 25,384,349 21,832,933Average Trip Length 6.2 5.5 Quality of Service Average Headway (minutes) 40.33 41.18Weekday Span of Service (hours) 17.5 17.5 Cost Efficiency Operating Expense per Revenue Mile $4.80 $5.14Operating Expense per Revenue Hour $82.03 $84.24Operating Revenue per Operating Expense 24.77% 29.80%Passenger Trips per Employee FTE 24,279 23,222 Cost Effectiveness Operating Expense per Passenger Trip $3.81 $3.96Operating Expense per Passenger Mile $0.62 $0.72Operating Expense per Capita $33.90 $33.50Farebox Recovery Ratio 19.69% 18.97%Average Fare $0.75 $0.75 Service Effectiveness Passenger Trips per Revenue Mile 1.26 1.30Passenger Trips per Revenue Hour 21.52 21.30Passenger Trips per Capita 8.89 8.47Revenue Miles Between Safety Incidents 204,350 235,831Revenue Miles Between Failures 22,864 27,871
22 Florida department oF transportation
LYNX (Central Florida Regional Transportation Authority)
Ms. Susan N. Black, Interim Chief Executive Officer455 North Garland Avenue, Orlando, FL 32801(407) 841-2279www.golynx.com
LYNX is an independent authority that is governed by a Board of Directors. The authority provides service to Orange County (including Orlando, Winter Park, Maitland, and others), Seminole County (including Altamonte Springs, Casselberry, and Sanford), and Osceola County (including Kissimmee and St. Cloud). LYNX provides fixed-route motorbus service (including commuter bus and the Lymmo rapid bus), paratransit service, transportation-disadvantaged coordination, a five-county regional ridesharing assistance program, and vanpool service. 2013 and 2014 fixed-route motorbus and vanpool data for LYNX are provided below.
General Information 2013 2014Service Area Population 1,920,488 1,959,812Service Area Population Density 756.7 772.2Operating Expense $95,016,662 $95,330,587Operating Revenue $31,087,896 $31,040,036 Service Supplied Total Annual Revenue Miles 16,579,075 17,247,024Total Annual Revenue Hours 1,133,527 1,166,185Total Revenue Vehicles 418 458Peak Vehicles 335 389Route Miles 1,553.7 1,742.6 Service Usage Annual Passenger Trips 29,082,988 29,367,232Annual Passenger Miles 157,483,173 168,163,405Average Trip Length 5.4 5.7 Quality of Service Average Headway (minutes) 25.80 26.99Weekday Span of Service (hours) 23.0 24.3 Cost Efficiency Operating Expense per Revenue Mile $5.73 $5.53Operating Expense per Revenue Hour $83.82 $81.75Operating Revenue per Operating Expense 32.72% 32.56%Passenger Trips per Employee FTE 30,541 29,607 Cost Effectiveness Operating Expense per Passenger Trip $3.27 $3.25Operating Expense per Passenger Mile $0.60 $0.57Operating Expense per Capita $49.48 $48.64Farebox Recovery Ratio 29.71% 29.12%Average Fare $0.97 $0.95 Service Effectiveness Passenger Trips per Revenue Mile 1.75 1.70Passenger Trips per Revenue Hour 25.66 25.18Passenger Trips per Capita 15.14 14.98Revenue Miles Between Safety Incidents 176,373 141,369Revenue Miles Between Failures 10,171 10,033
23Florida TransiT Handbook 2015
Manatee County Area Transit (MCAT)
Mr. William Steele, Transit Division Manager1108 26th Avenue East, Bradenton, FL 34208(941) 747-8621 www.mymanatee.org
Manatee County Area Transit is a division within the Community Services Department of Manatee County. The Board of County Commissioners governs the division. MCAT provides service to the urbanized parts of Manatee County via fixed-route motorbus services and demand-response services. 2013 and 2014 data for MCAT’s fixed-route motorbus services are provided on this page.
General Information 2013 2014Service Area Population 322,833 322,833Service Area Population Density 434.5 434.5Operating Expense $7,780,717 $8,056,800Operating Revenue $1,344,801 $1,051,574 Service Supplied Total Annual Revenue Miles 1,234,882 1,256,941Total Annual Revenue Hours 86,132 86,845Total Revenue Vehicles 30 30Peak Vehicles 19 20Route Miles 235.0 235.0 Service Usage Annual Passenger Trips 1,780,471 1,824,120Annual Passenger Miles 8,689,670 8,646,329Average Trip Length 4.9 4.7 Quality of Service Average Headway (minutes) 51.76 48.71Weekday Span of Service (hours) 16.8 17.3 Cost Efficiency Operating Expense per Revenue Mile $6.30 $6.41Operating Expense per Revenue Hour $90.33 $92.77Operating Revenue per Operating Expense 17.28% 13.05%Passenger Trips per Employee FTE 25,545 25,726 Cost Effectiveness Operating Expense per Passenger Trip $4.37 $4.42Operating Expense per Passenger Mile $0.90 $0.93Operating Expense per Capita $24.10 $24.96Farebox Recovery Ratio 11.75% 11.50%Average Fare $0.51 $0.51 Service Effectiveness Passenger Trips per Revenue Mile 1.44 1.45Passenger Trips per Revenue Hour 20.67 21.00Passenger Trips per Capita 5.52 5.65Revenue Miles Between Safety Incidents 246,976 628,471Revenue Miles Between Failures 2,170 1,768
24 Florida department oF transportation
Martin County
Ms. Claudette Mahan, Transit Manager2401 SE Monterey Road, Stuart, FL 34996 (772) 463-2860www.martin.fl.us/transit
Martin County contracts to provide fixed-route motorbus, deviated fixed-route motorbus, shared ride Americans with Disabilities Act (ADA) services, and general paratransit services. 2013 and 2014 motorbus data are displayed below. If an agency has zero safety incidents, revenue miles between safety incidents in n/a. If an agency has one safety incident, revenue miles between safety incidents is equal to revenue miles.
General Information 2013 2014Service Area Population 146,000 146,000Service Area Population Density 262.6 206.8Operating Expense $528,699 $797,155Operating Revenue $14,377 $38,606 Service Supplied Total Annual Revenue Miles 137,870 172,785Total Annual Revenue Hours 10,293 12,486Total Revenue Vehicles 5 7Peak Vehicles 4 5Route Miles 65.0 76.0 Service Usage Annual Passenger Trips 58,025 36,146Annual Passenger Miles 270,300 334,591Average Trip Length 4.7 9.3 Quality of Service Average Headway (minutes) 72.79 65.90Weekday Span of Service (hours) 11.0 12.0 Cost Efficiency Operating Expense per Revenue Mile $3.83 $4.61Operating Expense per Revenue Hour $51.36 $63.84Operating Revenue per Operating Expense 2.72% 4.84%Passenger Trips per Employee FTE n/a n/a Cost Effectiveness Operating Expense per Passenger Trip $9.11 $22.05Operating Expense per Passenger Mile $1.96 $2.38Operating Expense per Capita $3.62 $5.46Farebox Recovery Ratio 2.72% 4.84%Average Fare $0.25 $1.07 Service Effectiveness Passenger Trips per Revenue Mile 0.42 0.21Passenger Trips per Revenue Hour 5.64 2.89Passenger Trips per Capita 0.40 0.25Revenue Miles Between Safety Incidents n/a 172,785Revenue Miles Between Failures 68,935 86,393

25Florida TransiT Handbook 2015
Miami-Dade Transit (MDT)
Ms. Alice N. Bravo, P.E., DirectorOvertown Transit Village701 NW 1st Court, Suite 1700, Miami, FL 33136(786) 469-5406www.miamidade.gov/transit
Miami-Dade Transit is the largest transit agency in Florida, operating throughout Miami-Dade County, southern Broward County, and northern Monroe County. MDT is governed by Miami-Dade County, and is responsible for the management, construction, and operation of its services and facilities. Passengers have access to Metrobus, Metrorail (a 22-station heavy rail system), and Metromover (an automated people-mover system that serves the downtown Miami, Brickell and Omni areas). Paratransit is available through MDT’s Special Transportation Service. Vanpool service is provided by Miami Lakes-vRide, Inc. The data shown below represent all of MDT’s fixed-route services and area vanpool services (excluding paratransit operations) for 2013 and 2014.
General Information 2013 2014Service Area Population 2,496,435 2,496,435Service Area Population Density 8,158.3 8,158.3Operating Expense $406,683,473 $442,428,104Operating Revenue $123,101,909 $133,841,886 Service Supplied Total Annual Revenue Miles 41,412,941 42,030,762Total Annual Revenue Hours 2,976,385 3,008,768Total Revenue Vehicles 1,250 1,291Peak Vehicles 1,029 1,032Route Miles 2,041.5 1,969.3 Service Usage Annual Passenger Trips 110,289,327 109,674,441Annual Passenger Miles 622,903,154 636,551,487Average Trip Length 5.6 5.8 Quality of Service Average Headway (minutes) 11.03 10.84Weekday Span of Service (hours) 24.0 24.0 Cost Efficiency Operating Expense per Revenue Mile $9.82 $10.53Operating Expense per Revenue Hour $136.64 $147.05Operating Revenue per Operating Expense 30.27% 30.25%Passenger Trips per Employee FTE 35,188 34,573 Cost Effectiveness Operating Expense per Passenger Trip $3.69 $4.03Operating Expense per Passenger Mile $0.65 $0.70Operating Expense per Capita $162.91 $177.22Farebox Recovery Ratio 27.40% 26.52%Average Fare $1.01 $1.07 Service Effectiveness Passenger Trips per Revenue Mile 2.66 2.61Passenger Trips per Revenue Hour 37.05 36.45Passenger Trips per Capita 44.18 43.93Revenue Miles Between Safety Incidents 131,054 150,648Revenue Miles Between Failures 2,114 1,965
26 Florida department oF transportation
Okaloosa County – Emerald Coast Rider (EC Rider)
Mr. Bob Berkstresser, General Manager600 Transit Way, Fort Walton Beach, FL 32547(850) 833-9168www.ecrider.org
The Okaloosa County Board of County Commissioners contracts to operate The Emerald Coast Rider (EC Rider), a fixed-route bus system providing service in Fort Walton Beach and Crestview. In addition, demand-response services are provided by the county. 2013 and 2014 data representing EC Rider’s fixed-route motorbus service are pre sented below. If an agency has zero safety incidents, revenue miles between safety incidents is n/a.
General Information 2013 2014Service Area Population 180,822 191,917Service Area Population Density 904.1 1,599.3Operating Expense $1,147,002 $1,304,876Operating Revenue $130,985 $223,708 Service Supplied Total Annual Revenue Miles 441,358 400,359Total Annual Revenue Hours 35,764 31,362Total Revenue Vehicles 18 18Peak Vehicles 14 12Route Miles 214.0 214.5 Service Usage Annual Passenger Trips 182,584 162,298Annual Passenger Miles 772,330 746,571Average Trip Length 4.2 4.6 Quality of Service Average Headway (minutes) 74.32 84.01Weekday Span of Service (hours) 13.0 13.0 Cost Efficiency Operating Expense per Revenue Mile $2.60 $3.26Operating Expense per Revenue Hour $32.07 $41.61Operating Revenue per Operating Expense 11.42% 17.14%Passenger Trips per Employee FTE n/a n/a Cost Effectiveness Operating Expense per Passenger Trip $6.28 $8.04Operating Expense per Passenger Mile $1.49 $1.75Operating Expense per Capita $6.34 $6.80Farebox Recovery Ratio 10.81% 16.62%Average Fare $0.68 $1.34 Service Effectiveness Passenger Trips per Revenue Mile 0.41 0.41Passenger Trips per Revenue Hour 5.11 5.17Passenger Trips per Capita 1.01 0.85Revenue Miles Between Safety Incidents n/a n/aRevenue Miles Between Failures 23,229 44,484
27Florida TransiT Handbook 2015
Palm Beach County Transportation Agency (Palm Tran)
Ms. Shannon LaRocque, Interim Executive Director3201 Electronics Way, West Palm Beach, FL 33407(561) 841-4200www.palmtran.org
Palm Tran is a not-for-profit corporation owned by Palm Beach County that is governed by the seven-member Board of County Commissioners. The corporation provides transit services throughout Palm Beach County. Palm Tran operates fixed-route motorbus services and feeder bus services to the Tri-Rail system. In addition, Palm Tran offers route deviation through the LINK and demand-response services through its paratransit operation, Palm Tran CONNECTION. 2013 and 2014 motorbus data for Palm Tran are provided below.
General Information 2013 2014Service Area Population 1,268,782 1,268,782Service Area Population Density 3,476.1 3,476.1Operating Expense $49,208,481 $52,551,544Operating Revenue $10,056,639 $12,097,212 Service Supplied Total Annual Revenue Miles 7,124,231 7,312,791Total Annual Revenue Hours 411,631 431,696Total Revenue Vehicles 157 156Peak Vehicles 123 130Route Miles 1,096.0 1,018.0 Service Usage Annual Passenger Trips 12,018,198 11,426,791Annual Passenger Miles 74,588,137 74,718,004Average Trip Length 6.2 6.5 Quality of Service Average Headway (minutes) 30.89 27.74Weekday Span of Service (hours) 17.8 17.8 Cost Efficiency Operating Expense per Revenue Mile $6.91 $7.19Operating Expense per Revenue Hour $119.55 $121.73Operating Revenue per Operating Expense 20.44% 23.02%Passenger Trips per Employee FTE 28,656 25,944 Cost Effectiveness Operating Expense per Passenger Trip $4.09 $4.60Operating Expense per Passenger Mile $0.66 $0.70Operating Expense per Capita $38.78 $41.42Farebox Recovery Ratio 18.86% 21.50%Average Fare $0.77 $0.99 Service Effectiveness Passenger Trips per Revenue Mile 1.69 1.56Passenger Trips per Revenue Hour 29.20 26.47Passenger Trips per Capita 9.47 9.01Revenue Miles Between Safety Incidents 104,768 88,106Revenue Miles Between Failures 4,500 3,260
28 Florida department oF transportation
Pasco County Public Transportation (PCPT)
Mr. Philip Pumphrey, Public Transportation Director 8620 Galen Wilson Boulevard, Port Richey, FL 34668(727) 834-3322www.ridepcpt.com
Pasco County Public Transportation is a division of Pasco County Government, governed by the five-member Pasco County Commission. Fixed-route bus service is provided in urbanized West Pasco County and the municipalities of East Pasco County. Demand-response (advance reservation) service is available throughout Pasco County. The data provided below represent PCPT’s fixed-route motorbus data for 2013 and 2014.
General Information 2013 2014Service Area Population 470,391 475,502Service Area Population Density 631.4 638.3Operating Expense $4,329,729 $4,685,978Operating Revenue $1,079,224 $1,038,121 Service Supplied Total Annual Revenue Miles 1,302,079 1,303,381Total Annual Revenue Hours 71,244 71,200Total Revenue Vehicles 33 43Peak Vehicles 18 18Route Miles 363.0 363.0 Service Usage Annual Passenger Trips 1,003,572 959,855Annual Passenger Miles 7,726,198 6,964,682Average Trip Length 7.7 7.3 Quality of Service Average Headway (minutes) 66.21 66.10Weekday Span of Service (hours) 15.6 15.6 Cost Efficiency Operating Expense per Revenue Mile $3.33 $3.60Operating Expense per Revenue Hour $60.77 $65.81Operating Revenue per Operating Expense 24.93% 22.15%Passenger Trips per Employee FTE 20,312 19,686 Cost Effectiveness Operating Expense per Passenger Trip $4.31 $4.88Operating Expense per Passenger Mile $0.56 $0.67Operating Expense per Capita $9.20 $9.85Farebox Recovery Ratio 24.93% 22.15%Average Fare $1.08 $1.08 Service Effectiveness Passenger Trips per Revenue Mile 0.77 0.74Passenger Trips per Revenue Hour 14.09 13.48Passenger Trips per Capita 2.13 2.02Revenue Miles Between Safety Incidents 217,013 260,676Revenue Miles Between Failures 12,169 7,622
29Florida TransiT Handbook 2015
Pinellas Suncoast Transit Authority (PSTA)
Mr. Brad Miller, Chief Executive Officer3201 Scherer Drive, St. Petersburg, FL 33716(727) 540-1800www.psta.net
The Pinellas Suncoast Transit Authority (PSTA) is the public transit provider for Pinellas County. In addition, two express routes travel between Pinellas County and Tampa, located in neighboring Hillsborough County. PSTA is an independent agency governed by an eleven-member Board of Directors comprised of elected officials and private citizen appointees. PSTA provides fixed-route motorbus services, commuter bus services, and demand-response services. PSTA’s fixed-route motorbus and commuter bus data for 2013 and 2014 are shown below.
General Information 2013 2014Service Area Population 922,616 850,758Service Area Population Density 3,796.8 2,444.7Operating Expense $54,593,048 $57,180,605Operating Revenue $15,006,464 $14,371,863 Service Supplied Total Annual Revenue Miles 9,073,836 9,176,346Total Annual Revenue Hours 636,039 641,039Total Revenue Vehicles 233 223Peak Vehicles 179 182Route Miles 971.0 967.9 Service Usage Annual Passenger Trips 14,150,506 14,184,320Annual Passenger Miles 69,538,115 68,926,684Average Trip Length 4.9 4.9 Quality of Service Average Headway (minutes) 22.81 22.29Weekday Span of Service (hours) 21.0 21.0 Cost Efficiency Operating Expense per Revenue Mile $6.02 $6.23Operating Expense per Revenue Hour $85.83 $89.20Operating Revenue per Operating Expense 27.49% 25.13%Passenger Trips per Employee FTE 24,756 24,792 Cost Effectiveness Operating Expense per Passenger Trip $3.86 $4.03Operating Expense per Passenger Mile $0.79 $0.83Operating Expense per Capita $59.17 $67.21Farebox Recovery Ratio 25.95% 24.48%Average Fare $1.00 $0.99 Service Effectiveness Passenger Trips per Revenue Mile 1.56 1.55Passenger Trips per Revenue Hour 22.25 22.13Passenger Trips per Capita 15.34 16.67Revenue Miles Between Safety Incidents 135,430 99,743Revenue Miles Between Failures 7,587 7,485
30 Florida department oF transportation
Polk County Transit Services Division
Mr. Paul Simmons, Director 1290 Golfview Avenue, Building F, Bartow, FL 33830(863) 534-5500www.polk-county.net
Winter Haven Area Transit (WHAT) began operating in 1999 with Polk County Transit Services as the Administrative Agent and Project Manager. Polk County Transit Services provides fixed-route motorbus services in the City of Winter Haven. The WHAT system is governed by a Policy Board. Demand-response services are also provided. 2013 and 2014 motorbus data for Polk County/WHAT are presented below. If an agency has zero safety incidents, revenue miles between safety incidents is n/a.
General Information 2013 2014Service Area Population 153,924 201,289Service Area Population Density 3,206.8 4,193.5Operating Expense $2,850,578 $1,007,810Operating Revenue $275,327 $111,984 Service Supplied Total Annual Revenue Miles 685,906 371,696Total Annual Revenue Hours 34,297 20,744Total Revenue Vehicles 15 15Peak Vehicles 10 8Route Miles 318.0 186.3 Service Usage Annual Passenger Trips 524,822 230,123Annual Passenger Miles 4,949,071 1,760,441Average Trip Length 9.4 7.7 Quality of Service Average Headway (minutes) 95.40 77.98Weekday Span of Service (hours) 13.3 13.0 Cost Efficiency Operating Expense per Revenue Mile $4.16 $2.71Operating Expense per Revenue Hour $83.11 $48.58Operating Revenue per Operating Expense 9.66% 11.11%Passenger Trips per Employee FTE 21,226 8,625 Cost Effectiveness Operating Expense per Passenger Trip $5.43 $4.38Operating Expense per Passenger Mile $0.58 $0.57Operating Expense per Capita $18.52 $5.01Farebox Recovery Ratio 8.63% n/aAverage Fare $0.47 n/a Service Effectiveness Passenger Trips per Revenue Mile 0.77 0.62Passenger Trips per Revenue Hour 15.30 11.09Passenger Trips per Capita 3.41 1.14Revenue Miles Between Safety Incidents n/a n/aRevenue Miles Between Failures 7,884 5,995
31Florida TransiT Handbook 2015
St. Johns County Council on Aging, Inc. (The Sunshine Bus Company)
Ms. Rebecca Yanni, Executive Director180 Marine Street, St. Augustine, FL 32084(904) 209-3716www.sunshinebus.net
The Sunshine Bus Company operates under contract by St. Johns County Council on Ag-ing, Inc. Services provided include fixed-route motorbus and demand-response operations. 2013 and 2014 data for the motorbus mode are shown below. St. Johns County received a reporting waiver from FTA in 2014 and did not report passenger miles. Passenger miles for 2014 were estimating using average trip length from 2013 and passenger trips from 2014. If an agency has zero safety incidents, revenue miles between safety incidents in n/a. If an agency has one safety incident, revenue miles between safety incidents is equal to revenue miles.
General Information 2013 2014Service Area Population 195,823 195,823Service Area Population Density 326.4 326.4Operating Expense $1,026,566 $932,598Operating Revenue $100,327 $165,181 Service Supplied Total Annual Revenue Miles 465,165 480,511Total Annual Revenue Hours 23,282 23,210Total Revenue Vehicles 11 11Peak Vehicles 7 7Route Miles 105.0 105.0 Service Usage Annual Passenger Trips 254,163 259,402Annual Passenger Miles 2,099,386 2,142,660Average Trip Length 8.3 8.3 Quality of Service Average Headway (minutes) 45.05 43.47Weekday Span of Service (hours) 12.8 12.8 Cost Efficiency Operating Expense per Revenue Mile $2.21 $1.94Operating Expense per Revenue Hour $44.09 $40.18Operating Revenue per Operating Expense 9.77% 17.71%Passenger Trips per Employee FTE n/a n/a Cost Effectiveness Operating Expense per Passenger Trip $4.04 $3.60Operating Expense per Passenger Mile $0.49 $0.44Operating Expense per Capita $5.24 $4.76Farebox Recovery Ratio 9.77% 10.48%Average Fare $0.39 $0.38 Service Effectiveness Passenger Trips per Revenue Mile 0.55 0.54Passenger Trips per Revenue Hour 10.92 11.18Passenger Trips per Capita 1.30 1.32Revenue Miles Between Safety Incidents 465,165 n/aRevenue Miles Between Failures 232,583 240,256
32 Florida department oF transportation
Sarasota County Area Transit (SCAT)
Mr. Rocky A. Burke, Transit Director5303 Pinkney Avenue, Sarasota, FL 34233(941) 861-5000www.scgov.net/SCAT
Sarasota County Area Transit is a member of the Sarasota County Government. The five-member Board of County Commissioners governs the agency. SCAT serves the urbanized portion of Sarasota County (including the municipalities of Longboat Key, Sarasota, Venice, Englewood, and North Port) via fixed-route motorbus services, commuter bus services, and demand-response services. SCAT’s 2013 and 2014 motorbus and commuter bus data are provided below.
General Information 2013 2014Service Area Population 388,474 388,559Service Area Population Density 1,823.8 1,726.9Operating Expense $14,951,777 $17,099,475Operating Revenue $1,956,351 $1,953,748 Service Supplied Total Annual Revenue Miles 2,912,080 3,185,765Total Annual Revenue Hours 187,410 203,369Total Revenue Vehicles 64 77Peak Vehicles 46 53Route Miles 546.0 578.0 Service Usage Annual Passenger Trips 2,832,459 2,874,408Annual Passenger Miles 15,166,635 15,375,433Average Trip Length 5.4 5.3 Quality of Service Average Headway (minutes) 45.83 41.77Weekday Span of Service (hours) 18.2 17.9 Cost Efficiency Operating Expense per Revenue Mile $5.13 $5.37Operating Expense per Revenue Hour $79.78 $84.08Operating Revenue per Operating Expense 13.08% 11.43%Passenger Trips per Employee FTE 17,563 16,043 Cost Effectiveness Operating Expense per Passenger Trip $5.28 $5.95Operating Expense per Passenger Mile $0.99 $1.11Operating Expense per Capita $38.49 $44.01Farebox Recovery Ratio 12.62% 10.79%Average Fare $0.67 $0.64 Service Effectiveness Passenger Trips per Revenue Mile 0.97 0.90Passenger Trips per Revenue Hour 15.11 14.13Passenger Trips per Capita 7.29 7.40Revenue Miles Between Safety Incidents 364,010 455,109Revenue Miles Between Failures 8,851 15,170
33Florida TransiT Handbook 2015
South Florida Regional Transportation Authority (Tri-Rail)
Mr. Jack Stephens, Executive Director800 NW 33rd Street, Pompano Beach, FL 33064(954) 942-7245www.tri-rail.com
The South Florida Regional Transportation Authority is an independent authority established by the Florida Legislature. A nine-member appointed Board of Directors governs the SFRTA. The SFRTA oper-ates and manages the commuter rail system, Tri-Rail, as well as select motorbus services throughout Broward, Miami-Dade and Palm Beach counties. This page shows 2013 and 2014 data for these services. In 2013, 82 percent of the annual passenger trips shown were for commuter rail mode (4,201,040) with the remainder for motorbus services (921,631). Similarly, in 2014, 81 percent of the annual passenger trips shown were for commuter rail (4,400,977) with the remainder for the motorbus (1,001,058). If an agency has zero safety incidents, revenue miles between safety incidents in n/a.
General Information 2013 2014Service Area Population 5,502,379 5,502,379Service Area Population Density 4,444.6 4,444.6Operating Expense $61,063,954 $68,267,317Operating Revenue $12,715,042 $13,366,453 Service Supplied Total Annual Revenue Miles 3,896,413 4,188,469Total Annual Revenue Hours 159,988 174,894Total Revenue Vehicles 76 108Peak Vehicles 61 62Route Miles 306.2 306.2 Service Usage Annual Passenger Trips 5,122,671 5,402,035Annual Passenger Miles 119,740,211 123,570,529Average Trip Length 23.4 22.9 Quality of Service Average Headway (minutes) 12.37 12.37Weekday Span of Service (hours) 19.6 19.6 Cost Efficiency Operating Expense per Revenue Mile $15.67 $16.30Operating Expense per Revenue Hour $381.68 $390.34Operating Revenue per Operating Expense 20.82% 19.58%Passenger Trips per Employee FTE n/a n/a Cost Effectiveness Operating Expense per Passenger Trip $11.92 $12.64Operating Expense per Passenger Mile $0.51 $0.55Operating Expense per Capita $11.10 $12.41Farebox Recovery Ratio 19.72% 18.75%Average Fare $2.35 $2.37 Service Effectiveness Passenger Trips per Revenue Mile 1.31 1.29Passenger Trips per Revenue Hour 32.02 30.89Passenger Trips per Capita 0.93 0.98Revenue Miles Between Safety Incidents n/a n/aRevenue Miles Between Failures 64,940 72,215
34 Florida department oF transportation
Space Coast Area Transit (SCAT)
Mr. James P. Liesenfelt, Transit Director401 South Varr Avenue, Cocoa, FL 32922(321) 635-7815 www.ridescat.com
Space Coast Area Transit is a department of Brevard County. The department is governed by the five-member Brevard County Commission. Space Coast provides transit service throughout Brevard County via fixed-route motorbus services, demand-response services, and vanpool services. 2013 and 2014 data representing Space Coast’s motorbus and vanpool services are shown on this page.
General Information 2013 2014Service Area Population 554,354 554,354Service Area Population Density 1,283.2 2,115.9Operating Expense $6,180,973 $7,388,743Operating Revenue $1,377,174 $1,669,237 Service Supplied Total Annual Revenue Miles 2,638,305 2,765,038Total Annual Revenue Hours 104,680 112,220Total Revenue Vehicles 124 125Peak Vehicles 74 79Route Miles 374.0 379.0 Service Usage Annual Passenger Trips 2,442,227 2,483,257Annual Passenger Miles 20,453,771 21,052,936Average Trip Length 8.4 8.5 Quality of Service Average Headway (minutes) 37.10 31.82Weekday Span of Service (hours) 17.8 18.4 Cost Efficiency Operating Expense per Revenue Mile $2.34 $2.67Operating Expense per Revenue Hour $59.05 $65.84Operating Revenue per Operating Expense 22.28% 22.59%Passenger Trips per Employee FTE 39,932 52,095 Cost Effectiveness Operating Expense per Passenger Trip $2.53 $2.98Operating Expense per Passenger Mile $0.30 $0.35Operating Expense per Capita $11.15 $13.33Farebox Recovery Ratio 20.25% 21.58%Average Fare $0.51 $0.64 Service Effectiveness Passenger Trips per Revenue Mile 0.93 0.90Passenger Trips per Revenue Hour 23.33 22.13Passenger Trips per Capita 4.41 4.48Revenue Miles Between Safety Incidents 329,788 197,503Revenue Miles Between Failures 50,737 46,865
35Florida TransiT Handbook 2015
StarMetro (Tallahassee)
Mr. Ivan Maldonado, Executive Director555 Appleyard Drive, Tallahassee, FL 32304(850) 891-5200www.talgov.com/starmetro
StarMetro is a department of the City of Tallahasseegovernment. It is governed by a Board of Directors that is comprised of four elected commissioners and one elected mayor. Star-Metro serves the City of Tallahassee by providing fixed-route motorbus service and demand-response service to its community. Evening, weekend, and holiday demand-response services are provided via contract. StarMetro’s 2013 and 2014 motorbus data are provided below.
General Information 2013 2014Service Area Population 162,310 162,310Service Area Population Density 1,591.3 1,591.3Operating Expense $14,688,727 $12,832,773Operating Revenue $4,510,707 $4,736,729 Service Supplied Total Annual Revenue Miles 2,190,520 2,246,364Total Annual Revenue Hours 219,965 222,973Total Revenue Vehicles 73 74Peak Vehicles 58 58Route Miles 234.0 235.0 Service Usage Annual Passenger Trips 4,432,121 4,260,333Annual Passenger Miles 13,724,495 13,527,920Average Trip Length 3.1 3.2 Quality of Service Average Headway (minutes) 24.31 24.13Weekday Span of Service (hours) 17.3 17.3 Cost Efficiency Operating Expense per Revenue Mile $6.71 $5.71Operating Expense per Revenue Hour $66.78 $57.55Operating Revenue per Operating Expense 30.71% 36.91%Passenger Trips per Employee FTE 23,089 23,393 Cost Effectiveness Operating Expense per Passenger Trip $3.31 $3.01Operating Expense per Passenger Mile $1.07 $0.95Operating Expense per Capita $90.50 $79.06Farebox Recovery Ratio 29.87% 34.39%Average Fare $0.99 $1.04 Service Effectiveness Passenger Trips per Revenue Mile 2.02 1.90Passenger Trips per Revenue Hour 20.15 19.11Passenger Trips per Capita 27.31 26.25Revenue Miles Between Safety Incidents 219,052 83,199Revenue Miles Between Failures 15,004 14,682
36 Florida department oF transportation
SunRail (Florida Department of Transportation)
Mr. Miguel Torres, Chief Operating Officer801 SunRail Drive, Sanford, FL 32771(855) 724-5411www.SunRail.com
SunRail is a commuter rail service that began operating in May 2014. The service connects Orange and Volusia Counties through Downtown Orlando. The five-member Central Florida Commuter Rail Commission Governing Board will act in an advisory capacity to FDOT for the first seven years of SunRail operations, and will assume operation and maintenance of the system in the eighth year of operation. SunRail only operated during the last six weeks of NTD report year 2014, and not all data were available to be published. The data available for 2014 are shown below.
General Information 2013 2014Service Area Population n/a 255,483Service Area Population Density n/a 2,322.6Operating Expense n/a n/aOperating Revenue n/a n/a Service Supplied Total Annual Revenue Miles n/a n/aTotal Annual Revenue Hours n/a n/aTotal Revenue Vehicles n/a n/aPeak Vehicles n/a n/aRoute Miles n/a 31.8 Service Usage Annual Passenger Trips n/a 169,939Annual Passenger Miles n/a 2,611,853Average Trip Length n/a 15.4 Quality of Service Average Headway (minutes) n/a n/aWeekday Span of Service (hours) n/a 18.3 Cost Efficiency Operating Expense per Revenue Mile n/a n/aOperating Expense per Revenue Hour n/a n/aOperating Revenue per Operating Expense n/a n/aPassenger Trips per Employee FTE n/a n/a Cost Effectiveness Operating Expense per Passenger Trip n/a n/aOperating Expense per Passenger Mile n/a n/aOperating Expense per Capita n/a n/aFarebox Recovery Ratio n/a n/aAverage Fare n/a n/a Service Effectiveness Passenger Trips per Revenue Mile n/a n/aPassenger Trips per Revenue Hour n/a n/aPassenger Trips per Capita n/a 0.67Revenue Miles Between Safety Incidents n/a n/aRevenue Miles Between Failures n/a n/a
37Florida TransiT Handbook 2015
SunTran (Ocala/Marion)
Ms. Gennie Garcia, General Manager1805 NE 30th Avenue, Building 900, Ocala, FL 34470(352) 401-6999 www.suntran.org
SunTran is governed by the Ocala/Marion MPO and provides purchased fixed-route motor-bus services on six routes in Ocala and Silver Springs Shores. Contracted demand-response services are also provided. 2013 and 2014 data for SunTran’s motorbus services are shown below. If an agency has zero safety incidents, revenue miles between safety incidents in n/a.
General Information 2013 2014Service Area Population 64,655 64,655Service Area Population Density 1,175.5 1,175.5Operating Expense $2,259,112 $2,419,203Operating Revenue $331,242 $388,684 Service Supplied Total Annual Revenue Miles 433,749 487,296Total Annual Revenue Hours 27,804 31,065Total Revenue Vehicles 9 9Peak Vehicles 6 6Route Miles 143.5 143.5 Service Usage Annual Passenger Trips 422,528 436,063Annual Passenger Miles 2,156,095 2,352,254Average Trip Length 5.1 5.4 Quality of Service Average Headway (minutes) 91.99 91.48Weekday Span of Service (hours) 15.3 24.0 Cost Efficiency Operating Expense per Revenue Mile $5.21 $4.96Operating Expense per Revenue Hour $81.25 $77.88Operating Revenue per Operating Expense 14.66% 16.07%Passenger Trips per Employee FTE n/a n/a Cost Effectiveness Operating Expense per Passenger Trip $5.35 $5.55Operating Expense per Passenger Mile $1.05 $1.03Operating Expense per Capita $34.94 $37.42Farebox Recovery Ratio 14.66% 14.69%Average Fare $0.78 $0.81 Service Effectiveness Passenger Trips per Revenue Mile 0.97 0.89Passenger Trips per Revenue Hour 15.20 14.04Passenger Trips per Capita 6.54 6.74Revenue Miles Between Safety Incidents n/a n/aRevenue Miles Between Failures 5,861 4,641
38 Florida department oF transportation
The Bus (Hernando County Transit)
Ms. Vera Matthews, General Manager1525 East Jefferson Avenue, Brooksville, FL 34601 (352) 754-4444www.hernandobus.com
The County contracts with Trans-Hernando to operate THE Bus, Hernando County’s fixed-route transportation service. Trans-Hernando reports to the Metropolitan Planning Organization and a five-member Board of County Commissioners. The transit system provides fixed-route transit service to the city of Brooksville and Spring Hill, with a shuttle connecting the two areas. Trans-Hernando Para-Transit also provides demand-response service throughout Hernando County. 2013 and 2014 data representing THE Bus’s fixed-route motorbus service are shown below. The County received a reporting waiver from FTA in 2014 and did not report passenger miles. Passenger miles for 2014 were estimating using average trip length from 2013 and passenger trips from 2014.
General Information 2013 2014Service Area Population 86,848 87,136Service Area Population Density 1,378.5 1,383.1Operating Expense $810,769 $843,282Operating Revenue $119,002 $111,586 Service Supplied Total Annual Revenue Miles 206,983 225,165Total Annual Revenue Hours 11,613 12,459Total Revenue Vehicles 8 8Peak Vehicles 4 4Route Miles 60.2 60.2 Service Usage Annual Passenger Trips 82,770 89,640Annual Passenger Miles 521,451 564,732Average Trip Length 6.3 6.3 Quality of Service Average Headway (minutes) 50.66 49.97Weekday Span of Service (hours) 12.5 12.5 Cost Efficiency Operating Expense per Revenue Mile $3.92 $3.75Operating Expense per Revenue Hour $69.82 $67.68Operating Revenue per Operating Expense 14.68% 13.23%Passenger Trips per Employee FTE n/a n/a Cost Effectiveness Operating Expense per Passenger Trip $9.80 $9.41Operating Expense per Passenger Mile $1.55 $1.49Operating Expense per Capita $9.34 $9.68Farebox Recovery Ratio 7.32% 8.08%Average Fare $0.72 $0.76 Service Effectiveness Passenger Trips per Revenue Mile 0.40 0.40Passenger Trips per Revenue Hour 7.13 7.19Passenger Trips per Capita 0.95 1.03Revenue Miles Between Safety Incidents n/a n/aRevenue Miles Between Failures n/a n/a
39Florida TransiT Handbook 2015
Volusia County (VOTRAN)
Mr. Steve Sherrer, General Manager950 Big Tree Road, South Daytona, FL 32119(386) 756-7496www.votran.org
VOTRAN is a part of Volusia County’s General Fund. It is governed by a Board of Directors that is comprised of seven County Council members. VOTRAN provides public transpor-tation services throughout Volusia County via fixed-route motorbus services, paratransit services, and vanpool services. 2013 and 2014 data for VOTRAN’s motorbus and vanpool services are shown below.
General Information 2013 2014Service Area Population 468,670 494,593Service Area Population Density 388.3 409.8Operating Expense $11,983,651 $13,107,723Operating Revenue $3,054,271 $3,385,055 Service Supplied Total Annual Revenue Miles 2,579,883 2,661,492Total Annual Revenue Hours 158,981 166,808Total Revenue Vehicles 74 77Peak Vehicles 57 60Route Miles 525.0 599.0 Service Usage Annual Passenger Trips 3,754,713 3,746,922Annual Passenger Miles 15,680,646 15,596,252Average Trip Length 4.2 4.2 Quality of Service Average Headway (minutes) 40.44 41.71Weekday Span of Service (hours) 18.0 18.0 Cost Efficiency Operating Expense per Revenue Mile $4.65 $4.92Operating Expense per Revenue Hour $75.38 $78.58Operating Revenue per Operating Expense 25.49% 25.82%Passenger Trips per Employee FTE 27,433 27,088 Cost Effectiveness Operating Expense per Passenger Trip $3.19 $3.50Operating Expense per Passenger Mile $0.76 $0.84Operating Expense per Capita $25.57 $26.50Farebox Recovery Ratio 21.88% 21.02%Average Fare $0.70 $0.74 Service Effectiveness Passenger Trips per Revenue Mile 1.46 1.41Passenger Trips per Revenue Hour 23.62 22.46Passenger Trips per Capita 8.01 7.58Revenue Miles Between Safety Incidents 171,992 241,954Revenue Miles Between Failures 4,591 4,597
40 Florida department oF transportation
Charlotte County Transit Division
Mr. Gordon Burger, Director25490 Airport Rd. Punta Gorda, FL 33950(941) 575-4000www.charlottecountyfl.gov
In addition to Florida’s 30 urban fixed-route transit systems, the 2014 statewide totals pre-sented on page 10 also contain data for two separate vanpool operators, Charlotte County and the Tampa Bay Area Regional Transportation Authority (TBARTA). 2014 data for these two vanpool services are shown below. If an agency has zero safety incidents, revenue miles between safety incidents in n/a.
Tampa Bay Area Regional Transportation Authority (TBARTA)
Mr. Ramond Chiaramonte, Executive Director4350 W. Cypress Street
Suite 700 Tampa, FL 33607
(813) 282-8200www.tbarta.com
General Information Charlotte County TBARTAService Area Population 169,541 2,395,997Service Area Population Density 733.9 938.1Operating Expense $174,882 $1,041,020Operating Revenue $26,915 $481,614 Service Supplied Total Annual Revenue Miles 65,514 1,342,471Total Annual Revenue Hours 2,252 51,068Total Revenue Vehicles 6 93Peak Vehicles 6 93Route Miles n/a n/a Service Usage Annual Passenger Trips 11,477 205,280Annual Passenger Miles 197,328 6,961,152Average Trip Length 17.2 33.9 Quality of Service Average Headway (minutes) n/a n/aWeekday Span of Service (hours) n/a n/a Cost Efficiency Operating Expense Per Revenue Mile $2.67 $0.78Operating Expense Per Revenue Hour $77.66 $20.38Operating Revenue Per Operating Expense 15.39% 46.26%Passenger Trips Per Employee FTE 7,588 n/a Cost Effectiveness Operating Expense Per Passenger Trip $15.24 $5.07Operating Expense Per Passenger Mile $0.89 $0.15Operating Expense Per Capita $1.03 $0.43Farebox Recovery Ratio n/a 46.26%Average Fare n/a $2.35 Service Effectiveness Passenger Trips Per Revenue Mile 0.18 0.15Passenger Trips Per Revenue Hour 5.10 4.02Passenger Trips Per Capita 0.07 0.09Revenue Miles Between Safety Incidents n/a n/aRevenue Miles Between Failures 65,514 74,582

41F
lor
ida T
ra
nsiT H
an
dbo
ok 2015
Service Area Service Area System Population Population Density
Operating Expense Operating Revenue
2013 2014 2013 2014 2013 2014 2013 2014
Bay Town Trolley 105,192 105,192 1,813.7 1,813.7 $2,862,428 $2,176,644 $562,733 $618,074Broward County Transit 1,815,137 1,838,844 4,427.2 4,485.0 $110,171,010 $115,898,030 $35,236,699 $38,227,326Collier Area Transit 323,785 323,785 162.1 159.9 $5,670,517 $6,524,735 $1,247,262 $1,215,109Council on Aging of St. Lucie, Inc. 283,866 283,866 496.3 496.3 $1,527,426 $1,544,934 $224,043 $241,271Escambia County Area Transit 341,765 341,765 1,448.2 1,466.8 $8,276,841 $8,984,762 $1,875,371 $1,980,889Gainesville Regional Transit System 160,000 160,000 2,105.3 2,105.3 $21,416,671 $22,633,015 $14,181,638 $15,215,898Hillsborough Area Regional Transit 822,404 875,598 3,384.4 3,433.7 $60,097,076 $63,270,537 $15,897,203 $17,426,797Indian River (GoLine) 143,696 143,696 665.3 665.3 $1,930,451 $2,474,869 $22,356 $11,617Jacksonville Transportation Authority 827,481 985,050 1,915.5 1,231.3 $69,271,094 $72,528,324 $12,725,182 $12,389,863Lake County Public Transp. (LakeXpress) 97,497 97,497 1,373.2 1,373.2 $2,188,413 $2,114,801 $208,414 $223,370Lakeland Area Mass Transit District 145,000 145,000 1,883.1 1,883.1 $6,050,994 $7,498,552 $1,882,611 $1,633,457Lee County Transit 463,224 470,588 3,563.3 3,619.9 $15,703,160 $15,764,030 $3,889,080 $4,697,956LYNX 1,920,488 1,959,812 756.7 772.2 $95,016,662 $95,330,587 $31,087,896 $31,040,036Manatee County Area Transit 322,833 322,833 434.5 434.5 $7,780,717 $8,056,800 $1,344,801 $1,051,574Martin County 146,000 146,000 262.6 206.8 $528,699 $797,155 $14,377 $38,606Miami-Dade Transit 2,496,435 2,496,435 8,158.3 8,158.3 $406,683,473 $442,428,104 $123,101,909 $133,841,886Okaloosa County (EC Rider) 180,822 191,917 904.1 1,599.3 $1,147,002 $1,304,876 $130,985 $223,708Palm Beach County Transportation Agency 1,268,782 1,268,782 3,476.1 3,476.1 $49,208,481 $52,551,544 $10,056,639 $12,097,212Pasco County Public Transportation 470,391 475,502 631.4 638.3 $4,329,729 $4,685,978 $1,079,224 $1,038,121Pinellas Suncoast Transit Authority 922,616 850,758 3,796.8 2,444.7 $54,593,048 $57,180,605 $15,006,464 $14,371,863Polk County Transit Services Division 153,924 201,289 3,206.8 4,193.5 $2,850,578 $1,007,810 $275,327 $111,984St. Johns County (The Sunshine Bus Co.) 195,823 195,823 326.4 326.4 $1,026,566 $932,598 $100,327 $165,181Sarasota County Area Transit 388,474 388,559 1,823.8 1,726.9 $14,951,777 $17,099,475 $1,956,351 $1,953,748S. Florida Regional Transportation Authority 5,502,379 5,502,379 4,444.6 4,444.6 $61,063,954 $68,267,317 $12,715,042 $13,366,453Space Coast Area Transit 554,354 554,354 1,283.2 2,115.9 $6,180,973 $7,388,743 $1,377,174 $1,669,237StarMetro (Tallahassee) 162,310 162,310 1,591.3 1,591.3 $14,688,727 $12,832,773 $4,510,707 $4,736,729SunRail (FL Department of Transportation) n/a 255,483 n/a 2,322.6 n/a n/a n/a n/aSunTran (Ocala) 64,655 64,655 1,175.5 1,175.5 $2,259,112 $2,419,203 $331,242 $388,684The Bus (Hernando County Transit) 86,848 87,136 1,378.5 1,383.1 $810,769 $843,282 $119,002 $111,586Volusia County (VOTRAN) 468,670 494,593 388.3 409.8 $11,983,651 $13,107,723 $3,054,271 $3,385,055
Florida Transit System Summary – 2013 & 2014
The data shown in this table represent closed-out, validated numbers as of September 2015. However, it is possible that some figures may be updated in the subsequent reporting year.
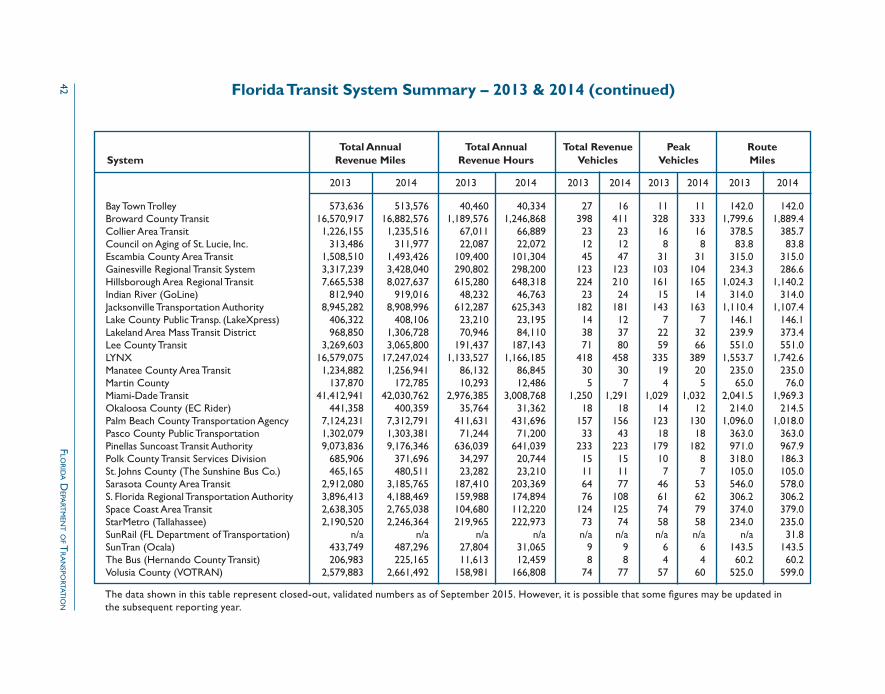
42 F
lor
ida d
epart
men
t oF t
ra
nspo
rtatio
n
Total Annual Total Annual Total Revenue Peak RouteSystem Revenue Miles Revenue Hours Vehicles Vehicles Miles
2013 2014 2013 2014 2013 2014 2013 2014 2013 2014
Bay Town Trolley 573,636 513,576 40,460 40,334 27 16 11 11 142.0 142.0Broward County Transit 16,570,917 16,882,576 1,189,576 1,246,868 398 411 328 333 1,799.6 1,889.4Collier Area Transit 1,226,155 1,235,516 67,011 66,889 23 23 16 16 378.5 385.7Council on Aging of St. Lucie, Inc. 313,486 311,977 22,087 22,072 12 12 8 8 83.8 83.8Escambia County Area Transit 1,508,510 1,493,426 109,400 101,304 45 47 31 31 315.0 315.0Gainesville Regional Transit System 3,317,239 3,428,040 290,802 298,200 123 123 103 104 234.3 286.6Hillsborough Area Regional Transit 7,665,538 8,027,637 615,280 648,318 224 210 161 165 1,024.3 1,140.2Indian River (GoLine) 812,940 919,016 48,232 46,763 23 24 15 14 314.0 314.0Jacksonville Transportation Authority 8,945,282 8,908,996 612,287 625,343 182 181 143 163 1,110.4 1,107.4Lake County Public Transp. (LakeXpress) 406,322 408,106 23,210 23,195 14 12 7 7 146.1 146.1Lakeland Area Mass Transit District 968,850 1,306,728 70,946 84,110 38 37 22 32 239.9 373.4Lee County Transit 3,269,603 3,065,800 191,437 187,143 71 80 59 66 551.0 551.0LYNX 16,579,075 17,247,024 1,133,527 1,166,185 418 458 335 389 1,553.7 1,742.6Manatee County Area Transit 1,234,882 1,256,941 86,132 86,845 30 30 19 20 235.0 235.0Martin County 137,870 172,785 10,293 12,486 5 7 4 5 65.0 76.0Miami-Dade Transit 41,412,941 42,030,762 2,976,385 3,008,768 1,250 1,291 1,029 1,032 2,041.5 1,969.3Okaloosa County (EC Rider) 441,358 400,359 35,764 31,362 18 18 14 12 214.0 214.5Palm Beach County Transportation Agency 7,124,231 7,312,791 411,631 431,696 157 156 123 130 1,096.0 1,018.0Pasco County Public Transportation 1,302,079 1,303,381 71,244 71,200 33 43 18 18 363.0 363.0Pinellas Suncoast Transit Authority 9,073,836 9,176,346 636,039 641,039 233 223 179 182 971.0 967.9Polk County Transit Services Division 685,906 371,696 34,297 20,744 15 15 10 8 318.0 186.3St. Johns County (The Sunshine Bus Co.) 465,165 480,511 23,282 23,210 11 11 7 7 105.0 105.0Sarasota County Area Transit 2,912,080 3,185,765 187,410 203,369 64 77 46 53 546.0 578.0S. Florida Regional Transportation Authority 3,896,413 4,188,469 159,988 174,894 76 108 61 62 306.2 306.2Space Coast Area Transit 2,638,305 2,765,038 104,680 112,220 124 125 74 79 374.0 379.0StarMetro (Tallahassee) 2,190,520 2,246,364 219,965 222,973 73 74 58 58 234.0 235.0SunRail (FL Department of Transportation) n/a n/a n/a n/a n/a n/a n/a n/a n/a 31.8SunTran (Ocala) 433,749 487,296 27,804 31,065 9 9 6 6 143.5 143.5The Bus (Hernando County Transit) 206,983 225,165 11,613 12,459 8 8 4 4 60.2 60.2Volusia County (VOTRAN) 2,579,883 2,661,492 158,981 166,808 74 77 57 60 525.0 599.0
Florida Transit System Summary – 2013 & 2014 (continued)
The data shown in this table represent closed-out, validated numbers as of September 2015. However, it is possible that some figures may be updated in the subsequent reporting year.
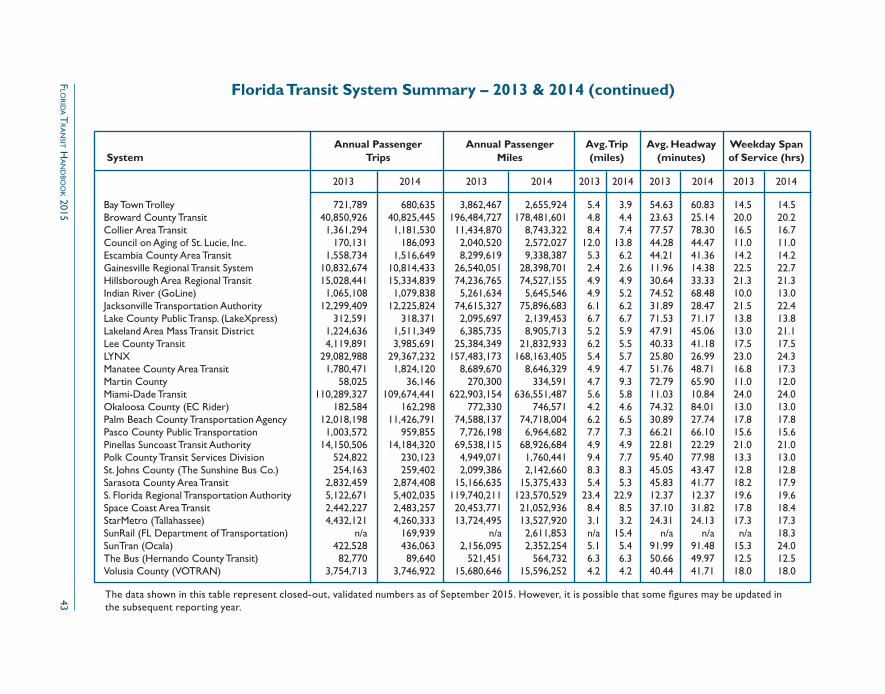
43F
lor
ida T
ra
nsiT H
an
dbo
ok 2015
Annual Passenger Annual Passenger Avg. Trip Avg. Headway Weekday SpanSystem Trips Miles (miles) (minutes) of Service (hrs)
2013 2014 2013 2014 2013 2014 2013 2014 2013 2014
Bay Town Trolley 721,789 680,635 3,862,467 2,655,924 5.4 3.9 54.63 60.83 14.5 14.5Broward County Transit 40,850,926 40,825,445 196,484,727 178,481,601 4.8 4.4 23.63 25.14 20.0 20.2Collier Area Transit 1,361,294 1,181,530 11,434,870 8,743,322 8.4 7.4 77.57 78.30 16.5 16.7Council on Aging of St. Lucie, Inc. 170,131 186,093 2,040,520 2,572,027 12.0 13.8 44.28 44.47 11.0 11.0Escambia County Area Transit 1,558,734 1,516,649 8,299,619 9,338,387 5.3 6.2 44.21 41.36 14.2 14.2Gainesville Regional Transit System 10,832,674 10,814,433 26,540,051 28,398,701 2.4 2.6 11.96 14.38 22.5 22.7Hillsborough Area Regional Transit 15,028,441 15,334,839 74,236,765 74,527,155 4.9 4.9 30.64 33.33 21.3 21.3Indian River (GoLine) 1,065,108 1,079,838 5,261,634 5,645,546 4.9 5.2 74.52 68.48 10.0 13.0Jacksonville Transportation Authority 12,299,409 12,225,824 74,615,327 75,896,683 6.1 6.2 31.89 28.47 21.5 22.4Lake County Public Transp. (LakeXpress) 312,591 318,371 2,095,697 2,139,453 6.7 6.7 71.53 71.17 13.8 13.8Lakeland Area Mass Transit District 1,224,636 1,511,349 6,385,735 8,905,713 5.2 5.9 47.91 45.06 13.0 21.1Lee County Transit 4,119,891 3,985,691 25,384,349 21,832,933 6.2 5.5 40.33 41.18 17.5 17.5LYNX 29,082,988 29,367,232 157,483,173 168,163,405 5.4 5.7 25.80 26.99 23.0 24.3Manatee County Area Transit 1,780,471 1,824,120 8,689,670 8,646,329 4.9 4.7 51.76 48.71 16.8 17.3Martin County 58,025 36,146 270,300 334,591 4.7 9.3 72.79 65.90 11.0 12.0Miami-Dade Transit 110,289,327 109,674,441 622,903,154 636,551,487 5.6 5.8 11.03 10.84 24.0 24.0Okaloosa County (EC Rider) 182,584 162,298 772,330 746,571 4.2 4.6 74.32 84.01 13.0 13.0Palm Beach County Transportation Agency 12,018,198 11,426,791 74,588,137 74,718,004 6.2 6.5 30.89 27.74 17.8 17.8Pasco County Public Transportation 1,003,572 959,855 7,726,198 6,964,682 7.7 7.3 66.21 66.10 15.6 15.6Pinellas Suncoast Transit Authority 14,150,506 14,184,320 69,538,115 68,926,684 4.9 4.9 22.81 22.29 21.0 21.0Polk County Transit Services Division 524,822 230,123 4,949,071 1,760,441 9.4 7.7 95.40 77.98 13.3 13.0St. Johns County (The Sunshine Bus Co.) 254,163 259,402 2,099,386 2,142,660 8.3 8.3 45.05 43.47 12.8 12.8Sarasota County Area Transit 2,832,459 2,874,408 15,166,635 15,375,433 5.4 5.3 45.83 41.77 18.2 17.9S. Florida Regional Transportation Authority 5,122,671 5,402,035 119,740,211 123,570,529 23.4 22.9 12.37 12.37 19.6 19.6Space Coast Area Transit 2,442,227 2,483,257 20,453,771 21,052,936 8.4 8.5 37.10 31.82 17.8 18.4StarMetro (Tallahassee) 4,432,121 4,260,333 13,724,495 13,527,920 3.1 3.2 24.31 24.13 17.3 17.3SunRail (FL Department of Transportation) n/a 169,939 n/a 2,611,853 n/a 15.4 n/a n/a n/a 18.3SunTran (Ocala) 422,528 436,063 2,156,095 2,352,254 5.1 5.4 91.99 91.48 15.3 24.0The Bus (Hernando County Transit) 82,770 89,640 521,451 564,732 6.3 6.3 50.66 49.97 12.5 12.5Volusia County (VOTRAN) 3,754,713 3,746,922 15,680,646 15,596,252 4.2 4.2 40.44 41.71 18.0 18.0
Florida Transit System Summary – 2013 & 2014 (continued)
The data shown in this table represent closed-out, validated numbers as of September 2015. However, it is possible that some figures may be updated in the subsequent reporting year.
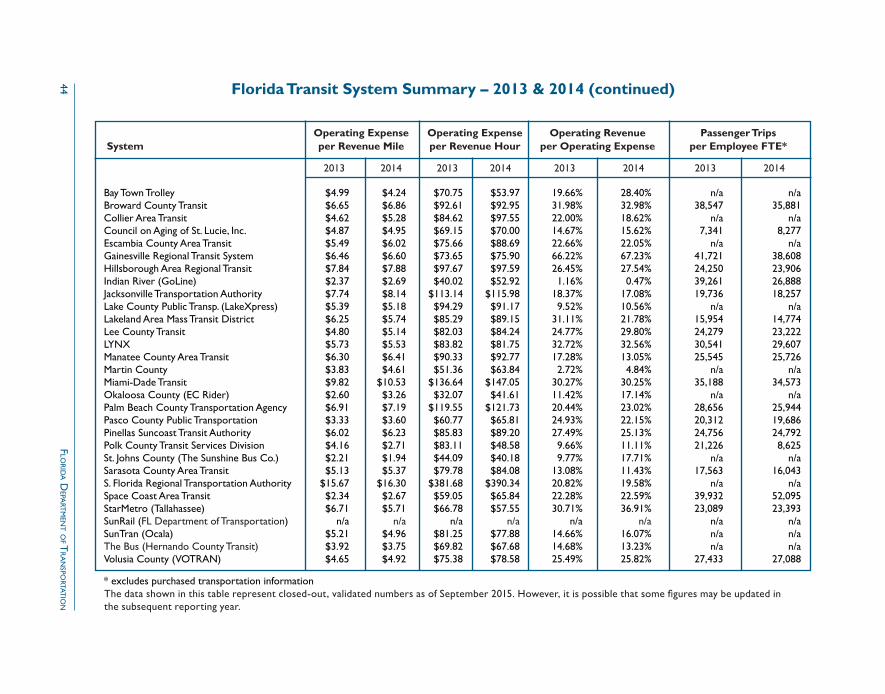
44 F
lor
ida d
epart
men
t oF t
ra
nspo
rtatio
n
Operating Expense Operating Expense Operating Revenue Passenger TripsSystem per Revenue Mile per Revenue Hour per Operating Expense per Employee FTE*
2013 2014 2013 2014 2013 2014 2013 2014
Bay Town Trolley $4.99 $4.24 $70.75 $53.97 19.66% 28.40% n/a n/aBroward County Transit $6.65 $6.86 $92.61 $92.95 31.98% 32.98% 38,547 35,881Collier Area Transit $4.62 $5.28 $84.62 $97.55 22.00% 18.62% n/a n/aCouncil on Aging of St. Lucie, Inc. $4.87 $4.95 $69.15 $70.00 14.67% 15.62% 7,341 8,277Escambia County Area Transit $5.49 $6.02 $75.66 $88.69 22.66% 22.05% n/a n/aGainesville Regional Transit System $6.46 $6.60 $73.65 $75.90 66.22% 67.23% 41,721 38,608Hillsborough Area Regional Transit $7.84 $7.88 $97.67 $97.59 26.45% 27.54% 24,250 23,906Indian River (GoLine) $2.37 $2.69 $40.02 $52.92 1.16% 0.47% 39,261 26,888Jacksonville Transportation Authority $7.74 $8.14 $113.14 $115.98 18.37% 17.08% 19,736 18,257Lake County Public Transp. (LakeXpress) $5.39 $5.18 $94.29 $91.17 9.52% 10.56% n/a n/aLakeland Area Mass Transit District $6.25 $5.74 $85.29 $89.15 31.11% 21.78% 15,954 14,774Lee County Transit $4.80 $5.14 $82.03 $84.24 24.77% 29.80% 24,279 23,222LYNX $5.73 $5.53 $83.82 $81.75 32.72% 32.56% 30,541 29,607Manatee County Area Transit $6.30 $6.41 $90.33 $92.77 17.28% 13.05% 25,545 25,726Martin County $3.83 $4.61 $51.36 $63.84 2.72% 4.84% n/a n/aMiami-Dade Transit $9.82 $10.53 $136.64 $147.05 30.27% 30.25% 35,188 34,573Okaloosa County (EC Rider) $2.60 $3.26 $32.07 $41.61 11.42% 17.14% n/a n/aPalm Beach County Transportation Agency $6.91 $7.19 $119.55 $121.73 20.44% 23.02% 28,656 25,944Pasco County Public Transportation $3.33 $3.60 $60.77 $65.81 24.93% 22.15% 20,312 19,686Pinellas Suncoast Transit Authority $6.02 $6.23 $85.83 $89.20 27.49% 25.13% 24,756 24,792Polk County Transit Services Division $4.16 $2.71 $83.11 $48.58 9.66% 11.11% 21,226 8,625St. Johns County (The Sunshine Bus Co.) $2.21 $1.94 $44.09 $40.18 9.77% 17.71% n/a n/aSarasota County Area Transit $5.13 $5.37 $79.78 $84.08 13.08% 11.43% 17,563 16,043S. Florida Regional Transportation Authority $15.67 $16.30 $381.68 $390.34 20.82% 19.58% n/a n/aSpace Coast Area Transit $2.34 $2.67 $59.05 $65.84 22.28% 22.59% 39,932 52,095StarMetro (Tallahassee) $6.71 $5.71 $66.78 $57.55 30.71% 36.91% 23,089 23,393SunRail (FL Department of Transportation) n/a n/a n/a n/a n/a n/a n/a n/aSunTran (Ocala) $5.21 $4.96 $81.25 $77.88 14.66% 16.07% n/a n/aThe Bus (Hernando County Transit) $3.92 $3.75 $69.82 $67.68 14.68% 13.23% n/a n/aVolusia County (VOTRAN) $4.65 $4.92 $75.38 $78.58 25.49% 25.82% 27,433 27,088
Florida Transit System Summary – 2013 & 2014 (continued)
* excludes purchased transportation informationThe data shown in this table represent closed-out, validated numbers as of September 2015. However, it is possible that some figures may be updated in the subsequent reporting year.
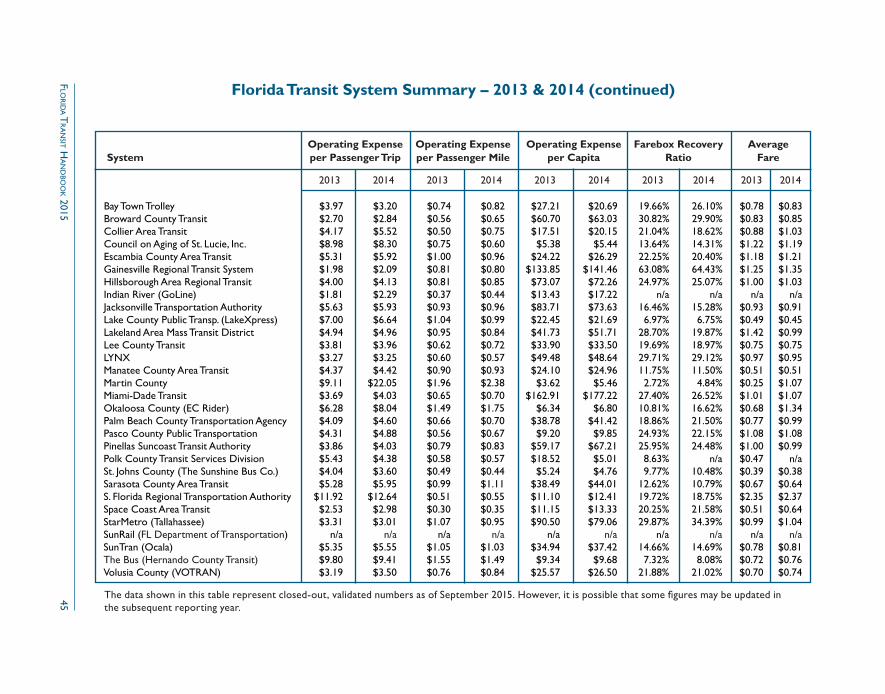
45F
lor
ida T
ra
nsiT H
an
dbo
ok 2015
Operating Expense Operating Expense Operating Expense Farebox Recovery AverageSystem per Passenger Trip per Passenger Mile per Capita Ratio Fare
2013 2014 2013 2014 2013 2014 2013 2014 2013 2014
Bay Town Trolley $3.97 $3.20 $0.74 $0.82 $27.21 $20.69 19.66% 26.10% $0.78 $0.83Broward County Transit $2.70 $2.84 $0.56 $0.65 $60.70 $63.03 30.82% 29.90% $0.83 $0.85Collier Area Transit $4.17 $5.52 $0.50 $0.75 $17.51 $20.15 21.04% 18.62% $0.88 $1.03Council on Aging of St. Lucie, Inc. $8.98 $8.30 $0.75 $0.60 $5.38 $5.44 13.64% 14.31% $1.22 $1.19Escambia County Area Transit $5.31 $5.92 $1.00 $0.96 $24.22 $26.29 22.25% 20.40% $1.18 $1.21Gainesville Regional Transit System $1.98 $2.09 $0.81 $0.80 $133.85 $141.46 63.08% 64.43% $1.25 $1.35Hillsborough Area Regional Transit $4.00 $4.13 $0.81 $0.85 $73.07 $72.26 24.97% 25.07% $1.00 $1.03Indian River (GoLine) $1.81 $2.29 $0.37 $0.44 $13.43 $17.22 n/a n/a n/a n/aJacksonville Transportation Authority $5.63 $5.93 $0.93 $0.96 $83.71 $73.63 16.46% 15.28% $0.93 $0.91Lake County Public Transp. (LakeXpress) $7.00 $6.64 $1.04 $0.99 $22.45 $21.69 6.97% 6.75% $0.49 $0.45Lakeland Area Mass Transit District $4.94 $4.96 $0.95 $0.84 $41.73 $51.71 28.70% 19.87% $1.42 $0.99Lee County Transit $3.81 $3.96 $0.62 $0.72 $33.90 $33.50 19.69% 18.97% $0.75 $0.75LYNX $3.27 $3.25 $0.60 $0.57 $49.48 $48.64 29.71% 29.12% $0.97 $0.95Manatee County Area Transit $4.37 $4.42 $0.90 $0.93 $24.10 $24.96 11.75% 11.50% $0.51 $0.51Martin County $9.11 $22.05 $1.96 $2.38 $3.62 $5.46 2.72% 4.84% $0.25 $1.07Miami-Dade Transit $3.69 $4.03 $0.65 $0.70 $162.91 $177.22 27.40% 26.52% $1.01 $1.07Okaloosa County (EC Rider) $6.28 $8.04 $1.49 $1.75 $6.34 $6.80 10.81% 16.62% $0.68 $1.34Palm Beach County Transportation Agency $4.09 $4.60 $0.66 $0.70 $38.78 $41.42 18.86% 21.50% $0.77 $0.99Pasco County Public Transportation $4.31 $4.88 $0.56 $0.67 $9.20 $9.85 24.93% 22.15% $1.08 $1.08Pinellas Suncoast Transit Authority $3.86 $4.03 $0.79 $0.83 $59.17 $67.21 25.95% 24.48% $1.00 $0.99Polk County Transit Services Division $5.43 $4.38 $0.58 $0.57 $18.52 $5.01 8.63% n/a $0.47 n/aSt. Johns County (The Sunshine Bus Co.) $4.04 $3.60 $0.49 $0.44 $5.24 $4.76 9.77% 10.48% $0.39 $0.38Sarasota County Area Transit $5.28 $5.95 $0.99 $1.11 $38.49 $44.01 12.62% 10.79% $0.67 $0.64S. Florida Regional Transportation Authority $11.92 $12.64 $0.51 $0.55 $11.10 $12.41 19.72% 18.75% $2.35 $2.37Space Coast Area Transit $2.53 $2.98 $0.30 $0.35 $11.15 $13.33 20.25% 21.58% $0.51 $0.64StarMetro (Tallahassee) $3.31 $3.01 $1.07 $0.95 $90.50 $79.06 29.87% 34.39% $0.99 $1.04SunRail (FL Department of Transportation) n/a n/a n/a n/a n/a n/a n/a n/a n/a n/aSunTran (Ocala) $5.35 $5.55 $1.05 $1.03 $34.94 $37.42 14.66% 14.69% $0.78 $0.81The Bus (Hernando County Transit) $9.80 $9.41 $1.55 $1.49 $9.34 $9.68 7.32% 8.08% $0.72 $0.76Volusia County (VOTRAN) $3.19 $3.50 $0.76 $0.84 $25.57 $26.50 21.88% 21.02% $0.70 $0.74
Florida Transit System Summary – 2013 & 2014 (continued)
The data shown in this table represent closed-out, validated numbers as of September 2015. However, it is possible that some figures may be updated in the subsequent reporting year.
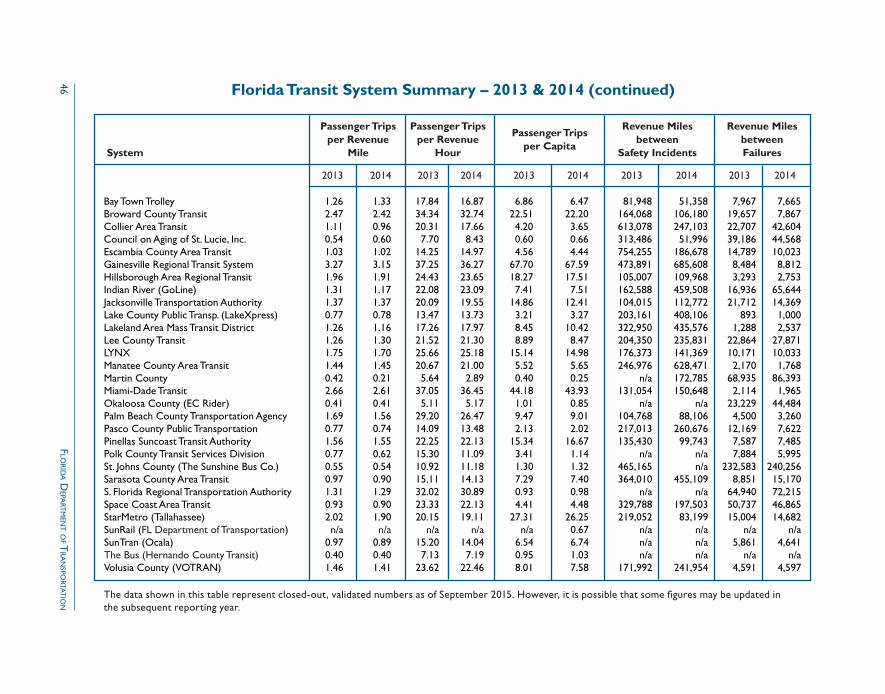
46 F
lor
ida d
epart
men
t oF t
ra
nspo
rtatio
n
Passenger Trips Passenger Trips Revenue Miles Revenue Miles per Revenue per Revenue Passenger Trips between between System Mile Hour per Capita Safety Incidents Failures
2013 2014 2013 2014 2013 2014 2013 2014 2013 2014
Bay Town Trolley 1.26 1.33 17.84 16.87 6.86 6.47 81,948 51,358 7,967 7,665Broward County Transit 2.47 2.42 34.34 32.74 22.51 22.20 164,068 106,180 19,657 7,867Collier Area Transit 1.11 0.96 20.31 17.66 4.20 3.65 613,078 247,103 22,707 42,604Council on Aging of St. Lucie, Inc. 0.54 0.60 7.70 8.43 0.60 0.66 313,486 51,996 39,186 44,568Escambia County Area Transit 1.03 1.02 14.25 14.97 4.56 4.44 754,255 186,678 14,789 10,023Gainesville Regional Transit System 3.27 3.15 37.25 36.27 67.70 67.59 473,891 685,608 8,484 8,812Hillsborough Area Regional Transit 1.96 1.91 24.43 23.65 18.27 17.51 105,007 109,968 3,293 2,753Indian River (GoLine) 1.31 1.17 22.08 23.09 7.41 7.51 162,588 459,508 16,936 65,644Jacksonville Transportation Authority 1.37 1.37 20.09 19.55 14.86 12.41 104,015 112,772 21,712 14,369Lake County Public Transp. (LakeXpress) 0.77 0.78 13.47 13.73 3.21 3.27 203,161 408,106 893 1,000Lakeland Area Mass Transit District 1.26 1.16 17.26 17.97 8.45 10.42 322,950 435,576 1,288 2,537Lee County Transit 1.26 1.30 21.52 21.30 8.89 8.47 204,350 235,831 22,864 27,871LYNX 1.75 1.70 25.66 25.18 15.14 14.98 176,373 141,369 10,171 10,033Manatee County Area Transit 1.44 1.45 20.67 21.00 5.52 5.65 246,976 628,471 2,170 1,768Martin County 0.42 0.21 5.64 2.89 0.40 0.25 n/a 172,785 68,935 86,393Miami-Dade Transit 2.66 2.61 37.05 36.45 44.18 43.93 131,054 150,648 2,114 1,965Okaloosa County (EC Rider) 0.41 0.41 5.11 5.17 1.01 0.85 n/a n/a 23,229 44,484Palm Beach County Transportation Agency 1.69 1.56 29.20 26.47 9.47 9.01 104,768 88,106 4,500 3,260Pasco County Public Transportation 0.77 0.74 14.09 13.48 2.13 2.02 217,013 260,676 12,169 7,622Pinellas Suncoast Transit Authority 1.56 1.55 22.25 22.13 15.34 16.67 135,430 99,743 7,587 7,485Polk County Transit Services Division 0.77 0.62 15.30 11.09 3.41 1.14 n/a n/a 7,884 5,995St. Johns County (The Sunshine Bus Co.) 0.55 0.54 10.92 11.18 1.30 1.32 465,165 n/a 232,583 240,256Sarasota County Area Transit 0.97 0.90 15.11 14.13 7.29 7.40 364,010 455,109 8,851 15,170S. Florida Regional Transportation Authority 1.31 1.29 32.02 30.89 0.93 0.98 n/a n/a 64,940 72,215Space Coast Area Transit 0.93 0.90 23.33 22.13 4.41 4.48 329,788 197,503 50,737 46,865StarMetro (Tallahassee) 2.02 1.90 20.15 19.11 27.31 26.25 219,052 83,199 15,004 14,682SunRail (FL Department of Transportation) n/a n/a n/a n/a n/a 0.67 n/a n/a n/a n/aSunTran (Ocala) 0.97 0.89 15.20 14.04 6.54 6.74 n/a n/a 5,861 4,641The Bus (Hernando County Transit) 0.40 0.40 7.13 7.19 0.95 1.03 n/a n/a n/a n/aVolusia County (VOTRAN) 1.46 1.41 23.62 22.46 8.01 7.58 171,992 241,954 4,591 4,597
Florida Transit System Summary – 2013 & 2014 (continued)
The data shown in this table represent closed-out, validated numbers as of September 2015. However, it is possible that some figures may be updated in the subsequent reporting year.
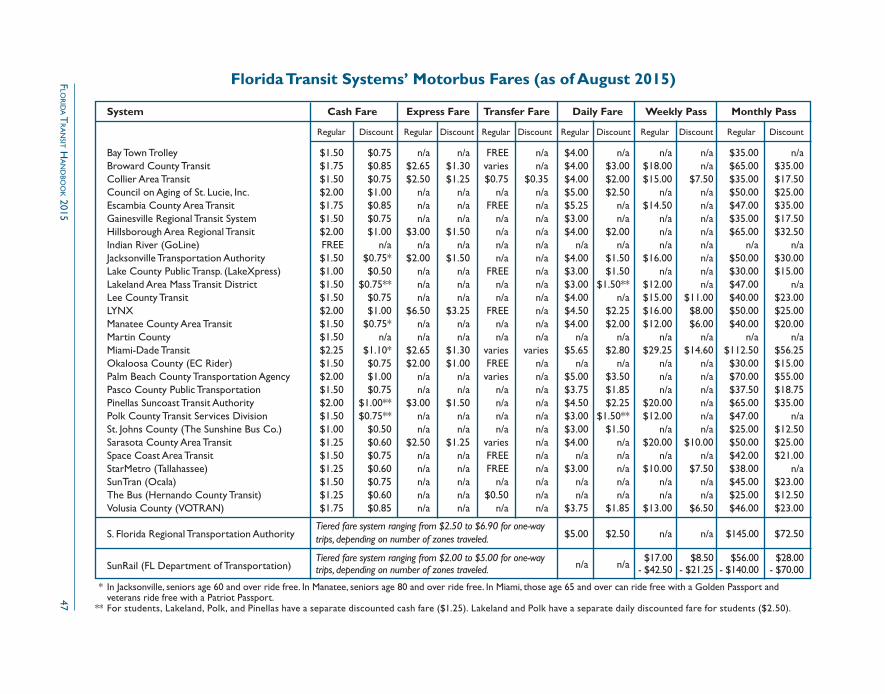
47F
lor
ida T
ra
nsiT H
an
dbo
ok 2015
System Cash Fare Express Fare Transfer Fare Daily Fare Weekly Pass Monthly Pass Regular Discount Regular Discount Regular Discount Regular Discount Regular Discount Regular Discount
Bay Town Trolley $1.50 $0.75 n/a n/a FREE n/a $4.00 n/a n/a n/a $35.00 n/aBroward County Transit $1.75 $0.85 $2.65 $1.30 varies n/a $4.00 $3.00 $18.00 n/a $65.00 $35.00 Collier Area Transit $1.50 $0.75 $2.50 $1.25 $0.75 $0.35 $4.00 $2.00 $15.00 $7.50 $35.00 $17.50 Council on Aging of St. Lucie, Inc. $2.00 $1.00 n/a n/a n/a n/a $5.00 $2.50 n/a n/a $50.00 $25.00 Escambia County Area Transit $1.75 $0.85 n/a n/a FREE n/a $5.25 n/a $14.50 n/a $47.00 $35.00 Gainesville Regional Transit System $1.50 $0.75 n/a n/a n/a n/a $3.00 n/a n/a n/a $35.00 $17.50 Hillsborough Area Regional Transit $2.00 $1.00 $3.00 $1.50 n/a n/a $4.00 $2.00 n/a n/a $65.00 $32.50 Indian River (GoLine) FREE n/a n/a n/a n/a n/a n/a n/a n/a n/a n/a n/aJacksonville Transportation Authority $1.50 $0.75* $2.00 $1.50 n/a n/a $4.00 $1.50 $16.00 n/a $50.00 $30.00 Lake County Public Transp. (LakeXpress) $1.00 $0.50 n/a n/a FREE n/a $3.00 $1.50 n/a n/a $30.00 $15.00 Lakeland Area Mass Transit District $1.50 $0.75** n/a n/a n/a n/a $3.00 $1.50** $12.00 n/a $47.00 n/aLee County Transit $1.50 $0.75 n/a n/a n/a n/a $4.00 n/a $15.00 $11.00 $40.00 $23.00 LYNX $2.00 $1.00 $6.50 $3.25 FREE n/a $4.50 $2.25 $16.00 $8.00 $50.00 $25.00 Manatee County Area Transit $1.50 $0.75* n/a n/a n/a n/a $4.00 $2.00 $12.00 $6.00 $40.00 $20.00 Martin County $1.50 n/a n/a n/a n/a n/a n/a n/a n/a n/a n/a n/aMiami-Dade Transit $2.25 $1.10* $2.65 $1.30 varies varies $5.65 $2.80 $29.25 $14.60 $112.50 $56.25 Okaloosa County (EC Rider) $1.50 $0.75 $2.00 $1.00 FREE n/a n/a n/a n/a n/a $30.00 $15.00 Palm Beach County Transportation Agency $2.00 $1.00 n/a n/a varies n/a $5.00 $3.50 n/a n/a $70.00 $55.00 Pasco County Public Transportation $1.50 $0.75 n/a n/a n/a n/a $3.75 $1.85 n/a n/a $37.50 $18.75 Pinellas Suncoast Transit Authority $2.00 $1.00** $3.00 $1.50 n/a n/a $4.50 $2.25 $20.00 n/a $65.00 $35.00 Polk County Transit Services Division $1.50 $0.75** n/a n/a n/a n/a $3.00 $1.50** $12.00 n/a $47.00 n/aSt. Johns County (The Sunshine Bus Co.) $1.00 $0.50 n/a n/a n/a n/a $3.00 $1.50 n/a n/a $25.00 $12.50 Sarasota County Area Transit $1.25 $0.60 $2.50 $1.25 varies n/a $4.00 n/a $20.00 $10.00 $50.00 $25.00 Space Coast Area Transit $1.50 $0.75 n/a n/a FREE n/a n/a n/a n/a n/a $42.00 $21.00 StarMetro (Tallahassee) $1.25 $0.60 n/a n/a FREE n/a $3.00 n/a $10.00 $7.50 $38.00 n/aSunTran (Ocala) $1.50 $0.75 n/a n/a n/a n/a n/a n/a n/a n/a $45.00 $23.00 The Bus (Hernando County Transit) $1.25 $0.60 n/a n/a $0.50 n/a n/a n/a n/a n/a $25.00 $12.50 Volusia County (VOTRAN) $1.75 $0.85 n/a n/a n/a n/a $3.75 $1.85 $13.00 $6.50 $46.00 $23.00
Florida Transit Systems’ Motorbus Fares (as of August 2015)
S. Florida Regional Transportation Authority Tiered fare system ranging from $2.50 to $6.90 for one-way
trips, depending on number of zones traveled. $5.00 $2.50 n/a n/a $145.00 $72.50
SunRail (FL Department of Transportation) Tiered fare system ranging from $2.00 to $5.00 for one-way
n/a
n/a $17.00 $8.50 $56.00 $28.00
trips, depending on number of zones traveled. - $42.50 - $21.25 - $140.00 - $70.00
* In Jacksonville, seniors age 60 and over ride free. In Manatee, seniors age 80 and over ride free. In Miami, those age 65 and over can ride free with a Golden Passport and veterans ride free with a Patriot Passport. ** For students, Lakeland, Polk, and Pinellas have a separate discounted cash fare ($1.25). Lakeland and Polk have a separate daily discounted fare for students ($2.50).
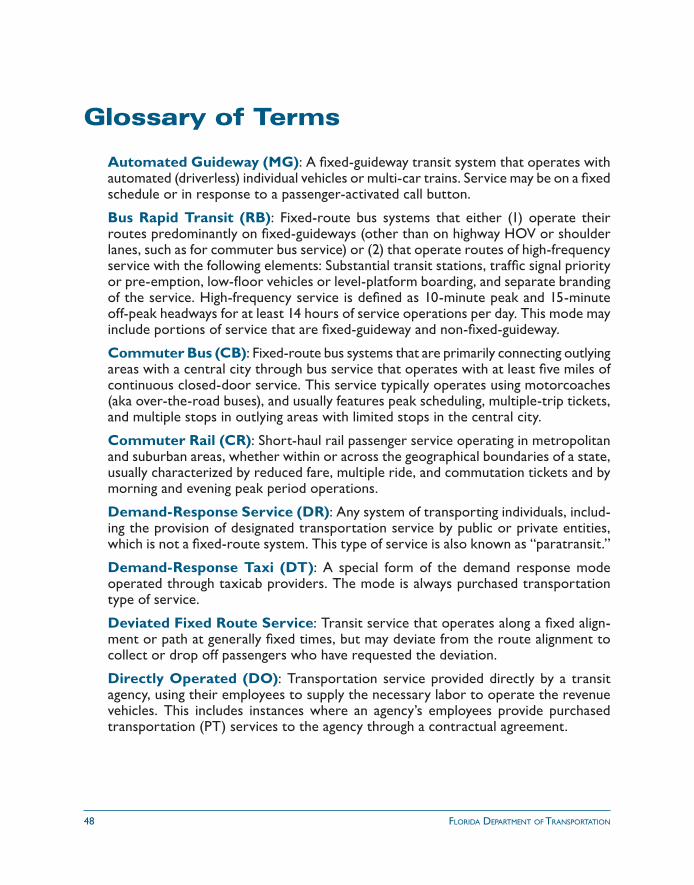
48 Florida department oF transportation
Glossary of Terms Automated Guideway (MG): A fixed-guideway transit system that operates with automated (driverless) individual vehicles or multi-car trains. Service may be on a fixed schedule or in response to a passenger-activated call button.
Bus Rapid Transit (RB): Fixed-route bus systems that either (1) operate their routes predominantly on fixed-guideways (other than on highway HOV or shoulder lanes, such as for commuter bus service) or (2) that operate routes of high-frequency service with the following elements: Substantial transit stations, traffic signal priority or pre-emption, low-floor vehicles or level-platform boarding, and separate branding of the service. High-frequency service is defined as 10-minute peak and 15-minute off-peak headways for at least 14 hours of service operations per day. This mode may include portions of service that are fixed-guideway and non-fixed-guideway.
Commuter Bus (CB): Fixed-route bus systems that are primarily connecting outlying areas with a central city through bus service that operates with at least five miles of continuous closed-door service. This service typically operates using motorcoaches (aka over-the-road buses), and usually features peak scheduling, multiple-trip tickets, and multiple stops in outlying areas with limited stops in the central city.
Commuter Rail (CR): Short-haul rail passenger service operating in metropolitan and suburban areas, whether within or across the geographical boundaries of a state, usually characterized by reduced fare, multiple ride, and commutation tickets and by morning and evening peak period operations.
Demand-Response Service (DR): Any system of transporting individuals, includ-ing the provision of designated transportation service by public or private entities, which is not a fixed-route system. This type of service is also known as “paratransit.”
Demand-Response Taxi (DT): A special form of the demand response mode operated through taxicab providers. The mode is always purchased transportation type of service.
Deviated Fixed Route Service: Transit service that operates along a fixed align-ment or path at generally fixed times, but may deviate from the route alignment to collect or drop off passengers who have requested the deviation.
Directly Operated (DO): Transportation service provided directly by a transit agency, using their employees to supply the necessary labor to operate the revenue vehicles. This includes instances where an agency’s employees provide purchased transportation (PT) services to the agency through a contractual agreement.
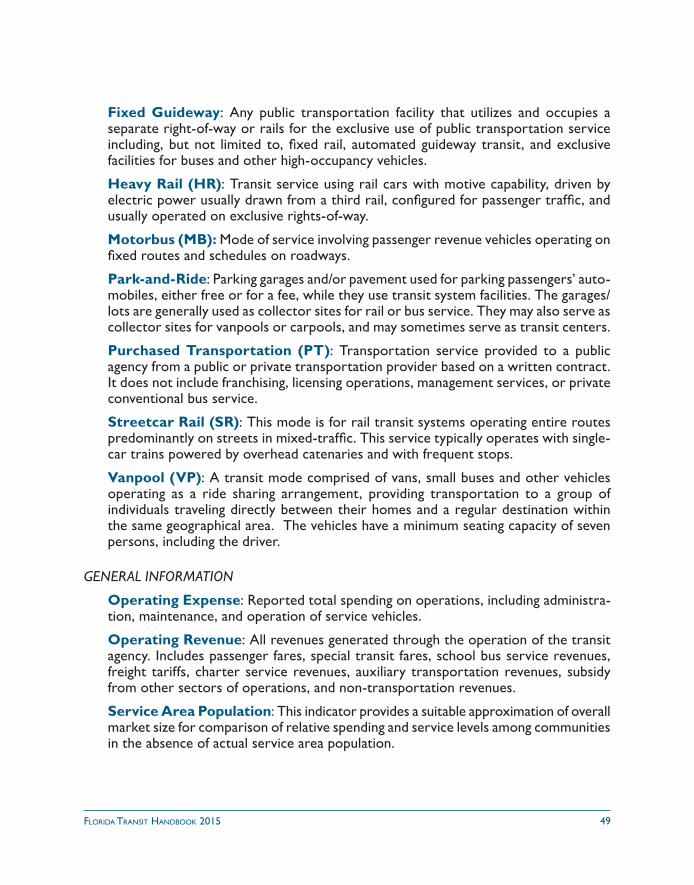
49Florida TransiT Handbook 2015
Fixed Guideway: Any public transportation facility that utilizes and occupies a separate right-of-way or rails for the exclusive use of public transportation service including, but not limited to, fixed rail, automated guideway transit, and exclusive facilities for buses and other high-occupancy vehicles.
Heavy Rail (HR): Transit service using rail cars with motive capability, driven by electric power usually drawn from a third rail, configured for passenger traffic, and usually operated on exclusive rights-of-way.
Motorbus (MB): Mode of service involving passenger revenue vehicles operating on fixed routes and schedules on roadways.
Park-and-Ride: Parking garages and/or pavement used for parking passengers’ auto-mobiles, either free or for a fee, while they use transit system facilities. The garages/lots are generally used as collector sites for rail or bus service. They may also serve as collector sites for vanpools or carpools, and may sometimes serve as transit centers.
Purchased Transportation (PT): Transportation service provided to a public agency from a public or private transportation provider based on a written contract. It does not include franchising, licensing operations, management services, or private conventional bus service.
Streetcar Rail (SR): This mode is for rail transit systems operating entire routes predominantly on streets in mixed-traffic. This service typically operates with single-car trains powered by overhead catenaries and with frequent stops.
Vanpool (VP): A transit mode comprised of vans, small buses and other vehicles operating as a ride sharing arrangement, providing transportation to a group of individuals traveling directly between their homes and a regular destination within the same geographical area. The vehicles have a minimum seating capacity of seven persons, including the driver.
GENERAL INFORMATION
Operating Expense: Reported total spending on operations, including administra-tion, maintenance, and operation of service vehicles.
Operating Revenue: All revenues generated through the operation of the transit agency. Includes passenger fares, special transit fares, school bus service revenues, freight tariffs, charter service revenues, auxiliary transportation revenues, subsidy from other sectors of operations, and non-transportation revenues.
Service Area Population: This indicator provides a suitable approximation of overall market size for comparison of relative spending and service levels among communities in the absence of actual service area population.
50 Florida department oF transportation
Service Area Population Density: Represents persons per square mile based on the service area population and service area size reported in the National Transit Database.
SERVICE SUPPLIED
Peak Vehicles: This refers to the number of vehicles operated in maximum (peak) service. It represents the number of revenue vehicles operated to meet the annual maximum service requirement, i.e., the revenue vehicle count during the peak hours of the peak days/weeks of the peak season (typically the rush period). Vehicles oper-ated in maximum service exclude atypical days or one-time special events.
Route Miles: Number of directional route miles as reported in NTD data; defined as the mileage that service operates in each direction over routes traveled by public transportation vehicles in revenue service.
Total Annual Revenue Hours: Total hours of operation by revenue service vehicles in active revenue service.
Total Annual Revenue Miles: Number of annual miles of vehicle operation while in active service (available to pick up revenue passengers). This number is smaller than vehicle miles because of the exclusion of deadhead miles such as vehicle miles from the garage to the start of service, vehicle miles from the end of service to the garage, driver training, and other miscellaneous miles that are not considered to be in direct revenue service.
Total Revenue Vehicles: Number of vehicles available for use by the transit agency to meet the annual maximum service requirement. Total revenue vehicles includes spares, out-of-service vehicles, and vehicles in or awaiting maintenance, but excludes vehicles awaiting sale and emergency contingency vehicles.
SERVICE USAGE
Annual Passenger Miles: Number of annual passenger trips multiplied by the system’s average trip length (in miles). This number provides a measure of the total number of passenger miles of transportation service consumed, and is typically derived based on sampling.
Annual Passenger Trips: Annual number of passenger boardings on the transit vehicles. A trip is counted each time a passenger boards a transit vehicle. Thus, if a passenger has to transfer between buses to reach a destination, he/she is counted as making two passenger trips.
Average Trip Length: Annual passenger miles divided by annual passenger trips.
51Florida TransiT Handbook 2015
QUALITY OF SERVICEAverage Headway: This measure is computed in minutes for the system as a whole using the following data: directional route miles, revenue miles, revenue hours, and the number of vehicles operated in maximum service (peak vehicles). The route mileage figure is divided by the system’s calculated average speed (revenue miles per revenue hour) to produce an estimate of the time it would take, in hours, to traverse all the system’s total route miles. Finally, this time figure is divided by the system’s number of peak vehicles (then multiplied by 60 to convert time in hours to minutes) to determine the number of minutes it takes for a vehicle to complete its portion of the total route miles one time.Weekday Span of Service: The number of hours that transit service is provided on a representative weekday in the operation of the transit agency. This indicator is de-termined by computing the number of hours between the values reported in the NTD for average weekday time service begins and time service ends. For transit agencies with more than one mode, the system total span of service takes into account the hours of operation for all modes and reports the span of hours that any transit service is provided on a typical weekday.
COST EFFICIENCY
Operating Expense Per Revenue Hour: Operating expense divided by total annual revenue hours; a key comparative measure which factors out vehicle speed. This is often important because vehicle speed is strongly influenced by local traffic conditions.
Operating Expense Per Revenue Mile: Operating expense divided by total an-nual revenue miles; a measure of the efficiency with which service is delivered and is another key comparative indicator.
Operating Revenue Per Operating Expense: Ratio of revenue generated through operation of the transit agency with respect to total operating expense.
Passenger Trips Per Employee FTE: Ratio of total passenger trips to system total full-time equivalents. Another measure of overall labor productivity.
Total Employee FTEs: Total number of payroll employees of the transit agency in terms of full-time equivalents (FTEs). All employees classified as capital are not included in this Handbook.
COST EFFECTIVENESS
Average Fare: Passenger fare revenues divided by the total number of passenger trips.
Farebox Recovery Ratio: Ratio of passenger fares to total operating expenses; an indicator of the share of total operating costs that is covered by the passengers’ fares.
52 Florida department oF transportation
Operating Expense Per Capita: Annual operating budget divided by the service area population; a measure of the resource commitment to transit by the community.
Operating Expense Per Passenger Mile: Operating expense divided by the number of passenger miles; takes into account the impact of trip length on performance be-cause some operators provide lengthy trips while others provide mainly shorter trips.
Operating Expense Per Passenger Trip: Operating expenditures divided by the total annual ridership; a measure of the efficiency of transporting riders; one of the key indicators of comparative performance of transit properties since it reflects both the efficiency with which service is delivered and the market demands for the service.
Passenger Fare Revenue: Revenue generated annually from carrying passengers in regularly scheduled service.
SERVICE EFFECTIVENESS
Passenger Trips Per Capita: Average number of transit boardings per person per year. This number is larger in areas where public transportation is emphasized and in areas where there are more transit dependent persons, and is a measure of the extent to which the public utilizes transit in a given service area.
Passenger Trips Per Revenue Hour: The ratio of annual passenger trips to total annual revenue hours of operation; reports on the effectiveness of the service because hours are generally a better representation of the resources consumed in providing service.
Passenger Trips Per Revenue Mile: The ratio of annual passenger trips to total annual revenue miles of service; a key indicator of service effectiveness that is influ-enced by the levels of demand and the supply of service provided.
Revenue Miles Between Failures: Number of total annual revenue miles divided by the number of revenue vehicle system failures; an indicator of the average frequency of delays because of a problem with the equipment.
Revenue Miles Between Safety Incidents: Number of total annual revenue miles divided by the number of incidents; reports the average interval, in miles, between incidents.
Revenue Vehicle System Failures: Total number of failures that occur during revenue service, deadheading, and layovers. A failure is classified as the breakdown of either a major or minor element of the revenue vehicle’s mechanical system. Fail-ures are tabulated regardless of whether they result in a vehicle completing or not completing its trip.